")
Back to Journals » Clinical Epidemiology » Volume 10
Combining statistical techniques to predict postsurgical risk of 1-year mortality for patients with colon cancer
Authors Arostegui I, Gonzalez N , Fernández-de-Larrea N, Lázaro-Aramburu S, Baré M , Redondo M , Sarasqueta C, Garcia-Gutierrez S, Quintana JM
Received 18 July 2017
Accepted for publication 14 January 2018
Published 6 March 2018 Volume 2018:10 Pages 235—251
DOI https://doi.org/10.2147/CLEP.S146729
Checked for plagiarism Yes
Review by Single anonymous peer review
Peer reviewer comments 3
Editor who approved publication: Professor Henrik Sørensen
Inmaculada Arostegui,1–3 Nerea Gonzalez,2,4 Nerea Fernández-de-Larrea,5,6 Santiago Lázaro-Aramburu,7 Marisa Baré,2,8 Maximino Redondo,2,9 Cristina Sarasqueta,2,10 Susana Garcia-Gutierrez,2,4 José M Quintana2,4
On behalf of the REDISSEC CARESS-CCR Group2
1Department of Applied Mathematics, Statistics and Operations Research, University of the Basque Country UPV/EHU, Leioa, Bizkaia, Spain; 2Health Services Research on Chronic Patients Network (REDISSEC), Galdakao, Bizkaia, Spain; 3Basque Center for Applied Mathematics – BCAM, Bilbao, Bizkaia, Spain; 4Research Unit, Galdakao-Usansolo Hospital, Galdakao, Bizkaia, Spain; 5Environmental and Cancer Epidemiology Unit, National Center of Epidemiology, Instituto de Salud Carlos III, Madrid, Spain; 6Consortium for Biomedical Research in Epidemiology and Public Health (CIBERESP), Madrid, Spain; 7General Surgery Service, Galdakao-Usansolo Hospital, Galdakao, Bizkaia, Spain; 8Clinical Epidemiology and Cancer Screening Unit, Parc Taulí Sabadell-Hospital Universitari, UAB, Sabadell, Barcelona, Spain; 9Research Unit, Costa del Sol Hospital, Marbella, Malaga, Spain; 10Research Unit, Donostia Hospital, Donostia-San Sebastián, Gipuzkoa, Spain
Introduction: Colorectal cancer is one of the most frequently diagnosed malignancies and a common cause of cancer-related mortality. The aim of this study was to develop and validate a clinical predictive model for 1-year mortality among patients with colon cancer who survive for at least 30 days after surgery.
Methods: Patients diagnosed with colon cancer who had surgery for the first time and who survived 30 days after the surgery were selected prospectively. The outcome was mortality within 1 year. Random forest, genetic algorithms and classification and regression trees were combined in order to identify the variables and partition points that optimally classify patients by risk of mortality. The resulting decision tree was categorized into four risk categories. Split-sample and bootstrap validation were performed. ClinicalTrials.gov Identifier: NCT02488161.
Results: A total of 1945 patients were enrolled in the study. The variables identified as the main predictors of 1-year mortality were presence of residual tumor, American Society of Anesthesiologists Physical Status Classification System risk score, pathologic tumor staging, Charlson Comorbidity Index, intraoperative complications, adjuvant chemotherapy and recurrence of tumor. The model was internally validated; area under the receiver operating characteristic curve (AUC) was 0.896 in the derivation sample and 0.835 in the validation sample. Risk categorization leads to AUC values of 0.875 and 0.832 in the derivation and validation samples, respectively. Optimal cut-off point of estimated risk had a sensitivity of 0.889 and a specificity of 0.758.
Conclusion: The decision tree was a simple, interpretable, valid and accurate prediction rule of 1-year mortality among colon cancer patients who survived for at least 30 days after surgery.
Keywords: clinical prediction rules, colonic neoplasms, colorectal surgery, tree-based methods, prediction model, 1-year-mortality
Introduction
Currently, colorectal cancer is among the most common cancers1–3 with high incidence and mortality rates, despite improved rates of survival during the last few years.4 Previous scientific work broadly investigated diagnosis and treatment of colorectal cancer. However, work on the development of clinical prediction rules for patients with colorectal cancer in order to predict adverse events and mortality after surgical treatment needs to be properly validated and translated into easy-to-use tools for clinical practice.5–6 Ideally, studies should investigate robust clinical outcomes such as mortality and/or complications, in order to identify related factors, as well as patient-reported outcomes, such as health-related quality of life, and their determinants of change.7–9 Some predictive scores of short-term evolution outcomes, 30 days, have been developed, such as the various versions of the Physiological and Operative Severity Score for the enUmeration of Mortality and morbidity (POSSUM) scoring,10–12 although most of them are not properly validated in most settings. Furthermore, to our knowledge, there are no validated prediction models for medium-term follow-up, 1–2 years, on colorectal cancer outcomes, a period during which the majority of adverse outcomes after treatment and/or surgery are observed.13
Classification and regression trees (CART) have been used extensively as an alternative to the classic linear and additive prediction models. Results are presented in tree form of a decision rule with a hierarchical sequential structure that can be easily understood and applied in clinical practice. CART models have been used previously for prognosis classification in cancer and other diseases.14–16 Various studies have performed CART analysis in colorectal cancer patients to search for biomarkers highly predictive of response to therapy in order to select patients for treatment17–19 or to select genes for phenotypic classification.20,21 However, to our knowledge, there are no validated prediction models, including CART models, for medium-term mortality among patients with colon cancer. Other relatively modern modeling techniques, known as machine learning methods, which include random forests (RF), neural networks (NN) or support vector machine (SVM), have received increasing attention in medical research as they may potentially provide more accurate results.22–24 In 2011, Manilich et al developed a prognostic model for colorectal cancer including several outcomes to investigate competing-risk survival for 5 years using RF methods; this model was based on multiple clinical factors with the objective of evaluating the accuracy of patient staging solely based on the tumor–node–metastasis (TNM).25 Moreover, several machine learning techniques have been ensembled into a single algorithm that provides a prediction rule with the best mean-squared error (MSE).26 However, the use of these complex classifying techniques is not common in clinical research for predictive purposes.
The Results and Health Services Research in Colorectal Cancer (CCR-CARESS) project is a prospective cohort study that recruited incident colorectal cancer patients receiving surgical treatment and that followed them during 5 years. It is, therefore, an appropriate study design for developing clinical predictive rules. In line with one of the main purposes of the CCR-CARESS project, the aim of this study was to combine RF and CART modeling approaches in order to develop and validate a clinical predictive model for 1-year mortality among patients with colon cancer who survive for at least 30 days after receipt of a surgical intervention. The objectives were first to identify clinical factors that most accurately predict 1-year mortality among this group of patients post surgery, and second, to develop and validate a clinically applicable predictive rule.
Methods
Study design
The CCR-CARESS prospective observational cohort is a multicenter study of patients diagnosed with colorectal cancer who had undergone surgical interventions that were carried out between June 2010 and December 2012 in 22 public hospitals in Spain. Those hospitals represented nine provinces from six regions in Spain and all of them operate under the Spanish National Health Service. Patients have a follow-up period of up to 5 years after surgery.
The design and purposes of the study have been thoroughly described previously.27
Patient selection
Patients were eligible for the CCR-CARESS study if they were diagnosed with colon cancer (up to 15 cm above the anal margin) or rectum cancer (between the anal margin and 15 cm above it), and received curative or palliative surgery for the first time. Patients were identified from the surgical waiting lists of each hospital and were invited to participate during a clinical visit or by letter. Colorectal cancer diagnosis was mainly based on anatomopathologic diagnosis after a biopsy by colonoscopy.28–30 Exclusion criteria were in situ cancer, inoperable tumor, severe mental or physical pathologies that could prevent patients from responding to the questionnaires, and terminal illness. Patients were informed of the study and they were asked to sign an informed consent before participating. In the current study, patients were considered if they had a diagnosis of colon cancer and survived 30 days after the intervention.
Variable collection
Qualified and trained reviewers collected clinical data from the medical records, employing data collection forms and an instructions manual to ensure consistency among hospitals and reviewers. Baseline data collected upon hospital admission included sociodemographic, clinical (including onset of symptoms, habits, personal and family background, comorbidities, diagnostic tests and preintervention treatments), preoperative (including laboratory parameters, tumor markers, diagnostic tests and preintervention clinical staging) and pathology information; and outpatient anesthesia information on the surgical intervention (American Society of Anesthesiologists Physical Status Classification System [ASA] risk score31). Data related to the hospital admission included information on the surgical intervention, anatomic pathology data, length of stay, presence or degree of complications and data related to the remaining days of admission (including the presence of complications, the need for reintervention or death). The Charlson Comorbidity Index (CCI) was calculated based on general comorbidities.32 TNM classification was assessed according to the 7th Edition of the American Joint Committee on Cancer,29 and focused on the preintervention/clinical TNM (cTNM) and the histopathologic report for TNM (histopathologic tumor–node–metastasis [pTNM]). For the final-stage grouping, pTNM was grouped into three categories: 0–II, III and IV. The surgical margins were examined for the presence of residual tumor, which was described using the residual tumor (R) classification: R0 was microscopically free proximal and distal margins; R1 was microscopically involved margins and R2 was macroscopic residual cancer.29 Lymph node ratio (LNR), defined as the ratio of tumor-infiltrated lymph nodes to total number of resected lymph nodes, was calculated and categorized as suggested by Rosenberg et al.33 Data on laboratory results, diagnostic tests, presence of complications, readmissions, reintervention or death were collected up to 30 days after surgery. Finally, information was collected throughout the year, regarding the need for radiation therapy and/or chemotherapy, including treatment schedule, cycles, complications and supportive care required; laboratory results and diagnostic tests performed; presence of complications; tumor recurrence; readmission or reintervention and death.
Further information, which includes the full study protocol, has been published elsewhere.27
Outcome measures
The primary outcome was mortality within 1 year of surgery among those who survived for at least 30 days after surgery. Vital status was established by reviewing medical records and examining the hospital databases and National Death Index. Deaths were considered confirmed if the name, gender, and date of birth and identity card on the record matched those of the participant.
Statistical analysis
The study sample was randomly divided into a derivation sample (50%) and a validation sample (50%). Both samples were described using means and SDs for continuous variables and as frequencies and percentages for categorical variables. Differences between the derivation and the validation samples were tested for the distribution of each variable using the two-sample Student’s t-test for continuous variables and the chi-square test for categorical variables; nonparametric methods were used when necessary. The same methods were used to test univariate associations between predictors and 1-year mortality.
When a missing observation was observed for any recorded symptom or complication, it was assumed to be asymptomatic or that no complication occurred. When pTNM was fully unobserved, it was replaced by the analogous cTNM. Any other unrecorded or unobserved value was considered as a missing value. Frequency and percentage of missing values were reported for each variable.
Various tree-based methods were used in order to identify the variables and partition points that optimally classified patients by risk of mortality. First, the best predictors were selected using RF methods for the whole sample; 1000 trees were used in the RF model. Importance for each variable in the model was measured as the mean decreases in accuracy (error rate) and in node impurity (Gini Index).34 In addition, categorization of continuous variables or new encoding of categorical variables was controlled during the modeling phase in order to avoid the overimportance of categorical variables that could occur in tree-based models.34 Therefore, as to optimally categorize continuous predictors, such as hemoglobin or hematocrit levels, cut-off points were selected using genetic algorithms.35 The final decision tree based on a simple recursive partitioning algorithm was created in the derivation sample to identify 1-year mortality risk factors with the highest discriminative power, including the predictors identified by the RF as most important. To internally validate the risk of 1-year mortality derived from the decision tree, we used bootstrap resampling with N=2000 repetitions and estimated 95% confidence interval (CI).36 We report the median of these 2000 repetitions as the parameter estimate and the 2.5 and 97.5 percentiles as the 95% CI. Validation sample was solely used for evaluating the performance of the final tree derived. The MSE was calculated in the validation sample in order to evaluate the magnitude of the differences between the observed and predicted probabilities of mortality.
To make the tree more user friendly, we simplified the resulting algorithm into a manageable number of risk classes based mainly on the estimated risk of 1-year mortality. We applied the risk classification derived from the derivation sample to the validation sample. Model discrimination of the tree and the risk categories was assessed by the area under the receiver operating characteristic (ROC) curve (AUC) and estimated risk dichotomization for optimal sensitivity–specificity combination.37 The Cochran–Armitage trending statistic was performed to assess whether classification provided by the tree could differentiate low-risk patients from high-risk patients in a fashion of graded response based on the level of risk present.
Multiple logistic regression (LR) was also fitted to data in the derivation sample. The same covariates that were previously selected by the recursive partitioning algorithm were included in the LR model. Firth’s penalized maximum likelihood estimation was used when necessary to reduce bias in the parameter estimates when data separation occurred because of the small number of events.38,39 The linear predictor function obtained from the derivation sample was applied to the validation sample. Categorization of the predicted risk of mortality was also performed for the LR model using the same criteria as before. Model discrimination of the LR model was evaluated in the same way as we did for the decision tree. Comparison of the discrimination ability between the decision tree and the LR model was performed using a bootstrap test with N=2000 repetitions to compare AUCs obtained from two ROC curves.40,41
Effects were considered statistically significant at a=0.05. Statistical analyses were performed using SAS for Windows© version 9.1 and R version 3.4.
Ethics approval and consent to participate
Patients were informed of the CCR-CARESS study objectives, invited to voluntarily participate and were included in the study sequentially. All of them signed a written informed consent to participate in the study. The Institutional Review Boards of the participating hospitals approved this project. In particular, the Clinical Research Ethics Committee of the Basque Country (CEIC-E), the Clinical Research Ethics Committee of the Hospital Galdakao-Usansolo, the Clinical Research Ethics Committee of the Hospital Txagorritxu, the Clinical Research Ethics Committee of the Área Sanitaria de Gipuzkoa, the Clinical Research Ethics Committee of the Hospital Basurto, the Clinical Research Ethics Committee of the Hospital Universitario La Paz, the Clinical Research Ethics Committee of the Hospital Universitario Fundación Alcorcón, the Clinical Research Ethics Committee of the Hospital Clínico San Carlos, the Regional Committee of Clinical Trials of Andalucía (Sevilla), the Clinical Research Ethics Committee of the Agencia Sanitaria Costa del Sol, the Clinical Research Ethics Committee of the Parc Taulí Sabadell-University Hospital, the Clinical Research Ethics Committee of the Hospital del Mar and the Clinical Research Ethics Committee Fundació Unio Catalana d’Hospitals approved the study.
Results
A total of 1945 patients were enrolled in the study: 981 (50%) and 964 (50%) were randomized to the derivation and the validation samples, respectively. Differences between the two samples were not statistically significant (P>0.05), except for surgical complications up to 30 days after surgery (P=0.049). Table S1 shows these results in more detail.
Figure 1 shows the importance scores for the top 30 predictors used in the RF model for 1-year mortality. Association between predictors and 1-year mortality is shown using univariate analysis in the derivation sample (Table 1). Significant variables from univariate analysis and the top 30 predictors provided by the RF model were included in the splitting process for building the classification tree using CART modeling in order to investigate 1-year mortality (Figure 2). Variables selected using the CART model were the presence of residual tumor (R0, R1 vs R2), ASA risk score categorized into two groups (I–III vs IV), pTNM, CCI, intraoperative complications, chemotherapy treatment after surgery and tumor recurrence during the 1-year period. The mortality rate was <5% in all those patients with residual tumors classified as R0 or R1, ASA below IV, no intraoperative complications and pTNM less than or equal to III, with the exception of those in a pTNM III stage without adjuvant chemotherapy. Generally, mortality rates were >10% among patients with residual tumors classified as R0 or R1 and patients with an ASA risk score of IV, with intraoperative complications or with pTNM between III or IV. Among patients with residual tumors classified as R2, mortality rates were >35%. MSE of the classification tree in the validation sample was 0.0026.
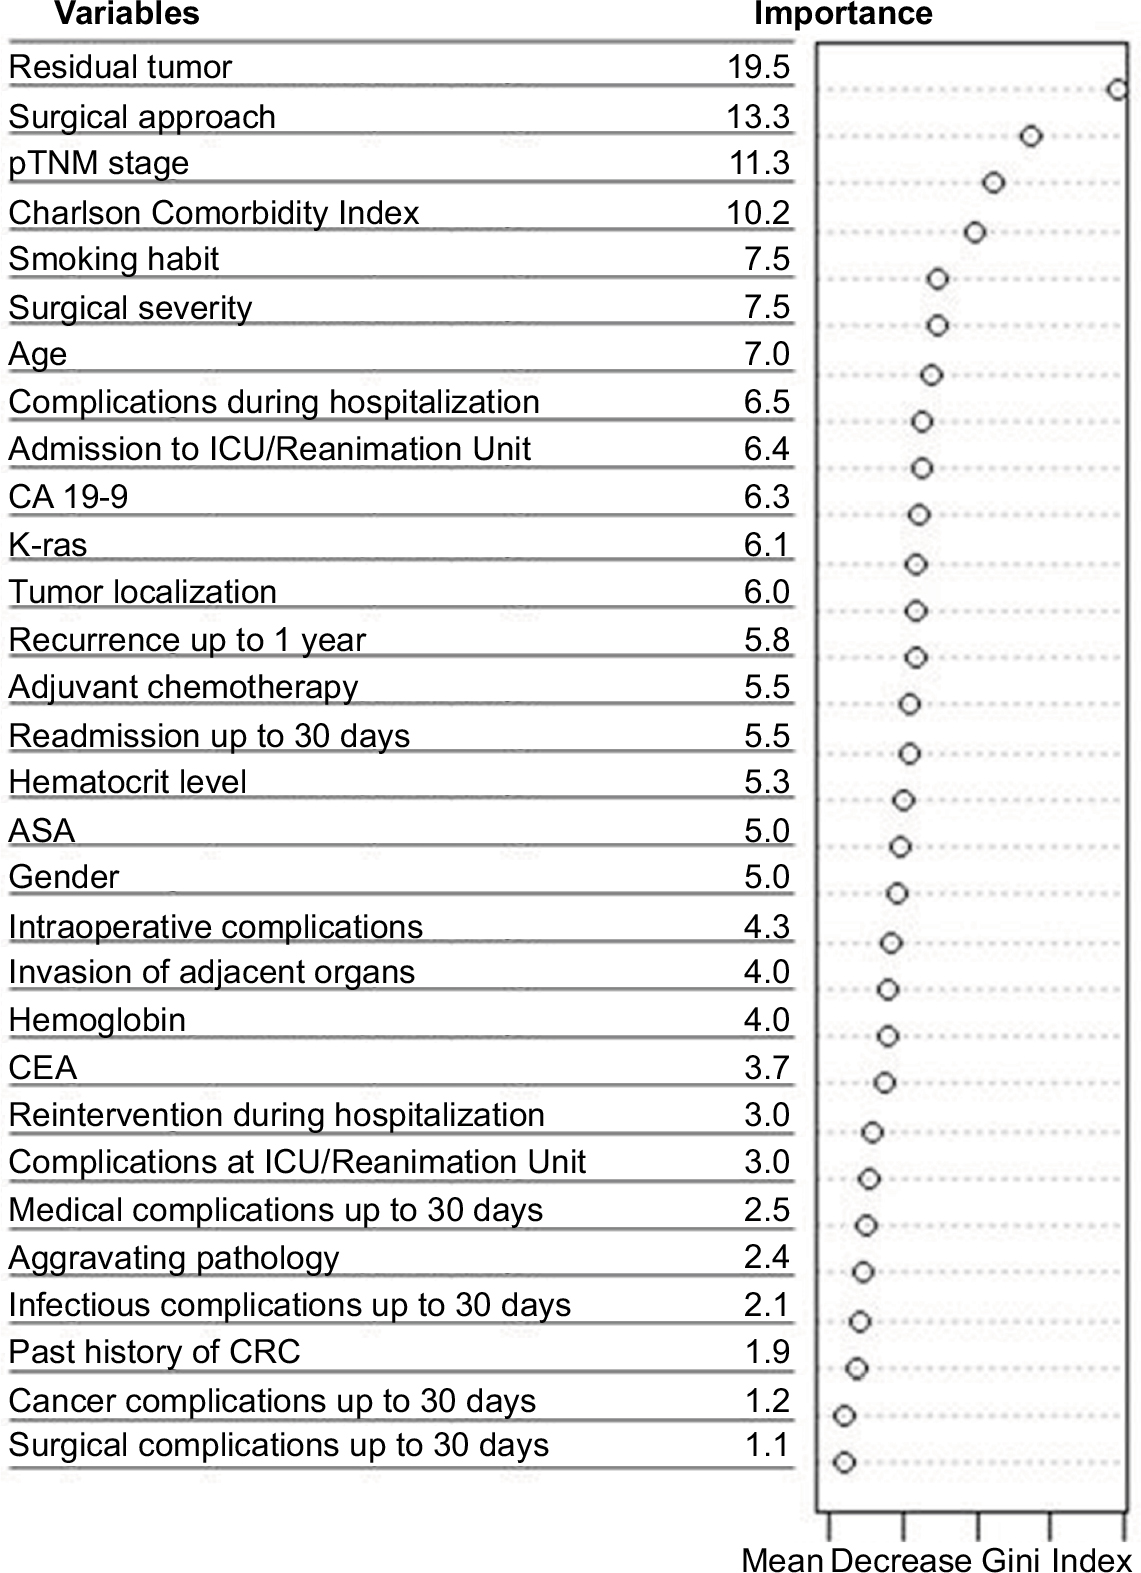 | Figure 1 Variable importance for the top 30 predictors of 1-year mortality selected by the random forest. Abbreviations: ASA, American Society of Anesthesiologists; CA, carbohydrate antigen; CEA, carcinoembryonic antigen; CRC, colon or rectum cancer; ICU, intensive care unit; pTNM, histopathologic tumor–node–metastasis. |
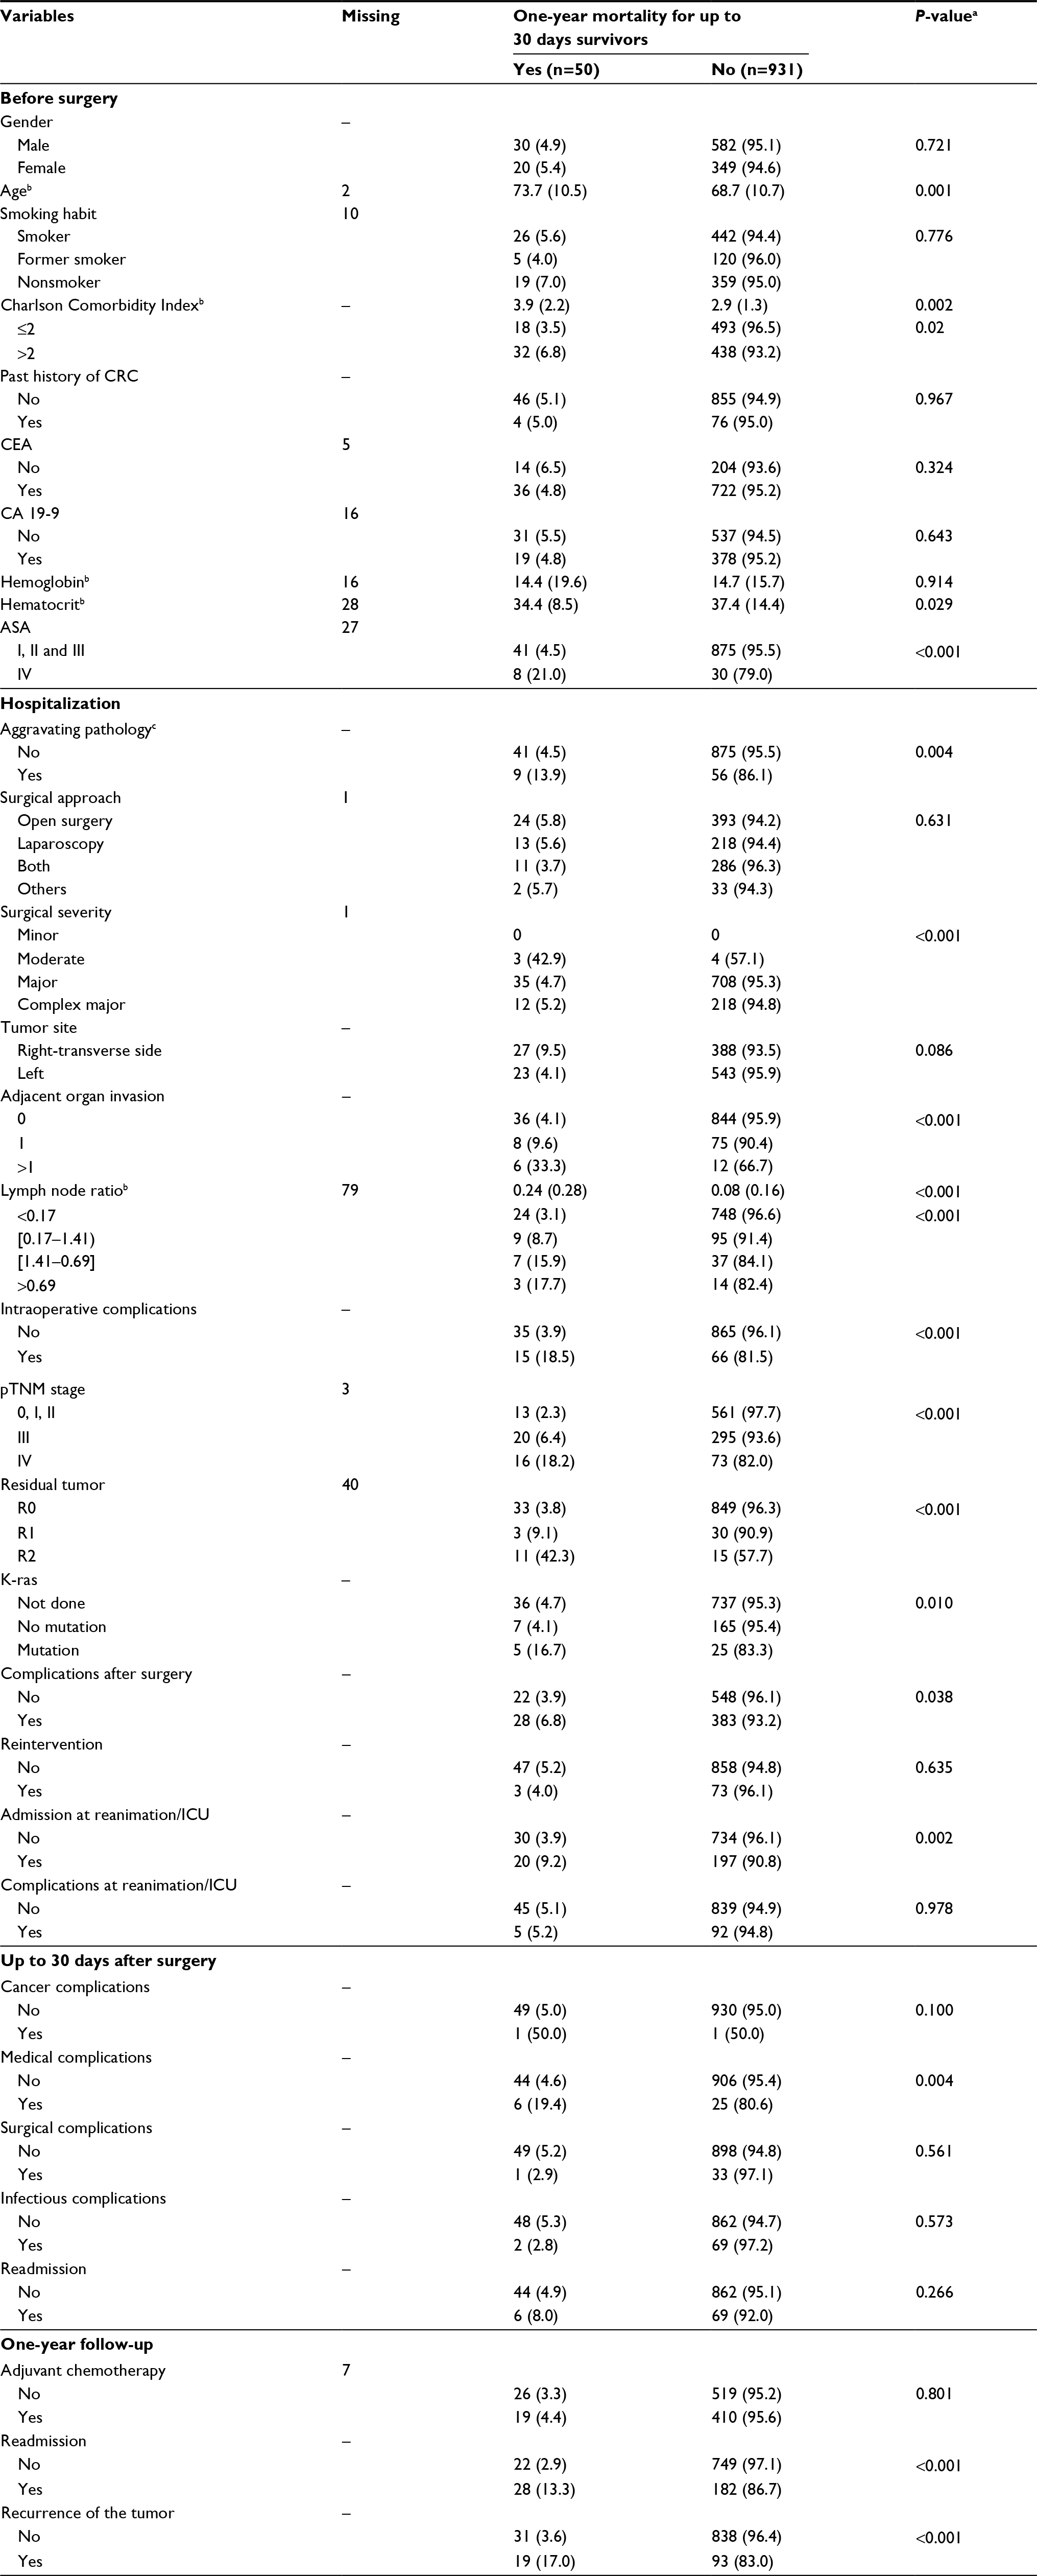 | Table 1 Univariate relation of explanatory variables and 1-year mortality in the derivation sample is shown Notes: Frequency and percentage are shown for all categorical variables. aResult provided by the Student’s t-test for continuous variables and the chi-square test for categorical variables, nonparametric methods were used when necessary. bMean and SD are shown for continuous variables. cAggravating pathology is defined as having one of the following diagnoses: occlusion, perforation, fistula, abscess, bleeding and diffuse location peritonitis. Abbreviations: ASA, American Society of Anesthesiologists; CA, carbohydrate antigen; CEA, carcinoembryonic antigen; CRC, colon or rectum cancer; ICU, intensive care unit; pTNM, histopathologic tumor–node–metastasis. |
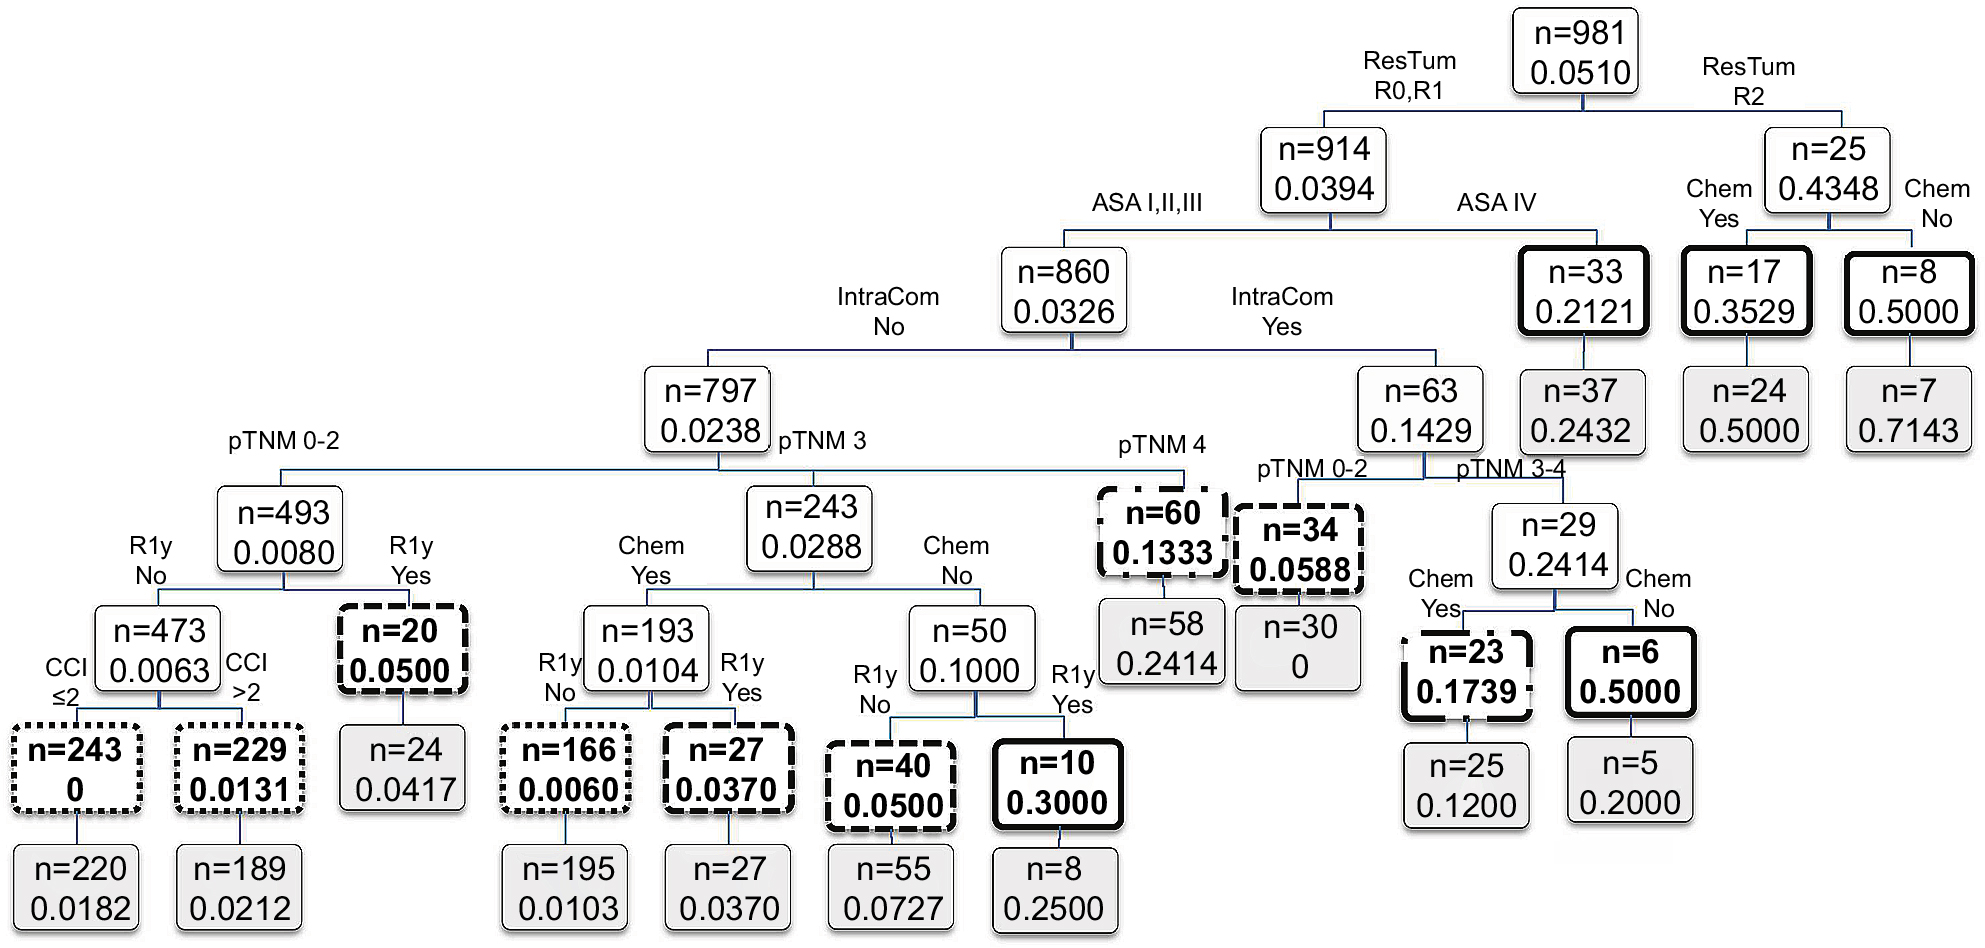 | Figure 2 Results of the CART analysis for 1-year mortality in the derivation sample. Notes: Each branch shows the classification variable and each node shows the number of subjects and the estimated probability of 1-year mortality on that node. Final nodes are in bold using different line types for stratified risk groups: low (dotted), medium (dashed), high (dotted dash) and very high (solid). Application to the validation sample is shown below each node in light gray-colored boxes. Abbreviations: ASA, American Society of Anesthesiologists; CART, classification and regression trees; CCI, Charlson Comorbidity Index; Chem, adjuvant chemotherapy; IntraCom, intraoperative complications; pTNM, histopathologic tumor–node–metastasis; R1y, recurrence of the tumor; ResTum, residual tumor. |
The ROC curve of predicted 1-year mortality for the CART in the derivation and validation samples is shown in Figure 3 along with the cut-off point of estimated risk dichotomization for the optimal sensitivity–specificity combination for the derivation sample. The AUC of the CART model was 0.896 (95% CI: 0.856, 0.936) and 0.835 (95% CI: 0.776, 0.895) in the derivation and validation samples, respectively. More detailed results on the internal bootstrap validation of the CART analysis are shown in the additional material (Figure S1; Table S2).
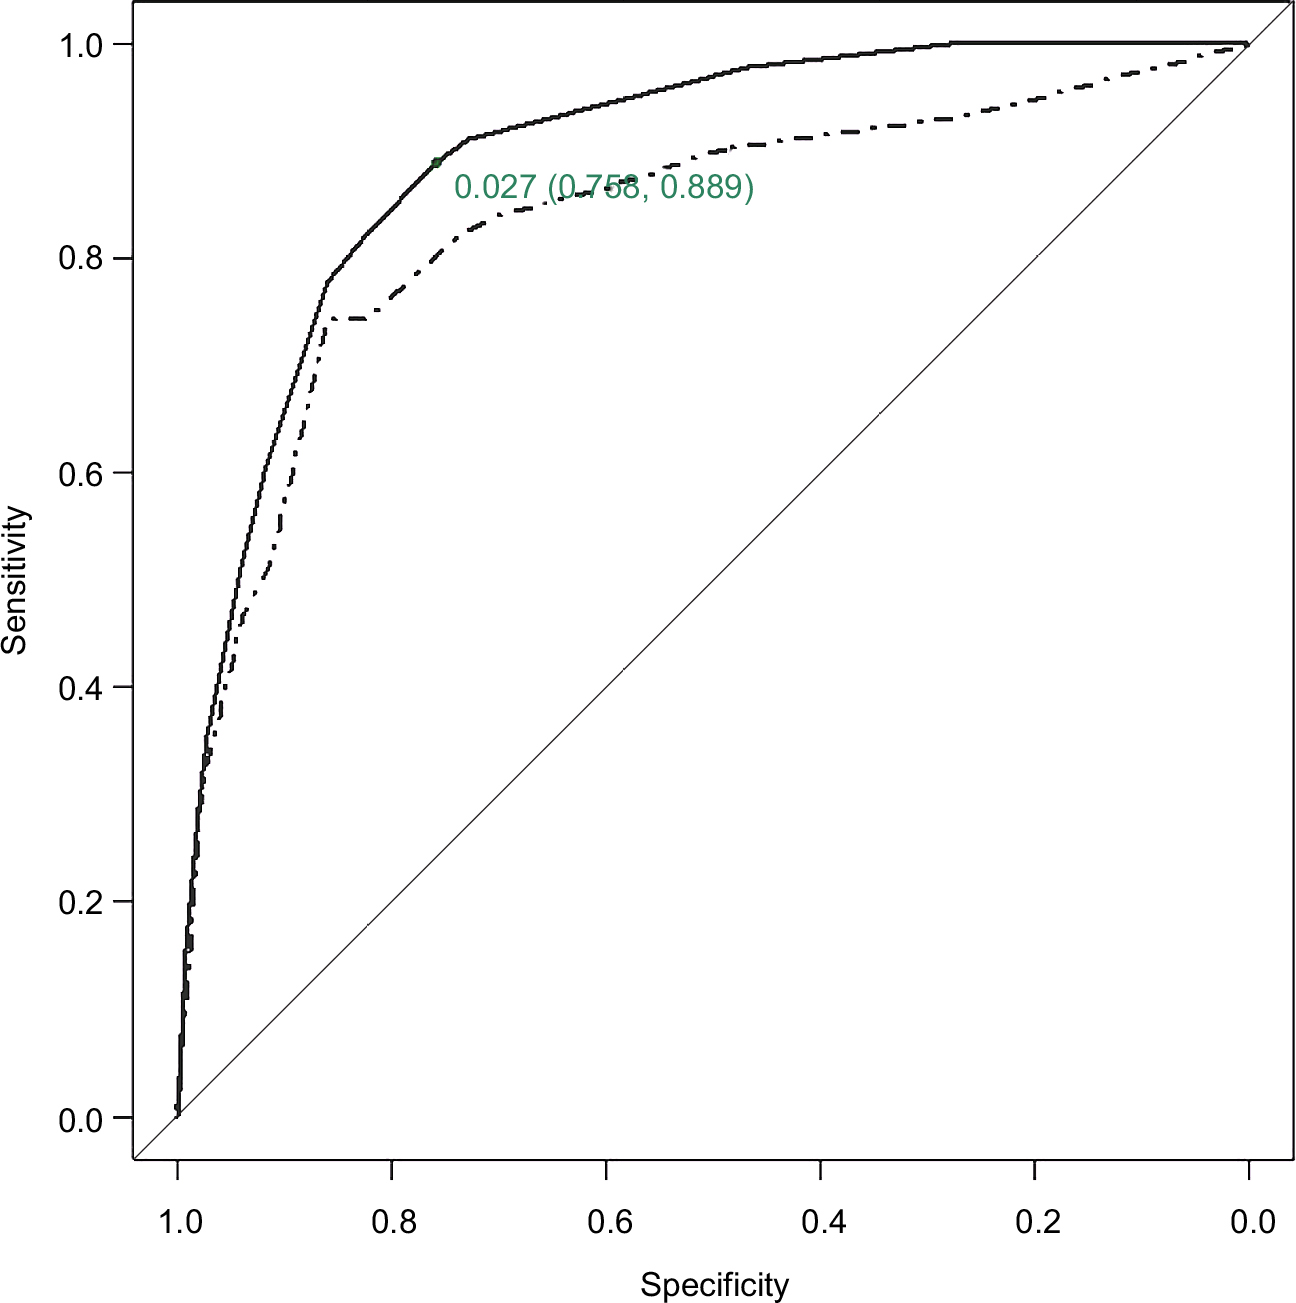 | Figure 3 ROC curve for predicted 1-year mortality by the CART analyses. Notes: Solid line applies for derivation sample and dashed line for validation sample. AUC=0.896 and 95% CI is (0.856, 0.936) for derivation sample and AUC=0.835 and 95% CI is (0.776, 0.895) for validation sample. The cut-off point of estimated 1-year mortality risk dichotomization for optimal sensitivity–specificity combination for derivation sample is shown with the corresponding specificity and sensitivity values. Abbreviations: AUC, area under the receiver operating characteristic curve; CART, classification and regression trees; CI, confidence interval; ROC, receiver operating characteristic. |
The LR model provided AUC estimates of 0.883 (95% CI: 0.834, 0.933) and 0.817 (95% CI: 0.752, 0.882) in the derivation and validation samples, respectively. Difference between AUCs obtained from the CART and the LR was not statistically significant in any of the two subsamples.
Using data from the derivation sample, the CART created four 1-year mortality risk classes: low (<0.03), medium (≥0.03 and <0.1), high (≥0.1 and <0.2) and very high (≥0.2). The AUC provided by the stratified risk categories in the derivation sample was 0.875 (95% CI: 0.823, 0.926). This risk classification was validated in the validation sample with AUC=0.832 (95% CI: 0.777, 0.888) (Table 2). The Cochran–Armitage test showed a statistically significant trend in both samples (P<0.0001). The cut-off point for dichotomization of estimated mortality risk investigating the optimal sensitivity–specificity combination in the derivation sample was achieved at point 0.03, leading to a sensitivity of 0.889 and a specificity of 0.758 for risk of mortality at 1 year.
 | Table 2 Distribution of the subjects depending on the estimated risk of 1-year mortality Notes: Estimated mortality rate (P) was categorized and classified as mortality risk as follows: low (P<0.03), medium (0.03≤P<0.1), high (0.1≤P<0.2) and very high (P≥0.2). Dashed horizontal line shows the cutoff point for dichotomization of estimated 1-year mortality risk looking for optimal sensitivity–specificity combination in the derivation sample, leading to a sensitivity of 0.889 and a specificity of 0.758. Abbreviation: AUC, area under the receiver operating characteristic curve. |
Risk of mortality predicted by the LR model was also categorized, using the same criteria as that for the CART. The AUCs for the stratified risk classification obtained from the LR model were 0.869 (95% CI: 0.809, 0.929) in the derivation sample and 0.817 (95% CI: 0.757, 0.878) in the validation sample. Comparison between the AUCs obtained with the stratified risk categories from the CART and the LR model provided no statistically significant differences.
Discussion
In the current study, this combination of different statistical techniques has enabled us to obtain a simple and easy-to-use decision tree with obtainable variables that are routinely used in daily clinical practice. The tree was obtained from a large prospective cohort of patients who underwent surgery for colon cancer and were followed for 1-year post surgery. The presence of residual tumors (based on R classification) was the first variable detected using the tree that was associated with mortality within 1 year for patients with colon cancer who survived for at least 30 days after surgery. The following branches included the ASA risk score, intraoperative complications, pTNM stage, adjuvant chemotherapy, recurrence of the tumor in 1 year and CCI score.
As regards the comparison of our results with other results reported in the literature, there are other studies that conclude that the presence of residual tumor after surgery could be interpreted as a surrogate of the severity of the disease, as well as an indicator of surgery effectiveness.42 Other predictors identified of 1-year mortality were related to the general condition of patient before surgery, such as ASA and comorbidities (based on the CCI), or directly related to the severity of the disease as determined using the pTNM stage. Comorbidities, in conjunction with age, have been previously reported to have an impact on mortality,13,43,44 as well as the ASA score.25,45 Previous studies have determined that the severity of the colon cancer, as measured by the TNM stage, lymph node status, number of lymph nodes positive for tumor, or depth of primary tumor penetration, is a predictor of 1-year mortality.46 With regard to adjuvant chemotherapy, several tree nodes showed that it was a predictor of 1-year mortality; this same finding has been demonstrated in other studies.47 Finally, variables related to the condition of the patient during and after surgery, such as intraoperative complications and recurrence of the tumor in 1 year, are also present in the tree and have been previously identified as predictors in other studies.42,48
Tree-based methods, such as RF and CART, are advantageous compared to linear and additive models, such as regression models. Tree-based methods do not require parametric specification of the relationship between the predictors and the outcome, whereas regression methods do require. It basically means that while regression models are fitted based on an equation that defines how in theory the predictors and the outcome are related, tree-based models do not assume any predefined relationship between the variables. Thanks to this feature of tree-based models, these allow for the natural incorporation of complex interactions and relationships between covariates, aside from what is already known, and various competing and inter-related variables can be explored simultaneously. Generally, importance of predictors in a univariate regression framework and in a tree-based framework could differ considerably, as occurs in our study, probably due to the interaction effects. The final tree showed, for instance, an interaction effect between adjuvant chemotherapy and pTNM stage, with significant splits depending on adjuvant chemotherapy for pTNM stage III when there were not intraoperative complications and for pTNM stages III and IV in the presence of intraoperative complications, for patients with ASA I, II or III and residual tumor classified as R0 or R1, while the same split was not present for other combinations of the same variables. Moreover, in practice, the main advantage of tree-based methods is that the result provided in a decision tree form can be easily interpreted by clinicians and researchers and somehow mimics the clinical practice in the decision-making process. RF is based on an algorithm that uses bootstrapping in conjunction with CART, thereby randomly selecting individuals and predictors from the original sample in an iterative way, and protecting the model from overfitting. RF is computationally more efficient than other tree-based methods, such as simple CART models, and it is robust to a noisy response.34 RF allowed us to select the most important variables to be incorporated into the tree. Encoding of categorical variables is an important issue during the modeling phase in tree-based methods because categorical variables could artificially gain importance over the continuous variables.34 Prevention against favoring categorical predictors with a large number of categories over continuous or dichotomous predictors was incorporated in the modeling phase. In addition, categorization of some predictors, for easy interpretation of the results, has been optimized by selecting the optimal number and location of cut-off points using a prediction framework based on genetic algorithms, recently proposed in the literature.35
One recent publication concludes that modern machine learning techniques, such as RF, SVM and NN, showed instability and a high optimism even with >200 events per variable.49 They may need over 10 times as many events per variable to achieve a stable validated AUC and a small optimism as the more conventional modeling techniques such as LR and CART. These findings imply that such modern techniques should only be used in medical prediction problems if very large data sets are available. When we performed RF with the whole sample (n=1945), high classification error was obtained. However, we relied on results obtained from RF with regard to variable importance, and this information was retained to significantly reduce the number of predictors to be incorporated in order to develop a classification tree using CART. In practice, when we look for higher accuracy, most of the models become more complex and their interpretation becomes more difficult. This is always the tradeoff we make when prediction accuracy is the primary goal.34 However, the simple result obtained from the CART method provided an interpretable tree. Moreover, the split-sample validation and the bootstrap internal validation of the CART showed stability of the results even with <5% of events in the sample. Our final tree was developed with 50 events and 7 variables, which is low compared to the usual recommendation for binary outcomes of 10 events per predictor.50,51 Hence, the results of combining more complex techniques, such as RF and genetic algorithms, with more simple approaches, such as CART, yield to not only accurate but also valid and stable results, as it is shown in our final decision tree. When results from the CART and the LR approaches were compared in terms of discrimination ability, we have observed that difference between both methods was not statistically significant. Whereas in terms of interpretability, results in a tree form are easier to interpret by clinical researchers than the formulae provided by regression approaches.
Other studies have used decision trees based on recursive partitioning techniques to predict prognosis in patients with cancer.15,52 Radespiel-Tröger et al studied factors that predict recurrence of colon cancer after resection using tree-based methods.53 Moreover, Manilich et al developed an RF prognostic model using clinical and histopathologic factors to predict 5-year survival of patients with colorectal cancer.25 Their study was, however, limited to patients with a complete radical resection of tumor with negative radial or distal margins (R0). Investigators concluded that the main predictor was LNR, which was not a significant predictor in our study. However, other significant variables in that study, such as ASA score, tumor stage and treatment, were similar to those in our study.
The present study was a large prospective cohort study, including 22 hospitals; therefore, there was variability in individuals and clinical practice, and the number of variables that were collected as potential predictors of 1-year mortality was high. The whole sample included a 4% of patients who underwent palliative resection, who were likely to be different on prognostic to those undergoing curative resection. However, results excluding these patients were very similar to the presented results in terms of prediction (correlation coefficient r=0.989). In contrast, from our point of view, one value of the present study is to reflect the type of patients that appear in hospitals in real life, preserving a certain natural heterogeneity. Furthermore, the predictive tree was developed following the current structured guidelines for the development of prediction models, as detailed in the Transparent Reporting of a multivariable prediction model for Individual Prognosis Or Diagnosis (TRIPOD) statement.54 In combining statistical techniques, we gained validity, accuracy and interpretability. Although the predictors identified were similar to those in other studies, the simple result obtained using the CART method provided an interpretable tree with a good predictive ability. Moreover, the internal validation of the CART carried out by the bootstrap analysis showed stability of the results, even with a low rate of events in the sample. Therefore, this prediction rule may help clinicians to easily classify patients by prognosis and guide them in the follow-up process. Other authors have combined multiple machine learning techniques to develop a prediction algorithm with the best MSE.26 However, the result provided by that single algorithm is not as intuitive and easy to use as our classification tree and therefore, its use in clinical practice is more limited than the prediction rule we have proposed.
Given that some of the variables included in the tree, such as pTNM, intraoperative complications or adjuvant chemotherapy, are only available in the postoperative period, main application of this tool would be in the planning of the clinical follow-up. Patients with a higher risk of 1-year mortality could benefit from a more intensive surveillance of their oncologic disease and potential comorbidities and complications, while those with a low risk could be scheduled to a less intensive follow-up. For more severe patients (ASA IV or residual tumor 2), our CART provides information about the chances of survival, though the sample size is small. Patients with residual tumor 2 seem to have low survival expectancy, though chemotherapy increases the likelihood of surviving. Among the milder cases (stage 0–II), the result of the surgery (residual tumor) marked an important difference having a high probability of surviving 1 year in those with residual tumor 0. In cases with stage III, it helps us to see how depending on the result of the surgery as opting for chemotherapy can significantly increase the survival chances. This may be able to guide the oncologist about the use of more or less aggressive treatments. This tree could also be used by health care workers to provide patients with more precise prognostic information than that based solely on the TNM staging system. Taking into account the high negative predictive value of the model, it could be especially useful to inform patients classified in the low-risk groups, for which a high 1-year survival probability could be reassuring.
Limitations
The limitations that are common in prospective multicenter studies with 1 year of follow-up were also present in our study. One of these limitations is related to losses to follow-up, which obviously could be a source of bias, and in our study 6% of the patients in the sample were not classified by the tree because of missing values in some of the predictive variables included in the model. Another limitation we must mention is that no inter- or intraobserver reliability studies were performed to assess the quality of the data collection process. Nevertheless, reviewers were trained at each site and were provided with a common manual for the data collection. Our study included a few tumor biomarkers, as carcinoembryonic antigen levels and CA 19.9. Prediction ability of the models could be increased in the future by including genetic and biologic prognostic markers. The influence of variables, such as differences in the health care provided to the patients or adherence to treatment, was not well documented and consequently they were not included in the model; all of these factors could have an influence on mortality. Interpretation of the stratified risk results in terms of screening must be cautious because low positive predictive values (15%–17%) could be due to the low mortality rate. This kind of data is likely to be clustered within hospitals and it was not taken into consideration in the analysis. A mixed-effects approach for RF and CART could probably improve the results. This kind of methodology has been proposed in the literature for continuous outcomes,55 although as far as our knowledge, it has not been developed yet for dichotomous responses. However, the clustering of patients into hospitals has been checked in a generalized mixed-effects model framework, showing a negligible effect in this particular data. Finally, an important limitation of CART is that including higher-order interactions without considering the main effects could lead to spurious relations between predictors, leading to an overestimation of the effect of some predictors. However, the use of combined split-sample and bootstrap validation techniques provided internally validated results to minimize this drawback. Further research is needed in order to validate this decision tree using other samples and populations. Such studies will provide guidance as the models’ applicability in clinical practice and/or what modifications might be needed in order to improve its validity.
Conclusion
This clinical prediction rule, which combined RF and CART, was a simple, interpretable, valid and accurate prediction model for 1-year mortality among colon cancer patients who survived for at least 30 days after surgery. This decision tool could be provided to clinicians in order to assist in clinical decision-making processes.
Acknowledgments
We are grateful for the support of the 22 participating hospitals, as well as the clinicians and staff members of the various services, research, quality units and medical records sections of these hospitals. We also gratefully acknowledge the patients who participated in the study. We would like to thank Editage (www.editage.com) for English language editing. We also wish to thank the anonymous referees for providing comments, which led to substantial improvement of the article. Financial support for this study was provided, in part, by grants from the Instituto de Salud Carlos III (PS09/00314, PS09/00910, PS09/00746, PS09/00805, PI09/90460, PI09/90490, PI09/90453, PI09/90441, PI09/90397 and the thematic network REDISSEC – Red de Investigación en Servicios de Salud en Enfermedades Crónicas), co-funded by European Regional Development Fund/European Social Fund (ERDF/ESF “Investing in your future”); the Research Committee of the Hospital Galdakao; the Department of Health and the Department of Education, Language Policy and Culture from the Basque Government (2010111098, IT620-13 and BERC 2014-2017 program); the Spanish Ministry of Economy and Competitiveness MINECO and FEDER (MTM2013-40941-P, MTM2016-74931-P and BCAM Severo Ochoa excellence accreditation SEV-2013-0323). The funding agreement ensured the authors’ independence in designing the study, interpreting the data, writing and publishing the report.
The REDISSEC CARESS-CCR (Results and Health Services Research in Colorectal Cancer) Group: Eduardo Briones Pérez de la Blanca,1 Antonio Escobar Martínez,2 Francisco Rivas Ruiz,3 Maria M. Morales-Suárez-Varela,4 Juan Antonio Blasco Amaro,5 Isabel del Cura González,6 Amaia Bilbao González,2 Iratxe Lafuente Guerrero,7 Urko Aguirre Larracoechea,7 Miren Orive Calzada,7 Josune Martin Corral,7 Ane Antón-Ladislao,7 Núria Torà,8 Marina Pont,8 María Purificación Martínez del Prado,9 Alberto Loizate Totorikaguena,10 Ignacio Zabalza Estévez,11 José Errasti Alustiza,12 Antonio Z Gimeno García,13 Mercè Comas Serrano,14 Jose María Enríquez Navascues,15 Carlos Placer Galán,15 Amaia Perales,16 Iñaki Urkidi Valmaña,17 Jose María Erro Azkárate,18 Enrique Cormenzana Lizarribar,19 Adelaida Lacasta Muñoa,20 Pep Piera Pibernat,20 Elena Campano Cuevas,21 Ana Isabel Sotelo Gómez,22 Segundo Gómez-Abril,23 F. Medina-Cano,24 Julia Alcaide,25 Arturo Del Rey-Moreno,26 Manuel Jesús Alcántara,27 Rafael Campo,28 Alex Casalots,29 Carles Pericay,30 Maria José Gil,31 Miquel Pera,31 Pablo Collera,32 Josep Alfons Espinàs,33 Mercedes Martínez,34 Mireia Espallargues,35 Caridad Almazán,36 Paula Dujovne Lindenbaum,37 José María Fernández-Cebrián,37 Rocío Anula Fernández,38 Julio Ángel Mayol Martínez,38 Ramón Cantero Cid,39 Héctor Guadalajara Labajo,40 María Heras Garceau,40 Damián García Olmo,40 Mariel Morey Montalvo41
1Unidad de Epidemiología, Distrito Sevilla, Servicio Andaluz de Salud, 2Unidad de Investigación, Hospital Universitario Basurto, Bilbao/REDISSEC, 3Servicio de Epidemiología, Hospital Costa del Sol, Málaga – REDISSEC, 4Department of Preventive Medicine and Public Health, University of Valencia/CIBER de Epidemiología y Salud Pública (CIBERESP)/CSISP-FISABIO, Valencia, 5Unidad de Evaluación de Tecnologías Sanitarias, Agencia Laín Entralgo, Madrid, 6Unidad Apoyo a Docencia-Investigación, Dirección Técnica Docencia e Investigación, Gerencia Adjunta Planificación, Gerencia de Atención Primaria de la Consejería de Sanidad de la Comunidad Autónoma de Madrid, 7Unidad de Investigación. Hospital Galdakao-Usansolo, Galdakao-Bizkaia/Red de Investigación en Servicios de Salud en Enfermedades Crónicas – REDISSEC, 8Epidemiologia Clínica y Cribado de Cancer, Corporació Sanitaria Parc Taulí, Sabadell/REDISSEC, 9Servicio de Oncología, Hospital Universitario Basurto, Bilbao, 10Servicio de Cirugía General, Hospital Universitario Basurto, Bilbao, 11Servicio de Anatomía Patológica, Hospital Galdakao-Usansolo, Galdakao, 12Servicio de Cirugía General, Hospital Universitario Araba, Vitoria-Gasteiz, 13Servicio de Gastroenterología, Hospital Universitario de Canarias, La Laguna, 14IMAS-Hospital del Mar, Barcelona, 15Servicio de Cirugía General y Digestiva, Hospital Universitario Donostia, 16Instituto de Investigación Sanitaria Biodonostia, Donostia, 17Servicio de Cirugía General y Digestiva, Hospital de Mendaro, 18Servicio de Cirugía General y Digestiva, Hospital de Zumárraga, 19Servicio de Cirugía General y Digestiva, Hospital del Bidasoa, 20Servicio de Oncología Médica, Hospital Universitario Donostia, 21Instituto de Biomedicina de Sevilla, Hospital Universitario Virgen del Rocío, Sevilla, 22Servicio de Cirugía, Hospital Universitario Virgen de Valme, Sevilla, 23Servicio de Cirugía General y Aparato Digestivo, Hospital Dr. Pesset, Valencia, 24Servicio de Cirugía General y Aparato Digestivo, Agencia Sanitaria Costa del Sol, Marbella, 25Servicio de Oncología Médica, Agencia Sanitaria Costa del Sol, Marbella, 26Servicio de Cirugía, Hospital de Antequera, 27Coloproctology Unit, General and Digestive Surgery Service, Corporació Sanitaria Parc Taulí, Sabadell, 28Digestive Diseases Department, Corporació Sanitaria Parc Taulí, Sabadell, 29Pathology Service, Corporació Sanitaria Parc Taulí, Sabadell, 30Medical Oncology Department, Corporació Sanitaria Parc Taulí, Sabadell/REDISSEC, 31General and Digestive Surgery Service, Parc de Salut Mar, Barcelona, 32General and Digestive Surgery Service, Althaia-Xarxa Assistencial Universitaria, Manresa, 33Catalonian Cancer Strategy Unit, Department of Health, Institut Català d’Oncología, 34Medical Oncology Department, Institut Català d’Oncología, 35Agency for Health Quality and Assessment of Catalonia – AquAS-and REDISSEC, 36Agency for Health Quality and Assessment of Catalonia – AQuAS, CIBER de Epidemiología y Salud Pública – CIBERESP, 37Servicio de Cirugía General y del Aparato Digestivo, Hospital Universitario Fundación Alcorcón, Madrid, 38Servicio de Cirugía General y Aparato Digestivo, Hospital Universitario Clínico San Carlos, Madrid, 39Servicio Cirugía General y del Aparato Digestivo, Hospital Universitario Infanta Sofía, San Sebastián de los Reyes, Madrid, 40Servicio de Cirugía General y del Aparato Digestivo, Hospital Universitario La Paz, Madrid, 41REDISSEC, Unidad de Apoyo a la Investigación, Gerencia Asistencial de Atención Primaria de la Comunidad de Madrid, Madrid.
Author contributions
All the authors participated in the conception and design of the study and drafting the article. All the authors also read and revised the manuscript, provided feedback and approved the final version. Moreover, NG, MB, MR, NFdL, CS, SGG and JMQ contributed to the acquisition and assembly of data; IA extracted and analyzed the data; IA, SLA, NFdL, SGG and JMQ participated in interpretation of results; and IA, MB, MR, NFdL, CS, SGG and JMQ participated in obtaining funding support. The REDISSEC-CARESS/CCR Group participated in the design, provision of patients, collection and assembly of data. Finally, all the authors showed agreement to be accountable for all aspects of the work in ensuring that questions related to the accuracy or integrity of any part of the work were appropriately investigated and resolved.
Disclosure
The content and views of this publication are those of the authors and do not necessarily reflect the official position of their affiliation centers. The authors report no conflicts of interest in this work.
References
Center MM, Jemal A, Smith RA, Ward E. Worldwide variations in colorectal cancer. CA Cancer J Clin. 2009;59(6):366–378. | ||
Gellad ZF, Provenzale D. Colorectal cancer: national and international perspective on the burden of disease and public health impact. Gastroenterology. 2010;138(6):2177–2190. | ||
Edwards BK, Ward E, Kohler BA, et al. Annual report to the nation on the status of cancer, 1975–2006, featuring colorectal cancer trends and impact of interventions (risk factors, screening, and treatment) to reduce future rates. Cancer. 2010;116(3):544–573. | ||
Marley AR, Nan H. Epidemiology of colorectal cancer. Int J Mol Epidemiol Genet. 2016;7(3):105–114. | ||
Adams ST, Leveson SH. Clinical prediction rules. BMJ. 2012;344: d8312. | ||
Richardson S, Khan S, McCullagh L, Kline M, Mann D, McGinn T. Healthcare provider perceptions of clinical prediction rules. BMJ Open. 2015;5(9):e008461. | ||
Montazeri A. Quality of life data as prognostic indicators of survival in cancer patients: an overview of the literature from 1982 to 2008. Health Qual Life Outcomes. 2009;7:102. | ||
McNair AG, Whistance RN, Forsythe RO, et al; CONSENSUS-CRC (Core Outcomes and iNformation SEts iN SUrgical Studies – ColoRectal Cancer) Working Group. Synthesis and summary of patient-reported outcome measures to inform the development of a core outcome set in colorectal cancer surgery. Colorectal Dis. 2015;17(11):O217–O219. | ||
Jorgensen ML, Young JM, Solomon MJ. Optimal delivery of colorectal cancer follow-up care: improving patient outcomes. Patient Relat Outcome Meas. 2015;6:127–138. | ||
Copeland GP, Jones D, Walters M. POSSUM: a scoring system for surgical audit. Br J Surg. 1991;78(3):355–360. | ||
Richards CH, Leitch FE, Horgan PG, McMillan DC. A systematic review of POSSUM and its related models as predictors of post-operative mortality and morbidity in patients undergoing surgery for colorectal cancer. J Gastrointest Surg. 2010;14(10):1511–1520. | ||
Moonesinghe SR, Mythen MG, Das P, Rowan KM, Grocott MP. Risk stratification tools for predicting morbidity and mortality in adult patients undergoing major surgery: qualitative systematic review. Anesthesiology. 2013;119(4):959–981. | ||
Jorgensen ML, Young JM, Dobbins TA, Solomon MJ. A mortality risk prediction model for older adults with lymph node-positive colon cancer. Eur J Cancer Care (Engl). 2015;24(2):179–188. | ||
Briganti A, Capitanio U, Abdollah F, et al. Assessing the risk of lymph node invasion in patients with intermediate risk prostate cancer treated with extended pelvic lymph node dissection. A novel prediction tool. Prostate. 2012;72(5):499–506. | ||
Mohammadzadeh F, Noorkojuri H, Pourhoseingholi MA, Saadat S, Baghestani AR. Predicting the probability of mortality of gastric cancer patients using decision tree. Ir J Med Sci. 2015;184(2):277–284. | ||
Langius JA, Twisk J, Kampman M, et al. Prediction model to predict critical weight loss in patients with head and neck cancer during (chemo)radiotherapy. Oral Oncol. 2016;52:91–96. | ||
Zlobec I, Steele R, Nigam N, Compton CC. A predictive model of rectal tumor response to preoperative radiotherapy using classification and regression tree methods. Clin Cancer Res. 2005;11(15):5440–5443. | ||
Aligayer H, Boyd DD, Heiss MM, Abdalla EK, Curley SA, Gallick GE. Activation of Src kinase in primary colorectal carcinoma: an indicator of poor clinical prognosis. Cancer. 2002;94(2):344–351. | ||
Goos JA, Coupé VM, van de Wiel MA, et al; DeCoDe PET Group. A prognostic classifier for patients with colorectal cancer liver metastasis, based on AURKA, PTGS2 and MMP9. Oncotarget. 2016;7(2):2123–2134. | ||
Boulesteix AL, Tutz G, Strimmer K. A CART-based approach to discover emerging patterns in microarray data. Bioinformatics. 2003;19(18):2465–2472. | ||
Arevalillo JM, Navarro H. Exploring correlations in gene expression microarray data for maximum predictive-minimum redundancy biomarker selection and classification. Comput Biol Med. 2013;43(10):1437–1443. | ||
Sheikhtaheri A, Sadoughi F, Hashemi Dehaghi Z. Developing and using expert systems and neural networks in medicine: a review on benefits and challenges. J Med Syst. 2014;38(9):110. | ||
Van der Ploeg T, Datema F, Baatenburg de Jong R, Steyerberg EW. Prediction of survival with alternative modeling techniques using pseudo values. PLoS One. 2014;9(6):e100234. | ||
Allyn J, Allou N, Augustin P, et al. A comparison of a machine learning model with EuroSCORE II in predicting mortality after elective cardiac surgery: a decision curve analysis. PLoS One. 2017;12(1):e0169772. | ||
Manilich EA, Kiran RP, Radivoyevitch T, Lavery I, Fazio VW, Remzi FH. A novel data-driven prognostic model for staging of colorectal cancer. J Am Coll Surg. 2011;213(5):579–588. | ||
Rose S. Mortality risk score prediction in an elderly population using machine learning. Am J Epidemiol. 2013;177(5):443–452. | ||
Quintana JM, Gonzalez N, Anton-Ladislao A, et al; REDISSEC-CARESS/CCR group. Colorectal cancer health services research study protocol: the CCR-CARESS observational prospective cohort project. BMC Cancer. 2016;16:435. | ||
Freund KM, Battaglia TA, Calhoun E, et al; Patient Navigation Research Program Group. National Cancer Institute Patient Navigation Research Program: methods, protocol, and measures. Cancer. 2008;113(2):3391–3399. | ||
Edge S, Byrd DR, Compton CC, Fritz AG, Greene FL, Trotti A. American Joint Committee on Cancer: AJCC Cancer Staging Manual. 7th ed. NY, USA: Springer; 2010. | ||
Lopez-Abente G, Ardanaz E, Torrella-Ramos A, Mateos A, Delgado-Sanz C, Chirlaque MD; Colorectal Cancer Working Group. Changes in colorectal cancer incidence and mortality trends in Spain. Ann Oncol. 2010;21 (Suppl 3):iii76–iii82. | ||
Owens WD, Felts JA, Spitznagel EL Jr. ASA physical status classifications: a study of consistency of ratings. Anesthesiology. 1978;49(4):239–243. | ||
Charlson ME, Pompei P, Ales KL, MacKenzie CR. A new method of classifying prognostic comorbidity in longitudinal studies: development and validation. J Chronic Dis. 1987;40(5):373–383. | ||
Rosenberg R, Friederichs J, Schuster T, et al. Prognosis of patients with colorectal cancer is associated with lymph node ratio. A single-center analysis of 3026 patients over a 25-year time period. Ann Surg. 2008;248(6):968–978. | ||
Kuhn M, Johnson K. Applied Predictive Modeling. NY, USA: Springer; 2013. | ||
Barrio I, Arostegui I, Rodríguez-Alvarez MX, Quintana JM. A new approach to categorize continuous variables in prediction models: proposal and validation. Stat Methods Med Res. 2017;26(6):2586–2602. | ||
Efron B, Tibshirani R. An Introduction to the Bootstrap. London, England: Chapman & Hall; 1993. | ||
Hosmer DW, Lemeshow S. Applied Logistic Regression. 2nd ed. NY, USA: John Wiley & Sons; 2000. | ||
Firth D. Bias reduction of maximum likelihood estimates. Biometrika. 1993;80(1):27–38. | ||
Heinze G, Schemper M. A solution to the problem of separation in logistic regression. Stat Med. 2002;21(16):2409–2419. | ||
Carpenter J, Bithell J. Bootstrap confidence intervals: when, which, what? A practical guide for medical statisticians. Stat Med. 2000;19(9):1141–1464. | ||
Robin X, Turck N, Hainard A, et al. pROC: an open-source package for R and S+ to analyze and compare ROC curves. BMC Bioinformatics. 2011;12:77. | ||
Odermatt M, Miskovic D, Flashman K, et al. Major postoperative complications following elective resection for colorectal cancer decrease long-term survival but not the time to recurrence. Colorectal Dis. 2015;17(2):141–149. | ||
Ouellette JR, Small DG, Termuhlen PM. Evaluation of Charlson-age Comorbidity Index as predictor of morbidity and mortality in patients with colorectal carcinoma. J Gastrointest Surg. 2004;8(8):1061–1067. | ||
Wu CC, Hsu TW, Chang CM, Yu CH, Lee CC. Age-adjusted Charlson comorbidity index scores as predictor of survival in colorectal cancer patients who underwent surgical resection and chemoradiation. Medicine (Baltimore). 2015;94(2):e431. | ||
Stojadinovic A, Bilchik A, Smith D, et al. Clinical decision support and individualized prediction of survival in colon cancer: Bayesian belief network model. Ann Surg Oncol. 2013;20(1):161–174. | ||
Fielding LP, Phillips RK, Fry JS, Hittinger R. Prediction of outcome after curative resection for large bowel cancer. Lancet. 1986; 2(8512):904–907. | ||
Renfro LA, Grothey A, Xue Y, et al; Adjuvant Colon Cancer Endpoints (ACCENT) Group. ACCENT-based web calculators to predict recurrence and overall survival in stage III colon cancer. J Natl Cancer Inst. 2014;106(12):dju333. | ||
van Westreenen HL, Ijpma FF, Wevers KP, Afzali H, Patijn GA. Reoperation after colorectal surgery is an independent predictor of the 1-year mortality rate. Dis Colon Rectum. 2011;54(11):1438–1442. | ||
van der Ploeg T, Austin PC, Steyerberg EW. Modern modelling techniques are data hungry: a simulation study for predicting dichotomous endpoints. BMC Med Res Methodol. 2014;14:137. | ||
Vittinghoff E, McCulloch CE. Relaxing the rule of ten events per variable in logistic and Cox regression. Am J Epidemiol. 2007;165(6):710–718. | ||
Steyerberg EW. Clinical Prediction Models: A Practical Approach to Development, Validation and Updating. NY, USA: Springer-Verlag; 2009. | ||
Brims FJ, Meniawy TM, Duffus I, et al. A novel clinical prediction model for prognosis in malignant pleural mesothelioma using decision tree analysis. J Thorac Oncol. 2016;11(4):573–582. | ||
Radespiel-Tröger M, Hohenberger W, Reingruber B. Improved prediction of recurrence after curative resection of colon carcinoma using tree-based risk stratification. Cancer. 2004;100(5):958–967. | ||
Moons KG, Altman DG, Reitsma JB, et al. Transparent reporting of a multivariable prediction model for Individual Prognosis or Diagnosis (TRIPOD): explanation and elaboration. Ann Intern Med. 2015;162(1):W1–W73. | ||
Hajjem A, Bellavance F, Larocque D. Mixed-effects random forest for clustered data. J Stat Comput Sim. 2014;84(6):1313–1328. |
Supplementary materials
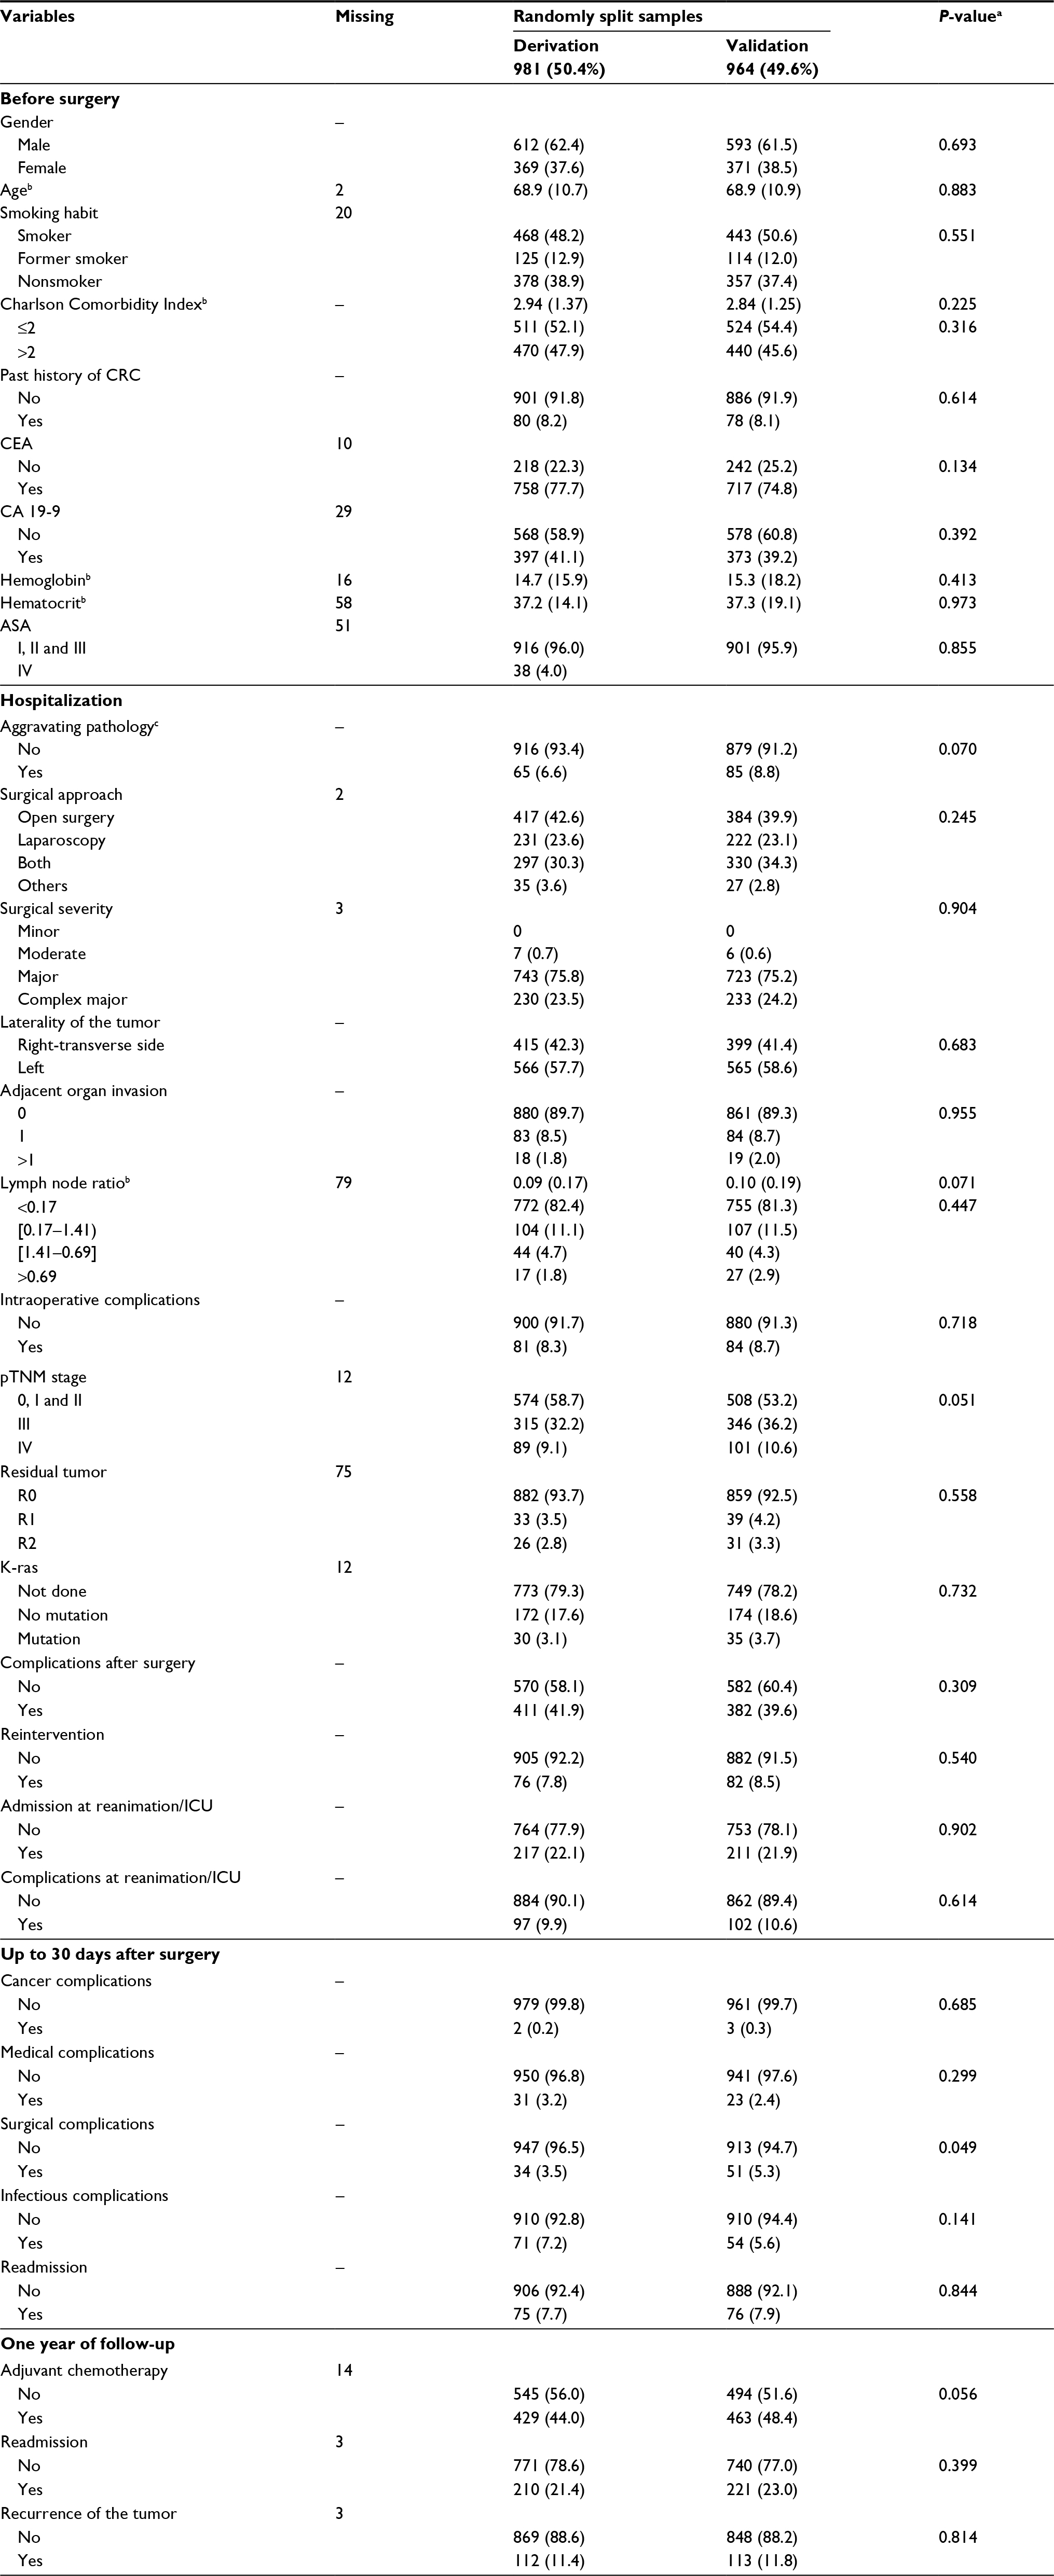 | Table S1 Descriptive statistics for explanatory variables stratified by sample (derivation vs validation) Notes: Frequency and percentage are shown for all categorical variables. aResult provided by the two-sample Student’s t-test for continuous variables and the chi-square test for categorical variables, nonparametric methods were used when necessary. bMean and SD are shown for continuous variables. cAggravating diagnosis is defined as having one of the following diagnoses: occlusion, perforation, fistula, abscess, bleeding and diffuse location peritonitis. Abbreviations: ASA, American Society of Anesthesiologists; CA, carbohydrate antigen; CEA, carcinoembryonic antigen; CRC, colon or rectum cancer; ICU, intensive care unit; pTNM, histopathologic tumor–node–metastasis. |
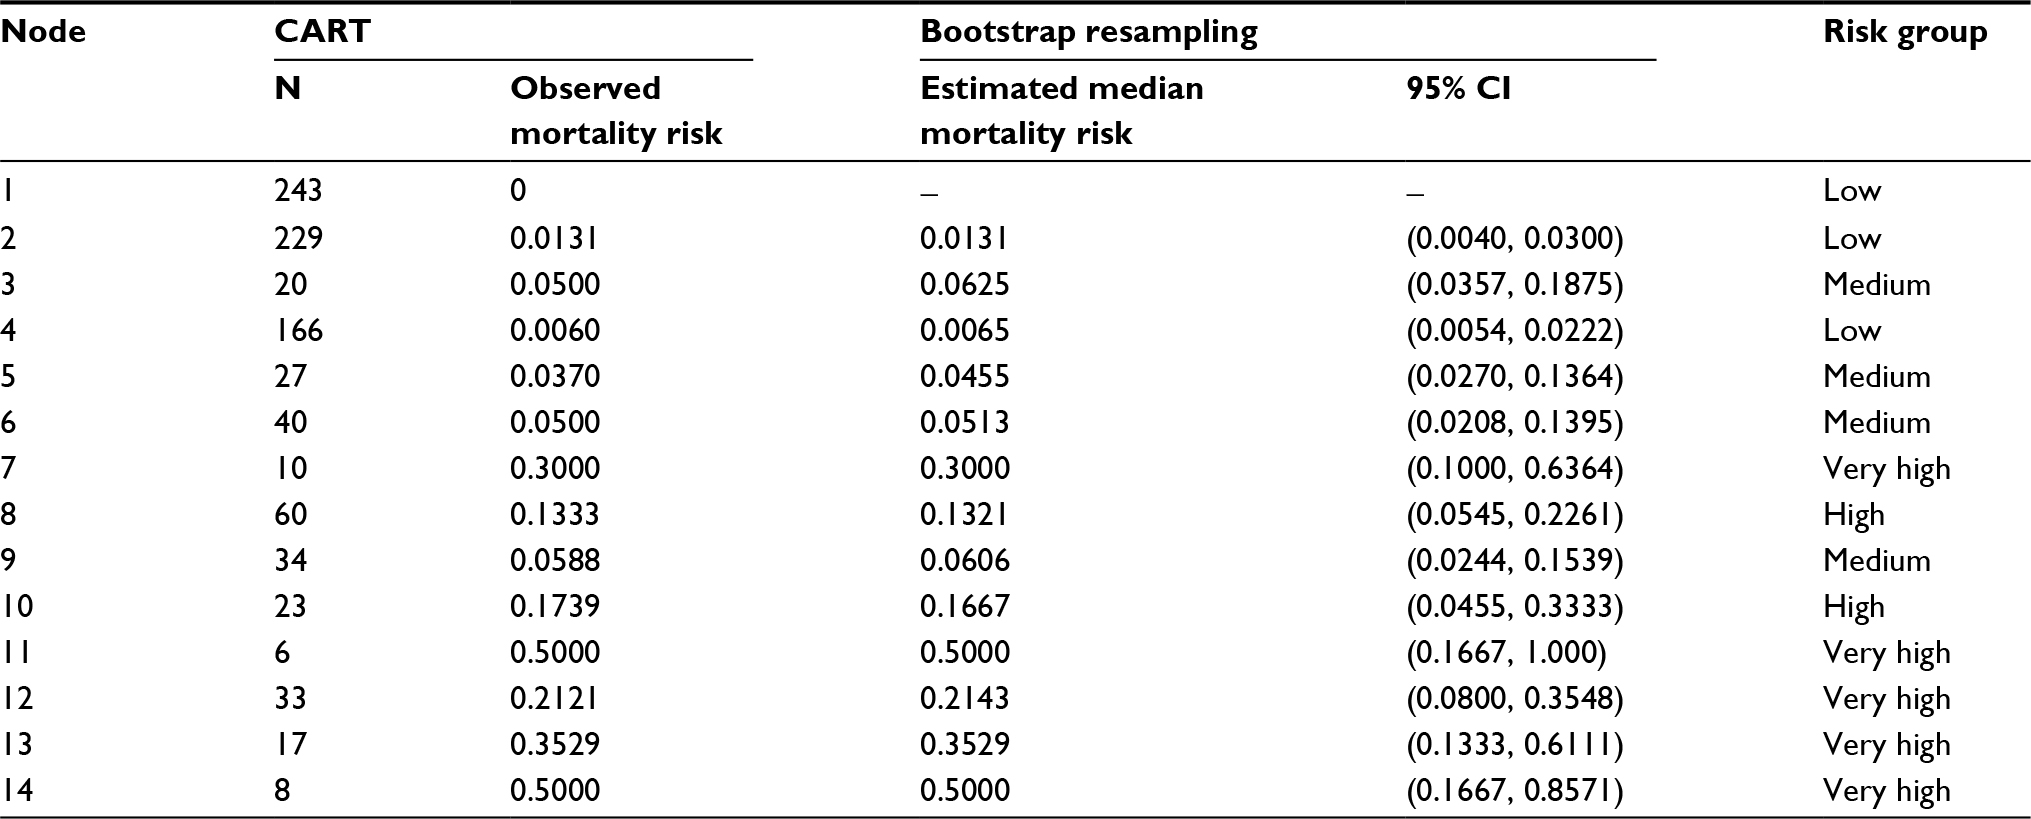 | Table S2 Internal validation of the CART analysis by bootstrap resampling (N=2000) Note: Estimated median mortality risk, 95% CIs and stratification of risk are shown by node. Abbreviations: CART, classification and regression trees; CI, confidence interval. |
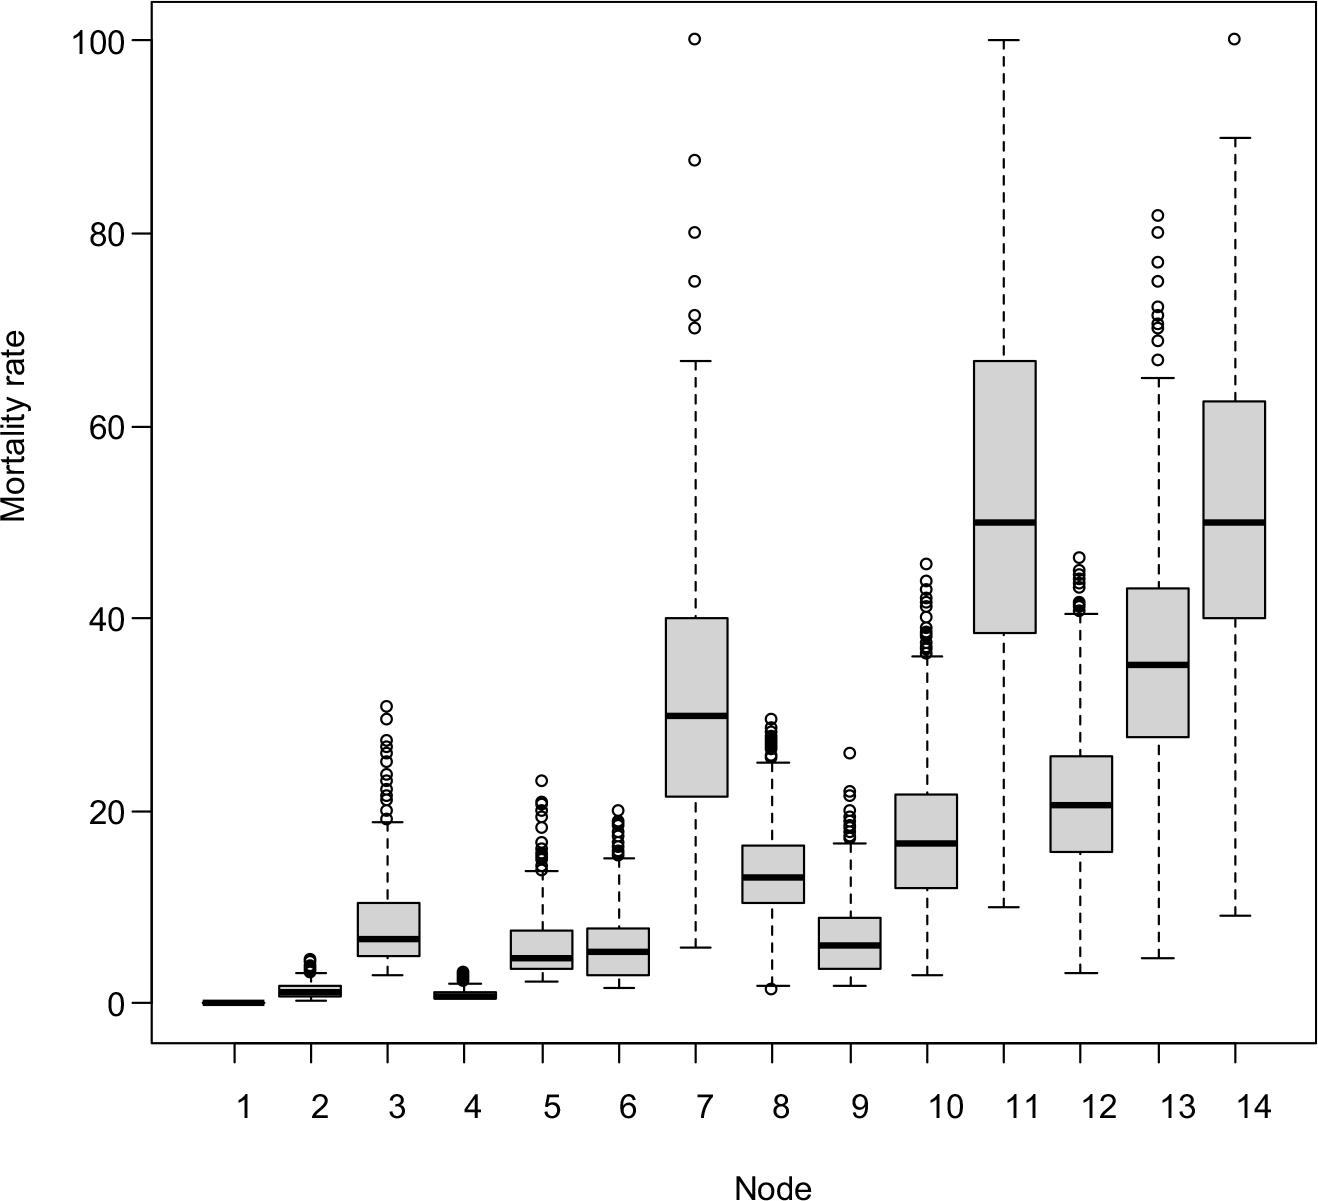 | Figure S1 Results of internal validation of the CART analysis by bootstrap resampling (N=2000). Abbreviation: CART, classification and regression trees. |
 © 2018 The Author(s). This work is published and licensed by Dove Medical Press Limited. The full terms of this license are available at https://www.dovepress.com/terms.php and incorporate the Creative Commons Attribution - Non Commercial (unported, v3.0) License.
By accessing the work you hereby accept the Terms. Non-commercial uses of the work are permitted without any further permission from Dove Medical Press Limited, provided the work is properly attributed. For permission for commercial use of this work, please see paragraphs 4.2 and 5 of our Terms.
© 2018 The Author(s). This work is published and licensed by Dove Medical Press Limited. The full terms of this license are available at https://www.dovepress.com/terms.php and incorporate the Creative Commons Attribution - Non Commercial (unported, v3.0) License.
By accessing the work you hereby accept the Terms. Non-commercial uses of the work are permitted without any further permission from Dove Medical Press Limited, provided the work is properly attributed. For permission for commercial use of this work, please see paragraphs 4.2 and 5 of our Terms.