")
Back to Journals » OncoTargets and Therapy » Volume 12
Combining data from TCGA and GEO databases and reverse transcription quantitative PCR validation to identify gene prognostic markers in lung cancer
Authors Liu X, Wang J, Chen M, Liu S, Yu X, Wen F
Received 17 August 2018
Accepted for publication 5 December 2018
Published 21 January 2019 Volume 2019:12 Pages 709—720
DOI https://doi.org/10.2147/OTT.S183944
Checked for plagiarism Yes
Review by Single anonymous peer review
Peer reviewer comments 2
Editor who approved publication: Dr Leo Jen-Liang Su
Xiao Liu,1–3,* Jun Wang,3,* Mei Chen,3 Shilan Liu,3 Xiaodan Yu,3 Fuqiang Wen1,2
1Department of Respiratory and Critical Care Medicine, West China Hospital of Sichuan University, Chengdu 610041, Sichuan, China; 2Division of Pulmonary Diseases, State Key Laboratory of Biotherapy of China, West China Hospital of Sichuan University, Chengdu 610041, Sichuan, China; 3Department of Respiratory and Critical Care Medicine, The Fifth People’s Hospital of Chengdu, Chengdu, Sichuan, China
*These authors contributed equally to this work
Background: The aim of this study was to predict and explore the possible mechanism and clinical value of genetic markers in the development of lung cancer with a combined database to screen the prognostic genes of lung cancer.
Materials and methods: Common differential genes in two gene expression chips (GSE3268 and GSE10072 datasets) were investigated by collecting and calculating from Gene Expression Omnibus and The Cancer Genome Atlas databases using R language. Five markers of gene composition (ribonucleotide reductase regulatory subunit M2 [RRM2], trophoblast glycoprotein [TPBG], transmembrane protease serine 4[TMPRFF4], chloride intracellular channel 3 [CLIC3], and WNT inhibitory factor-1 [WIF1]) were found by the stepwise Cox regression function when we further screened combinations of gene models, which were more meaningful for prognosis. By analyzing the correlation between gene markers and clinicopathological parameters of lung cancer and its effect on prognosis, the TPBG gene was selected to analyze differential expression, its possible pathways and functions were predicted using gene set enrichment analysis (GSEA), and its protein interaction network was constructed using the Search Tool for the Retrieval of Interacting Genes/Proteins (STRING) database; then, quantitative PCR and the Oncomine database were used to verify the expression differences of TPBG in lung cancer cells and tissues.
Results: The expression levels of five genetic markers were correlated with survival prognosis, and the total survival time of the patients with high expression of the genetic markers was shorter than those with low expression (P<0.001). GSEA showed that these high-expression samples enriched the gene sets of cell adhesion, cytokine receptor interaction pathway, extracellular matrix receptor pathway, adhesion pathway, skeleton protein regulation, cancer pathway and TGF-β pathway.
Conclusion: The high expression of five gene constituent markers is a poor prognostic factor in lung cancer and may serve as an effective biomarker for predicting metastasis and prognosis of patients with lung cancer.
Keywords: lung cancer, prognostic genes, GEO, TCGA, bioinformatics analysis, TPBG
Introduction
Lung cancer is the second most common cause of death (>1.3 million people worldwide every year).1,2 Many patients are diagnosed in the advanced stage, which often occurs during distant metastasis and leads to a low cure rate.3 Most patients miss the opportunity to have radical surgery and are treated with chemotherapy, radiation therapy, or targeted therapy. Currently, the low cure rate and the high recurrence rate of lung cancer remain the biggest problem. Therefore, further research on the pathogenesis, development and prognosis of lung cancer will help to discover new targets and therapeutic drugs.4 The generation and development of tumor lesions are complex processes involving several events, including abnormal expression of multiple genes that can cause abnormalities in the body, and these genes and their products interact in a way that regulates the network. In the clinical practice of lung cancer, with the wide application of genome-wide gene expression chips, a large number of molecular markers that were developed based on gene expression profiles are used for early diagnosis, molecular typing, chemotherapy sensitivity, drug resistance, prognosis monitoring, etc.5–7 Therefore, the detection of gene prognostic markers and their applications in both theory and practice are of great value and significance.
The Cancer Genome Atlas (TCGA) is a database of the most large-scale sequencing results, which provides comprehensive cancer genomic datasets on tumor staging, metastasis, survival, patient age, gender and corresponding clinical numbers for researchers. The Gene Expression Omnibus (GEO) database is a comprehensive library of gene expression in the National Center of Biotechnology Information (NCBI) which is one of the world’s largest database of gene chips.8,9 The methods of mining the GEO database mainly include the screening of differentially expressed genes, the study of molecular signaling and correlation, and the analysis of gene regulation networks.
Ribonucleotide reductase regulatory subunit M2 (RRM2) is a rate-limiting enzyme for DNA synthesis and repair related to the growth, metastasis, and drug resistance of malignant tumors. It is low- or nonexpressed in normal human cells and tissues but overexpressed in malignant tumor, such as hepatocellular carcinoma, pancreatic carcinoma, non-small-cell lung cancer (NSCLC) and colon cancer.10–12 Transmembrane protease serine 4 (TMPRSS4) gene, one of the type II transmembrane serine proteases, has protease activity, which has been shown to enhance tumor cell invasion and migration.13 Chloride intracellular channel 3 (CLIC3) regulates the transmembrane transport of C1−, which plays a key role in cell volume and is closely related to the apoptosis and migration of tumor cells.14 WNT inhibitory factor-1 (WIF1) is the inhibitory factor of classical WNT signaling pathways, which play an important role in the development of tumor.15 Trophoblast glycoprotein (TPBG), also known as 5T4, a type of oncofetal glycoprotein, which is also a member of LRR protein family, shows low expression in normal adult tissue and higher expression in embryo development and cancer.16 TPBG is associated with the process of epithelial–mesenchymal transition (EMT) and cancer stem cells in NSCLC.17,18 Recent research found that high expression of TPBG as a strong invasive indicator can be detected in many cancers, such as lung cancer, colorectal cancer, gastric cancer, and ovarian cancer.17,19–21 Therefore, we combined TCGA and GEO databases in the present study to explore the possible mechanisms and clinical value of gene markers involved in the development of lung cancer and further identify the gene molecular markers associated with the prognosis. To the extent of our knowledge, no relevant research has been conducted yet.
Materials and methods
Identification of DEGs from the GEO database
We selected GSE3268 and GSE10072 datasets from the GEO database. The GSE3268 dataset is the cell line data of squamous cell lung cancer patients. Each pair of samples represents a single patient with squamous lung cancer. One is derived from the cancer cells, and the other is from the normal cells. There were five patients, and each patient had two arrays. The GSE10072 dataset consisted of 58 lung adenocarcinoma tissues and 49 controls, all of which were fresh frozen tissue samples. Then, we used “limma”, “RobustRankAggreg”. R language package, according to adjusted P<0.01 and |log FC|>2 as the threshold to find the common differential genes in the two chips.
Gene functional and pathway analysis
Predicted target genes were subjected to the Gene Ontology (GO) terms and pathway enrichment analysis were applied using Metascape database (http://metascape.org/gp/index.html#/main/step1).
TCGA database and data collection
We retained cases of clinical parameters and survival data in the TCGA lung adenocarcinoma dataset; there were a total of 535 tumor tissue samples. We combined differential genes with TCGA data and performed single-factor regression of mRNA. Afterward, based on a linear combination of Akaike information criterion (AIC)-based expression values, we used a stepwise Cox regression analysis to build a prognostic marker consisting of prognostically relevant mRNA. Next, we used the following formula to construct a prognostic risk score model: risk score = expGene1 × βGene1 + expGene2 × βGene2 + expGenen × βGenen (exp, prognostic gene expression level; β, multivariate Cox regression model regression coefficients).
Gene set enrichment analysis (GSEA)
The expression profile data were ranked according to the TPBG expression from high to low quartiles, and the top 25% and the bottom 25% of the data were selected as high and low groups. Then, we downloaded the c2.cp.kegg.v6.1.symbols.gmt and c5.all.v6.1.symbols.gmt datasets from the GSEA website and MsigDB database, and analyzed our data using GSEA version 3.0 software. In addition, we performed the enrichment analysis according to the expression data. We set a random combination of 1,000 analyses, which yielded the functions involved in both the high- and low-expression groups.
Constructing protein interaction networks
We used the Search Tool for the Retrieval of Interacting Genes/Proteins (STRING) website to map the TPBG protein interaction network.
Database analysis of differential expression and prognosis of the TPBG gene
The expression of the TPBG gene in TCGA lung cancer database was extracted. We used GraphPad software (GraphPad Software, Inc., La Jolla, CA, USA) to draw the difference scatter plot. The survival curve of TPBG gene was conducted with Kaplan-Meier Plotter.
Oncomine database extraction
The Oncomine database (http://www.oncomine.org) is currently the world’s largest oncogene chip database and integrated data-mining platform for the purpose of mining cancer gene information. To date, the database has collected 715 gene expression datasets and 86,733 pieces of cancer tissue and normal tissue sample data. The Oncomine database was applied for differential expression classification of common cancer types, and their respective normal tissues, as well as clinical and pathological analyses.
The Human Protein Atlas
The Human Protein Atlas (https://www.proteinatlas.org/) provided large amounts of transcriptomics and proteomics data in specific human tissues and was composed of Tissue Atlas, Cell Atlas, and Pathology Atlas. This database offered the cell-specific localization information across 44 different normal tissues and organs as well as 20 of the most common types of cancer. In addition, immunohistochemistry (IHC)-based protein expression patterns in normal human tissues and tumor tissues were used to generate an expression map by using data from The Human Protein Atlas. In this study, we utilized this database to explore the protein expression of the TPBG gene in normal lung tissues and cancer tissues.
Cell culture
Human lung adenocarcinoma A549 and SPCA-1 cells were purchased from the American Type Culture Collection (ATCC, Manassas, VA, USA). Human bronchial epithelial 16-HBE-T cells were purchased from MssBio Co., Ltd. (Guangzhou, China). A549 and SPCA-1 cells were cultured in minimal essential medium supplemented with 10% (v/v) FBS, Glutamax, nonessential amino acids, and sodium pyruvate salt solution (0.1 mol/L) (Minimal Essential Medium; Grand Island, New York, NY, USA). The 16-HBE-T cells were cultured in RPMI-1640 medium (Grand Island) supplemented with 10% FBS. All the cell lines were grown in a humidified incubator (5% CO2) at 37°C.
Detection of TPBG gene expression level
Total RNA was extracted from the cells using the TRIzol reagent (Thermo Fisher Scientific, Waltham, MA, USA). Single-strand cDNA was synthesized from 1 mg of total RNA using the Prime-Script™ Reagent Kit with gDNA Eraser (Takara Biotechnology Co. Ltd., Dalian, China). To detect the expression of mRNA of TPBG gene, reverse transcription quantitative PCR (RT-qPCR) was conducted on a 7300 PCR system (Thermo Fisher Scientific). The primers were as follows: TPBG sense, 5′-ATTGGGGATTAAGCGGTCCC-3′ and antisense, 5′-GAACTTGGCTAACCCCCTCG-3′. The following cycling conditions were applied: 95 or 5 minutes, followed by 40 cycles of 95°C for 20 seconds and 60°C for 30 seconds. For each sample, qPCR assays were conducted in triplicate in a 10 mL reaction volume. b-Actin served as an internal control to normalize the expression of PLAU. The 2-Ct method was employed to calculate the relative expression of TPBG mRNA.
Statistical analyses
Data were analyzed in SPSS 19.0 software (IBM Corporation, Armonk, NY, USA). Chi-squared test and Fisher’s exact test were used to analyze counting data, and a Student’s t-test was used to analyze measurement data. Kaplan–Meier (K–M) and log-rank analyses were used to analyze survival curves. A Cox model was used to analyze relationships between data and patients. P<0.05 was considered to be statistically significant. For GSEA analysis, gene clusters with false discovery rates (FDRs) <0.25 and P<0.05 were considered to be significantly enriched genes.
Results
GEO datasets filter differential genes
We selected 80 significantly upregulated and downregulated differential genes common to the two chips, including 40 highly expressed genes and 40 low expressed genes, using “RobustRankAggreg”. R language package was used to visualize these genes (Figure 1).
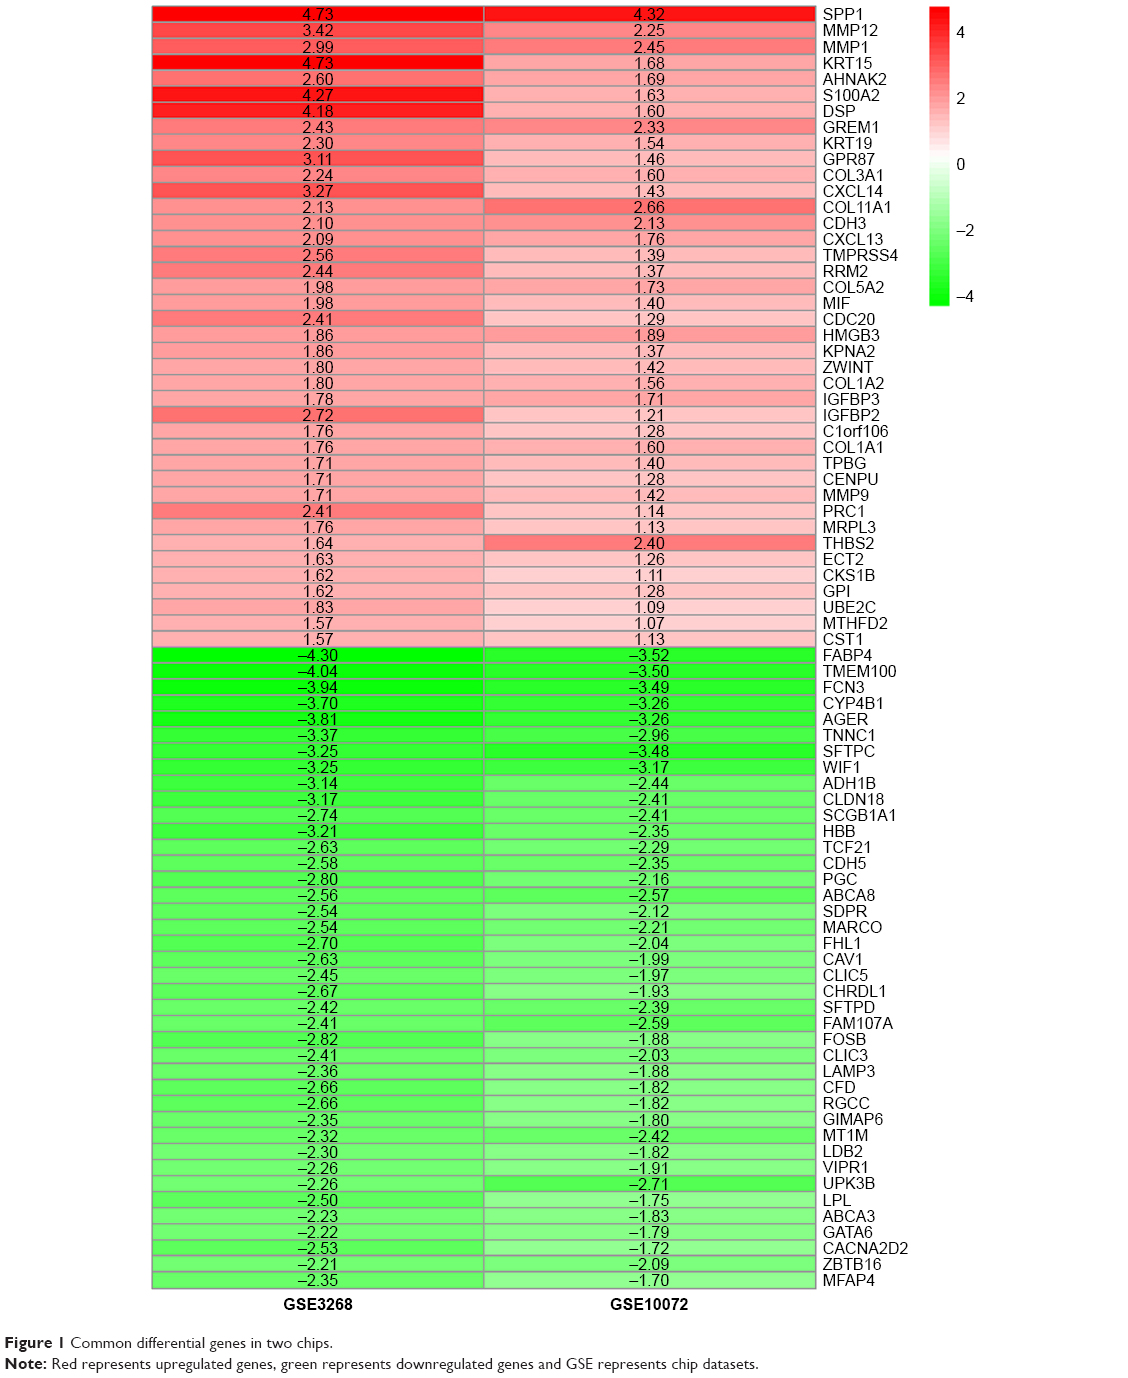 | Figure 1 Common differential genes in two chips. |
Enrichment analysis of functional pathways
GO terms’ function analysis and pathway enrichment analysis of differential mRNA were conducted using the Metascape database, and a heatmap was constructed on one of the most significant pathways and functions from the top 20 according to the P-value (Figure 2A). The results of GO analysis found that the significant enrichment of biological processes was composed of four parts: vasculature development, response to growth factor, epithelial cell differentiation, and positive regulation of cell death. The genes that were highly enriched were picked out, and grouped and clustered them by the function pathway correlation and constructed the network. Different colors in the diagram represent different categories (Figure 2B). The dark color bar indicates that the greater number of genes are enriched in the pathway or biological process (Figure 2C).
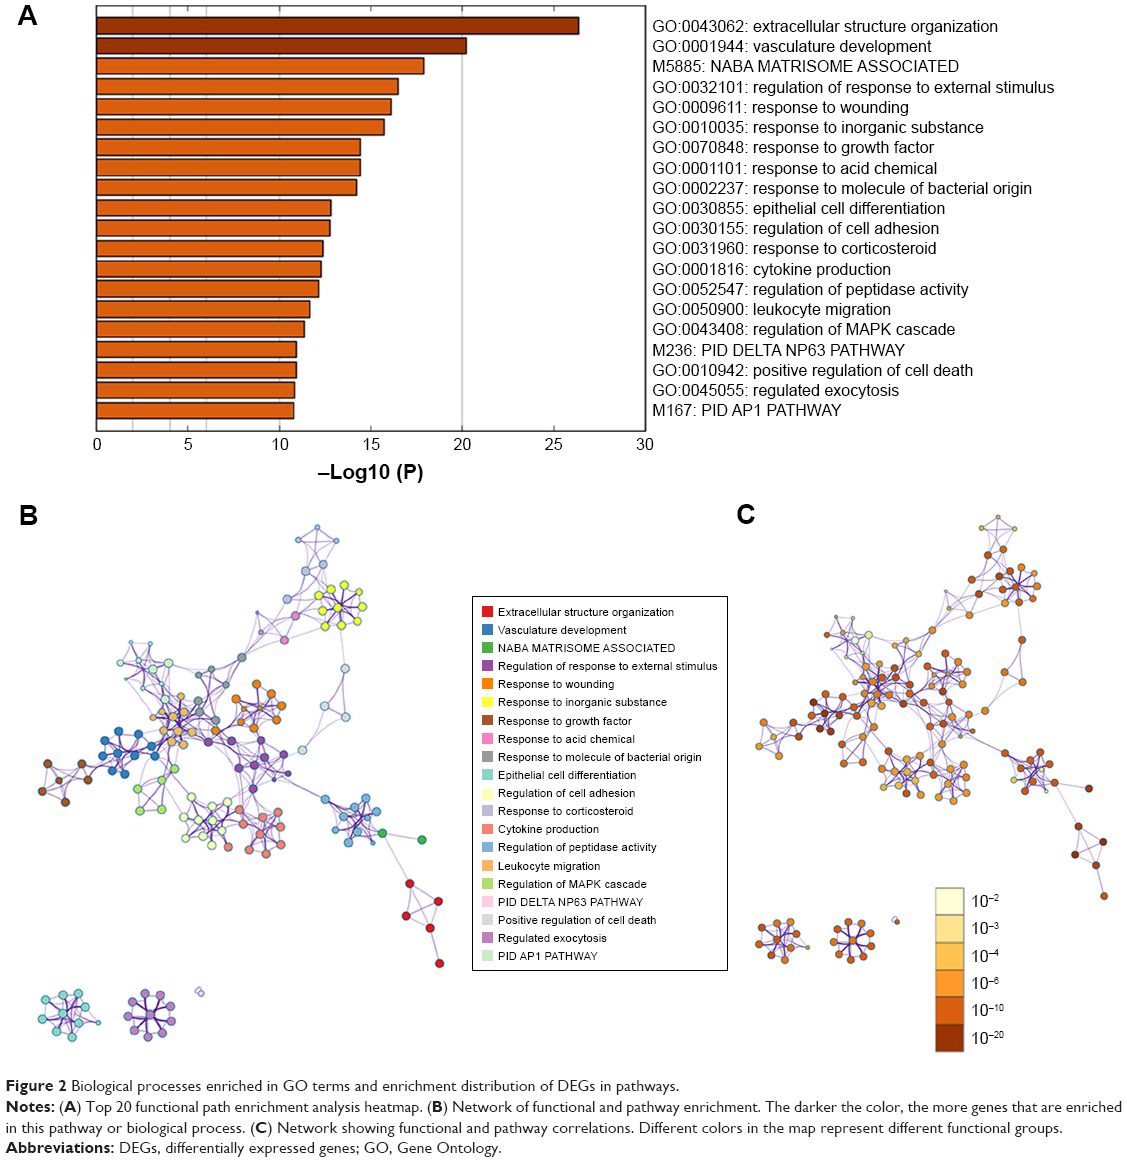 | Figure 2 Biological processes enriched in GO terms and enrichment distribution of DEGs in pathways. |
Correlation analysis between gene markers and survival of lung cancer patients and verification using the TCGA database
Based on the linear combination of AIC-based expression values, stepwise Cox regression analysis was used to construct a prognostic model consisting of five prognostically relevant mRNAs. This new prognostic model formula is as follows: risk score = (0.1223×expression value of RRM2) + (0.1780×expression value of TPBG) + (−0.072×expression value of CLIC3) + (0.1276×expression value of TMPRSS4) + (−0.034×expression value of WIF1). The survival curves of lung cancer patients according to the expression of these five mRNAs are shown in Figure 3A. The 5-year overall survival (OS) rate of the low-expression group in the new prognostic model of the mRNA marker was significantly higher than that of the high-expression group (P=0.0005), and the 5-year OS rate of patients with advanced stage lung cancer was significantly lower than those with early stage lung cancer (P=0.0006) (Figure 3C). Similarly, 5-year OS rate of patients with higher tumor size (T) and node (N) stage was significantly lower than those with lower T and N stage (P=0.0001) (Figure 3B and D). The abovementioned results indicate that these five mRNAs may serve as good prognostic markers for lung cancer patients.
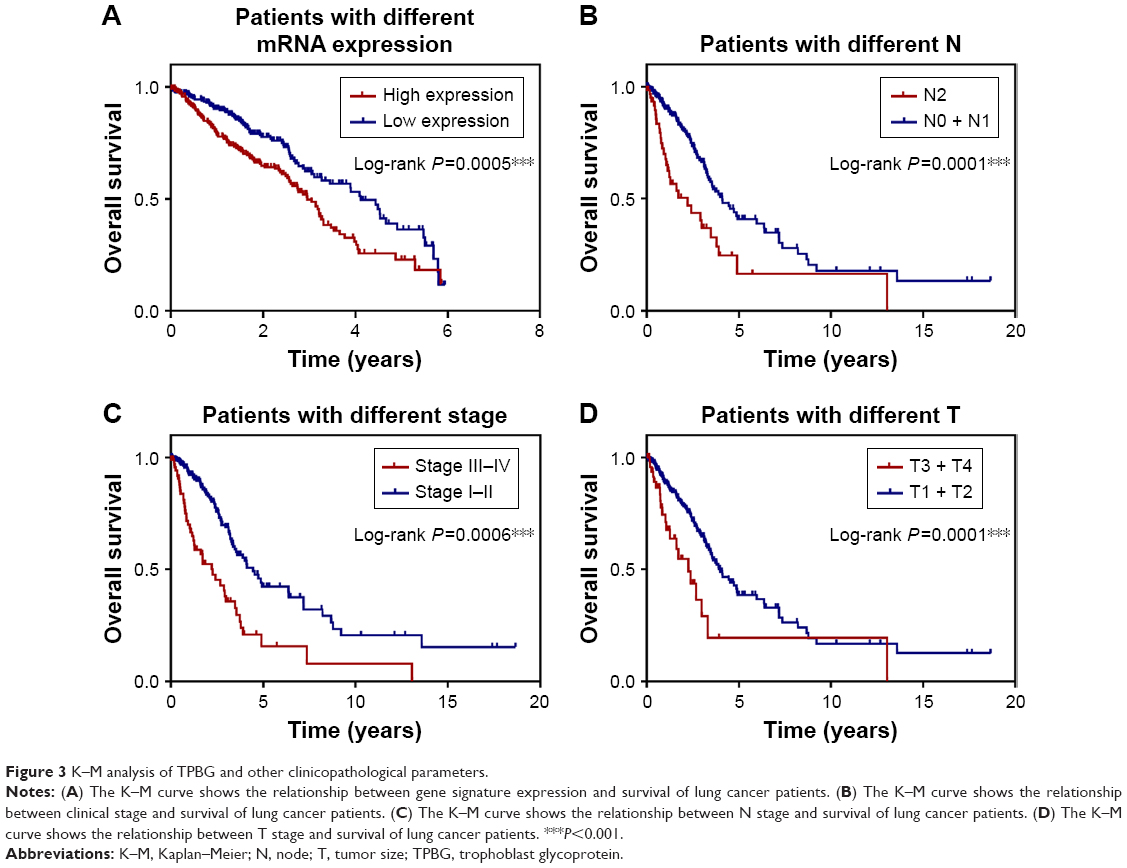 | Figure 3 K–M analysis of TPBG and other clinicopathological parameters. |
The expression level of mRNA marker, TMN stage, clinical stage, and age were incorporated in the Cox regression model. The results of univariate analysis showed statistically significant correlation among mRNA expression levels (P=6.37e-04), clinical stage (P=4.28e-08), N stage (P=1.86e-05), and T stage (P=2.02e-04). Multivariate analysis found that high expression of mRNA markers and clinical stage were independent prognostic factors for lung cancer patients (Table 1).
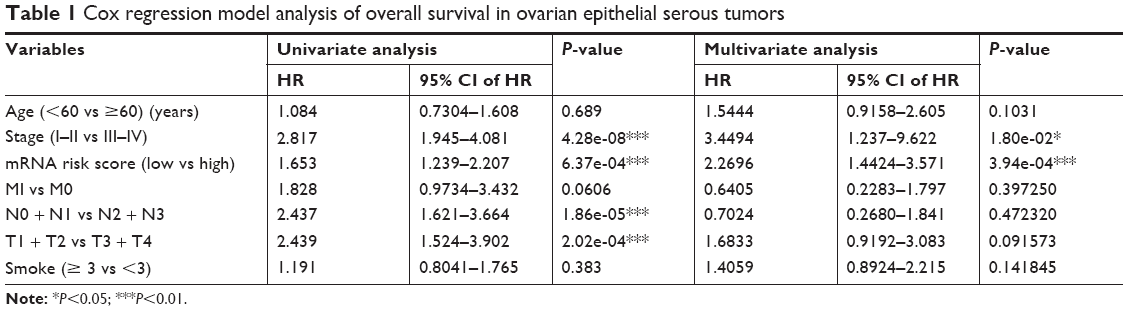 | Table 1 Cox regression model analysis of overall survival in ovarian epithelial serous tumors |
GSEA of TPBG gene
GSEA showed that high TPBG expression samples were mainly enriched in extracellular matrix (ECM) receptor interaction pathway gene sets, cell cycle gene sets, p53 pathway gene sets, and more correlated gene sets (P<0.05; Figure 4).
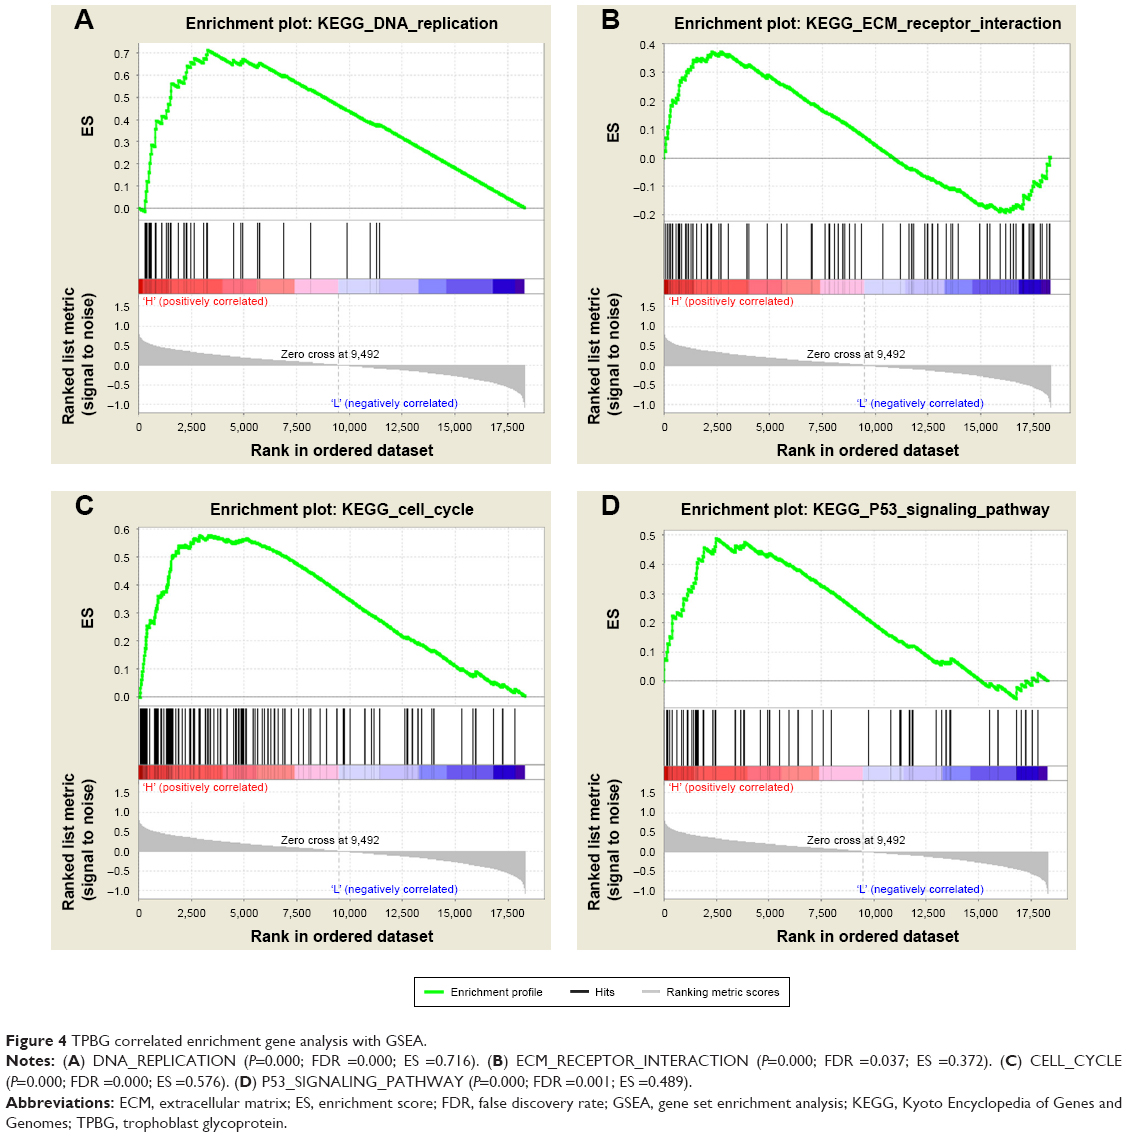 | Figure 4 TPBG correlated enrichment gene analysis with GSEA. |
Survival analysis of TPBG in KM Plotter
A total of 1,926 patients were included in this prognostic study: 571 patients were grouped into the high TPBG expression group and the other 1,355 patients were grouped into the low TPBG expression group. K–M survival curves in Figure 5A show that the higher expression level of TPBG was significantly correlated with worse survival (P=0.0093).
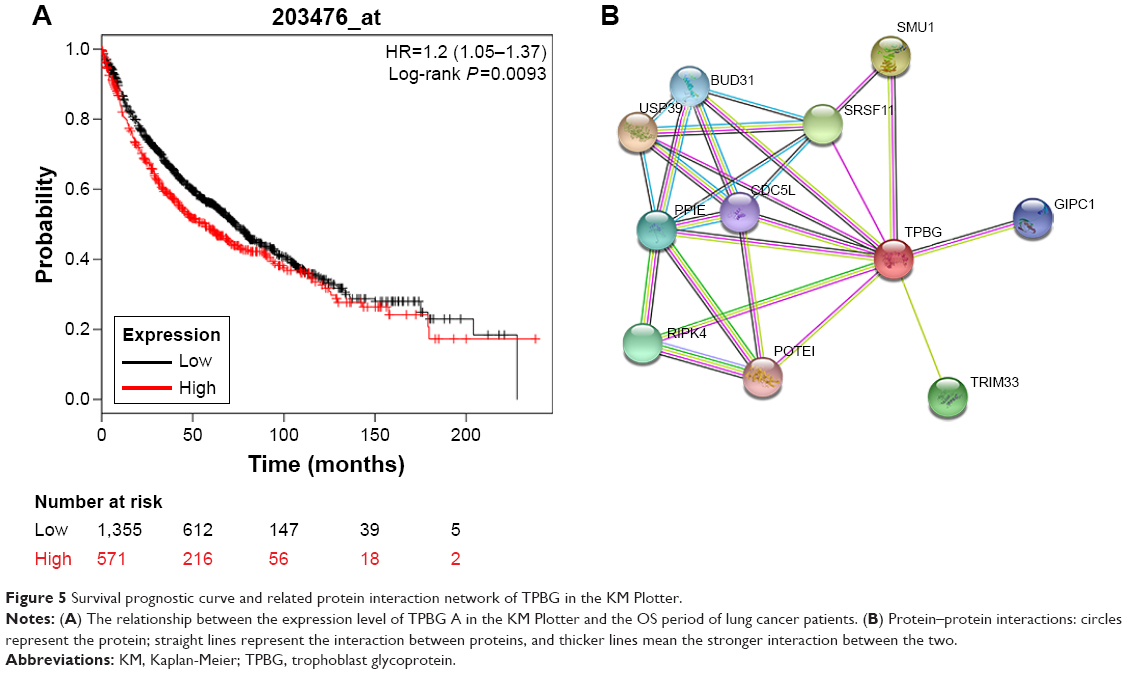 | Figure 5 Survival prognostic curve and related protein interaction network of TPBG in the KM Plotter. |
Protein–protein interaction shows that TPBG is regulated by many genes, which jointly regulate the occurrence and development of tumor (Figure 5B).
Gene expression levels of TPBG in lung cancer cells and tissues
In the TCGA database, the gene expression level of TPBG in lung adenocarcinoma tissue was significantly higher than that in paracancerous tissue (Figure 6A). The RT-qPCR results displayed that the gene expression level of TPBG in A549 lines and SPCA-1 was significantly higher than that of 16-HBE-T lines (Figure 6B and C).
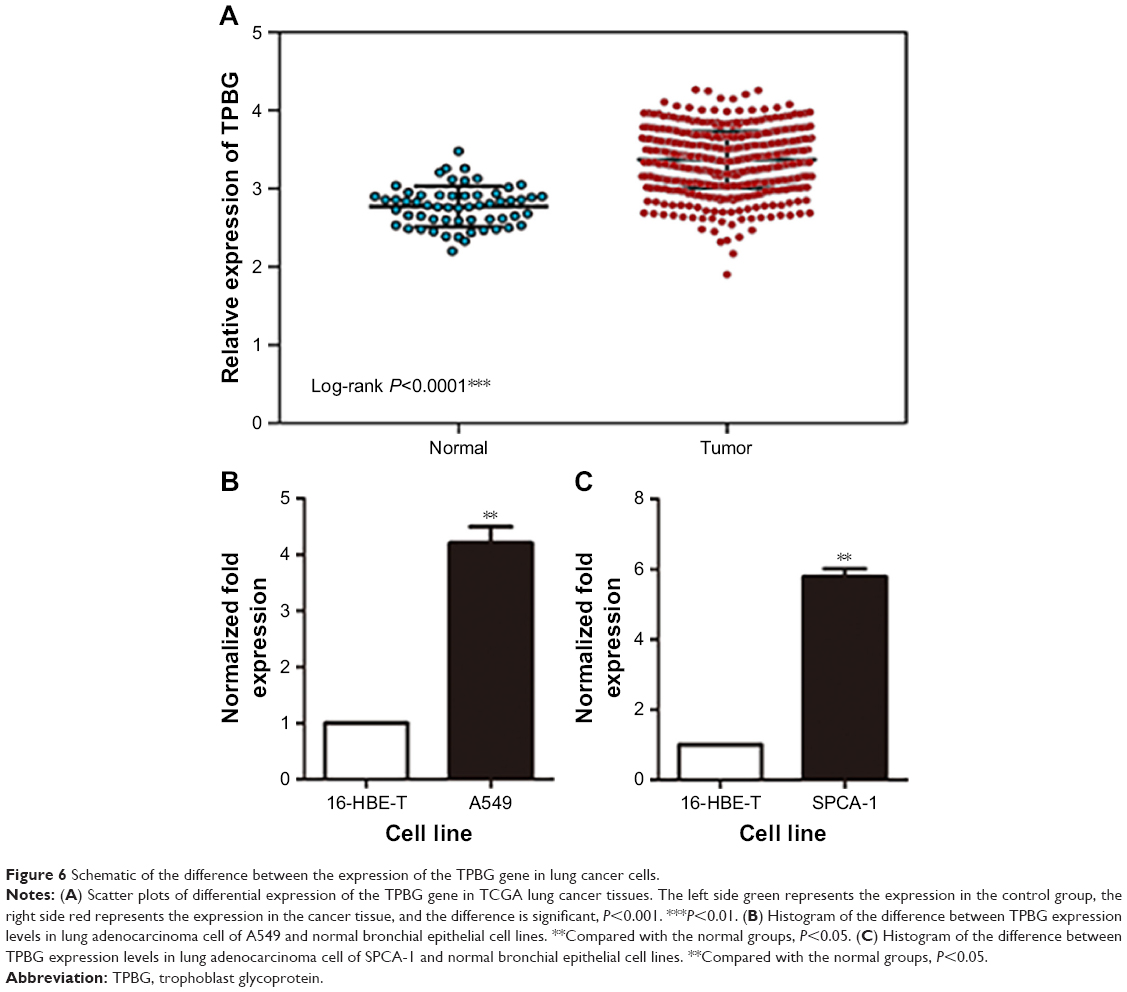 | Figure 6 Schematic of the difference between the expression of the TPBG gene in lung cancer cells. |
Analysis of the TPBG gene expression in the Oncomine database and Human Protein Atlas
The Oncomine database is used to further analyze the expression of TPBG in other lung squamous cell carcinoma datasets. 1) “Cancer Type: Lung Cancer”; 2) “Gene: TPBG”; 3) “Data Type: mRNA”; 4) “Analysis Type: Cancer vs Normal Analysis”, and 5) Threshold Setting Condition (P<0.001, fold change >2, gene rank = top 10%). TPBG gene expression data were collected in a total of 422 different types of tumor studies (Figure 7A). Of these, 46 studies were statistically significant for TPBG expression (38 studies for increased TPBG expression, and eight studies for reduced TPBG expression). The expression was increased in seven lung cancer studies. Three of the seven lung cancer datasets were related to lung squamous cell carcinoma, so we further validated the expression of TPBG in lung squamous cell carcinoma. We filtered out three datasets: Hou Lung (203476_at), Bhattacharjee Lung (368_at), and Wachi Lung (203476_at). In the three studies, the expression level of TPBG in lung squamous cell carcinoma was higher than that in the normal group (P<0.001; Figure 7B–D). Finally, we used the Human Protein Atlas database to verify the histological level of TPBG, and the results suggest that TPBG is downregulated in normal tissue and upregulated in lung cancer tissues (Figure 7E and F).
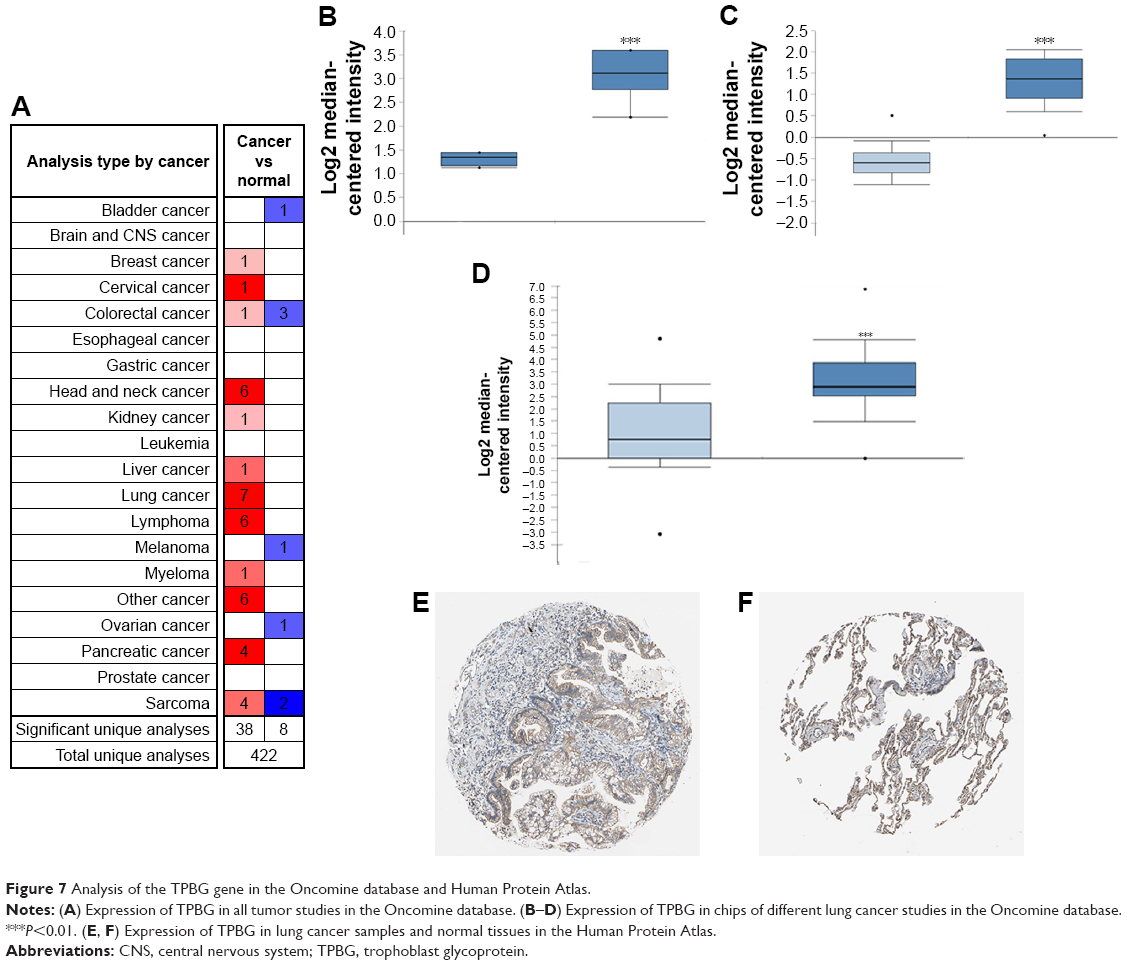 | Figure 7 Analysis of the TPBG gene in the Oncomine database and Human Protein Atlas. |
Discussion
Lung cancer is one of the most common malignancies in the world. Due to fewer characteristic clinical features in the early stages, >85% of patients with NSCLC are diagnosed definitely in the advanced stages. Therefore, it is of great significance to explore the mechanism of occurrence and progression of lung cancer and find effective tumor markers.
Previous studies showed that high expression of the RRM2 gene was associated with an increase in microvessel density in cervical cancer.22,23 Low expression of the RRM2 gene predicted a better prognosis for platinum treatment in NSCLC,10 and under these conditions may ease the resistance of gemcitabine in patients with pancreatic cancer.24 The TMPRSS4 gene participates in, as well as promotes, the proliferation, invasion, and metastasis of breast, prostate, and gastric cancers, and the high expression of the TMPRSS4 gene was correlated with patients’ poor prognoses.25–29 CLIC3 is known as a monitoring prognosis index of gallbladder cancer and it also has the ability to promote invasion and metastasis in breast cancer.14 Silencing of the tumor suppressor gene WIF1 can promote hypermethylation, which indicates that WIF1 may be a diagnostic biomarker for colorectal cancer and breast cancer.30,31
Naganuma et al19 assessed the expression levels of TPBG in 62 patients with gastric cancer using IHC and found that it can be detected in 51.6% of primary gastric cancer patients. The study also showed that the 5-year OS rate of TPBG-positive patients was significantly poorer than that of TPBG-negative patients, suggesting that TPBG gene expression levels were correlated with the prognosis of gastric cancer patients, which means that the high-expression level of TPBG often indicates poor prognosis in gastric cancer.
Based on the GEO database and the Metascape website, our study screened out five markers (RRM2, TPBG, TMPRSS4, CLIC3, and WIF1) that are related to the prognosis of lung cancer. The TCGA database was then used to further verify the relationship among the expression levels of these five markers and TMN stage, clinical stage, age, gender, and prognosis of lung cancer. Our results predicted that these five gene markers may be closely related to the development of lung cancer. Further research and validation on the TPBG gene showed a clear correlation between the expression level of TPBG and survival of patients. Patients with a high TPBG expression level presented a poor prognosis. The verification results in tissues and cells showed that the expression of the TPBG gene was higher in lung cancer tissues and lung cancer cells than normal adjacent tissues and cells, indicating that this gene may play a catalytic role in the occurrence and progress of lung cancer.
The interaction of ECM directly and indirectly affects the activity of cells and affects their biological behavior, such as the local invasion and distant metastasis of tumor cells. It is known that DNA replication is the basic process that ensures accurate reproduction of cells’ genetic information and correct transfer to progeny cells.31,32 However, under various pressures in the body, DNA replication is vulnerable to interference and generates damage, resulting in DNA replication stagnation, affecting the stability of the genome, and even inducing cell apoptosis, necrosis, and canceration. It is generally known that p53 is a transcription factor that binds specifically to DNA.33 Under stimulations, such as genomic instability, hypoxia, and carcinogenic factors, the expression of specific genes can be regulated to induce cell cycle suspension, apoptosis, DNA repair, etc.34–36 In this study, GSEA analysis showed that the high-expression samples of TPBG are mainly enriched into ECM receptor interaction pathway gene sets, cell cycle gene sets, DNA replication gene sets, p53 pathway gene set, etc. Therefore, it is speculated that TPBG may affect patients’ survival by participating in cell proliferation and/or invasion and metastasis process, demonstrating that TPBG can be used as a valid biomarker to predict occurrence, metastasis, and long-time survival.
Conclusion
We found that the high expression of markers consisting of RRM2, TPBG, TMPRSS4, CLIC3 and WIF1 genes as a poor prognostic factor predicted metastasis and prognosis of lung cancer patients. Furthermore, it was found that the expression level of TPBG in lung adenocarcinoma carcinoma and squamous cell carcinoma was statistically higher than that in paracancerous tissues and normal bronchial epithelial cells through the analysis of qPCR and the Oncomine database. The biological characteristics and clinical significance of TPBG need more verification and judgment.
Acknowledgment
This study was supported by research funding from the Science and Technology Planning Project of Sichuan Province (no. 2018JY0373).
Disclosure
The authors report no conflicts of interest in this work.
References
Ferlay J, Soerjomataram I, Dikshit R, et al. Cancer incidence and mortality worldwide: sources, methods and major patterns in GLOBOCAN 2012. Int J Cancer. 2015;136(5):E359–E386. | ||
Travis WD, Brambilla E, Nicholson AG, et al. The 2015 World health organization classification of lung tumors: impact of genetic, clinical and radiologic advances since the 2004 classification. J Thorac Oncol. 2015;10(9):1243–1260. | ||
Guo J, Meng X, Du Z, Wang H, Zhang H. The role of PRDX1 in apoptosis of thyroid cancer cells mediated by proteasome inhibitor. J Mod Oncol. 2015;23(4):440–444. | ||
Gong Y, Yan K, Lin F, et al. Determination of oestrogen-receptor status and ERBB2 status of breast carcinoma: a gene-expression profiling study. Lancet Oncol. 2007;8(3):203–211. | ||
Boyero L, Sánchez-Palencia A, Miranda-León MT, Hernández-Escobar F, Gómez-Capilla JA, Fárez-Vidal ME. Survival, classifications, and desmosomal plaque genes in non-small cell lung cancer. Int J Med Sci. 2013;10(9):1166–1173. | ||
Hess KR, Anderson K, Symmans WF, et al. Pharmacogenomic predictor of sensitivity to preoperative chemotherapy with paclitaxel and fluorouracil, doxorubicin, and cyclophosphamide in breast cancer. J Clin Oncol. 2006;18(2):203–203. | ||
Cancer Genome Atlas Research Network, Weinstein JN, Collisson EA, et al. The Cancer Genome Atlas Pan-Cancer analysis project. Nat Genet. 2013;45(10):1113–1120. | ||
Edgar R, Domrachev M, Lash AE. Gene Expression Omnibus: NCBI gene expression and hybridization array data repository. Nucleic Acids Res. 2002;30(1):207–210. | ||
Duxbury MS, Ito H, Benoit E, Zinner MJ, Ashley SW, Whang EE. Retrovirally mediated RNA interference targeting the M2 subunit of ribonucleotide reductase: a novel therapeutic strategy in pancreatic cancer. Surgery. 2004;136(2):261–269. | ||
Burton T, Kashour T, Wright J, Amara F. Cellular signaling pathways affect the function of ribonucleotide reductase mRNA binding proteins: mRNA stabilization, drug resistance, and malignancy (Review). Int J Oncol. 2003;22(1):21–31. | ||
Ferrandina G, Mey V, Nannizzi S, et al. Expression of nucleoside transporters, deoxycitidine kinase, ribonucleotide reductase regulatory subunits, and gemcitabine catabolic enzymes in primary ovarian cancer. Cancer Chemother Pharmacol. 2010;65(4):679–686. | ||
Li T, Zeng ZC, Wang L, et al. Radiation enhances long-term metastasis potential of residual hepatocellular carcinoma in nude mice through TMPRSS4-induced epithelial-mesenchymal transition. Cancer Gene Ther. 2011;18(9):617–626. | ||
Leth-Larsen R, Terp M, Christensen AG. Functional heterogeneity within the CD44 high human breast cancer stem cell-like compartment reveals a gene signature predictive of distant metastasis. Molecular Medicine. 2012;18(7):1–1121. | ||
Macpherson IR, Rainero E, Mitchell LE, et al. CLIC3 controls recycling of late endosomal MT1-MMP and dictates invasion and metastasis in breast cancer. J Cell Sci. 2014;127(18):3893–3901. | ||
Ramachandran I, Thavathiru E, Ramalingam S, et al. Wnt inhibitory factor 1 induces apoptosis and inhibits cervical cancer growth, invasion and angiogenesis in vivo. Oncogene. 2012;31(22):2725–2737. | ||
Damelin M, Geles KG, Follettie MT, et al. Delineation of a cellular hierarchy in lung cancer reveals an oncofetal antigen expressed on tumor-initiating cells. Cancer Res. 2011;71(12):4236–4246. | ||
Stern PL, Brazzatti J, Sawan S, Mcginn OJ. Understanding and exploiting 5T4 oncofoetal glycoprotein expression. Semin Cancer Biol. 2014;29:13–20. | ||
Hanagiri T, Sugio K, Uramoto H, et al. Gender difference as a prognostic factor in patients undergoing resection of non-small cell lung cancer. Surg Today. 2007;37(7):546–551. | ||
Naganuma H, Kono K, Mori Y, et al. Oncofetal antigen 5T4 expression as a prognostic factor in patients with gastric cancer. Anticancer Res. 2002;22(2B):1033–1038. | ||
Starzynska T, Marsh PJ, Schofield PF, Roberts SA, Myers KA, Stern PL. Prognostic significance of 5T4 oncofetal antigen expression in colorectal carcinoma. Br J Cancer. 1994;69(5):899–902. | ||
Wrigley E, Mcgown AT, Rennison J, et al. 5T4 oncofetal antigen expression in ovarian carcinoma. Int J Gynecol Cancer. 1995;5(4):269–274. | ||
Wang N, Zhan T, Ke T, et al. Increased expression of RRM2 by human papillomavirus E7 oncoprotein promotes angiogenesis in cervical cancer. Br J Cancer. 2014;110(4):1034–1044. | ||
Wang L, Meng L, Wang XW, Ma GY, Chen JH. Expression of RRM1 and RRM2 as a novel prognostic marker in advanced non-small cell lung cancer receiving chemotherapy. Tumour Biol. 2014;35(3):1899–1906. | ||
Xia G, Wang H, Song Z, Meng Q, Huang X, Huang X. Gambogic acid sensitizes gemcitabine efficacy in pancreatic cancer by reducing the expression of ribonucleotide reductase subunit-M2 (RRM2). J Exp Clin Cancer Res. 2017;36(1):107. | ||
Li XM, Liu WL, Chen X, et al. Overexpression of TMPRSS4 promotes tumor proliferation and aggressiveness in breast cancer. Int J Mol Med. 2017;39(4):927–935. | ||
Lee Y, Ko D, Min HJ, et al. TMPRSS4 induces invasion and proliferation of prostate cancer cells through induction of Slug and cyclin D1. Oncotarget. 2016;7(31):50315–50332. | ||
Jin J, Shen X, Chen L, Bao LW, Zhu LM, Zhu LM. TMPRSS4 promotes invasiveness of human gastric cancer cells through activation of NF-κB/MMP-9 signaling. Biomed Pharmacother. 2016;77:30–36. | ||
Zeng P, Zhang P, Zhou LN, et al. TMPRSS4 as an emerging potential poor prognostic factor for solid tumors: A systematic review and meta-analysis. Oncotarget. 2016;7(46):76327–76336. | ||
Gu X, Li B, Jiang M, et al. RNA sequencing reveals differentially expressed genes as potential diagnostic and prognostic indicators of gallbladder carcinoma. Oncotarget. 2015;6(24):20661–20671. | ||
Alvarez C, Tapia T, Cornejo V, et al. Silencing of tumor suppressor genes RASSF1A, SLIT2, and WIF1 by promoter hypermethylation in hereditary breast cancer. Mol Carcinog. 2013;52(6):475–487. | ||
Sacco E, Hasan MM, Alberghina L, Vanoni M. Comparative analysis of the molecular mechanisms controlling the initiation of chromosomal DNA replication in yeast and in mammalian cells. Biotechnol Adv. 2012;30(1):73–98. | ||
Mazouzi A, Velimezi G, Loizou JI. DNA replication stress: causes, resolution and disease. Exp Cell Res. 2014;329(1):85–93. | ||
Sakaguchi K, Herrera JE, Saito S, et al. DNA damage activates p53 through a phosphorylation-acetylation cascade. Genes Dev. 1998;12(18):2831–2841. | ||
Leonova KI, Brodsky L, Lipchick B, et al. p53 cooperates with DNA methylation and a suicidal interferon response to maintain epigenetic silencing of repeats and noncoding RNAs. Proc Natl Acad Sci U S A. 2013;110(1):E89–E98. | ||
Sermeus A, Michiels C. Reciprocal influence of the p53 and the hypoxic pathways. Cell Death Dis. 2011;2(5):e164. | ||
Lowe SW. Activation of p53 by oncogenes. Endocr Relat Cancer. 1999;6(1):45–48. |
 © 2019 The Author(s). This work is published and licensed by Dove Medical Press Limited. The full terms of this license are available at https://www.dovepress.com/terms.php and incorporate the Creative Commons Attribution - Non Commercial (unported, v3.0) License.
By accessing the work you hereby accept the Terms. Non-commercial uses of the work are permitted without any further permission from Dove Medical Press Limited, provided the work is properly attributed. For permission for commercial use of this work, please see paragraphs 4.2 and 5 of our Terms.
© 2019 The Author(s). This work is published and licensed by Dove Medical Press Limited. The full terms of this license are available at https://www.dovepress.com/terms.php and incorporate the Creative Commons Attribution - Non Commercial (unported, v3.0) License.
By accessing the work you hereby accept the Terms. Non-commercial uses of the work are permitted without any further permission from Dove Medical Press Limited, provided the work is properly attributed. For permission for commercial use of this work, please see paragraphs 4.2 and 5 of our Terms.