")
Back to Journals » Journal of Inflammation Research » Volume 14
Combined Use of Fecal Biomarkers in Inflammatory Bowel Diseases: Oncostatin M and Calprotectin
Authors Cao Y, Dai Y, Zhang L, Wang D, Hu W, Yu Q, Wang X, Yu P, Liu W, Ping Y, Sun T, Sang Y, Liu Z, Chen Y, Tao Z
Received 5 October 2021
Accepted for publication 20 November 2021
Published 1 December 2021 Volume 2021:14 Pages 6409—6419
DOI https://doi.org/10.2147/JIR.S342846
Checked for plagiarism Yes
Review by Single anonymous peer review
Peer reviewer comments 3
Editor who approved publication: Professor Ning Quan
Ying Cao,1,* Yibei Dai,1,* Lingyu Zhang,1 Danhua Wang,1 Wen Hu,2 Qiao Yu,3 Xuchu Wang,1 Pan Yu,1 Weiwei Liu,1 Ying Ping,1 Tao Sun,1 Yiwen Sang,1 Zhenping Liu,4 Yan Chen,3 Zhihua Tao1
1Department of Laboratory Medicine, Zhejiang University School of Medicine Second Affiliated Hospital, Hangzhou, People’s Republic of China; 2National Clinical Research Center for Infectious Diseases, Zhejiang University School of Medicine First Affiliated Hospital, Hangzhou, People’s Republic of China; 3Center for Inflammatory Bowel Diseases, Department of Gastroenterology, Zhejiang University School of Medicine Second Affiliated Hospital, Hangzhou, People’s Republic of China; 4Department of Laboratory Medicine, the First People’s Hospital of Yuhang District, Hangzhou, People’s Republic of China
*These authors contributed equally to this work
Correspondence: Yan Chen; Zhihua Tao Tel +86 571 8778 3752
Fax +86 571 8689 8730
Email [email protected]; [email protected]
Background: Fecal biomarkers have emerged as one of the most useful tools for clinical management of inflammatory bowel disease (IBD). Oncostatin M (OSM), like fecal calprotectin (FC), is highly expressed in the inflamed intestinal mucosa which may have potential usefulness. We aimed to evaluate the additional utility of these two fecal biomarkers for IBD diagnosis, activity, and prediction of infliximab response over FC alone.
Methods: In group 1, 236 IBD patients (145 Crohn’s disease, 91 ulcerative colitis), 50 disease controls, and 32 healthy controls were recruited for IBD diagnosis and activity. In group 2, baseline stool samples were collected from 62 patients to predict infliximab response at week 28 and 52. The performance of fecal biomarkers for IBD management was assessed by the area under the receiver operating characteristic curve (AUC).
Results: Fecal OSM and FC levels were increased in IBD patients and were positively correlated with clinical and endoscopic activity. Their combination showed a better ability for disease diagnosis (AUC = 0.93) and slightly improved the capability to identify mucosal healing (AUC = 0.923). Baseline OSM and FC levels were elevated in non-responders at week 28 and 52. The AUCs of OSM, FC, and their combination to predict therapeutic response were 0.763, 0.834, and 0.859 at week 28, 0.638, 0.661, and 0.704 at week 52, respectively. Combined use of fecal and blood biomarkers improved predictive accuracy with an AUC of 0.919 at week 28 and 0.887 at week 52.
Conclusion: In addition to FC, OSM is a novel fecal biomarker, and their combination is more beneficial for disease diagnosis and prediction of infliximab response but not for disease activity in IBD patients. Further larger-scale studies are required to confirm our findings.
Keywords: inflammatory bowel disease, fecal biomarkers, oncostatin M, calprotectin, diagnosis, activity, infliximab response
Introduction
Inflammatory bowel disease (IBD) is a chronic, intermittent, and inflammatory disease of the intestinal tract, including Crohn’s disease (CD) and ulcerative colitis (UC). Infliximab (IFX) remains the mainstay of therapy following the failure of conventional medicines in IBD. However, it also increases the economic burden and infection risk, and 40% of patients lose their primary response to anti-tumor necrosis factor (anti-TNF) therapy.1–3 Endoscopy is considered the current standard for IBD diagnosis, activity, and therapeutic efficacy evaluation. Nevertheless, the invasive, costly, and time-consuming procedure has led many to seek surrogate means.4 Although blood biomarkers such as C-reactive protein (CRP) and albumin (ALB) have been widely used for disease monitoring,5 their lack of specificity in common limits their clinical value.
With the increased demand for simple, noninvasive, and specific testing, fecal biomarkers have risen to prominence. Fecal calprotectin (FC), a cytosolic protein abundant in neutrophils and macrophages, can distinguish IBD from irritable bowel syndrome (IBS).6–8 FC has been reported to be highly correlated with disease severity and can predict therapeutic outcomes such as mucosal healing and clinical relapse.9–11 Novel fecal biomarkers remain to be explored for improved clinical management of IBD patients.
Similar to calprotectin, oncostatin M (OSM), a cytokine in the IL-6 family, is released by activated macrophages, neutrophils, T cells, and monocytes.12 It has been reported that OSM in tissues and blood is highly expressed in IBD patients and is related to disease severity.13–15 Elevated mucosal OSM has been proven to be associated with refractory anti-TNF therapy in IBD.13–16 Several studies have revealed that serum and plasma OSM can predict clinical response to IFX treatment in CD.17–19 Serum OSM expression at diagnosis is able to predict clinical course and the need for intensification of treatment in IBD patients.20 Nevertheless, OSM in blood lacks specificity, which is highly expressed in other inflammatory diseases such as sepsis and axial spondyloarthritis.21,22 We hypothesized that fecal OSM was a novel biomarker, and their combined use of fecal OSM and FC could be more beneficial for IBD management in specific clinical situations.
Given the above background, we first investigated whether fecal OSM was a potential biomarker like FC and evaluated the additional utility of these two fecal biomarkers for IBD diagnosis, activity, and prediction of therapeutic response over FC alone.
Methods
Subjects
The study population consisted of two groups. In group 1, patients with a definite diagnosis of IBD were enrolled between June 2019 and May 2021 at Zhejiang University School of Medicine Second Affiliated Hospital (Hangzhou, China).23 The age- and sex-matched disease control (DC) group with similar symptoms of abdominal discomfort as IBD was diagnosed with intestinal Behcet’s disease, IBS, intestinal polyposis, and non-IBD enteritis. In group 2, IBD patients newly starting IFX were included. Therapeutic response was evaluated at week 28 and 52. Exclusion criteria were as follows: (a) incomplete clinical data; (b) isolated lesions of the upper gastrointestinal tract; (c) a history of tumor or cancer; and (d) concurrent autoimmune system diseases such as systemic lupus erythematosus and rheumatoid arthritis. This work was approved by the Ethics Committee of Zhejiang University School of Medicine Second Affiliated Hospital (No. 20210542). All participants provided informed consent in accordance with the Declaration of Helsinki.
Outcomes
Clinical activity was assessed by Harvey-Bradshaw Index (HBI) for CD, and partial Mayo score (pMS) for UC.24,25 Clinical remission was defined as HBI < 5 or pMS < 2. Mild disease was defined as 5 ≤ HBI < 8 or 2 ≤ pMS < 5. Moderate-to-severe disease was defined as HBI ≥ 8 or pMS ≥ 5. Simple Endoscopic Score for CD (SES-CD) and Mayo endoscopic subscore (MES) were employed for endoscopic assessment.26,27 Mucosal healing was defined as SES-CD < 3 for CD or MES < 1 for UC. Therapeutic nonresponse was defined as a decrease in HBI or pMS < 3, the need for intensive treatment, switching to another treatment, or intestinal resection.
Sample Collection and Measurement
In group 1, stool samples were collected from healthy controls (HC), non-IBD, and IBD patients with or without IFX treatment. In group 2, stool samples were collected from IBD patients before IFX treatment. For sample processing, 50 mg of feces were mixed with 2.5 mL of fecal extraction buffer. FC was measured by enzyme-linked immunosorbent assay (Herui Biotechnology Co., Ltd, Suzhou, China) according to manufacturer’s recommendations. Fecal OSM was assayed by chemiluminescent sandwich immunoassay. Briefly, 100μL stool samples or OSM standards (R&D systems, Minneapolis, MN, USA), and 50μL double antibodies (Diagbio Co., Ltd., Hangzhou, China) were incubated together for 75 min at 37 °C. Then 50μL streptavidin-modified magnetic beads (Roche, Switzerland, Basel) were added to capture immuno-complexes and incubated for 15 min at 37 °C. Following washing 3 times, 200μL pre-trigger and trigger solution were added, and the signal was detected using an automated chemiluminescent instrument (Medicalsystem, Ningbo, China).
Statistical Analysis
Categorical variables were summarized as frequency and percentage. Continuous variables were summarized as median and interquartile range. Comparisons were performed using the chi-square test for categorical data. Continuous variables with a skewed distribution were analyzed with the Mann–Whitney U-test between two groups or Kruskal–Wallis test among multiple groups. Spearman rank correlation was utilized for correlation analysis. Receiver operator characteristic (ROC) curves were plotted to evaluate the performance of fecal and blood biomarkers for IBD management. A two-sided P < 0.05 was considered statistically significant. All data were processed by GraphPad Prism 9.0 (GraphPad Software Inc., La Jolla, CA) and SPSS 25 (SPSS Inc., NY, USA).
Results
Study Population
The demographic and clinical characteristics of the two groups are presented in Tables 1 and 2. Group 1 consisted of 236 IBD patients (145 CD and 91 UC), 50 DC (4 intestinal Behcet’s disease, 25 IBS, 4 intestinal polyposis, and 17 non-IBD enteritis), and 32 HC for IBD diagnosis and activity. The median age was 32 (25–44) for CD and 39 (28–51) for UC. Patients in clinical remission accounted for 58.6% of CD and 46.2% of UC. In group 2, 62 IBD patients (56 CD and 6 UC) were included. There were 9 (14.5%) non-responders at week 28 and 20 (32.3%) non-responders at week 52.
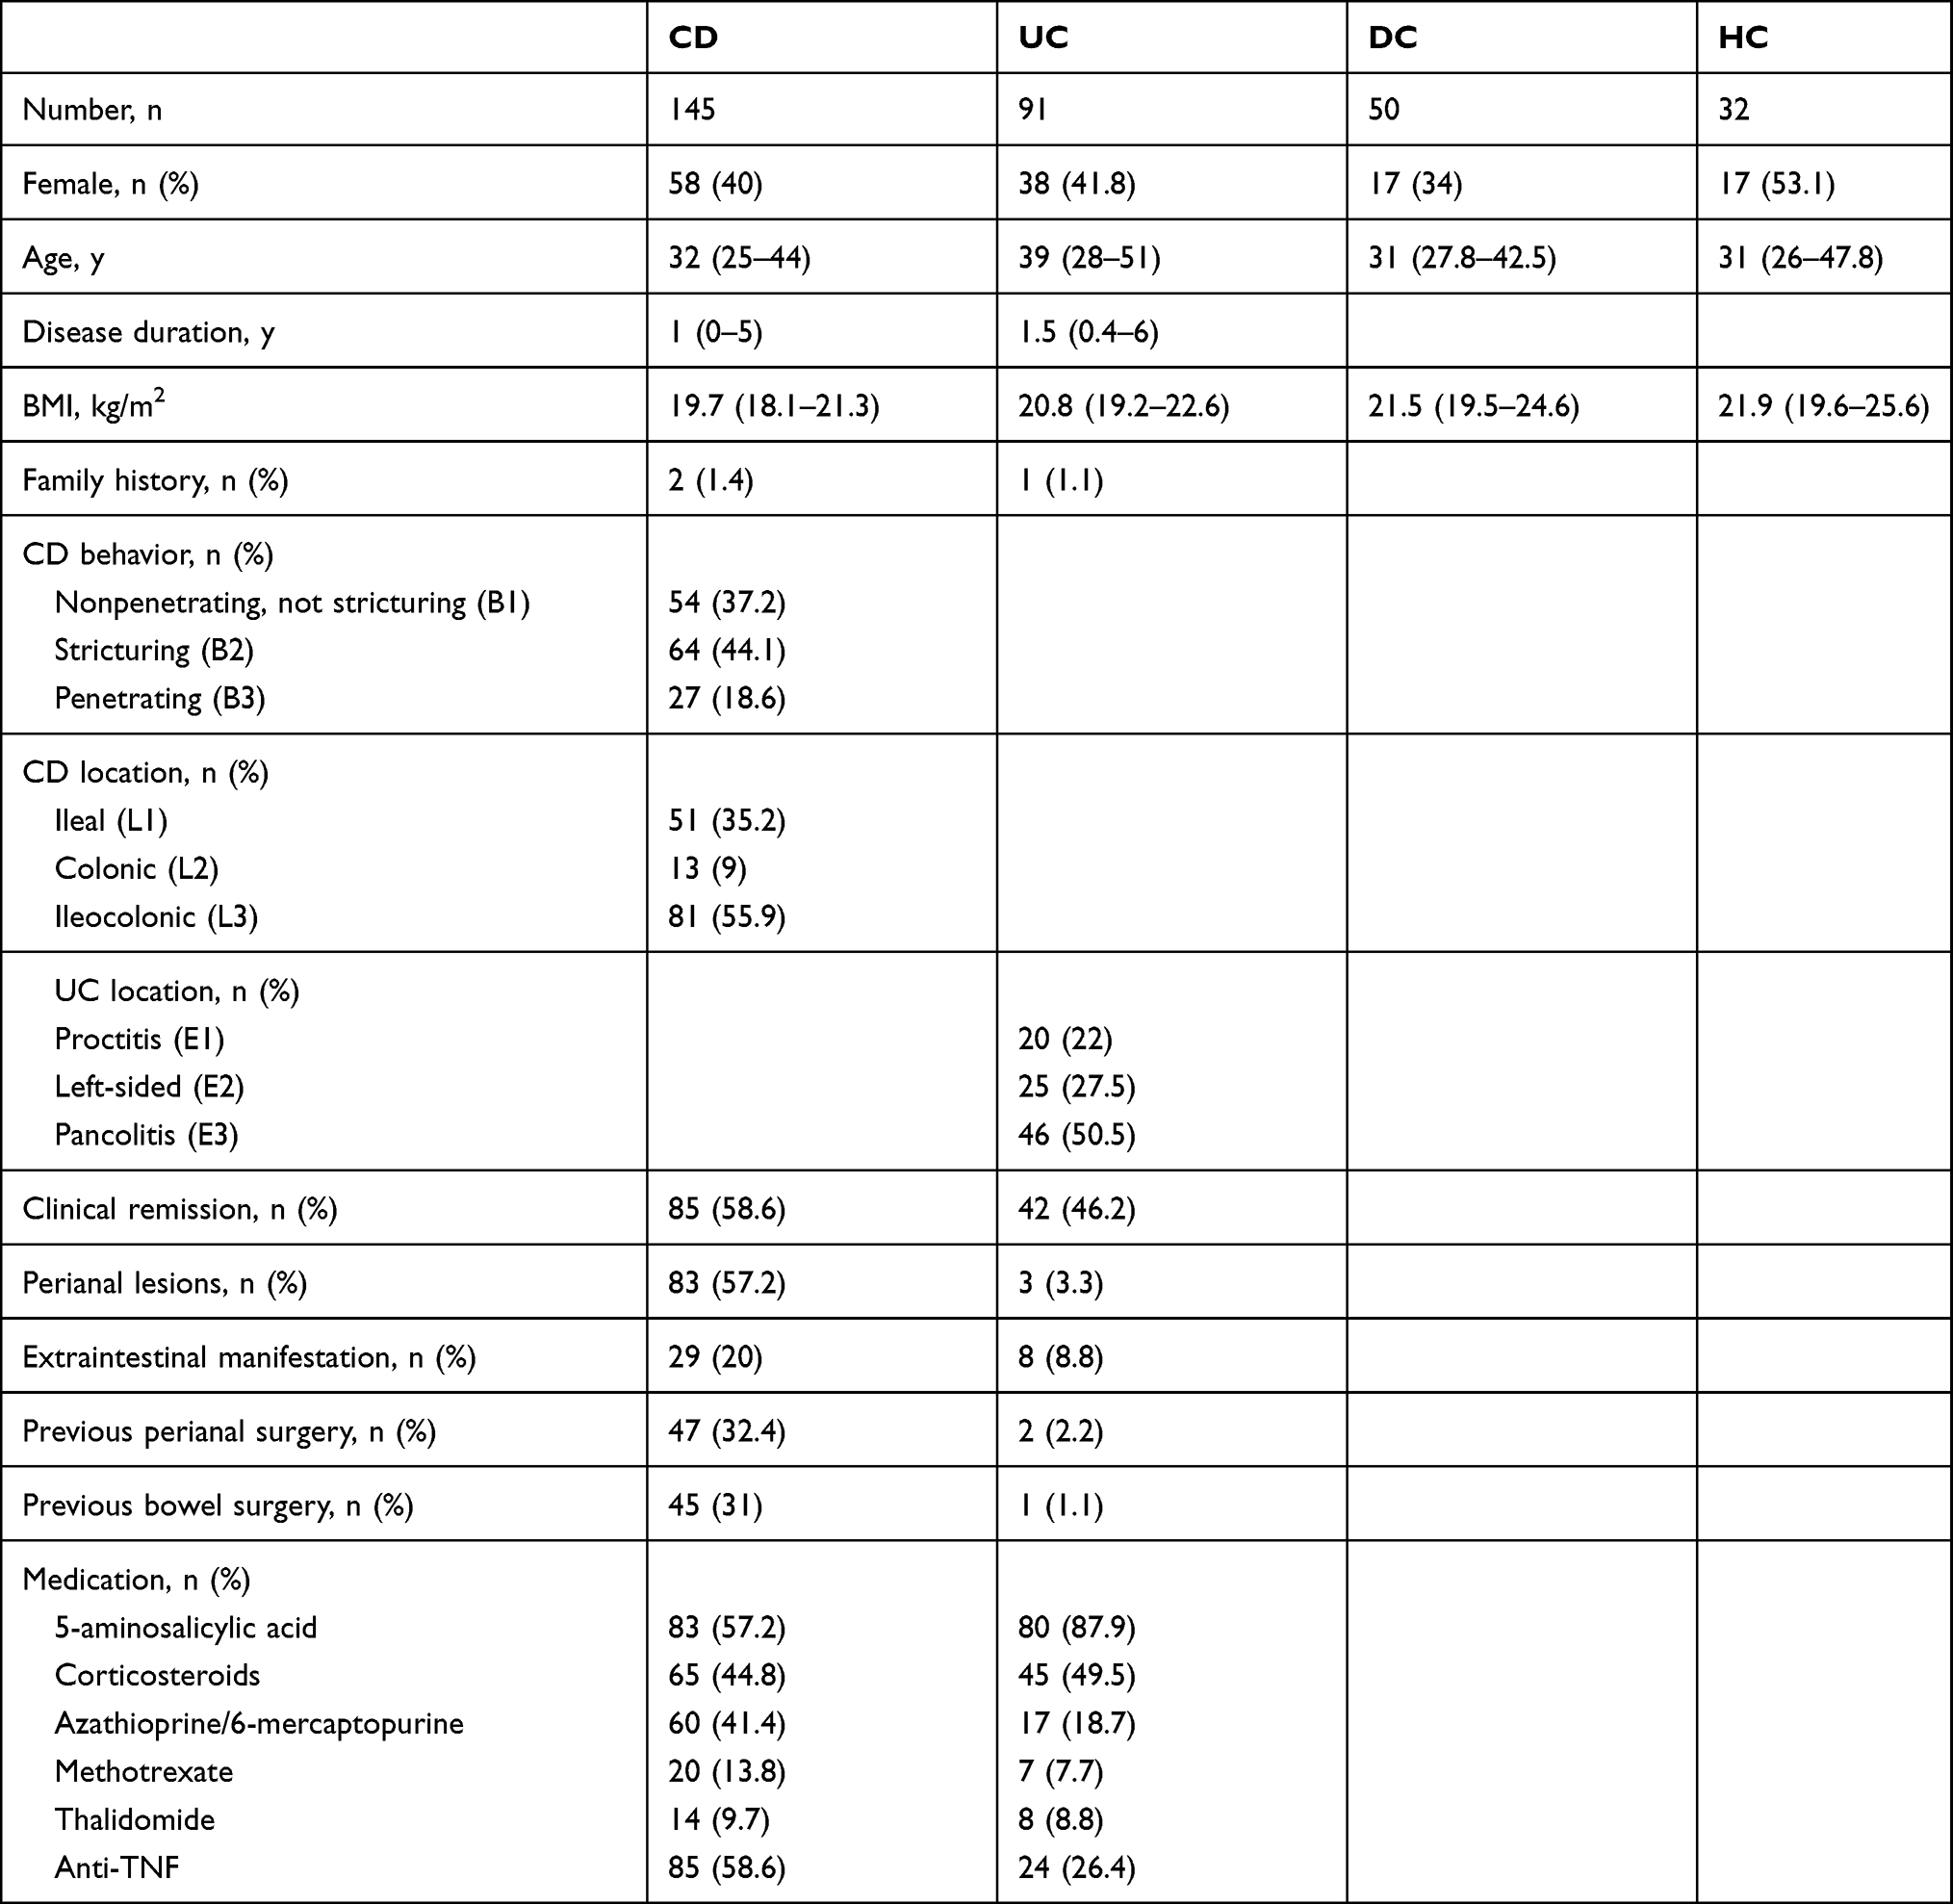 |
Table 1 Demographic and Clinical Characteristics of the Study Population in Group 1 |
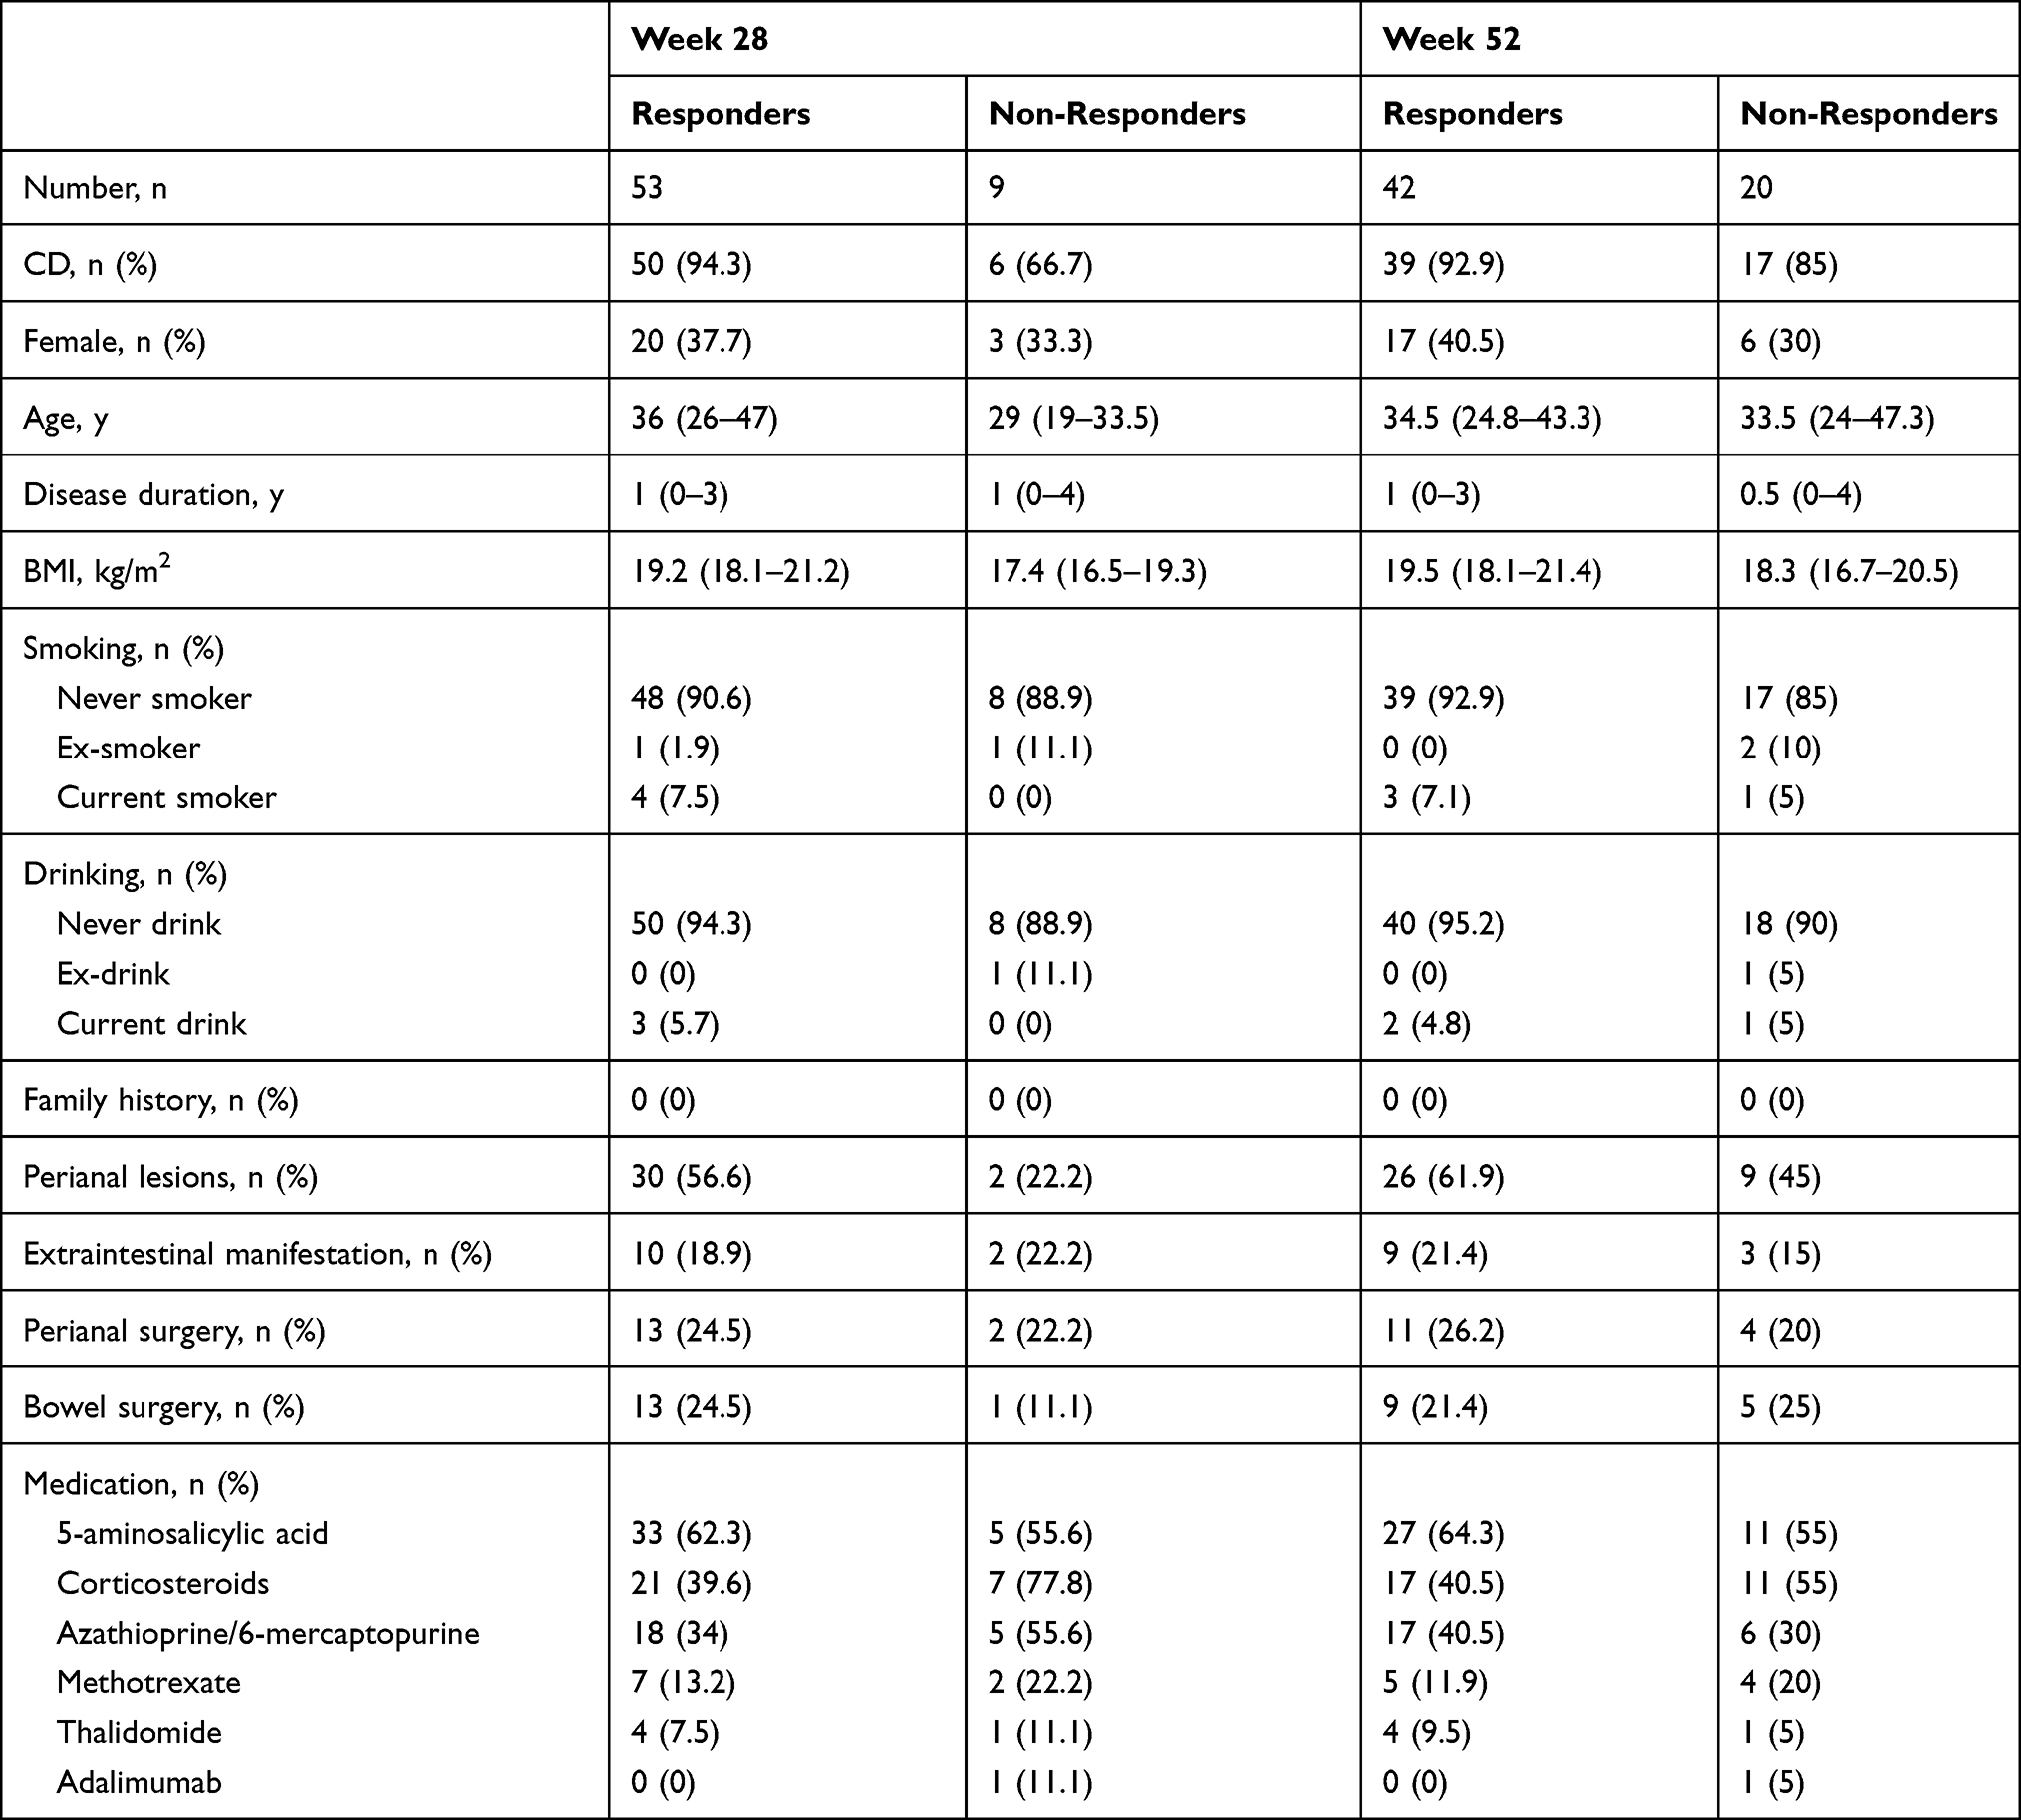 |
Table 2 Demographic and Clinical Characteristics of IBD Patients in Group 2 |
Fecal OSM and FC Levels are Increased in IBD
As is shown in Figure 1, fecal OSM and FC levels were increased in IBD patients compared to HC (P = 0.001 and P < 0.001, respectively) and DC (P = 0.006 and P < 0.001, respectively). The areas under the ROC curve (AUCs) of fecal OSM and FC to distinguish IBD patients from controls were 0.647 and 0.812, respectively. Their combination markedly improved the identification ability with an AUC of 0.93. There was a weak difference between IBD subtypes in fecal OSM levels (P = 0.01) with an AUC of 0.594, and no difference was observed in FC levels.
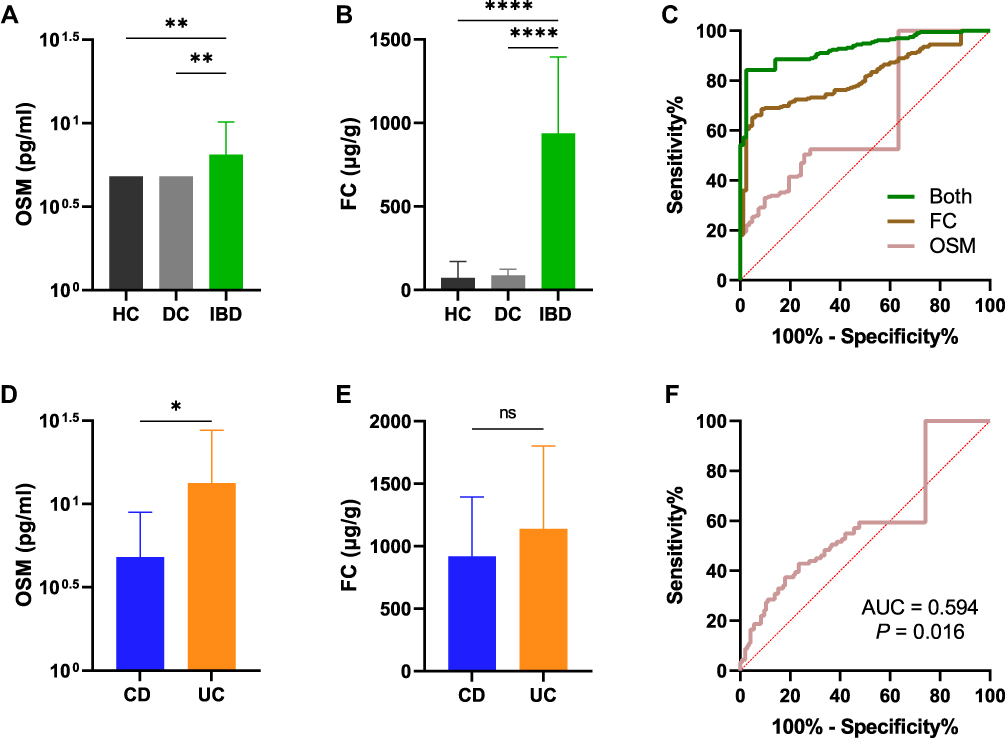 |
Figure 1 Elevated fecal OSM and FC levels in IBD. The expression of fecal OSM (A) and FC (B) in HC, DC, and IBD. (C) ROC curves of fecal OSM and FC in discriminating IBD from controls. Fecal OSM (D) and FC levels (E) in CD and UC. (F) The ROC curve of fecal OSM to identify IBD subtypes. In all panels, *P < 0.05, **P < 0.01, ****P < 0.0001. Abbreviation: ns, not significant. |
Fecal OSM and FC Levels are Associated with Clinical Activity
We examined the relationship between fecal biomarkers and clinical activity. Fecal OSM was highly expressed in moderate-to-severe patients with CD and UC (Figure 2A–C). FC levels were gradually increased with disease severity (Figure 2D–F). IBD patients with active disease had higher fecal OSM and FC levels than those in remission (Figure 2G and H). The AUCs of fecal OSM, FC, and their combination for identifying clinical remission were 0.674, 0.864, and 0.866, respectively (Figure 2I).
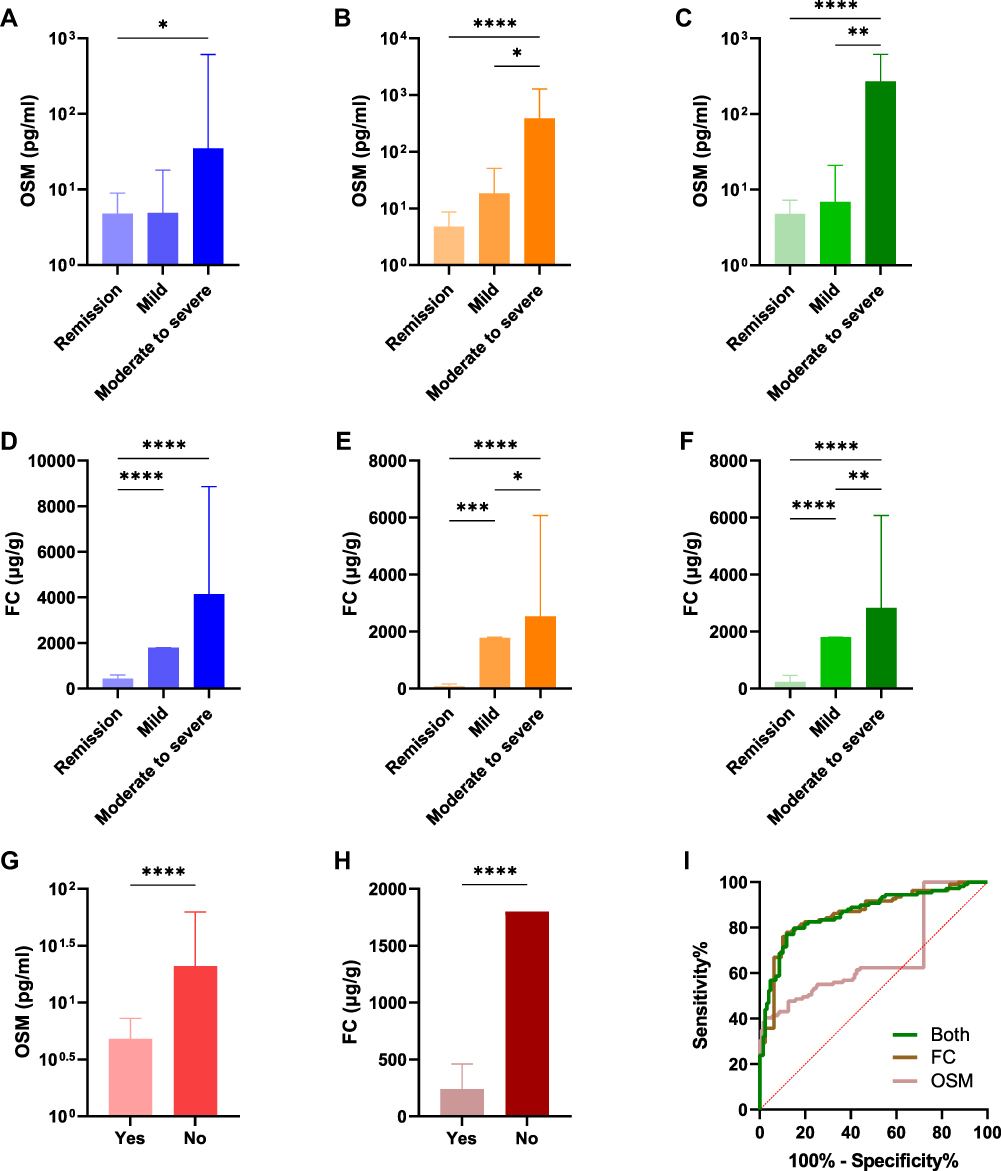 |
Figure 2 Correlations of fecal OSM and FC with clinical activity. The expression of fecal OSM in CD (A), UC (B), and combined CD and UC patients (C) classified by HBI or pMS. The expression of FC in CD (D), UC (E), and combined CD and UC patients (F) classified by HBI or pMS. The expression of fecal OSM (G) and FC (H) in IBD patients with and without clinical remission. (I) ROC curves of two fecal biomarkers to identify clinical remission. *P < 0.05, **P < 0.01, ***P < 0.001, ****P < 0.0001. |
Conventional blood biomarkers have been widely applied for disease monitoring, and their correlations with fecal biomarkers were explored. It indicated that fecal OSM and FC were significantly correlated in UC (ρ = 0.642, P < 0.001), but weakly correlated in CD (ρ = 0.21, P = 0.011, Supplementary Table 1). For active disease, a better correlation was observed in CD (ρ = 0.465, P < 0.001) and a similar correlation was observed in UC (ρ = 0.623, P < 0.001). FC was more closely associated with routine blood indicators than fecal OSM. Both of them were positively correlated with white blood cell count (WBC), platelet count (PLT), erythrocyte sedimentation rate (ESR), and CRP, but negatively correlated with hemoglobin (HB), ALB, and total bilirubin (T-Bili) in IBD.
Fecal OSM and FC Levels are Correlated with Endoscopic Activity
In the analysis of endoscopic activity, FC had a better correlation with SES-CD (OSM: ρ = 0.367, P = 0.042; FC: ρ = 0.732, P < 0.001) and MES (OSM: ρ = 0.36, P = 0.031; FC: ρ = 0.587, P < 0.001) than fecal OSM (Figure 3A–D). Patients with mucosal healing had lower fecal OSM (P = 0.006) and FC levels (P < 0.001) than those without mucosal healing (Figure 3E and F). FC was the best biomarker to identify mucosal healing in IBD (AUC = 0.921, Figure 3G), compared to fecal OSM (AUC = 0.702) and conventional blood indicators of WBC, HB, PLT, ESR, ALB, CRP, T-Bili, and blood urea nitrogen (Supplementary Table 2). The combination of these two fecal biomarkers slightly improved the discrimination ability with an AUC of 0.923.
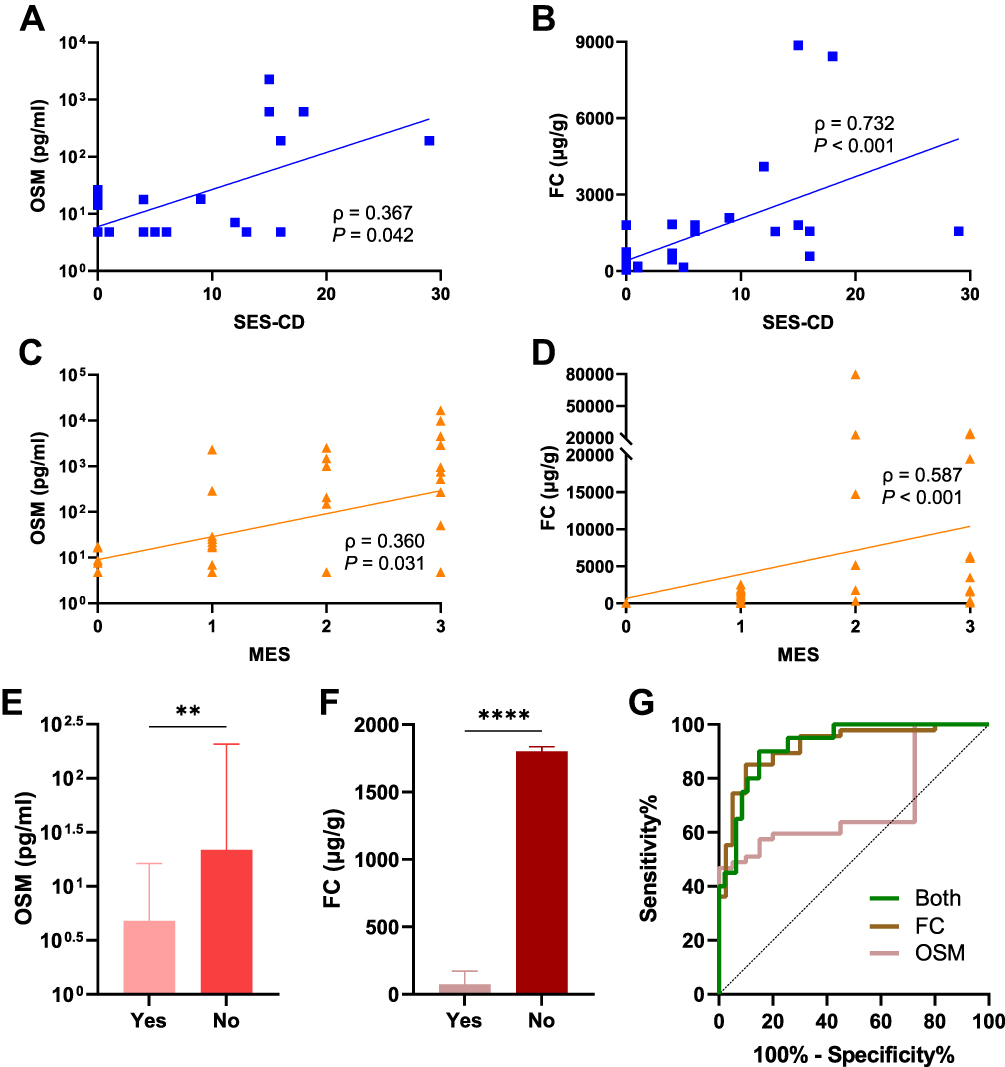 |
Figure 3 Correlations of fecal OSM and FC with endoscopic activity. Spearman correlation of fecal OSM (A) and FC expression (B) with SES-CD. Spearman correlation of fecal OSM (C) and FC expression (D) with MES. Fecal OSM (E) and FC levels (F) in IBD patients with and without mucosal healing. (G) ROC curves of two fecal biomarkers to identify mucosal healing. **P < 0.01, ****P < 0.0001. |
Elevated Fecal OSM and FC Levels Predict Therapeutic Nonresponse
At week 28, clinical non-responders had higher fecal OSM and FC levels than responders (P = 0.002 and P < 0.001, respectively, Figure 4A and B). The AUC of fecal OSM for predicting therapeutic response was 0.763 with a cut-off value of 132.4 pg/mL (sensitivity = 0.667, specificity = 0.925, Figure 4C). FC levels could predict therapeutic response with an AUC of 0.834 and a cut-off value of 4972 μg/g (sensitivity = 0.778, specificity = 0.868). Despite an inferior predictive ability, fecal OSM was more specific than FC. The combination of two fecal biomarkers (AUC = 0.859) was superior to conventional blood indicators (AUC = 0.842) in predicting therapeutic response (Figure 4D). Combined use of fecal and blood biomarkers significantly enhanced predictive accuracy with an AUC of 0.919.
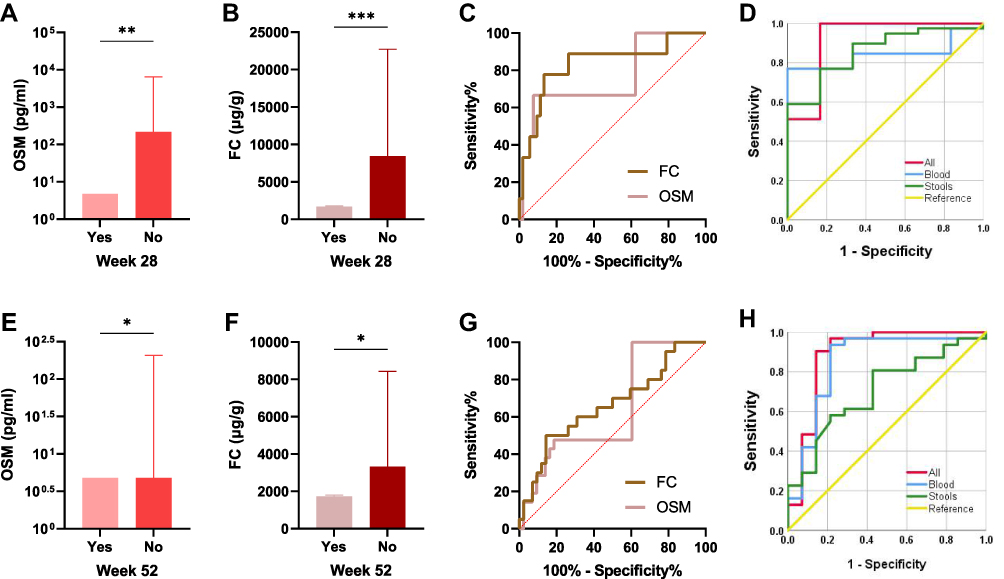 |
Figure 4 Elevated fecal OSM and FC levels in therapeutic non-responders. Baseline fecal OSM (A) and FC levels (B) in predicting therapeutic response at week 28. (C and D) ROC curves of fecal and blood biomarkers to predict therapeutic response at week 28. Baseline fecal OSM (E) and FC levels (F) in predicting therapeutic response at week 52. (G and H) ROC curves of fecal and blood biomarkers to predict therapeutic response at week 52. *P < 0.05, **P < 0.01, ***P < 0.001. |
At week 52, clinical non-responders had higher fecal OSM (P = 0.027) and FC levels (P = 0.041) than responders (Figure 4E and F). The AUCs of fecal OSM and FC for predicting therapeutic response were 0.638 and 0.661, respectively (Figure 4G). As an independent predictor, fecal OSM and FC performed better than blood indicators of WBC, HB, ESR, ALB, CRP, and T-Bili at week 28 and 52 (Supplementary Table 3). Nevertheless, the combination of routine blood indicators (AUC = 0.848) exhibited a better predictive ability than fecal biomarkers (AUC = 0.704) at week 52 (Figure 4H). The improved AUC was 0.887 when fecal and blood biomarkers were combined to predict therapeutic response.
Discussion
Although endoscopy can never be completely replaced, fecal and blood biomarkers can provide noninvasive, repeatable, and cost-effective assays for disease monitoring in IBD.28,29 Compared with blood indicators, fecal biomarkers such as FC that directly contact inflamed intestines are more desirable for clinical routines. This research provided the first evidence that OSM was a novel fecal biomarker, along with FC, and their combination was more beneficial for IBD management in specific clinical situations.
In active IBD, fecal OSM showed a significant correlation with FC, indicating that fecal OSM may have similar potential usefulness as FC. Consistent with previous reports on FC,30,31 OSM was also identified as a specific fecal biomarker, which is highly expressed in IBD patients, but not in non-IBD patients or healthy controls. Notably, the diagnostic value of their combination outperformed FC alone. When IBD subtypes were analyzed, no difference was observed in FC levels, and fecal OSM displayed poor recognition ability. To date, no available biomarkers have been successfully implemented to distinguish IBD subtypes with high sensitivity and specificity.32,33
Consistent with previous studies on FC,34–36 we found that these two fecal biomarkers were positively associated with clinical and endoscopic activity and that FC was superior to fecal OSM and routine blood indicators in assessing intestinal inflammation. FC remains the most reliable biomarker to identify mucosal healing. The addition of fecal OSM slightly improved recognition ability. Given the cost issue of clinical application, their combination was recommended for disease diagnosis but not for disease activity.
Currently, there is an unmet need to find noninvasive surrogate biomarkers for endoscopy to guide IBD patients receiving IFX therapy. CRP is the most widely used blood indicator, and its high expression has been proven to correlate with clinical nonresponse.37–39 Nevertheless, it lacks specificity, and a considerable proportion of patients are within the normal range.40 Numerous studies have confirmed that FC was a potential biomarker to predict therapeutic response,41–44 and the predictive AUC for clinical relapse was 0.888 at week 8.45 Stevens et al46 reported that AUCs predicted by FC for mucosal healing were 0.77 at week 8 and 0.79 at week 52. The assessment of predictive power exhibited poor reproducibility due to different definitions of therapeutic response, detection methods, sample sizes, lengths of follow-up time, and IBD subtypes. Our results indicated that FC had a good predictive ability at week 28 (AUC = 0.834) but weak predictive ability at week 52 (AUC = 0.661).
Nowadays, there are few studies examining the function of OSM in the prognosis of IBD. West et al13 first revealed that mucosal OSM was highly expressed in anti-TNF refractory patients. However, Ladipo et al47 claimed that OSM in intestinal biopsies could not predict therapeutic response in a pediatric cohort. Similarly, whether OSM in the blood can predict therapeutic response remains controversial.15,17,19 In this work, our results suggested that fecal OSM was a novel biomarker to predict IFX response. Intriguingly, fecal OSM and FC were superior to conventional blood indicators such as ESR, ALB, and CRP in independently predicting therapeutic response at week 28 and 52. Compared to routine blood indicators, the combination of two fecal biomarkers demonstrated superior predictive ability with fewer biomarkers and higher specificity at week 28. Despite the increased cost of more fecal biomarkers, fecal OSM was more specific than FC in predicting clinical response at week 28, and their combination improved predictive power at week 28 and 52. The combined use of fecal and blood biomarkers has been demonstrated to be a feasible strategy for enhancing predictive accuracy.28,48 The improved AUC was 0.919 at week 28 and 0.887 at week 52, which exhibited an even stronger predictive ability than previous studies.49,50
The present study had certain limitations. First, approximately half of IBD patients were in clinical remission in group 1, and their low expression of fecal OSM may impair the accuracy of the results. Second, we did not observe dynamic changes in fecal OSM and FC levels when monitoring disease activity or predicting therapeutic response. Besides, the small sample size may introduce analytical bias. Additional multi-center studies with large-scale populations are needed to verify the predictive power of fecal and blood indicators.
Conclusion
In conclusion, we demonstrated that OSM was a novel fecal biomarker, along with FC, and that their combination was more clinically valuable for disease diagnosis and prediction of therapeutic response, but not for disease activity in IBD patients. Combining these two fecal biomarkers with conventional blood indicators was recommended for predicting therapeutic response. More prospective studies with a large-scale sample size are required to validate our observations.
Abbreviations
IBD, inflammatory bowel disease; CD, Crohn’s disease; UC, ulcerative colitis; IFX, infliximab; anti-TNF; anti-tumor necrosis factor; CRP, C-reactive protein, ALB, albumin; FC, fecal calprotectin; IBS, irritable bowel syndrome; OSM, oncostatin M; DC, disease control; HBI, Harvey-Bradshaw Index; pMS, partial Mayo score; SES-CD, Simple Endoscopic Score for CD; MES, Mayo endoscopic subscore; HC, healthy controls; ROC, receiver operator characteristic curve; AUC, area under the curve; WBC, white blood cell count; PLT, platelet count; ESR, erythrocyte sedimentation rate; HB, hemoglobin; T-Bili, total bilirubin.
Acknowledgments
We thank the Clinical Research Center from Zhejiang University School of Medicine Second Affiliated Hospital for essential technical support.
Author Contributions
All authors made substantial contributions to conception and design, acquisition of data, analysis and interpretation of data; took part in drafting the article or revising it critically for important intellectual content; agreed to submit to the current journal; gave final approval of the version to be published; and agreed to be accountable for all aspects of the work.
Funding
This work was supported by the National Natural Science Foundation of China [No. 81902156 and 81700455] and Zhejiang Provincial Natural Science Foundation of China [No. LQ21H160016].
Disclosure
The authors report no conflicts of interest in this work.
References
1. Irving P, de Lusignan S, Tang D, et al. Risk of common infections in people with inflammatory bowel disease in primary care: a population-based cohort study. BMJ Open Gastroenterol. 2021;8(1):e000573. doi:10.1136/bmjgast-2020-000573
2. Ben-Horin S, Chowers Y. Tailoring anti-TNF therapy in IBD: drug levels and disease activity. Nat Rev Gastroenterol Hepatol. 2014;11(4):243–255. doi:10.1038/nrgastro.2013.253
3. Guerra I, Bermejo F. Management of inflammatory bowel disease in poor responders to infliximab. Clin Exp Gastroenterol. 2014;7:359–367. doi:10.2147/CEG.S45297
4. Annese V, Daperno M, Rutter M, et al. European evidence based consensus for endoscopy in inflammatory bowel disease. J Crohn's Colitis. 2013;7(12):982–1018. doi:10.1016/j.crohns.2013.09.016
5. Chen Y, Wang L, Feng S, et al. The Relationship between C-Reactive Protein/Albumin Ratio and Disease Activity in Patients with Inflammatory Bowel Disease. Gastroenterol Res Pract. 2020;2020:3467419. doi:10.1155/2020/3467419
6. Johne B, Fagerhol M, Lyberg T, et al. Functional and clinical aspects of the myelomonocyte protein calprotectin. Mol Pathol. 1997;50(3):113–123. doi:10.1136/mp.50.3.113
7. Schoepfer AM, Trummler M, Seeholzer P, et al. Discriminating IBD from IBS: comparison of the test performance of fecal markers, blood leukocytes, CRP, and IBD antibodies. Inflamm Bowel Dis. 2008;14(1):32–39. doi:10.1002/ibd.20275
8. Tibble JA, Bjarnason I. Non-invasive investigation of inflammatory bowel disease. World J Gastroenterol. 2001;7(4):460–465. doi:10.3748/wjg.v7.i4.460
9. Kostas A, Siakavellas S, Kosmidis C, et al. Fecal calprotectin measurement is a marker of short-term clinical outcome and presence of mucosal healing in patients with inflammatory bowel disease. World J Gastroenterol. 2017;23(41):7387–7396. doi:10.3748/wjg.v23.i41.7387
10. Kallel L, Ayadi I, Matri S, et al. Fecal calprotectin is a predictive marker of relapse in Crohn’s disease involving the colon: a prospective study. Eur J Gastroenterol Hepatol. 2010;22(3):340–345. doi:10.1097/MEG.0b013e32832bab49
11. Walsh A, Kormilitzin A, Hinds C, et al. Defining Faecal Calprotectin Thresholds as a Surrogate for Endoscopic and Histological Disease Activity in Ulcerative Colitis-a Prospective Analysis. J Crohn's Colitis. 2019;13(4):424–430. doi:10.1093/ecco-jcc/jjy184
12. Jones S, Jenkins B. Recent insights into targeting the IL-6 cytokine family in inflammatory diseases and cancer. Nat Rev Immunol. 2018;18(12):773–789. doi:10.1038/s41577-018-0066-7
13. West N, Hegazy A, Owens B, et al. Oncostatin M drives intestinal inflammation and predicts response to tumor necrosis factor-neutralizing therapy in patients with inflammatory bowel disease. Nat Med. 2017;23(5):579–589. doi:10.1038/nm.4307
14. Verstockt S, Verstockt B, Machiels K, et al. Oncostatin M Is a Biomarker of Diagnosis, Worse Disease Prognosis, and Therapeutic Nonresponse in Inflammatory Bowel Disease. Inflamm Bowel Dis. 2021;27(10):1564–1575. doi:10.1093/ibd/izab032
15. Verstockt B, Verstockt S, Dehairs J, et al. Low TREM1 expression in whole blood predicts anti-TNF response in inflammatory bowel disease. EBioMedicine. 2019;40:733–742. doi:10.1016/j.ebiom.2019.01.027
16. Nishioka K, Ogino H, Chinen T, et al. Mucosal IL23A expression predicts the response to Ustekinumab in inflammatory bowel disease. J Gastroenterol. 2021;56(11):976–987. doi:10.1007/s00535-021-01819-7
17. Minar P, Lehn C, Tsai Y, et al. Elevated Pretreatment Plasma Oncostatin M Is Associated With Poor Biochemical Response to Infliximab. Crohn’s & Colitis. 2019;1(3):otz026. doi:10.1093/crocol/otz026
18. Mateos B, Sáez-González E, Moret I, et al. Plasma Oncostatin M, TNF-α, IL-7, and IL-13 Network Predicts Crohn’s Disease Response to Infliximab, as Assessed by Calprotectin Log Drop. Dig Dis. 2021;39(1):1–9. doi:10.1159/000508069
19. Bertani L, Fornai M, Fornili M, et al. Serum oncostatin M at baseline predicts mucosal healing in Crohn’s disease patients treated with infliximab. Aliment Pharmacol Ther. 2020;52(2):284–291. doi:10.1111/apt.15870
20. Kalla R, Adams A, Bergemalm D, et al. Serum proteomic profiling at diagnosis predicts clinical course, and need for intensification of treatment in inflammatory bowel disease. J Crohn's Colitis. 2021;15(5):699–708. doi:10.1093/ecco-jcc/jjaa230
21. Gong Y, Yan X, Sun X, et al. Oncostatin M Is a Prognostic Biomarker and Inflammatory Mediator for Sepsis. J Infect Dis. 2020;221(12):1989–1998. doi:10.1093/infdis/jiaa009
22. Tsui F, Lin A, Sari I, et al. Serial Lipocalin 2 and Oncostatin M levels reflect inflammation status and treatment response in axial spondyloarthritis. Arthritis Res Ther. 2021;23(1):141. doi:10.1186/s13075-021-02521-y
23. Maaser C, Sturm A, Vavricka SR, et al. ECCO-ESGAR Guideline for Diagnostic Assessment in IBD Part 1: initial diagnosis, monitoring of known IBD, detection of complications. J Crohn's Colitis. 2019;13(2):144–164. doi:10.1093/ecco-jcc/jjy113
24. Schroeder K, Tremaine W, Ilstrup D. Coated oral 5-aminosalicylic acid therapy for mildly to moderately active ulcerative colitis. A randomized study. N Engl J Med. 1987;317(26):1625–1629. doi:10.1056/NEJM198712243172603
25. Harvey R, Bradshaw J. A simple index of Crohn’s-disease activity. Lancet. 1980;1(8167):514. doi:10.1016/S0140-6736(80)92767-1
26. Daperno M, D’Haens G, Van Assche G, et al. Development and validation of a new, simplified endoscopic activity score for Crohn’s disease: the SES-CD. Gastrointest Endosc. 2004;60(4):505–512. doi:10.1016/S0016-5107(04)01878-4
27. Rutgeerts P, Sandborn W, Feagan B, et al. Infliximab for induction and maintenance therapy for ulcerative colitis. N Engl J Med. 2005;353(23):2462–2476. doi:10.1056/NEJMoa050516
28. Mak L, Tong T, Cheung K, et al. Combined Use of Common Fecal and Blood Markers for Detection of Endoscopically Active Inflammatory Bowel Disease. Clin Transl Gastroenterol. 2020;11(3):e00138. doi:10.14309/ctg.0000000000000138
29. Takaki Y, Mizuochi T, Eda K, et al. Laboratory values in Japanese children with newly diagnosed inflammatory bowel disease. Pediatr Int. 2019;61(7):720–725. doi:10.1111/ped.13892
30. Vitali R, Stronati L, Negroni A, et al. Fecal HMGB1 is a novel marker of intestinal mucosal inflammation in pediatric inflammatory bowel disease. Am J Gastroenterol. 2011;106(11):2029–2040. doi:10.1038/ajg.2011.231
31. Chang M, Chou J, Chen S, et al. Faecal calprotectin as a novel biomarker for differentiating between inflammatory bowel disease and irritable bowel syndrome. Mol Med Report. 2014;10(1):522–526. doi:10.3892/mmr.2014.2180
32. Bennike T, Birkelund S, Stensballe A, et al. Biomarkers in inflammatory bowel diseases: current status and proteomics identification strategies. World J Gastroenterol. 2014;20(12):3231–3244. doi:10.3748/wjg.v20.i12.3231
33. Shen J, Qiao Y, Ran Z, et al. Intestinal protein expression profile identifies inflammatory bowel disease and predicts relapse. Int J Clin Exp Pathol. 2013;6(5):917–925.
34. Shimoyama T, Yamamoto T, Umegae S, et al. Faecal biomarkers for screening small bowel inflammation in patients with Crohn’s disease: a prospective study. Therap Adv Gastroenterol. 2017;10(8):577–587. doi:10.1177/1756283X17717683
35. Canani R, Terrin G, Rapacciuolo L, et al. Faecal calprotectin as reliable non-invasive marker to assess the severity of mucosal inflammation in children with inflammatory bowel disease. Dig Liver Dis. 2008;40(7):547–553. doi:10.1016/j.dld.2008.01.017
36. Ye L, Cheng W, Chen B, et al. Levels of Faecal Calprotectin and Magnetic Resonance Enterocolonography Correlate with Severity of Small Bowel Crohn’s Disease: a Retrospective Cohort Study. Sci Rep. 2017;7(1):1970. doi:10.1038/s41598-017-02111-6
37. Magro F, Rodrigues-Pinto E, Santos-Antunes J, et al. High C-reactive protein in Crohn’s disease patients predicts nonresponse to infliximab treatment. J Crohn's Colitis. 2014;8(2):129–136. doi:10.1016/j.crohns.2013.07.005
38. Oh K, Oh EH, Baek S, et al. Elevated C-reactive protein level during clinical remission can predict poor outcomes in patients with Crohn’s disease. PLoS One. 2017;12(6):e0179266. doi:10.1371/journal.pone.0179266
39. Mańkowska-Wierzbicka D, Karczewski J, Poniedziałek B, et al. C-reactive protein as a diagnostic and prognostic factor in inflammatory bowel diseases. Postepy Hig Med Dosw. 2016;70:1124–1130. doi:10.5604/17322693.1223798
40. Henriksen M, Jahnsen J, Lygren I, et al. C-reactive protein: a predictive factor and marker of inflammation in inflammatory bowel disease. Results from a prospective population-based study. Gut. 2008;57(11):1518–1523. doi:10.1136/gut.2007.146357
41. Buisson A, Mak W, Andersen M, et al. Faecal Calprotectin Is a Very Reliable Tool to Predict and Monitor the Risk of Relapse After Therapeutic De-escalation in Patients With Inflammatory Bowel Diseases. J Crohn's Colitis. 2019;13(8):1012–1024. doi:10.1093/ecco-jcc/jjz023
42. Kwapisz L, Gregor J, Chande N, et al. The utility of fecal calprotectin in predicting the need for escalation of therapy in inflammatory bowel disease. Scand J Gastroenterol. 2017;52(8):846–850. doi:10.1080/00365521.2017.1315740
43. Rottenstreich A, Mishael T, Granovsky S, et al. Clinical utility of fecal calprotectin in monitoring disease activity and predicting relapse in pregnant patients with inflammatory bowel diseases. Eur J Intern Med. 2020;77:105–110. doi:10.1016/j.ejim.2020.03.015
44. Sorrentino D, Terrosu G, Paviotti A, et al. Early diagnosis and treatment of postoperative endoscopic recurrence of Crohn’s disease: partial benefit by infliximab–a pilot study. Dig Dis Sci. 2012;57(5):1341–1348. doi:10.1007/s10620-011-2025-z
45. Ferreiro-Iglesias R, Barreiro-de Acosta M, Otero Santiago M, et al. Fecal Calprotectin as Predictor of Relapse in Patients With Inflammatory Bowel Disease Under Maintenance Infliximab Therapy. J Clin Gastroenterol. 2016;50(2):147–151. doi:10.1097/MCG.0000000000000312
46. Stevens T, Gecse K, Turner J, et al. Diagnostic Accuracy of Fecal Calprotectin Concentration in Evaluating Therapeutic Outcomes of Patients With Ulcerative Colitis. Clin Gastroenterol Hepatol. 2020;19(11):2333–2342. doi:10.1016/j.cgh.2020.08.019
47. Ladipo J, He Z, Chikwava K, et al. Oncostatin-M Does Not Predict Treatment Response in Inflammatory Bowel Disease in a Pediatric Cohort. J Pediatr Gastroenterol Nutr. 2021;73(3):352–357. doi:10.1097/MPG.0000000000003201
48. Dragoni G, Innocenti T, Galli A. Biomarkers of Inflammation in Inflammatory Bowel Disease: how Long before Abandoning Single-Marker Approaches? Dig Dis. 2021;39(3):190–203. doi:10.1159/000511641
49. Ishida N, Miyazu T, Takano R, et al. Prostaglandin E-major urinary metabolite versus fecal immunochemical occult blood test as a biomarker for patient with ulcerative colitis. BMC Gastroenterol. 2020;20(1):114. doi:10.1186/s12876-020-01256-5
50. Con D, Parthasarathy N, Bishara M, et al. Development of a Simple, Serum Biomarker-based Model Predictive of the Need for Early Biologic Therapy in Crohn’s Disease. J Crohn's Colitis. 2021;15(4):583–593. doi:10.1093/ecco-jcc/jjaa194
 © 2021 The Author(s). This work is published and licensed by Dove Medical Press Limited. The full terms of this license are available at https://www.dovepress.com/terms.php and incorporate the Creative Commons Attribution - Non Commercial (unported, v3.0) License.
By accessing the work you hereby accept the Terms. Non-commercial uses of the work are permitted without any further permission from Dove Medical Press Limited, provided the work is properly attributed. For permission for commercial use of this work, please see paragraphs 4.2 and 5 of our Terms.
© 2021 The Author(s). This work is published and licensed by Dove Medical Press Limited. The full terms of this license are available at https://www.dovepress.com/terms.php and incorporate the Creative Commons Attribution - Non Commercial (unported, v3.0) License.
By accessing the work you hereby accept the Terms. Non-commercial uses of the work are permitted without any further permission from Dove Medical Press Limited, provided the work is properly attributed. For permission for commercial use of this work, please see paragraphs 4.2 and 5 of our Terms.