")
Back to Journals » Drug Design, Development and Therapy » Volume 16
Combined Treatment of Tanshinone I and Epirubicin Revealed Enhanced Inhibition of Hepatocellular Carcinoma by Targeting PI3K/AKT/HIF-1α
Authors Zhao J, Lin E, Cai C, Zhang M, Li D, Cai S, Zeng G, Yin Z, Wang B, Li P, Hong X, Chen J, Zou B, Li J
Received 1 February 2022
Accepted for publication 25 August 2022
Published 19 September 2022 Volume 2022:16 Pages 3197—3213
DOI https://doi.org/10.2147/DDDT.S360691
Checked for plagiarism Yes
Review by Single anonymous peer review
Peer reviewer comments 2
Editor who approved publication: Dr Jianbo Sun
Jiali Zhao,1 En Lin,1 Chaonong Cai,1 Manyao Zhang,2 Decheng Li,1 Shanglin Cai,1 Guifang Zeng,1 Zeren Yin,1 Bo Wang,1 Peiping Li,1 Xiaopeng Hong,1 Jiafan Chen,1 Baojia Zou,1 Jian Li1
1Department of Hepatobiliary Surgery, Fifth Affiliated Hospital of Sun Yat-sen University, Zhuhai, People’s Republic of China; 2Department of Anesthesiology, Fifth Affiliated Hospital of Sun Yat-sen University, Zhuhai, People’s Republic of China
Correspondence: Jian Li; Baojia Zou, Department of Hepatobiliary Surgery, Fifth Affiliated Hospital of Sun Yat-sen University, Zhuhai, People’s Republic of China, Tel +86-756-252-8781, Fax +86-756-252-8166, Email [email protected]; [email protected]
Background: Epirubicin (EADM) is a common chemotherapeutic agent in hepatocellular carcinoma (HCC). The accumulation of hypoxia-inducible factor-1α (HIF-1α) is an important cause of drug resistance to EADM in HCC. Tanshinone I (Tan I) is an agent with promising anti-cancer effects alone or with other drugs. Some tanshinones mediate HIF-1α regulation via PI3K/AKT. However, the role of Tan I combined with EADM to reduce the resistance of HCC to EADM has not been investigated. Therefore, this study aimed to investigate the combined use of Tan I and EADM in HCC and the underlying mechanism of PI3K/AKT/HIF-1α.
Methods: HCC cells were treated with Tan I, EADM, or the combined treatment for 48 hrs. Cell transfection was used to construct HIF-1α overexpression HCC stable cells. Cell viability, colony formation, and flow cytometric assays were used to detect the viability, proliferation, and apoptosis in HCC cells. Synergism between Tan I and EADM were tested by calculating the Bliss synergy score, positive excess over bliss additivism (EOBA), and the combination index (CI). Western blotting analyses were used to detect the levels of β-actin, HIF-1α, PI3K p110α, p-Akt Thr308, Cleaved Caspase-3, and Cleaved Caspase-9. Toxicity parameters were used to evaluate the safety of the combination in mice. The xenograft model of mice was built by HCC stable cell lines, which was administrated with Tan I, EADM, or a combination of them for 8 weeks. Immunohistochemistry staining (IHC) was used to assess tumor apoptosis in mouse models.
Results: Hypoxia could upregulate HIF-1α to induce drug resistance in HCC cancer cells. The combination of Tan I and EADM was synergistic. Although Tan I or EADM alone could inhibit HCC cancer cells, the combination of them could further enhance the cytotoxicity and growth inhibition by targeting the PI3K/AKT/HIF-1α signaling pathway. Furthermore, Tan I and EADM synergistically reversed HIF-1α-mediated drug resistance to inhibit HCC. The results of toxicity parameters showed that the combination was safe in mice. Meanwhile, animal models showed that Tan I not only improved the anti-tumor effect of EADM, but also reduced the drug reactions of EADM-induced weight loss.
Conclusion: Our results suggested that Tan I could effectively improve the anti-tumor effect of EADM, and synergize EADM to reverse HIF-1α mediated resistance via targeting PI3K/AKT/HIF-1α signaling pathway.
Keywords: hepatocellular carcinoma, epirubicin, Tanshinone I, HIF-1α, resistance
Introduction
Hepatocellular carcinoma (HCC) is one of the most malignant tumors worldwide.1 While surgery remains the only curable option for early-stage patients, chemotherapy is mainly adopted for the prevention of post-surgical recurrence and the treatment of advance-staged diseases.2–4 Epirubicin (EADM) is a frequently used chemotherapeutic agent in HCC.5 Existing studies have shown that epirubicin inhibits cancer cells by intercalating into DNA strands to inhibit DNA and RNA synthesis.6,7 However, there is a high probability of adverse reactions (acute dose-limiting hematological toxicity, cardiotoxicity, gastrointestinal stress, weight loss, and alopecia) and resistance to EADM, leading to treatment failure.8–10 Therefore, effective agents are needed to improve the effectiveness of chemotherapy.
Tanshinones are derivatives from the herbal salvia miltiorrhiza which show great potential in anti-cancer therapies.11 Tanshinone I (also known as Tanshinone A, Tan I) is a less-studied agent of this kind, and also possesses powerful cancer-killing effects. Recent studies have shown that Tan I can inhibit the proliferation and induce apoptosis of cancer cells through the PI3K/AKT/mTOR signaling pathway, JAK/STAT3 signaling pathway, or by activating AMP-activated protein kinase.11–17 Prior studies have also indicated the effective use of tanshinones combined with sorafenib, cisplatin, and other drugs in solid tumors.18–20 However, the potential combination of Tan I and EADM in HCC has not yet been studied.
Hypoxia inducible factor-1α (HIF-1α) is a key target of tanshinones.21–23 Meanwhile, the accumulation of HIF-1α is an important cause of drug resistance to many chemotherapies.24 Strategies inhibiting HIF-1α have been shown to improve the efficacy of EADM in treating several types of cancer including HCC.25–27 There is evidence pointing to the regulation of HIF-1α by tanshinones via PI3K/AKT signaling.28 But the mechanism concerning the signaling pathway is not clarified in the action of Tan I. Therefore, the purpose of this study was to investigate the novel combined use of Tan I and EADM in HCC. Meanwhile, we hypothesized that Tan I can increase the efficacy of EADM by downregulation of HIF-1α via PI3K/AKT signaling.
Materials and Methods
Cell Culture
HCC cancer cell lines (HepG2, Huh7) were obtained from the Cancer Center, Sun Yat-sen University, Guangzhou, Guangdong, People’s Republic of China. All cells were cultured in Dulbecco modified eagle medium (DMEM medium, Gibco, USA), which was supplemented with 10% fetal bovine serum (FBS), 50 U/mol penicillin (Sigma-Aldrich, USA), and 50 mg/mL streptomycin (Sigma-Aldrich, USA). Tan I was purchased from Selleck (Lot No. S236403). The physicochemical properties of Tan I are: Molecular formula: C18H12O3; Molecular weight: 276.29; Solubility: easily soluble in methanol, ethanol, DMSO, and other organic solvents; Melting point: 233–234°C; Form: powder; and Color: red. Epirubicin (EADM) was purchased from Selleck (Lot No. S122306). We used DMSO as the solvent for Tan I and EADM. Cultured cells were kept in a humidified incubator at the temperature of 37°C, under the concentration of 5% CO2 and 1% O2.
Cell Transfection
We purchased lentiviruses from Vigene Biosciences with the HIF-1α overexpression plasmid (HIF-1α) and the empty vector (control), both with GFP fluorescent sequences. Human HCC cells (Huh7 and HepG2) were seeded into six-well plates (2×10⁶ cells/well). 24 hrs later, human HCC cells (Huh7, HepG2) were transfected with 5 μL of empty vector (control) lentivirus or 10 μL of HIF-1α overexpression plasmid lentivirus, and then kept in a humidified incubator at the temperature of 37°C. After 48 hrs, stable cell lines were screened by using the DMEM (10% FBS) containing 2 μg/mL puromycin. After being fixed with 70% methanol, the cells were stained by DAPI (Abcam, ab285390) and observed under a fluorescence microscope to determine the successful construction of HCC stable cell lines. Meanwhile, cellular proteins were collected for Western blot analysis to verify the successful construction of HCC stable cell lines.
Cell Viability Assays
Cell proliferation was analyzed by the cell counting kit-8 (CCK-8, MedChemExpress, Cat. No. HY-K0301). Cells were seeded at a density of 1 × 10⁴/well into 96-well microplates. Then, the cells were treated with various concentrations of Tan I (1.25, 2.5, 5, 10, 20, 40, 80 and 160 μM), and EADM (0.04, 0.08, 0.16, 0.31, 0.63, 1.25, 2.5 and 5 μM). The CCK-8 assay was performed after 48 hrs of treatment. Treated cells were incubated for 4 hrs with a culture medium containing the CCK-8 reagent, and absorbance was recorded at 450 nm using the iMark™ Microplate Absorbance Reader (Bio-Rad, iMark, United States). All experiments were repeated three times. The inhibition of cell proliferation was expressed by the absorbance.
The Synergy Evaluation of Drugs Combination
After we calculated the 50% inhibitory concentrations (IC50) of Tan I and EADM in HCC cancer cell lines. We treated HCC cancer cells with a mixture of Tan I and EADM by using a constant ratio from a fraction of their IC50. 48 hrs later, CCK-8 assays were performed. Treated cells were incubated with a medium containing CCK-8 reagent for 4 hrs, and absorbance was recorded at 450 nm using an iMark™ Microplate Absorbance Reader (Bio-Rad, iMark, USA). All experiments were repeated three times. The inhibition of cell proliferation was expressed by the absorbance.
Then, the synergism between Tan I and EADM was tested in HCC cell lines. The Bliss synergy score (SynergyFinder),29,30 positive excess over bliss additivism (EOBA),29,31,32 and the drug combination index (CI)33 were calculated to assess whether Tan I and EADM were synergistic, additive, or antagonistic. These assays allowed us to observe the level of synergy between Tan I and EADM at different dose combinations, while allowing us to visualize the pattern of synergy and predict the dose combination that exhibited the greatest inhibition of proliferation. Furthermore, based on the results of the Bliss synergy score (SynergyFinder), EOBA, and CI, we selected the most reasonable and effective combination concentration as the combined concentration of Tan I and EADM to treat HCC cancer cell lines.29–33
Synergism between Tan I and EADM was defined as Bliss synergy score (SynergyFinder),29,30 EOBA,29,31,32 and CI.33 The Bliss synergy score was calculated by SynergyFinder, in which 0 means additive, < 0 antagonistic, and > 0 synergistic. EOBA was evaluated by equation (C),32 where 0 means additive, < 0 antagonistic, and > 0 synergistic. CI was calculated by the Compusyn software for any value of the fraction affected (fa), where 1 means additive, < 1 synergistic, and > 1 antagonists. Median effects plots were used for curve fitting and deriving doses required for all fa.
Equation (C): EOBA=A×B-AB, where A refers to the growth of HCC cells treated with Tan I alone, B refers to the growth of HCC cells treated with EADM alone, and AB refers to the growth of HCC cells treated with the combination of Tan I and EADM.32
Cell Apoptosis Analysis Detected by Flow Cytometric
For apoptosis analysis, cells were implanted into a 6-well plate. Then, the medium was replaced with a fresh medium supplemented with 40 μM Tan I and 0.25 μM EADM. Meanwhile, based on the results of the Bliss synergy score (SynergyFinder), EOBA, and CI, we selected the most reasonable and effective combination concentration as the combined concentration of Tan I and EADM to treat HCC cancer cell lines. After treatment of 48 hrs, the cell apoptosis was detected by Apoptosis Detection Kit (eBioscience™ Annexin V Apoptosis Detection Kits (its components are Annexin V and PI), Thermo Fisher Scientific, Lot No. 2106736). All cells were detected by Polychromatic analytical flow cytometry (Beckman, Cytoflex LX, United States).
Western Blotting Analyses
Cells were lysed in sample buffer, homogenized, and denatured with β-mercaptoethanol (Sigma-Aldrich, USA). After the sample protein was separated by SDS-PAGE gel, it was transferred to the PVDF membrane, and then blocked with 5% skimmed milk. It was subsequently incubated with the primary antibody and secondary antibody for 1 hour. In the end, the automatic fluorescence/chemiluminescence image analysis system (Tanon, Shanghai, China) was used to detect and acquire images. The primary antibodies were used to incubate the target protein, including β-actin (abclonal, AC026, 1:1000), hypoxia-inducible factor-1α (HIF-1α) (Cell Signaling Technology, D1S7W, 1:1000), Cleaved Caspase-3 (Cell Signaling Technology, 5A1E, 1:500), Cleaved Caspase-9 (Cell Signaling Technology, E5Z7N, 1:500), PI3K p110α (Cell Signaling Technology, C73F8, 1:1000), p-Akt Thr308 (Cell Signaling Technology, D25E6, 1:1000). The targeted bands were analyzed by ImageJ software (v1.8.0; National Institutes of Health, USA). The β-actin was used as the internal control. The relative protein levels were quantified through comparison to β-actin.
Colony Formation Assay
Cells were implanted into a 6-well plate. Then, the medium was replaced with fresh medium supplemented with 40 μM Tan I and 0.25 μM EADM. Meanwhile, based on the results of the Bliss synergy score (SynergyFinder), EOBA, and CI, we selected the most reasonable and effective combination concentration as the combined concentration of Tan I and EADM to treat HCC cancer cell lines. After treatment of 15 days, cells were fixed with 4% paraformaldehyde and stained with crystal violet (5%). Each experiment was done thrice. Cells colonies formation rate = Number of colonies formed in each treatment group (the well of Tan I, EADM, and the combination of them) /Number of colonies formed in the control group (the well of NC) × 100%.
Animal Xenograft Models
Firstly, we assessed whether the combination of Tan I and EADM is safe or not in vivo. A total of 12 C57BL/6J mice (4 weeks old; 12 male) were purchased from Guangdong Medical Laboratory Animal Center (Guangdong, China) and housed with a 12 hrs light/dark cycle, and fed standard laboratory chow and water. We randomly divided 12 mice into the control group (NC group) and the combination of Tan I and EADM group (the combination group). There were 6 mice in each group. The mice in the NC group were treated with saline by tail vein injection, and the mice in the combination group were treated with Tan I (15 mg/kg) and EADM (3 mg/kg) by tail vein injection.
Furthermore, the growth of the tumor was observed in vivo. A total of 24 BALB/c mice (4 weeks old; 24 males) were purchased from Guangdong Medical Laboratory Animal Center (Guangdong, China) and housed with a 12 hrs light/dark cycle and fed standard laboratory food and water. We randomly divided the 24 mice into vector and HIF-1α groups equally, with 12 mice in each group. Among them, those mice in vector and HIF-1α groups were divided into NC, Tan I, EADM, and combination groups, respectively. There were 3 mice in each group.
2 × 10⁶ HepG2 vector cells (100 μL) were injected subcutaneously into the left and right flanks of nude mice in the vector group. And 2×10⁶ HepG2 HIF-1α cells (100 μL) were injected subcutaneously into the left and right flanks of nude mice in the HIF-1α group. Therefore, we would get 6 tumors in each group. The tumor volume (mm3) = (length of tumor × width of tumor2)/2. When tumor volume reached 200–250 mm3, the mouse began to receive tail vein injection of an equal volume of normal saline, Tan I (15 mg/kg), EADM (3 mg/kg), or the combination of both for 8 weeks. All animal procedures were performed under the “Guide for the Care and Use of Laboratory Animals” (NIH publication 86-23, revised 1985), and were approved by the Committee on the Ethics of Animal Experiments of the Fifth Affiliated Hospital of Sun Yat-sen University (NO. 00164).
Biochemical Analyses
Blood, Serum, and urine biochemical assays of mice were conducted at the Laboratory of the Fifth Affiliated Hospital of Sun Yat-Sen University, using approved standard operating procedures and kits. The biochemical parameters, including Complete Blood Count (CBC), Reactive Oxygen Species (ROS), Total Antioxidant Capacity (T-AOC), Aspartate aminotransferase (AST), Alanine aminotransferase (ALT), Serum Creatinine (Scr), Blood Urea Nitrogen (BUN), and 24 hrs Urine protein, were determined by standard techniques using the Automatic blood analyzer (Sysmex, XN-10(B3), Japan) and the iMark™ Microplate Absorbance Reader (Bio-Rad, iMark, United States).
All Kits for the detection of the above biochemical parameters, including the Reactive Oxygen Species (ROS) Assay Kit (Nanjing Jiancheng Bioengineering Institute, E004-1-1); Total Antioxidant Capacity (T-AOC) Assay Kit (Nanjing Jiancheng Bioengineering Institute, E015-3-1); Alanine aminotransferase (ALT/GPT) Assay kit (Nanjing Jiancheng Bioengineering Institute, C009-2-1); Aspartate aminotransferase (AST/GOT) Assay kit (Nanjing Jiancheng Bioengineering Institute, C010-2-1); Serum Creatinine (Cr) Assay Kit (Nanjing Jiancheng Bioengineering Institute, C011-2-1); Urea Nitrogen (BUN) Assay Kit (Nanjing Jiancheng Bioengineering Institute, C013-2-1); Urine protein Assay Kit (Nanjing Jiancheng Bioengineering Institute, C035-2-1). Meanwhile, the Complete Blood Count (CBC) was detected by the Automatic blood analyzer (Sysmex, XN-10(B3), Japan).
Immunohistochemistry Staining (IHC)
The xenograft tumors of mice were sectioned into 5μm slices. Hematoxylin and eosin staining was applied to confirm the status of cancer or cancer-free. All tissue sections were baked, dehydrated, hydrated, and antigen-retrieved. They were then incubated with primary and secondary antibodies. An N-ACHROPLAN microscope (ZEISS, Germany) was used to photograph the representative areas. Image-Pro Plus v6.0 software (Media Cybernetics Inc., Bethesda, MD, USA) was used to analyze the Information Object Definition (IOD) values of all images. We calculated the relative IOD values based on three parameters (sum of area, average density, and IOD), which were used for further analysis.34,35
IHC was performed according to the kits (Boster, SA1028, SA1027). Primary antibodies were used for IHC staining: Cleaved Caspase-3 (Cell Signaling Technology, 5A1E, 1:300), hypoxia-inducible factor-1α (HIF-1α) (Boster, A00013-3, 1:300).
Statistical Analysis
All data were repeated at least three times. All data were presented as mean ± SEM. Graphs were generated by GraphPad Prism software (version 7.0, LaJolla, CA, United States). The mean values of the two groups were compared by Student’s t-test. One-way analysis of variance (ANOVA) and Brown-Forsythe tests were carried out for multiple group comparisons. For each test, values of p < 0.05 were considered statistically significant. *p < 0.01; **p < 0.001; ***p < 0.0001; ****p < 0.00001; n.s, no statistical significance.
Results
Tan I Synergizes with EADM to Enhance the Inhibition of HCC Cell Proliferation
To verify the relationship between hypoxia and HIF-1α, we performed the Western blotting analyses. The results revealed that hypoxia could significantly promote the expression of HIF-1a in HCC cell lines (HepG2 and Huh7) (Figure 1A). Furthermore, to investigate the effects of Tan I and EADM on HCC, we performed cell viability assays of the HCC cell lines (HepG2 and Huh7), treated with different concentrations of Tan I and EADM. The results showed that Tan I and EADM alone inhibited the proliferation of HCC cells in a concentration-dependent manner. In Huh7, the 50% inhibitory concentration (IC50) of Tan I against Huh7 was 7.0 µM, and the IC50 of EADM was 0.25 µM (Figure 1B). And in HepG2, the IC50 of Tan I was 8.56 µM, and the IC50 of EADM was 0.26 µM (Figure 1C). To assess whether the combination of Tan I and EADM was synergistic, additive, or antagonistic, we calculated the Bliss synergy score (SynergyFinder), positive excess over bliss additivism (EOBA), and drug combination index (CI). As shown in Figure 1D and E, the combination of Tan I and EADM exhibited synergism in the HCC cancer cell lines (Bliss synergy score > 0, EOBA > 0, and CI < 1). It means that Tan I effectively synergized with EADM to inhibit the proliferation of HCC cell lines (HepG2 and Huh7). In Huh7, the most effective combination range was 1.75–7 μM Tan I (peak 7 μM) with 0.06–0.25 μM EADM (peak 0.06 μM) (Figure 1D). In HepG2, the most effective combination range was 2.14–8.56 μM Tan I (peak 2.14 μM) with 0.07–0.26 μM EADM (peak 0.07 μM) (Figure 1E).
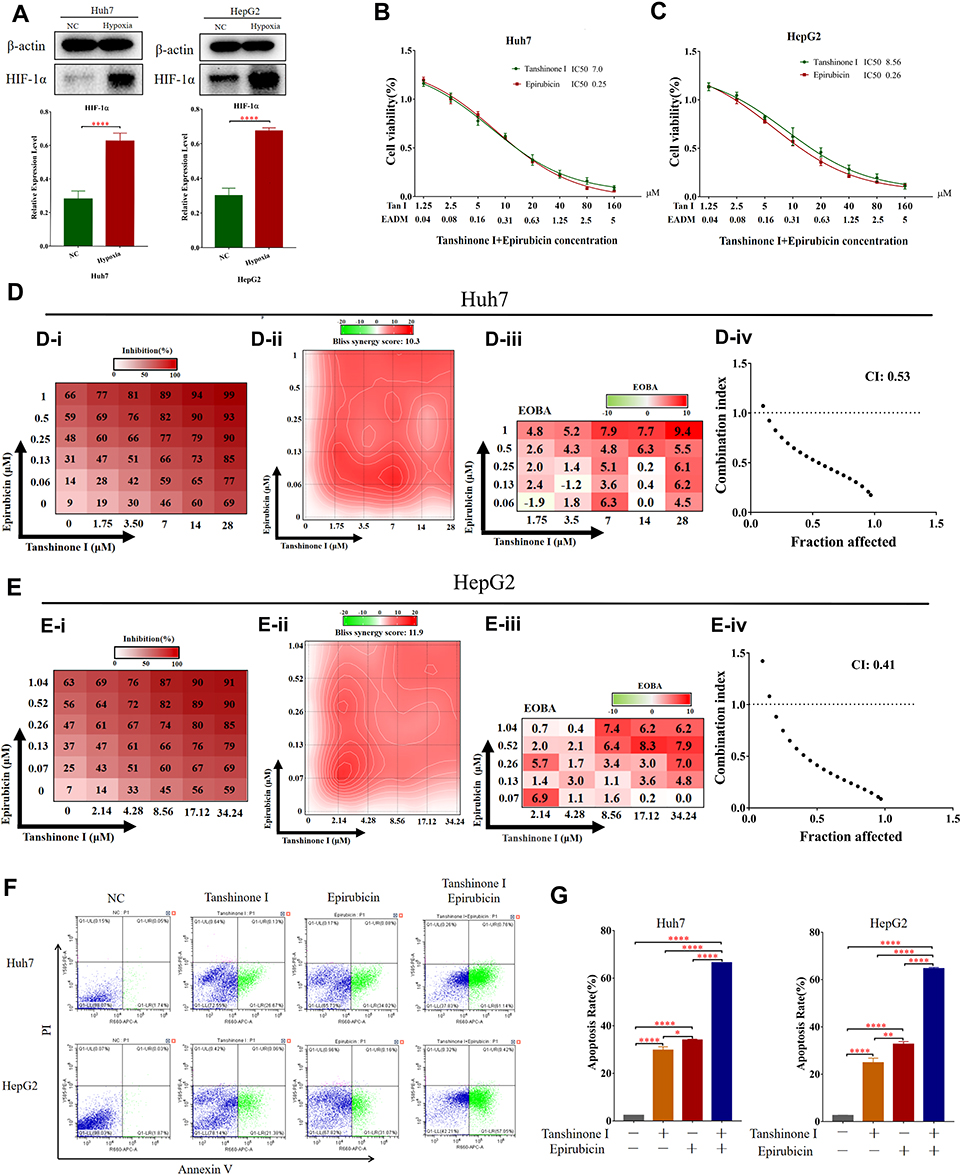 |
Figure 1 Tan I synergizes with EADM to inhibit the proliferation and increased apoptosis of HCC cells. (A) Cellular hypoxia increased the expression of HIF-1α in HCC cancer cell lines (Huh7 and HepG2). 1% oxygen concentration (1% O2) induces hypoxia. (B) Cell viability was observed Huh7 cells treated with Tan I and EADM for 48h. (C) Cell viability was observed HepG2 cells treated with Tan I and EADM for 48h. (D) We treated Huh7 with a mixture of Tan I and EADM by using a constant ratio from a fraction of its IC50. Synergism between Tan I and EADM was tested in Huh7 (D-i). Bliss synergy score (D-ii, SynergyFinder), EOBA (D-iii), and CI (D-iiii) were calculated to predict the potential synergism of Tan I and EADM. Synergism was shown by Bliss synergy score > 0, EOBA > 0, and CI < 1. (E) We treated HepG2 with a mixture of Tan I and EADM by using a constant ratio from a fraction of its IC50. Synergism between Tan I and EADM was tested in HepG2 (E-i). Bliss synergy score (E-ii, SynergyFinder), EOBA (E-iii), and CI (E-iiii) were calculated to predict the potential synergism of Tan I and EADM. Synergism was shown by Bliss synergy score > 0, EOBA > 0, and CI < 1. (F) The cell apoptosis of Huh7 and HepG2 treated with Tan I, EADM, or the combination treatment for 48 hrs was analyzed by flow cytometry. The horizontal axis is Annexin V, and the vertical axis is PI. (G) Statistical analysis was performed on the cell apoptosis in Figure 1F. The mean was compared between all groups. The data presented mean +/- SEM. *p < 0.01; **p < 0.001; ****p < 0.00001. All data were repeated three times. |
According to the results of the Bliss synergy score (SynergyFinder), EOBA, and CI, we selected the most reasonable and effective combination concentration as the combined concentration of Tan I and EADM in Huh7 and HepG2. In Huh7, the combined concentration was 7 μM Tan I and 0.06 μM EADM (Figure 1D). In HepG2, the combined concentration was 2.14 μM Tan I and 0.07 μM EADM (Figure 1E).
Additionally, Flow cytometry revealed that Tan I or EADM alone could induce apoptosis of HCC cells. Meanwhile, compared with Tan I or EADM alone, the combination of Tan I and EADM increased apoptosis of HCC cells more significantly (Figure 1F and G). These results suggested that the synergistic combination of Tan I and EADM could inhibit the proliferation of HCC cells more effectively than Tan I and EADM alone.
Tan I Combined with EADM Increased Inhibition of PI3K/AKT/HIF-1α in HCC
Then we validated if Tan I and EADM induced HCC cells apoptosis by targeting HIF-1α via PI3K/AKT. According to the results of IC50, Bliss synergy score (SynergyFinder), EOBA, and CI, we applied the single drug or the combined treatment of Tan I and EADM in both HCC cell lines (HepG2 and Huh7). Western blotting analysis showed that the PI3K isoform (PI3K p110α) and the phosphorylated AKT (p-Akt Thr308) were inhibited by Tan I or EADM, and they were further inhibited by the combined treatment (Figure 2A–D). Meanwhile, HIF-1α expression levels were also decreased, which was paralleled with the changes of PI3K p110α and p-Akt Thr308 (Figure 2A–D). Furthermore, Tan I could inhibit the expression levels of PI3K p110α, p-Akt Thr308, and HIF-1α, which was consistent with the results of the PI3K inhibitor (alpelisib). And they were further inhibited by the combined treatment of Tan I and EADM or alpelisib and EADM (Supplementary Figure 1A–D).
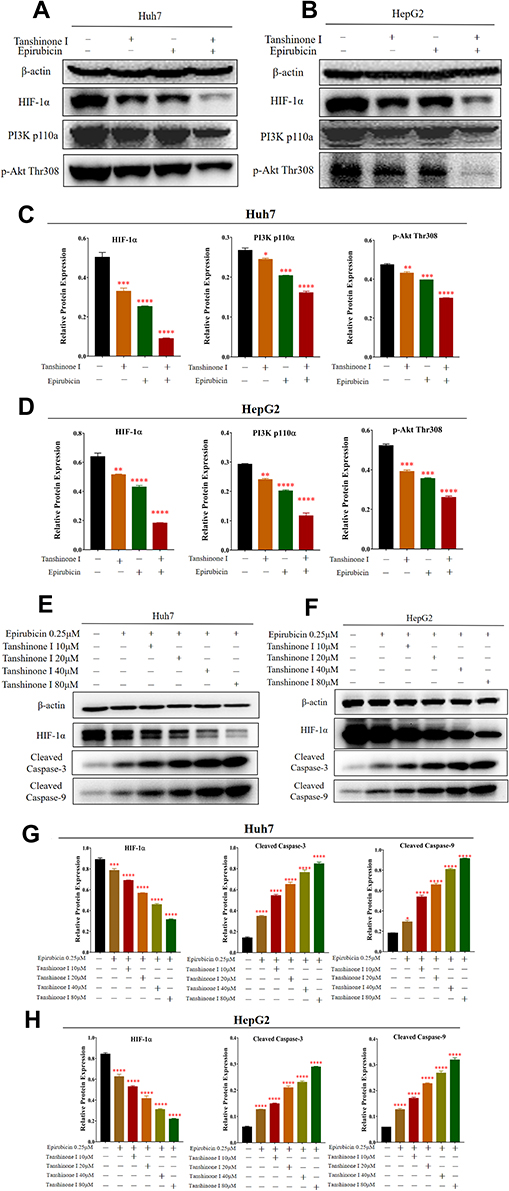 |
Figure 2 Tan I combined with EADM enhanced the inhibition of PI3K/AKT/HIF-1α signaling to promote HCC cell apoptosis. (A and B) Western blotting was performed to detect the expression of PI3K p110α, p-Akt Thr308 and HIF-1α in Huh7 and HepG2 treated with Tan I, EADM, or the combination treatment, compared with the group without treatment. (C and D) The relative expressions of PI3K p110α, p-Akt Thr308, and HIF-1α in Huh7 and HepG2 were quantified via normalization to β-actin. (E and F) Western blotting was performed to detect the expression of HIF-1α, Cleaved Caspase-3, and Cleaved Caspase-9 in Huh7 and HepG2 treated with EADM, and different concentrations of Tan I combined with EADM, compared with the group without treatment. (G and H) The relative expressions of HIF-1α, Cleaved Caspase-3, and Cleaved Caspase-9 in Huh7 and HepG2 were quantified via normalization to β-actin. The data presented mean +/- SEM. *p < 0.01; **p < 0.001; ***p < 0.0001; ****p < 0.00001. All data were repeated three times. |
To further prove that Tan I synergized EADM to target HIF-1α to induce apoptosis in HCC cancer cells, we combined EADM with different concentrations of Tan I to treat HCC cancer cells (Huh7 and HepG2). The results showed that the higher concentration of Tan I, the stronger effect of Tan I synergized EADM to inhibit the expression level of HIF-1α. Meanwhile, the expression levels of two apoptosis markers (cleaved caspase-3 and cleaved caspase-9) also up-regulated with the increased concentration of Tan I combined with EADM (Figure 2E–H). Therefore, the results suggested that Tan I or EADM could induce HCC cancer cell apoptosis by inhibiting PI3K/AKT/HIF-1α. And the combination of Tan I and EADM could further induce more HCC cancer cell apoptosis by targeting HIF-1α through PI3K/AKT.
HIF-1α Mediated Tan I and EADM Resistance in HCC
To confirm if HIF-1α was the key molecule behind the combined Tan I and EADM, we constructed HepG2 and Huh7 cell lines with stable overexpressing HIF-1α (HIF-1α) and the empty vector (control). Both Western blotting and cellular fluorescence validated the success of stable cell line construction (Figure 3A and B).
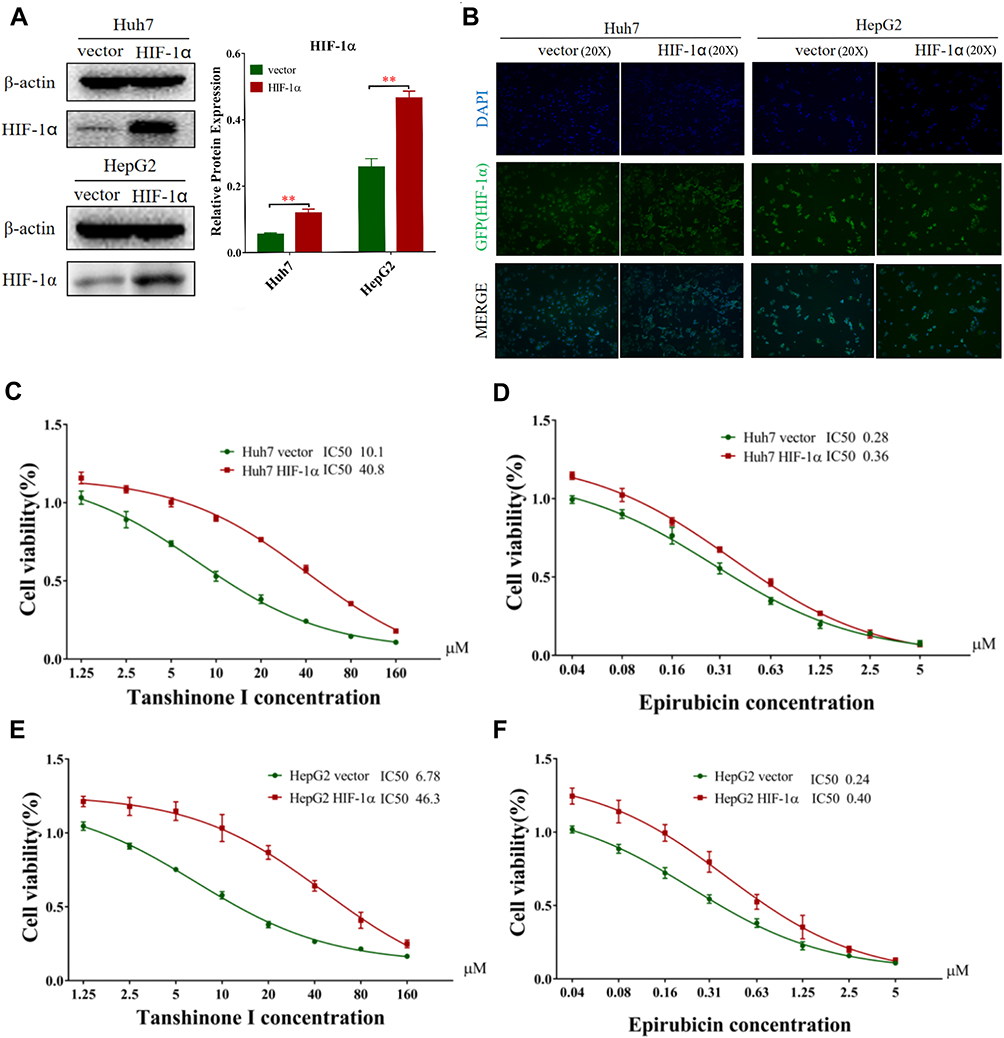 |
Figure 3 HIF-1α mediated Tan I and EADM resistance in HCC. (A) HIF-1α overexpressing stable cell lines (HIF-1α) was constructed (Huh7 and HepG2). Cells transfected with the corresponding empty vector were used as the control in the following experiments. And the relative expressions of HIF-1α were quantified via normalization to β-actin. (B) As green fluorescence protein (GFP) was constructed with the plasmid vector, typical green fluorescence was observed in the stable cell lines after staining of nuclei with DAPI. (C) Cell viability of HIF-1α overexpressing stable cell of Huh7 treated with Tan I for 48 hrs, compared with the control cell lines. (D) Cell viability of HIF-1α overexpressing stable cell of Huh7 treated with EADM for 48 hrs, compared with the control cell lines. (E) Cell viability of HIF-1α overexpressing stable cell of HepG2 treated with Tan I for 48 hrs, compared with the control cell lines. (F) Cell viability of HIF-1α overexpressing stable cell of HepG2 treated with EADM for 48 hrs, compared with the control cell lines. The data presented mean +/- SEM. **p < 0.001. All data were repeated three times. |
Cell viability assays showed that overexpression of HIF-1α increased the drug resistance of Tan I and EADM in both HCC cell lines. As for the Huh7 vector and Huh7 HIF-1α, the IC50 of Tan I was 10.1 µM and 40.8 µM, respectively (Figure 3C). And the IC50 of EADM was 0.28 µM and 0.36 µM, respectively (Figure 3D). In the HepG2 vector and HepG2 HIF-1α, the IC50 of Tan I was 6.78 µM and 46.3 µM, respectively (Figure 3E). And the IC50 of EADM was 0.24 µM and 0.40 µM, respectively (Figure 3F).
As shown in Figure 4A–D, the combination of Tan I and EADM exhibited synergism in HCC stable cell lines (Bliss synergy score > 0, EOBA > 0, and CI < 1). Furthermore, according to the Bliss synergy score, EOBA, and CI, we got the most effective combination range of HCC stable cell lines. In Huh7 vector, the most effective combination range was 2.53–10.1 μM Tan I (peak 10.1 μM) with 0.07–0.28 μM EADM (peak 0.07 μM) (Figure 4A). In Huh7 HIF-1α, the most effective combination range was 10.2–40.8 μM Tan I (peak 10.2 μM) with 0.09–0.36 μM EADM (peak 0.09 μM) (Figure 4B). In HepG2 vector, the most effective combination range was 1.7–6.78 μM Tan I (peak 3.39 μM) with 0.06–0.24 μM EADM (peak 0.12 μM) (Figure 4C). In HepG2 HIF-1α, the most effective combination range was 11.58–46.3 μM Tan I (peak 11.58 μM) with 0.1–0.4 μM EADM (peak 0.1 μM) (Figure 4D).
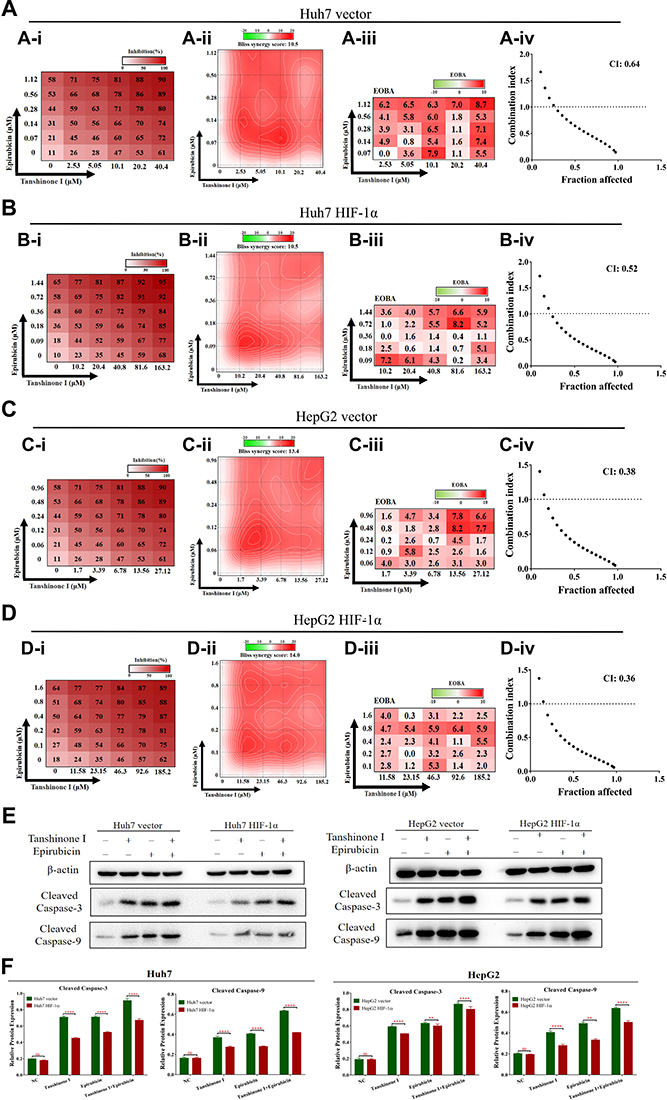 |
Figure 4 HIF-1α mediated drug resistance in HCC, while Tan I synergized with EADM to increase apoptosis of HCC cells. (A) We treated Huh7 vector with a mixture of Tan I and EADM by using a constant ratio from a fraction of its IC50. Synergism between Tan I and EADM was tested in Huh7 vector (A-i). Bliss synergy score (A-ii, SynergyFinder), EOBA (A-iii), and CI (A-iiii) were calculated to predict the potential synergism of Tan I and EADM. Synergism was shown by Bliss synergy score > 0, EOBA > 0, and CI < 1. (B) We treated Huh7 HIF-1α with a mixture of Tan I and EADM by using a constant ratio from a fraction of its IC50. Synergism between Tan I and EADM was tested in Huh7 HIF-1α (B-i). Bliss synergy score (B-ii, SynergyFinder), EOBA (B-iii), and CI (B-iiii) were calculated to predict the potential synergism of Tan I and EADM. Synergism was shown by Bliss synergy score > 0, EOBA > 0, and CI < 1. (C) We treated HepG2 vector with a mixture of Tan I and EADM by using a constant ratio from a fraction of its IC50. Synergism between Tan I and EADM was tested in HepG2 vector (C-i). Bliss synergy score (C-ii, SynergyFinder), EOBA (C-iii), and CI (C-iiii) were calculated to predict the potential synergism of Tan I and EADM. Synergism was shown by Bliss synergy score > 0, EOBA > 0, and CI < 1. (D) We treated HepG2 HIF-1α with a mixture of Tan I and EADM by using a constant ratio from a fraction of its IC50. Synergism between Tan I and EADM was tested in HepG2 HIF-1α (D-i). Bliss synergy score (D-ii, SynergyFinder), EOBA (D-iii), and CI (D-iiii) were calculated to predict the potential synergism of Tan I and EADM. Synergism was shown by Bliss synergy score > 0, EOBA > 0, and CI < 1. (E) Western blotting was performed to detect the expression of β-actin, Cleaved Caspase-3, and Cleaved Caspase-9 in HIF-1α overexpressing stable cell lines (Huh7 and HepG2) treated with Tan I, EADM, and the combination treatment, compared with the control cell lines (Huh7 and HepG2). (F) The relative expressions of Cleaved Caspase-3, and Cleaved Caspase-9 in HCC stable cell lines (Huh7 and HepG2) were quantified via normalization to β-actin. The data presented mean +/- SEM. **p < 0.001; ****p < 0.00001; ns, no statistical significance. All data were repeated three times. |
Meanwhile, based on the results of the Bliss synergy score (SynergyFinder), EOBA, and CI, we selected the most reasonable and effective combination concentration as the combined concentration of Tan I and EADM in HCC stable cancer cell lines. In Huh7 vector, the combined concentration was 10.1 μM Tan I and 0.07 μM EADM (Figure 4A). In Huh7 HIF-1α, the combined concentration was 10.2 μM Tan I and 0.09 μM EADM (Figure 4B). In HepG2 vector, the combined concentration was 3.39 μM Tan I and 0.12 μM EADM (Figure 4C). In Huh7 HIF-1α, the combined concentration was 11.58 μM Tan I and 0.1 μM EADM (Figure 4D). The results revealed that Tan I could synergize with EADM to inhibit HIF-1a-induced drug-resistant HCC cancer cell lines.
Then the stable HCC cell lines were treated with Tan I, EADM, and the combination of Tan I and EADM. The results showed that HCC cancer cells in the HIF-1α overexpression group (HIF-1α) expressed lower levels of two apoptosis markers (cleaved caspase-3 and cleaved caspase-9) than those in the control group (vector) (Figure 4E and F). These results suggested that HIF-1α mediated drug resistance in HCC. Meanwhile, we speculated that Tan I could synergize with EADM to inhibit HIF-1a-induced drug-resistant HCC cancer cells.
Tan I and EADM Synergistically Reverse HIF-1α-Mediated Resistance in HCC
Then we treated the stable cell lines with Tan I, EADM, or the combination of Tan I and EADM again. Western blotting analysis showed that the expression levels of two apoptotic markers (cleaved caspase-3 and cleaved caspase-9) were increased, after treatment with Tan I and EADM alone. Meanwhile, the combination of Tan I and EADM more significantly increased the expression of both apoptotic markers, compared with Tan I or EADM alone (Figure 5A and B). Flow cytometry showed that Tan I and EADM alone could induce significant apoptosis. The combination of both drugs induced even more apoptosis in HCC cancer cell lines, compared with Tan I and EADM alone (Figure 5C and D). Meanwhile, when treated with Tan I, EADM, and the combination of Tan I and EADM, the HIF-1α overexpression groups revealed fewer apoptotic cells than the control groups (Figure 5E). The results confirmed that HIF-1α mediated drug resistance in HCC, which was the target of the Tan I and EADM drug combination. Cloning formation experiments showed that Tan I and EADM could inhibit HCC cancer cell proliferation when applied alone. The combination of both drugs achieved the greatest inhibitory effect on cancer cell clone forming (Figure 5F and G). Similarly, when treated with the combined Tan I and EADM, the HIF-1α overexpression groups revealed more clones than the control groups (Figure 5H). In sum, HIF-1α mediated drug resistance in HCC. And the combination of Tan I and EADM could reverse the HIF-1α mediated resistance in HCC.
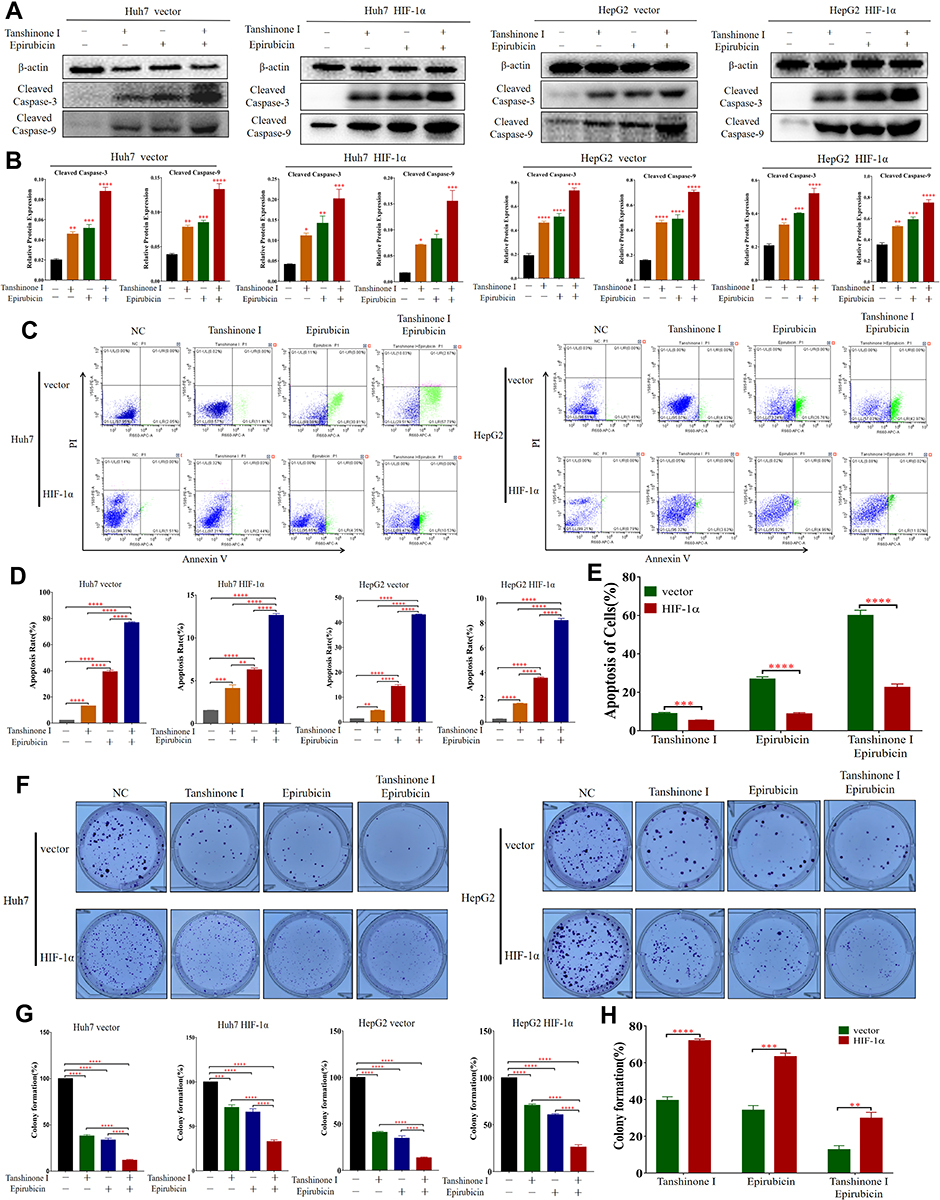 |
Figure 5 Tan I and EADM synergistically reverse HIF-1α-mediated resistance in HCC. (A and B) Western blotting was performed to detect the expression of β-actin, Cleaved Caspase-3 and Cleaved Caspase-9 in HIF-1α overexpressing stable cell lines (Huh7 and HepG2) treated with Tan I, EADM, and the combination treatment, compared with the control cell lines (Huh7 and HepG2). And the relative expressions of Cleaved Caspase-3 and Cleaved Caspase-9 were quantified via normalization to β-actin. (C–E) The cell apoptosis of HIF-1α overexpressing stable cell lines (Huh7 and HepG2) treated with Tan I, EADM, or the combination treatment for 48 hrs, was analyzed by flow cytometry, compared with the control cell lines (Huh7 and HepG2). (F–H) The colony forming assay of HIF-1α overexpressing stable cell lines (Huh7 and HepG2) treated with Tan I, EADM, or the combination treatment, compared with the control cell lines (Huh7 and HepG2). The data presented mean +/- SEM. *p < 0.01; **p < 0.001; ***p < 0.0001; ****p < 0.00001. All data were repeated three times. |
Tan I and EADM Synergistically Reverse HIF-1α-Mediated Resistance in vivo
First, we evaluated the safety of the combination of Tan I and EADM in vivo. The results showed that the toxicity parameters (CBC, ROS, T-AOC, ALT, AST, BUN, Scr, and 24 hrs Urine protein) of the Tan I and EADM combination groups were not statistically different from those of the control group (Table 1; Figure 6A–G).
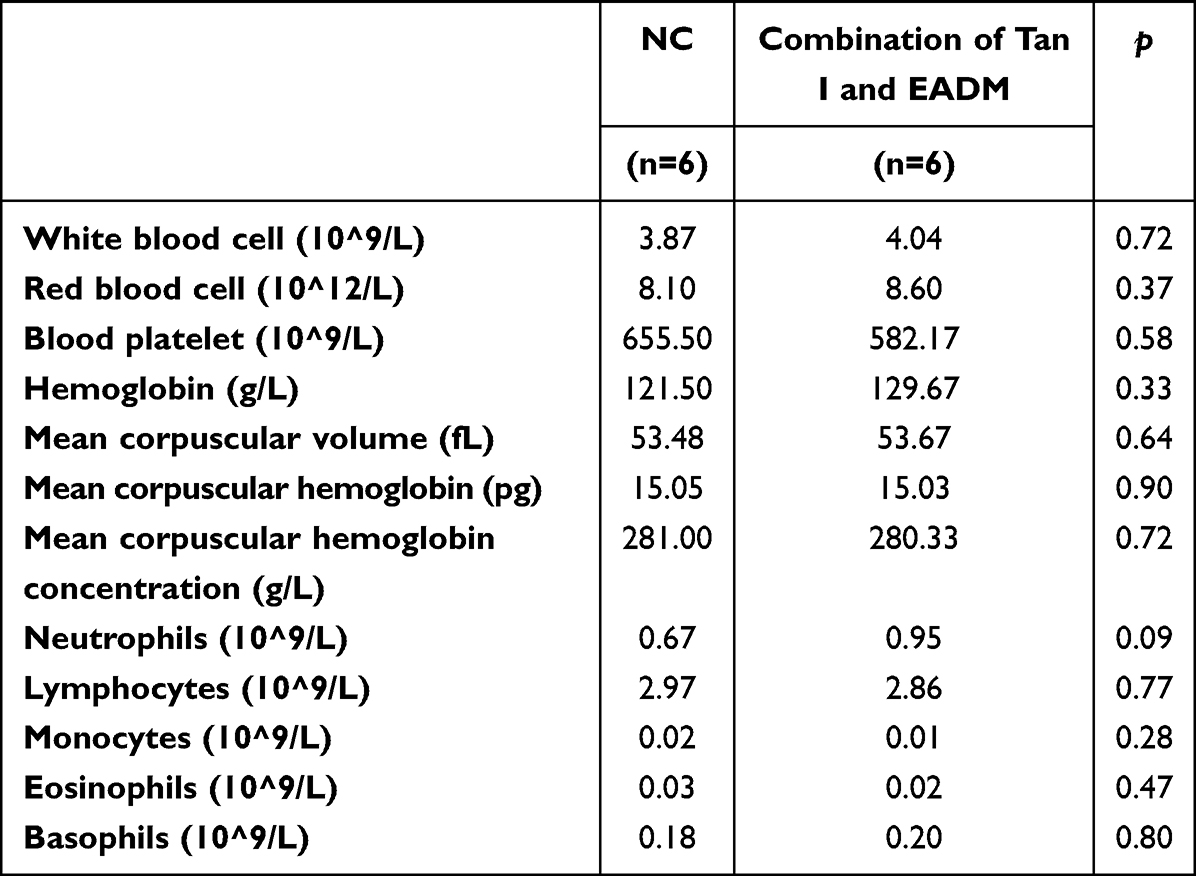 |
Table 1 Completed Blood Counts of Mice in NC Group and the Combination of Two Drugs Group |
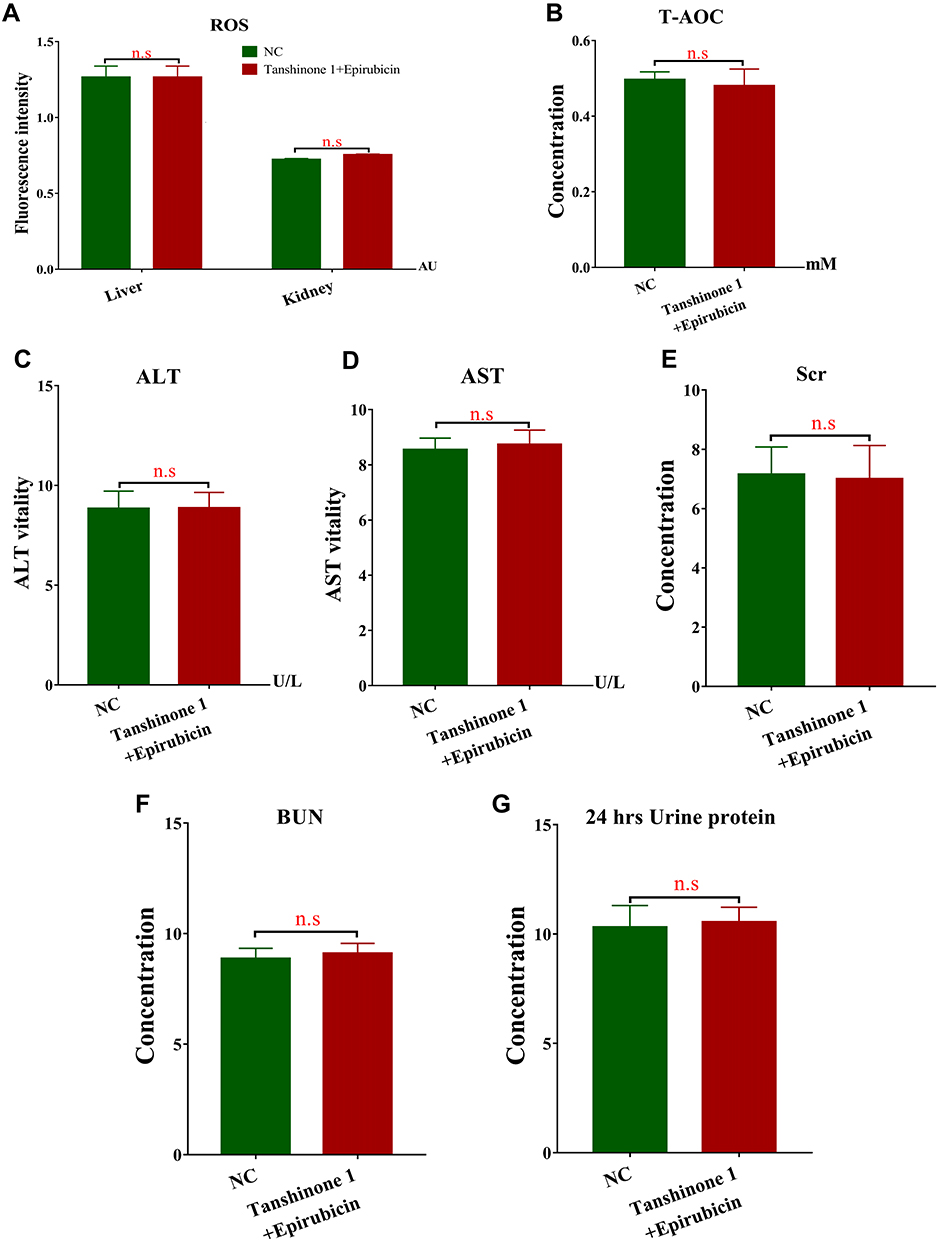 |
Figure 6 Toxicity parameter analyses assess the safety of the combination of Tan I and EADM in mice. (A) The ROS levels in the liver and kidney tissues of mice between the control group and the combined treatment group. (B) The T-AOC levels in the serum of mice between the control group and the combined treatment group. (C) The ALT levels in the serum of mice between the control group and the combined treatment group. (D) The AST levels in the serum of mice between the control group and the combined treatment group. (E) The Scr levels in the serum of mice between the control group and the combined treatment group. (F) The BUN levels in the urine of mice between the control group and the combined treatment group. (G) The 24 hrs Urine protein levels in the urine of mice between the control group and the combined treatment group. The data presented mean +/- SEM. n.s, no statistical significance. All data were repeated three times. |
Next, to further verify the effects of Tan I and EADM on cancer cells in vivo, the xenograft model of nude mice was established (Figure 7A–C). Although Tan I had no significant effect on the weight of mice, Tan I could attenuate the effect of EADM on weight loss in mice compared with the single EADM group (Figure 7D). Those tumor volumes of combination treatment were significantly smaller than those treated by Tan I and EADM alone (Figure 7E). Immunohistochemistry staining of Cleaved Caspase-3 showed that both Tan I and EADM could induce cancer cell apoptosis, and the combination has the most significant effect (Figure 7F and G). In addition, the effect of drug-induced cancer cell apoptosis in the HIF-1α overexpression group was lower than that in the control group (Figure 7H). The results suggested that HIF-1α was the target of Tan I and EADM, which could enhance the drug resistance of tumors.
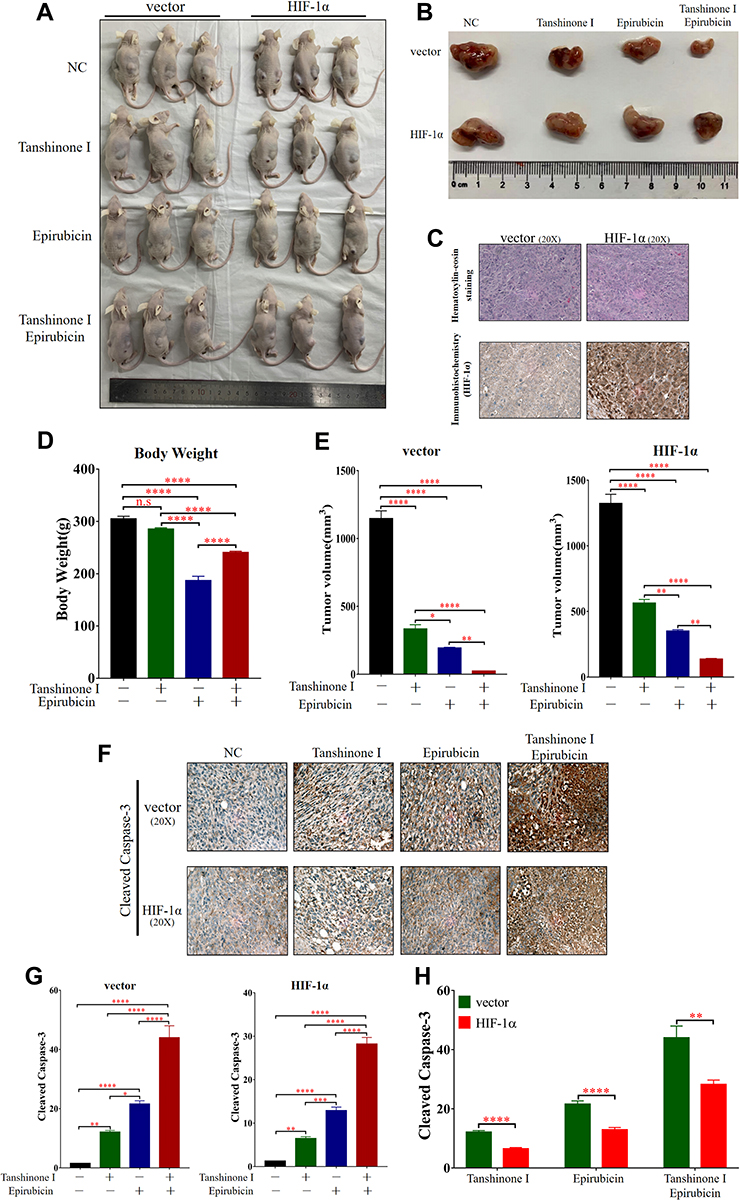 |
Figure 7 Tan I, EADM, and in combination suppress the growth of HCC cells in vivo. (A) Images of all tumor-bearing mice in the vector and HIF-1α groups. (B) Representative images of tumors in mice of vector group and HIF-1α group after different treatments. (C) Pathological validation of tumors under a microscope (20X), after H&E staining and Immunohistochemistry in tumor tissues. (D) The body weight of mice in different treatment groups. (E) The tumor volume of vector group and HIF-1α group after different treatments. (F) Immunohistochemistry staining to detect the expression of Cleaved Caspase-3 in different treatment groups from the tumor tissues of mice. (G and H) The expression level of Cleaved Caspase-3 in different treatment groups from the tumors of mice. The data presented mean +/- SEM. *p < 0.01; **p < 0.001; ***p < 0.0001; ****p < 0.00001. Abbreviation: n.s, no statistical significance. |
In conclusion, compared with monotherapy, the combination treatment group had more significant inhibition of tumor growth. Tan I could enhance the anti-tumor effect of EADM, and reduce the drug reactions of EADM in vivo.
Discussion
Combined therapy has been recommended in the NCCN guideline for HCC, for example, the combination of atezolizumab and bevacizumab.36 EADM is one of the most commonly used chemotherapeutic agents in practice.37 But adverse reactions and the inherent resistance of cancer cells remain the major obstacles for EADM that lead to uneventful treatment outcomes. In this study, we found that EADM can induce apoptosis of HCC cancer cells, but EADM causes weight loss in mice. Therefore, further study on new combined therapies to overcome EADM resistance and reduce adverse reactions can ultimately improve the clinical outcome of HCC patients.
Chinese herbal extracts can enhance chemotherapy efficacy and reverse chemo-resistance of cancer.38–40 As a member of the tanshinone family, Tan I possesses the therapeutic potential in treating a variety of diseases and causes few adverse reactions.12,24 Tan I could inhibit proliferation and induce apoptosis of HCC, ovarian cancer, gastric cancer, and other solid tumors.17,41 Among the many functions of Tan I in cancer biology, more attention was paid to its role in increasing the chemo-sensitivity of cancer cells.12 Furthermore, the combination of Tan I and paclitaxel could synergistically inhibit the proliferation of ovarian cancer cells and induce cancer apoptosis, while Tan I could enhance the anti-tumor effect of paclitaxel.14 These findings suggested that Tan I can be developed in combination with other anti-tumor agents as a novel regimen for postoperative adjuvant therapy. For example, it could align with EADM during trans-arterial chemoembolization (a.k.a. TACE). And several types of tanshinone could inhibit HCC cell proliferation and induce HCC cell apoptosis in combination with other drugs, and the effect was significant.13,42
However, there is no related report on the combination of Tan I and EADM in the treatment of HCC. This study found that the combination of Tan I and EADM was synergistic in HCC cancer cell lines. Furthermore, with the increase of Tan I concentration, the effect of Tan I on enhancing EADM-induced apoptosis and inhibited proliferation of HCC cells was stronger. Meanwhile, the combination of Tan I and EADM inhibited HIF-1α in HCC cancer cells more significantly than the single drug.
Existing research revealed that hypoxia contributes to the development of chemotherapeutic and other drug resistance via the accumulation of HIF-1α, which is an indicator of poor prognosis in HCC patients.24 In addition, HIF-1α has been known as the vital druggable target for tanshinones.42 Therefore, we speculated that HIF-1α is also a potential target for the combination therapy of Tan I and EADM. And the combination of Tan I and EADM can enhance the effect of treating HCC.
To understand the underlying mechanism between drug resistance, hypoxia, and the two drugs (Tan I and EADM), we further analyzed the related results. We confirmed that the accumulation of HIF-1α in HCC cancer cells under hypoxia resulted in drug resistance in HCC. Meanwhile, when HIF-1α was inhibited by Tan I and EADM, the expression levels of PI3K p110α and p-Akt Thr308 were also down-regulated. Therefore, we believed that Tan I synergized with EADM by targeting HIF-1α via the inhibition of PI3K p110α/p-Akt Thr308 signaling. Furthermore, we also found that the combination of Tan I and EADM could further induce more apoptosis and inhibit more proliferation of HCC cancer cell lines by targeting the PI3K/AKT/HIF-1α signaling pathway, compared with the single drug of Tan I or EADM. Meanwhile, animal models showed that Tan I not only effectively improved the anti-tumor effect of EADM, but also effectively reduced the drug reactions of EADM-induced weight loss in vivo. Therefore, the results revealed that Tan I synergize with EADM to induce cancer cell apoptosis by inhibiting PI3K/AKT/HIF-1α signaling pathway in HCC. Meanwhile, the drug combination may be a potential clinical anti-HCC treatment option.
Although we found that the combination of Tan I and EADM has a stronger anti-tumor effect, further studies are needed to understand more possible mechanisms behind the combination. We also need more molecular biological evidence to confirm how Tan I inhibits the PI3K/AKT/HIF-1α signaling pathway. Such detailed investigation can also help us understand the drug better, and more specific inhibitors resembling the action of Tan I can be developed accordingly.
Conclusion
In conclusion, this study found that Tan I can synergize with EADM to inhibit the proliferation and apoptosis induction of HCC cells. Compared with Tan I and EADM alone, the combination therapy of Tan I and EADM play a greater anti-cancer effect. Further analysis revealed that Tan I enhance the anti-cancer efficacy of EADM in HCC by inhibiting the PI3K/AKT/HIF-1α signaling pathway. Meanwhile, Tan I can reduce the drug reactions of EADM-induced weight loss in vivo. Therefore, the novel combination of Tan I and EADM can be a potent drug regimen for HCC treatment.
Acknowledgments
This work was supported by the National Natural Science Foundation of China (grant number 81971773), Natural Science Foundation of Guangdong Province (grant number 2018A0303130292), Guangdong Basic and Applied Basic Research Foundation (grant number 2019A1515011356, 2020A1515010203, 2019A1515110233, 2022A1515011244, 2022A1515012382), Scientific research project of Guangdong Provincial Bureau of Traditional Chinese Medicine (grant number 20181062), Science and Technology Planning Project of Guangdong Province of China (grant number 2019A030317023), Medical Scientific Research Foundation of Guangdong Province of China (grant number A2019099), the Fundamental Research Funds for the Central Universities, Sun Yat-sen University (grant number 20ykpy51, 2021gntd35).
Disclosure
The authors report no conflicts of interest in this work.
References
1. Sung H, Ferlay J, Siegel RL, et al. Global cancer statistics 2020: GLOBOCAN estimates of incidence and mortality worldwide for 36 cancers in 185 countries. CA Cancer J Clin. 2021;71:209–249. doi:10.3322/caac.21660
2. Galle PR, Tovoli F, Foerster F, et al. The treatment of intermediate stage tumours beyond TACE: from surgery to systemic therapy. J Hepatol. 2017;67:173–183. doi:10.1016/j.jhep.2017.03.007
3. Xu MJ, Feng M. Radiation therapy in HCC: what data exist and what data do we need to incorporate into guidelines? Semin Liver Dis. 2019;39:43–52. doi:10.1055/s-0038-1676098
4. Zhao Y, Zhang YN, Wang KT, Chen L. Lenvatinib for hepatocellular carcinoma: from preclinical mechanisms to anti-cancer therapy. Biochim Biophys Acta Rev Cancer. 2020;1874:188391. doi:10.1016/j.bbcan.2020.188391
5. Aramaki O, Takayama T, Moriguchi M, et al. Arterial chemoembolisation with cisplatin versus epirubicin for hepatocellular carcinoma (ACE 500 study): a multicentre, randomised controlled Phase 2/3 trial. Eur J Cancer. 2021;157:373–382. doi:10.1016/j.ejca.2021.08.027
6. Yuan P, Zheng A, Tang Q. Tripartite motif protein 25 is associated with epirubicin resistance in hepatocellular carcinoma cells via regulating PTEN/AKT pathway. Cell Biol Int. 2020;44:1503–1513. doi:10.1002/cbin.11346
7. Tacar O, Sriamornsak P, Dass CR. Doxorubicin: an update on anticancer molecular action, toxicity and novel drug delivery systems. J Pharm Pharmacol. 2013;65:157–170. doi:10.1111/j.2042-7158.2012.01567.x
8. Xia S, Pan Y, Liang Y, et al. The microenvironmental and metabolic aspects of sorafenib resistance in hepatocellular carcinoma. EBioMedicine. 2020;51:102610. doi:10.1016/j.ebiom.2019.102610
9. Ormrod D, Holm K, Goa K, Spencer C. Epirubicin: a review of its efficacy as adjuvant therapy and in the treatment of metastatic disease in breast cancer. Drugs Aging. 1999;15:389–416. doi:10.2165/00002512-199915050-00006
10. Coukell AJ, Faulds D. Epirubicin. An updated review of its pharmacodynamic and pharmacokinetic properties and therapeutic efficacy in the management of breast cancer. Drugs. 1997;53:453–482. doi:10.2165/00003495-199753030-00008
11. Fu L, Han B, Zhou Y, et al. The anticancer properties of tanshinones and the pharmacological effects of their active ingredients. Front Pharmacol. 2020;11:193. doi:10.3389/fphar.2020.00193
12. Dun S, Gao L. Tanshinone I attenuates proliferation and chemoresistance of cervical cancer in a KRAS-dependent manner. J Biochem Mol Toxicol. 2019;33:e22267. doi:10.1002/jbt.22267
13. Liu X, Liu J. Tanshinone I induces cell apoptosis by reactive oxygen species-mediated endoplasmic reticulum stress and by suppressing p53/DRAM-mediated autophagy in human hepatocellular carcinoma. Artif Cells Nanomed Biotechnol. 2020;48:488–497. doi:10.1080/21691401.2019.1709862
14. Zhou J, Jiang YY, Chen H, et al. Tanshinone I attenuates the malignant biological properties of ovarian cancer by inducing apoptosis and autophagy via the inactivation of PI3K/AKT/mTOR pathway. Cell Prolif. 2020;53:e12739. doi:10.1111/cpr.12739
15. Nizamutdinova IT, Lee GW, Lee JS, et al. Tanshinone I suppresses growth and invasion of human breast cancer cells, MDA-MB-231, through regulation of adhesion molecules. Carcinogenesis. 2008;29:1885–1892. doi:10.1093/carcin/bgn151
16. Zheng L, Zhang Y, Liu G, et al. Tanshinone I regulates autophagic signaling via the activation of AMP-activated protein kinase in cancer cells. Anticancer Drugs. 2020;31:601–608. doi:10.1097/cad.0000000000000908
17. Zhou J, Jiang YY, Wang HP, et al. Natural compound Tan-I enhances the efficacy of Paclitaxel chemotherapy in ovarian cancer. Ann Transl Med. 2020;8:752. doi:10.21037/atm-20-4072
18. Chiu CM, Huang SY, Chang SF, et al. Synergistic antitumor effects of tanshinone IIA and sorafenib or its derivative SC-1 in hepatocellular carcinoma cells. Onco Targets Ther. 2018;11:1777–1785. doi:10.2147/ott.S161534
19. Liao X, Gao Y, Liu J, et al. Combination of Tanshinone IIA and cisplatin inhibits esophageal cancer by downregulating NF-κB/COX-2/VEGF pathway. Front Oncol. 2020;10:1756. doi:10.3389/fonc.2020.01756
20. Ni H, Ruan G, Sun C, et al. Tanshinone IIA inhibits gastric cancer cell stemness through inducing ferroptosis. Environ Toxicol. 2021;37:192–200. doi:10.1002/tox.23388
21. Dat NT, Jin X, Lee JH, et al. Abietane diterpenes from Salvia miltiorrhiza inhibit the activation of hypoxia-inducible factor-1. J Nat Prod. 2007;70:1093–1097. doi:10.1021/np060482d
22. Huang X, Li Y, Li J, et al. Tanshinone IIA dampens the cell proliferation induced by ischemic insult in rat astrocytes via blocking the activation of HIF-1α/SDF-1 signaling. Life Sci. 2014;112:59–67. doi:10.1016/j.lfs.2014.07.020
23. Sui H, Zhao J, Zhou L, et al. Tanshinone IIA inhibits β-catenin/VEGF-mediated angiogenesis by targeting TGF-β1 in normoxic and HIF-1α in hypoxic microenvironments in human colorectal cancer. Cancer Lett. 2017;403:86–97. doi:10.1016/j.canlet.2017.05.013
24. Méndez-Blanco C, Fondevila F, García-Palomo A, et al. Sorafenib resistance in hepatocarcinoma: role of hypoxia-inducible factors. Exp Mol Med. 2018;50:1–9. doi:10.1038/s12276-018-0159-1
25. Elkashef A, Barakat N, Khater SM, et al. Effect of low-energy shock wave therapy on intravesical epirubicin delivery in a rat model of bladder cancer. BJU Int. 2021;127:80–89. doi:10.1111/bju.15173
26. Wu T, Yao Y, Sun R, et al. Arterial infusion of rapamycin in the treatment of rabbit hepatocellular carcinoma to improve the effect of TACE. Open Life Sci. 2018;13:299–304. doi:10.1515/biol-2018-0036
27. Wu CC, Tseng CW, Tseng KC, et al. Radiofrequency ablation versus surgical resection for the treatment of solitary hepatocellular carcinoma 2 cm or smaller: a cohort study in Taiwan. J Formos Med Assoc. 2021;120:1249–1258. doi:10.1016/j.jfma.2020.11.010
28. Jiang R, Zhang X, Li Y, et al. Identification of the molecular mechanisms of Salvia miltiorrhiza relevant to the treatment of osteoarthritis based on network pharmacology. Discov Med. 2020;30:83–95.
29. Hassan JJ, Lieske A, Dörpmund N, et al. A multiplex CRISPR-screen identifies PLA2G4A as prognostic marker and druggable target for HOXA9 and MEIS1 dependent AML. Int J Mol Sci. 2021;22:9411. doi:10.3390/ijms22179411
30. Ianevski A, Giri AK, Aittokallio T. SynergyFinder 2.0: visual analytics of multi-drug combination synergies. Nucleic Acids Res. 2020;48:W488–W493. doi:10.1093/nar/gkaa216
31. Greco WR, Bravo G, Parsons JC. The search for synergy: a critical review from a response surface perspective. Pharmacol Rev. 1995;47:331–385.
32. Lam SS, Ho ES, He BL, et al. Homoharringtonine (omacetaxine mepesuccinate) as an adjunct for FLT3-ITD acute myeloid leukemia. Sci Transl Med. 2016;8:359ra129. doi:10.1126/scitranslmed.aaf3735
33. Chou TC. Theoretical basis, experimental design, and computerized simulation of synergism and antagonism in drug combination studies. Pharmacol Rev. 2006;58:621–681. doi:10.1124/pr.58.3.10
34. Jin GZ, Yu WL, Dong H, et al. SUOX is a promising diagnostic and prognostic biomarker for hepatocellular carcinoma. J Hepatol. 2013;59:510–517. doi:10.1016/j.jhep.2013.04.028
35. Zhu XD, Zhang JB, Zhuang PY, et al. High expression of macrophage colony-stimulating factor in peritumoral liver tissue is associated with poor survival after curative resection of hepatocellular carcinoma. J Clin Oncol. 2008;26:2707–2716. doi:10.1200/jco.2007.15.6521
36. Benson AB, D’Angelica MI, Abbott DE, et al. Hepatobiliary cancers, version 2.2021, NCCN clinical practice guidelines in oncology. J Natl Compr Canc Netw. 2021;19:541–565. doi:10.6004/jnccn.2021.0022
37. Li QJ, He MK, Chen HW, et al. Hepatic arterial infusion of oxaliplatin, fluorouracil, and leucovorin versus transarterial chemoembolization for large hepatocellular carcinoma: a randomized Phase III trial. J Clin Oncol. 2022;40:150–160. doi:10.1200/jco.21.00608
38. Ahmed IS, Hassan MA, Kondo T. Effect of lyophilized grapefruit juice on P-glycoprotein-mediated drug transport in-vitro and in-vivo. Drug Dev Ind Pharm. 2015;41:375–381. doi:10.3109/03639045.2013.866141
39. Gyémánt N, Engi H, Schelz Z, et al. In vitro and in vivo multidrug resistance reversal activity by a Betti-base derivative of tylosin. Br J Cancer. 2010;103:178–185. doi:10.1038/sj.bjc.6605716
40. Seubwai W, Vaeteewoottacharn K, Hiyoshi M, et al. Cepharanthine exerts antitumor activity on cholangiocarcinoma by inhibiting NF-kappaB. Cancer Sci. 2010;101:1590–1595. doi:10.1111/j.1349-7006.2010.01572.x
41. Jing X, Xu Y, Cheng W, et al. Tanshinone I induces apoptosis and pro-survival autophagy in gastric cancers. Cancer Chemother Pharmacol. 2016;77:1171–1181. doi:10.1007/s00280-016-3034-6
42. Shi MJ, Dong BS, Yang WN, et al. Preventive and therapeutic role of Tanshinone IIA in hepatology. Biomed Pharmacother. 2019;112:108676. doi:10.1016/j.biopha.2019.108676
 © 2022 The Author(s). This work is published and licensed by Dove Medical Press Limited. The full terms of this license are available at https://www.dovepress.com/terms.php and incorporate the Creative Commons Attribution - Non Commercial (unported, v3.0) License.
By accessing the work you hereby accept the Terms. Non-commercial uses of the work are permitted without any further permission from Dove Medical Press Limited, provided the work is properly attributed. For permission for commercial use of this work, please see paragraphs 4.2 and 5 of our Terms.
© 2022 The Author(s). This work is published and licensed by Dove Medical Press Limited. The full terms of this license are available at https://www.dovepress.com/terms.php and incorporate the Creative Commons Attribution - Non Commercial (unported, v3.0) License.
By accessing the work you hereby accept the Terms. Non-commercial uses of the work are permitted without any further permission from Dove Medical Press Limited, provided the work is properly attributed. For permission for commercial use of this work, please see paragraphs 4.2 and 5 of our Terms.