")
Back to Journals » OncoTargets and Therapy » Volume 8
Combined olaparib and oxaliplatin inhibits tumor proliferation and induces G2/M arrest and γ-H2AX foci formation in colorectal cancer
Authors Xu K , Chen Z, Cui Y, Qin C , He Y, Song X
Received 24 May 2015
Accepted for publication 4 September 2015
Published 20 October 2015 Volume 2015:8 Pages 3047—3054
DOI https://doi.org/10.2147/OTT.S89154
Checked for plagiarism Yes
Review by Single anonymous peer review
Peer reviewer comments 5
Editor who approved publication: Dr Jianmin Xu
Kaiwu Xu,1* Zhihui Chen,2* Yi Cui,1 Changjiang Qin,2 Yulong He,2 Xinming Song2
1Endoscopy Center, 2Gastrointestinal Surgery Center, The First Affiliated Hospital of Sun Yat-sen University, Guangzhou, Guangdong Province, People’s Republic of China
*These authors contributed equally to this work
Background: Poly (ADP-ribose) polymerase 1 (PARP1) has an important role in homologous recombination repair. The purpose of this study was to investigate the effect of PARP1 inhibitor on oxaliplatin treatment for colorectal cancer (CRC).
Methods: A cell counting kit-8 assay was used to determine the sensitivity of CRC cells to olaparib and/or oxaliplatin. The gene and protein expressions of PARP1 and the gamma histone variant H2AX (γH2AX) were measured by real-time quantitative polymerase chain reaction and western blotting, respectively. The γH2AX foci formation assay was used to investigate the influence of treatments on cells. Flow cytometry was used to examine the changes in cell cycle distribution. Finally, we investigated the combination of olaparib and oxaliplatin in the CRC tumor model.
Results: Olaparib changed the expression of γH2AX and PARP1, and increased the sensitivity of CRC cells to oxaliplatin. The γH2AX foci assay showed that olaparib did not induce double-strand breaks (DSBs) alone, but it enhanced the induction of DSBs by oxaliplatin. The flow cytometry results showed that cells exposed to combination treatment had more G2/M-phase cells than control. Additionally, tumor xenograft studies suggested that combined treatment inhibited the growth of CRC.
Conclusion: CRC cells are sensitized to combined treatment with olaparib and oxaliplatin, and this could be a promising strategy for clinical chemotherapy in CRC.
Keywords: olaparib, oxaliplatin, chemosensitization, colorectal cancer
Introduction
Colorectal cancer (CRC) is one of the most common malignant tumors in clinical practice. CRC is the second most frequent cancer following lung cancer in the US and Europe that leads to death.1 At present, there are approximately 1.25 million patients diagnosed with CRC, and more than 600,000 patients will die from this disease every year around the world.2 In the People’s Republic of China, the incidence of CRC has been increasing annually and will continue to rise in the next few years.3 Today, targeted therapies of CRC have made significant progress but have failed to reach satisfactory effects, and therefore there is a need for better targeted drugs.
Oxaliplatin is a third-generation platinum analog of the 1,2-diaminocyclohexane family, and has a spectrum of activity and mechanisms of action that appear to be different from those of other platinum-containing compounds.4,5 Moreover, its anticancer effects are optimized when it is administered in combination with other anticancer agents, such as 5-fluorouracil5 and S-1.6,7 Oxaliplatin can induce DNA cross-links and lead to DNA double-strand breaks (DSBs).8,9 After DSBs are induced by irradiation or cytotoxic drugs, H2AX is rapidly phosphorylated and there is always a constant number or percentage of gamma histone variant H2AX (γH2AX) formed per DSB.10 Chiu et al9 found that oxaliplatin-induced phosphorylation of γH2AX in a concentration- and time-dependent manner in HCT116 CRC cells.9 DSBs are one of the most important threats to genomic integrity and trigger the activation of repair proteins involved in the homologous recombination repair and nonhomologous end-joining pathways. Poly (ADP-ribose) polymerase 1 (PARP1) has important roles in these pathways and is crucial for the outcome of PARP1 inhibitor monotherapy.11 Inhibitors of PARP1 increase the levels of persistent single-strand breaks that lead to DNA DSBs upon replication.12,13 Our aim in this study was to examine the characteristics of the sensitizing effects of a PARP1 inhibitor on oxaliplatin treatment for potential clinical application.
Materials and methods
Cell line and drugs
CRC cell line SW480 was obtained from American Type Culture Collection (Manassas, VA, USA). Cells were cultured in RPMI-1640 medium (HyClone, Logan, UT, USA) supplemented with 10% fetal bovine serum (HyClone) and maintained in a humidified atmosphere at 37°C with 5% CO2. Olaparib (AZD2281) was obtained from Selleckchem (Houston, TX, USA) and oxaliplatin was obtained from Hengrui Medicine Co., Ltd (Jiangsu, People’s Republic of China).
Cell proliferation assay
Cell proliferation was measured using the cell counting kit-8 (CCK-8; Dojindo Laboratories, Kumamoto, Japan) according to the manufacturer’s instructions. For the CCK-8 assay, cells were divided into four groups: controls; olaparib (1 μmol/L); oxaliplatin (20 μg/mL); and olaparib (1 μmol/L) + oxaliplatin (20 μg/mL). Cells were seeded into 96-well plates at 1×10³ cells per well with 100 μL complete medium and cultured at 37°C; 10 μL CCK-8 solution was added to each well after 24, 36, 48, and 72 hours. Plates were incubated at 37°C for 2 h. The absorbance at 570 nm was then measured using a microplate reader (Bio-Rad, La Jolla, CA, USA). All experiments were performed in triplicate, and three independent experiments were carried out.
Flow cytometry analysis
Cultured cells were trypsinized into single-cell suspensions, fixed with 70% ethanol for 30 min, and treated with Cell Cycle and Apoptosis Analysis Kit (Beyotime, Guangzhou, People’s Republic of China) following the manufacturer’s instructions. DNA content was assessed by FACS Calibur flow cytometry (Becton Dickinson, Franklin Lakes, NJ, USA) and data were analyzed by FlowJo (FlowJo, LLC, Ashland, OR, USA).
γH2AX foci assay
Cells, diluted to appropriate numbers, were grown on a glass slide after exposure to olaparib (1 μM) and/or oxaliplatin (10 μM) for 36 h. Mouse monoclonal anti-γH2AX (1:200; CST, Boston, MA, USA) antibody was used as the primary antibody. Alexa-546-conjugated anti-mouse IgG (Molecular Probes) was used for visualization of γH2AX. We then stained with 4′,6-diamidino-2-phenylindole (DAPI) (Nanjing KeyGEN Biotech. Co., Ltd., Jiangsu, People’s Republic of China). Foci were observed with an Olympus fluorescent microscope. For quantification of foci, clear and easily distinguished dots of certain brightness were counted as positive foci. The number of foci was counted in 100 cells of each sample by visual inspection, and the average number of foci per cell was calculated.
RNA extraction and real-time quantitative PCR
Total RNA was extracted using TRIzol (Invitrogen, Carlsbad, CA, USA) according to the manufacturer’s instructions. Real-time quantitative reverse transcription polymerase chain reaction (QPCR) was performed using SYBR Green I (Invitrogen) with an ABI 7500 system (Applied Biosystems, Foster City, CA, USA). Gene expression data were normalized to the geometric mean of the glyceraldehyde-3-phosphate dehydrogenase (GAPDH) housekeeping gene to control for variability in expression levels, and were calculated as 2−[(Ct of gene) − (Ct of GAPDH)], where Ct represents the threshold cycle for each transcript. The following primers were used: GAPDH forward: 5′-GACTCATGACCACAGTCCATGC-3′, GAPDH reverse: 5′-AGAGGCAGGGATGATGTTCTG-3′; γH2AX forward: 5′-GGCCTCCAGTTCCCAGTG-3′, γH2AX reverse: 5′-TCAGCGGTGAGGTACTCCAG-3′; PARP1 forward: 5′-ACAGTGTGCAGGCCAAGGTG-3′, PARP1 reverse: 5′-CTCGGCTTCTTCAGAATCTCTGTC-3′.
Western blotting
Proteins from cell lysates were prepared, separated on SDS-PAGE, and transferred to PVDF membranes, according to the manufacturer’s instructions. Anti-human γH2AX mouse monoclonal antibody (1:1,000; CST, Boston, MA, USA), anti-human PARP1 mouse monoclonal antibody (1:1,000; Abcam, Cambridge, UK), and anti-β-tubulin mouse monoclonal antibody (1:1,500; Sigma-Aldrich, St Louis, MO, USA) were used as primary antibodies. Goat anti-mouse antibody (1:2,000; Santa Cruz Biotechnology, Santa Cruz, CA, USA) was used as a secondary antibody. Signal amplification and detection were achieved by exposing the membrane to ECL reagent (GE Healthcare), followed by visualization on the storm imaging system (Amersham Biosciences).
Tumor volume assessment
SW480 cells were used as a xenograft model in female athymic nude mice (nu/nu, 5–6 weeks old; Guangdong Medical Laboratory Animal Center, Guangzhou, People’s Republic of China). A suspension of 5×10⁶ cells in 200 μL volume was injected subcutaneously into the right posterior flank of mice using a 1 mL syringe. Tumors grew for 20 days until the average tumor volume reached 0.23 cm3. There were four treatment groups (n=3 in each): vehicle control (5% dimethyl sulfoxide, DMSO), olaparib alone (dissolved in DMSO), oxaliplatin alone, and olaparib plus oxaliplatin. The vehicle control and olaparib were administered daily at doses of 50 mg/kg via intraperitoneal injection for 6 consecutive days. Oxaliplatin was administered at a dose of 5 mg/kg via intraperitoneal injection twice a week for 4 consecutive weeks. Tumors were measured twice or three times weekly in three perpendicular dimensions using a vernier caliper and tumor volume was calculated using the modified ellipsoid formula: V (mm3) =1/6 π × length (mm) × width2 (mm2).
Histologic sections, γH2AX and Ki67 staining
Twenty-eight days after the first dose, mice were euthanized and tumors were paraffin fixed, and γH2AX and Ki67 staining was performed in our laboratory. Anti-human γH2AX mouse monoclonal antibody (1:100; CST, Boston, MA, USA) and anti-human Ki67 mouse monoclonal antibody (1:50; Epitomics, Burlingame, CA, USA) were used as primary antibodies. The number of positive cells was scored and graphed by averaging three repeated assessments.
Statistical analysis
Differences among the cell lines following treatment with olaparib and/or oxaliplatin were analyzed using the repeated measures analysis of variance. The Student’s t-test was used to evaluate significant differences between two groups of data in all relevant experiments. All results are presented as means ± standard deviation; the level of significance was set at P<0.05.
Results
The chemosensitizing effect of olaparib in SW480 cells
We analyzed the surviving fraction of cells treated with olaparib at 24, 36, 48, and 72 hours after administration. The surviving fraction of cells in response to olaparib combined with oxaliplatin was significantly lower than that of the control cells and of those treated with oxaliplatin alone (Figure 1A; P<0.05). Furthermore, according to repeated measures analysis of variance, the estimated marginal mean of the olaparib combined with oxaliplatin group was lower than that of the control group and that of the oxaliplatin alone treatment group (Figure 1B; P<0.01). This suggests that olaparib can increase the sensitivity of CRC cells to oxaliplatin.
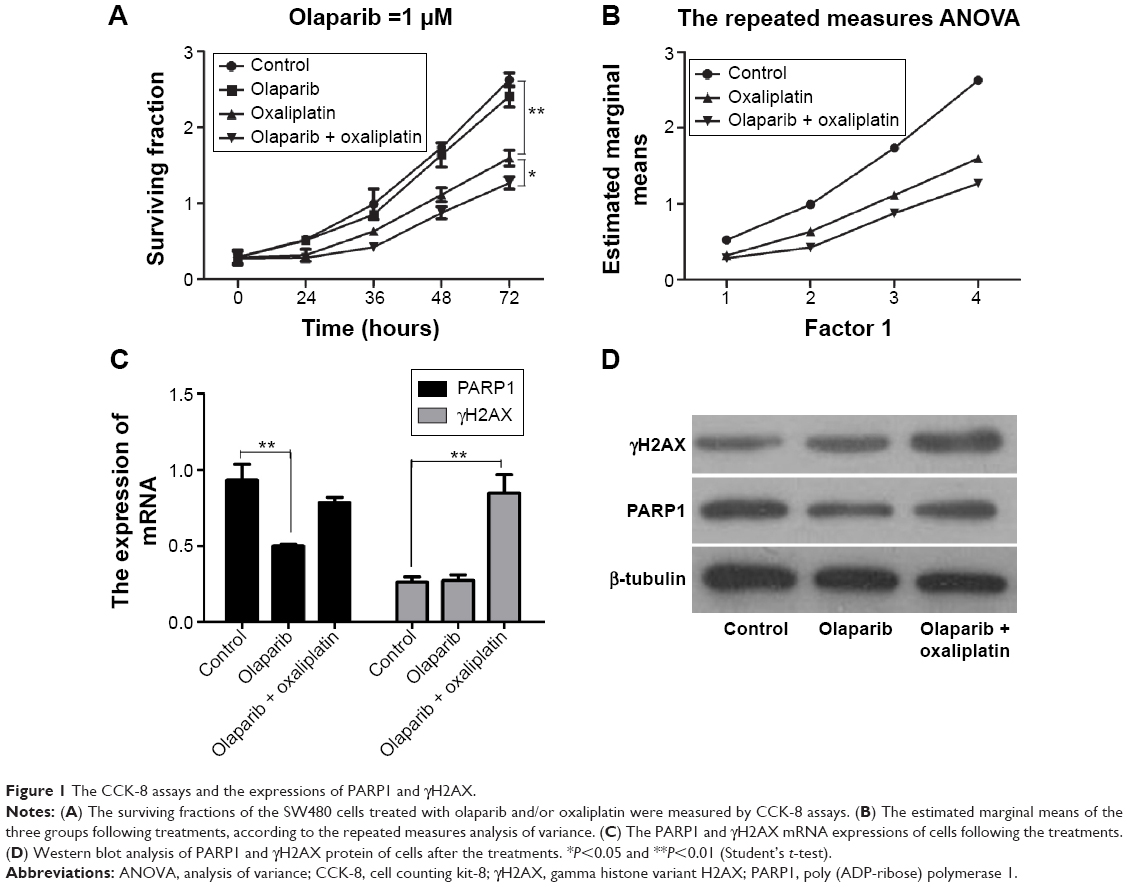 | Figure 1 The CCK-8 assays and the expressions of PARP1 and γH2AX. |
Olaparib changes the expression of PARP1 and γH2AX
QPCR showed that the expression of PARP1 following olaparib treatment was decreased compared with that of the control (P<0.01). Furthermore, we found that γH2AX was markedly upregulated in cells following olaparib and oxaliplatin treatment compared with the control (Figure 1C; P<0.01). However, there was no significant difference between the cells treated with olaparib alone and the control cells. The Western blot analysis results were consistent with the results of the QPCR (Figure 1D).
Combination of olaparib and oxaliplatin induces γH2AX foci formation
The kinetics of olaparib- and/or oxaliplatin-induced DNA damage was investigated by analysis of the expression levels of γH2AX. We analyzed γH2AX foci by immunofluorescence staining following treatment with olaparib and/or oxaliplatin. There was no difference between the cells treated with olaparib and control cells, suggesting that olaparib alone did not induce DSBs. Additionally, cells exposed to oxaliplatin combined with olaparib showed more γH2AX foci than cells treated with oxaliplatin or olaparib alone, or the untreated control cells (Figure 2; P<0.01).
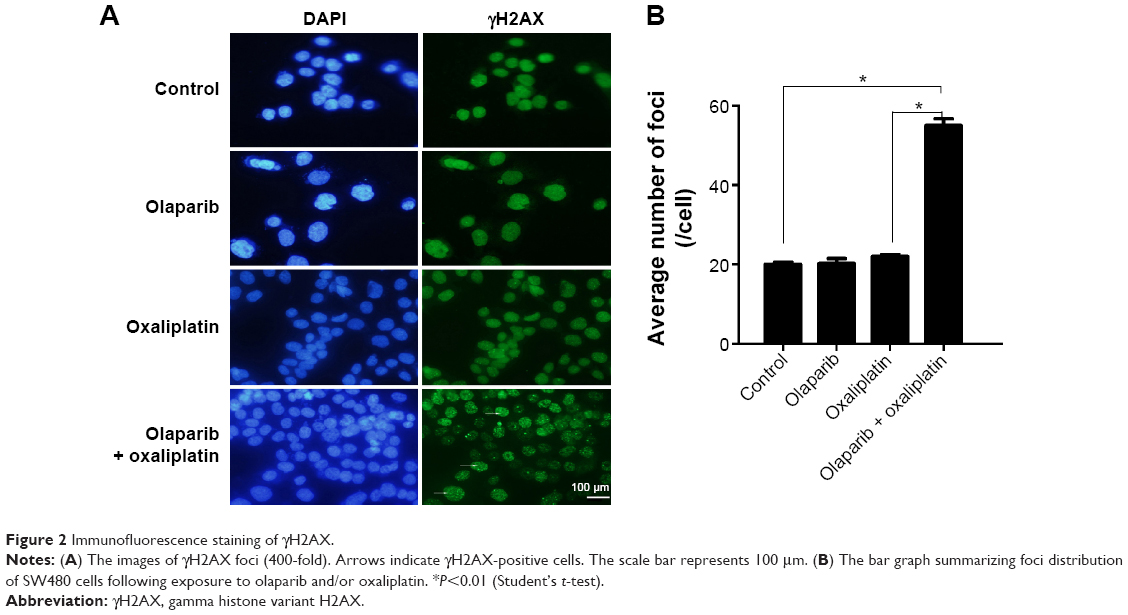 | Figure 2 Immunofluorescence staining of γH2AX. |
Combination of olaparib and oxaliplatin induces G2/M arrest in SW480 cells
The flow cytometry assay showed that there was no difference in the proportion of cells in G2/M-phase between the cells treated with olaparib and the control cells, suggesting that olaparib alone did not induce G2/M arrest. Additionally, cells treated with olaparib and oxaliplatin had more G2/M-phase cells than the cells treated with oxaliplatin alone or the untreated control cells (P<0.05; P<0.01, respectively). Collectively, these results suggest that olaparib helps oxaliplatin to arrest CRC cells in G2/M-phase (Figure 3).
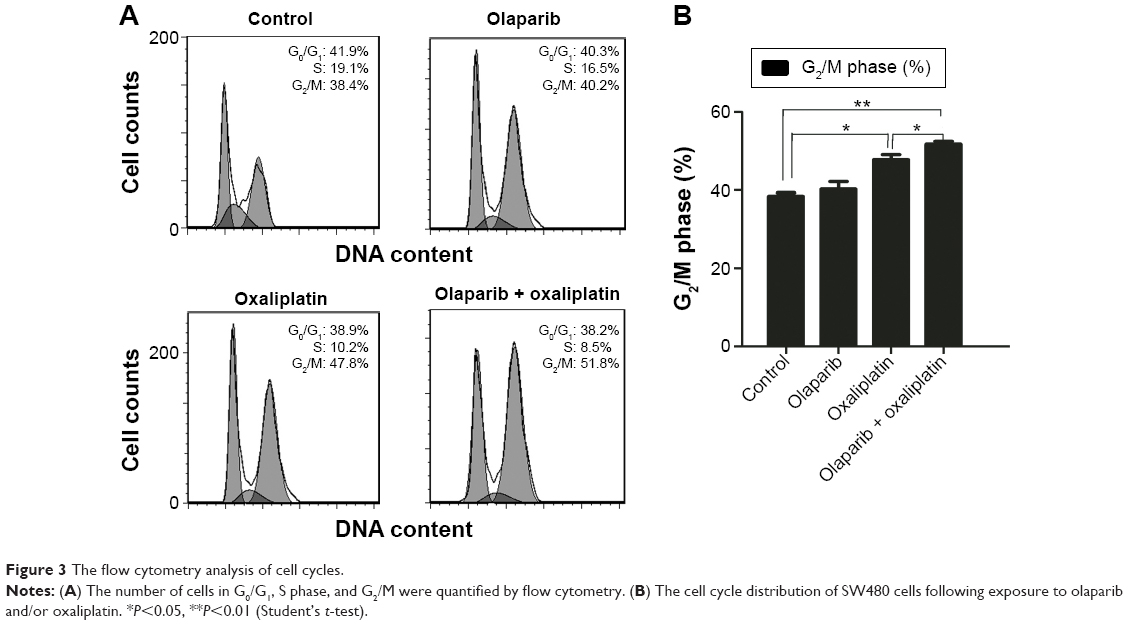 | Figure 3 The flow cytometry analysis of cell cycles. |
Combination of olaparib and oxaliplatin inhibits tumor growth in a mouse model
To determine whether olaparib enhances oxaliplatin-induced tumor volume changes, an SW480 cell CRC xenograft model was established and tumor volumes were measured using calipers (Figure 4). Tumor volume changes were calculated for treatment groups relative to control tumors. The tumor volume changes are shown in Figure 4B (tumor volume change = tumor volume – original volume). At day 28, following the first administration, olaparib and oxaliplatin combination treatment significantly slowed tumor growth (tumor volume change of 0.61 cm3) compared to the control (tumor volume change of 1.32 cm3; P=0.025<0.05). However, olaparib or oxaliplatin treatments alone did not slow tumor growth (tumor volume change of 2.37 cm3 for olaparib, P=0.55; volume change of 0.73 cm3 for oxaliplatin, P=0.1).
 | Figure 4 Illustrations of the animal experiments. |
The body weight changes of the mice were tracked to assess whether the combined treatment yielded systemic toxicity. However, the results showed that there was no difference in body weight among the groups (Figure 4C; P>0.05).
Combined treatment reduces Ki67 and increases γH2AX marker in tumor models
To determine whether the tumor growth delay from the combined therapy results from decreased tumor proliferation, Ki67 staining was performed using tissue sections from SW480 tumors in all groups. The Ki67 index was lowest in the combined treatment sections (P<0.05) (Figure 4D and E). Furthermore, we found that the expression of γH2AX in the combined treatment group was higher than that of the other groups (P<0.05). This result is consistent with the results of the immunofluorescence staining of the SW480 cells (Figure 4).
Discussion
Various PARP1 inhibitors have been studied in recent years. Olaparib is a bioavailable inhibitor of PARP1/2, and a Phase I trial using olaparib has been reported. In a clinical study, the plasma concentration of olaparib reached 11.5 μM after oral administration of 100 or 200 mg, which are doses that do not cause dose-limiting toxicity.14 Calabrese et al15 found that benzimidazole-4-carboxamides (BZ1–6) and tricyclic lactam indoles (TI1–5) can inhibit cell growth by 50% at concentrations ranging from 8 to 94 μm. When investigating the function of a PARP1 inhibitor (veliparib, ABT-888), Vilar et al16 found that the cell line harboring biallelic mutations in MRE11 had higher sensitivity to veliparib compared with the wild-type cell line. In this study, we chose to use 1.0 μM olaparib (according to the specification and results of our previous experiment). We compared the effects of olaparib and/or oxaliplatin on SW480 cells and found that olaparib had a cytotoxic effect when compared with the control. Furthermore, the results showed that a combination of oxaliplatin and olaparib significantly increased the lethal effect compared with that of oxaliplatin alone. Thus, combining PARP inhibitors with oxaliplatin may be a promising strategy for clinical application for the treatment of CRC cells.
Yoshikawa et al17 deemed that there was no close correlation between residual foci and radiosensitivity in cancer cells with high expression of endogenous γH2AX foci. However, many researchers agree that γH2AX foci is a good marker of DSBs, and therefore could be introduced to detect DSBs by counting foci in cells using an antibody against γH2AX.17–19 Accordingly, we detected γH2AX levels after treatment with olaparib and oxaliplatin. Although Chan et al20 found that PARP inhibition alone did not induce a statistically significant increase in γH2AX expression in vitro or in vivo, Western blotting showed that olaparib combined with oxaliplatin produced the most foci among all the groups; this was consistent with the results of immunofluorescence and immunohistochemical staining. These findings suggest that the sensitizing effect of olaparib for oxaliplatin may be related to the induction of DSBs.
Arango et al21 found that exposure of colon cancer cells to oxaliplatin resulted in G2/M arrest and apoptosis. Cheng et al22 found that there was a significant increase in the G2/M population in ERCC1-low HCC827 and PC9 cells induced by either cisplatin or olaparib, and that the combination of cisplatin and olaparib led to an even more prominent G2/M arrest than either agent alone. Our results suggest that oxaliplatin alone can cause G2/M arrest (P<0.05), and that cells treated with combination of olaparib and oxaliplatin have more G2/M-phase cells than control cells (P<0.01). Additionally, our study found that cells treated with combination of olaparib and oxaliplatin have more G2/M-phase cells than cells treated with oxaliplatin alone (P<0.05). Taken together, these results show that olaparib and oxaliplatin have a synergistic effect on G2/M arrest, and that olaparib helps oxaliplatin to arrest CRC cells in G2/M-phase.
We performed the in vivo experiments using an SW480 CRC cells xenograft model. When analyzing the data on tumor volume, we compared the differences between the total curves of the groups, rather than the differences at specific times, such as at 22, 25, or 28 days following the first administration. Olaparib or oxaliplatin treatments alone did not slow tumor growth (P>0.05). However, when compared with controls, the combination of olaparib and oxaliplatin delayed tumor growth (P<0.05). Consequently, we conclude that olaparib helps oxaliplatin to slow tumor growth. Immunohistochemical staining of Ki67 showed that proliferation in the combined treatment group was lower than that of the other groups.
When we compared the effects on tumor volume, we demonstrated that treatment with oxaliplatin alone did not slow tumor growth (P>0.05), but that the combination of olaparib and oxaliplatin did (P<0.05). However, our results do not prove that tumor cells treated with olaparib and oxaliplatin are of less volume or weight than those treated with oxaliplatin. This is a limitation of our study. We plan further studies exploring the combination of olaparib and oxaliplatin.
Ethical standards
The Sun Yat-sen University and First Affiliated Hospital Institutional Ethical Board approved the use of athymic nude mice for research purposes in this study (no 2013-147). No ethics statement was required from the institutional review board for the use of human cell lines. All animal-handling procedures were performed according to the Guide for the Care and Use of Laboratory Animals of the National Institutes of Health and followed the guidelines of the Animal Welfare Act. The manuscript does not describe clinical studies, and does not include patient data.
Acknowledgments
This study was supported by grants from the National Natural Science Foundation of China (NSFC-2011-81172339) and Guangdong Natural Science Foundation (2011B031800118).
Disclosure
The authors report no conflicts of interests in this work.
References
Jemal A, Center MM, DeSantis C, Ward EM. Global patterns of cancer incidence and mortality rates and trends. Cancer Epidemiol Biomarkers Prev. 2010;19:1893–1907. | ||
Ferlay J, Shin HR, Bray F, Forman D, Mathers C, Parkin DM. Estimates of worldwide burden of cancer in 2008: GLOBOCAN 2008. Int J Cancer. 2010;127(12):2893–2917. | ||
Dai Z, Zheng RS, Zou XN, et al. Analysis and prediction of colorectal cancer incidence trend in China. Zhonghua Yu Fang Yi Xue Za Zhi. 2012;46(7):598–603. | ||
Mathé G, Kidani Y, Segiguchi M, et al. Oxalato-platinum or 1-OHP, a third-generation platinum complex: an experimental and clinical appraisal and preliminary comparison with cis-platinum and carboplatinum. Biomed Pharmacother. 1989;43(4):237–250. | ||
Raymond E, Faivre S, Chaney S, Woynarowski J, Cvitkovic E. Cellular and molecular pharmacology of oxaliplatin. Mol Cancer Ther. 2002;1(3):227–235. | ||
Koizumi W, Takiuchi H, Yamada Y, et al. Phase II study of oxaliplatin plus S-1 as first-line treatment for advanced gastric cancer (G-SOX study). Ann Oncol. 2010;21(5):1001–1005. | ||
Oh SY, Kwon HC, Jeong SH, et al. A phase II study of S-1 and oxaliplatin (SOx) combination chemotherapy as a first-line therapy for patients with advanced gastric cancer. Invest New Drugs. 2012;30(1):350–356. | ||
Woynarowski JM, Faivre S, Herzig MC, et al. Oxaliplatin-induced damage of cellular DNA. Mol Pharmacol. 2000;58(5):920–927. | ||
Chiu SJ, Lee YJ, Hsu TS, Chen WS. Oxaliplatin-induced γ-H2AX activation via both p53-dependent and -independent pathways but is not associated with cell cycle arrest in human colorectal cancer cells. Chem Biol Interact. 2009;182(2–3):173–182. | ||
Rogakou EP, Nieves-Neira W, Boon C, Pommier Y, Bonner WM. Initiation of DNA fragmentation during apoptosis induces phosphorylation of H2AX histone at serine 139. J Biol Chem. 2000;275(13):9390–9395. | ||
Tentori L, Muzi A, Dorio AS, et al. MSH3 expression does not influence the sensitivity of colon cancer HCT116 cell line to oxaliplatin and poly(ADP-ribose) polymerase (PARP) inhibitor as monotherapy or in combination. Cancer Chemother Pharmacol. 2013;72:117–125. | ||
Hoeijmakers JH. DNA damage, aging, and cancer. N Engl J Med. 2009;361(15):1475–1485. | ||
Farmer H, McCabe N, Lord CJ, et al. Targeting the DNA repair defect in BRCA mutant cells as a therapeutic strategy. Nature. 2005;434(7035):917–921. | ||
Fong PC, Boss DS, Timothy A, et al. Inhibition of poly (ADP-ribose) polymerase in tumors from BRCA mutation carriers. N Engl J Med. 2009;361(2):123–134. | ||
Calabrese CR, Batey MA, Thomas HD, et al. Identification of potent nontoxic poly(ADP-Ribose) polymerase-1 inhibitors: chemopotentiation and pharmacological studies. Clin Cancer Res. 2003;9(7):2711–2718. | ||
Vilar E, Bartnik CM, Stenzel SL, et al. MRE11 deficiency increases sensitivity to poly (ADP-ribose) polymerase inhibition in microsatellite unstable colorectal cancers. Cancer Res. 2011;71(7):2632–2642. | ||
Yoshikawa T, Kashino G, Ono K, Watanabe M. Phosphorylated H2AX foci in tumor cells have no correlation with their radiation sensitivities. J Radiat Res. 2009;50(2):151–160. | ||
Kato TA, Nagasawa H, Weil MM, Genik PC, Little JB, Bedford JS. γ-H2AX foci after low-dose-rate irradiation reveal atm haploinsufficiency in mice. Radiat Res. 2006;166(Pt 1):47–54. | ||
Kinner A, Wu W, Staudt C, Iliakis G. γ-H2AX in recognition and signaling of DNA double-strand breaks in the context of chromatin. Nucleic Acids Res. 2008;36(17):5678–5694. | ||
Chan N, Pires IM, Bencokova Z, et al. Contextual synthetic lethality of cancer cell kill based on the tumor microenvironment. Cancer Res. 2010;70(20):8045–8054. | ||
Arango D, Wilson AJ, Shi Q, et al. Molecular mechanisms of action and prediction of response to oxaliplatin in colorectal cancer cells. Br J Cancer. 2004;91(11):1931–1946. | ||
Cheng H, Zhang Z, Borczuk A, et al. PARP inhibition selectively increases sensitivity to cisplatin in ERCC1-low non-small cell lung cancer cells. Carcinogenesis. 2013;34(4):739–749. |
 © 2015 The Author(s). This work is published and licensed by Dove Medical Press Limited. The full terms of this license are available at https://www.dovepress.com/terms.php and incorporate the Creative Commons Attribution - Non Commercial (unported, v3.0) License.
By accessing the work you hereby accept the Terms. Non-commercial uses of the work are permitted without any further permission from Dove Medical Press Limited, provided the work is properly attributed. For permission for commercial use of this work, please see paragraphs 4.2 and 5 of our Terms.
© 2015 The Author(s). This work is published and licensed by Dove Medical Press Limited. The full terms of this license are available at https://www.dovepress.com/terms.php and incorporate the Creative Commons Attribution - Non Commercial (unported, v3.0) License.
By accessing the work you hereby accept the Terms. Non-commercial uses of the work are permitted without any further permission from Dove Medical Press Limited, provided the work is properly attributed. For permission for commercial use of this work, please see paragraphs 4.2 and 5 of our Terms.