")
Back to Journals » Diabetes, Metabolic Syndrome and Obesity » Volume 14
Combined Effects of Dyslipidemia and High Adiposity on the Estimated Glomerular Filtration Rate in a Middle-Aged Chinese Population
Authors Wang X, Wang H, Li J, Gao X, Han Y, Teng W, Shan Z, Lai Y
Received 1 September 2021
Accepted for publication 4 November 2021
Published 10 November 2021 Volume 2021:14 Pages 4513—4522
DOI https://doi.org/10.2147/DMSO.S337190
Checked for plagiarism Yes
Review by Single anonymous peer review
Peer reviewer comments 3
Editor who approved publication: Professor Ming-Hui Zou
Xichang Wang, Haoyu Wang, Jiashu Li, Xiaotong Gao, Yutong Han, Weiping Teng, Zhongyan Shan, Yaxin Lai
Department of Endocrinology and Metabolism and the Institute of Endocrinology, The NHC Key Laboratory of Diagnosis and Treatment of Thyroid Diseases, The First Hospital of China Medical University, Shenyang, 110001, People’s Republic of China
Correspondence: Yaxin Lai
Department of Endocrinology and Metabolism and the Institute of Endocrinology, The NHC Key Laboratory of Diagnosis and Treatment of Thyroid Diseases, The First Hospital of China Medical University, No. 155 Nanjing North Street, Heping District, Shenyang, 110001, People’s Republic of China
Tel +86-13804048045
Email [email protected]
Background: Some studies have reported that chronic kidney disease (CKD) or the estimated glomerular filtration rate (eGFR) is significantly associated with metabolic abnormalities.
Methods: Six hundred forty-six community residents aged 45– 60 years without overt renal dysfunction were recruited in this cross-sectional study. eGFR was estimated by serum creatinine measurement. The visceral fat area (VFA) and subcutaneous fat area (SFA) were assessed by magnetic resonance imaging (MRI). The body mass index (BMI) and waist-hip ratio (WHR) were also evaluated. Additionally, we tested the subjects’ blood lipid levels to diagnose dyslipidemia.
Results: Compared with the subjects with neither dyslipidemia nor obesity, men with both dyslipidemia and high obesity indices, such as BMI, WHR and VFA, showed a significantly lower mean eGFR; women with dyslipidemia with high WHR, VFA or SFA also showed a significantly lower mean eGFR. Although an independent association between the metabolic variables and eGFR was not found except for BMI, some of the combined effects of each variable were related to eGFR decline. Comorbidity of dyslipidemia and high WHR was significant risk factor for eGFR reduction (β − 8.805, SD 4.116, p < 0.05). Additionally, comorbidity of dyslipidemia and high obesity indices such as BMI (β − 12.942, SD 5.268, p < 0.05) and VFA (β − 7.069, SD 3.394, p < 0.05) were significant risk factors for eGFR reduction in men.
Conclusion: The combined effect of dyslipidemia and high obesity indices is significantly related to the decline in eGFR. The association is more profound in men.
Keywords: dyslipidemia, obesity, estimated glomerular filtration rate, cross-sectional study
Introduction
Increasing evidence has shown that chronic kidney disease (CKD) is an independent risk factor for cardiovascular disease, cognitive dysfunction, and all-cause mortality.1 CKD poses serious threats to the survival period and quality of life. According to a nationwide cross-sectional survey, the prevalence of CKD in China has reached 10.8%.2 To curb this public health problem, it is necessary to explore the potential risk factors for CKD and identify possible prevention strategies.
CKD is mainly diagnosed by a reduced estimated glomerular filtration rate (eGFR), a very feasible indicator to assess the renal function.3 Since end-stage renal disease (ESRD) is an irreversible and pernicious renal disease, it is very urgent to identify risk factors for the prevention and early diagnosis of eGFR reduction, especially in high-risk subjects with normal eGFR. A cluster of metabolic abnormalities, including hyperglycemia, dyslipidemia, elevated blood pressure (BP), are components of the presence of metabolic syndrome (MetS).4 Although the previous findings were not consistent, most relevant studies have indicated the significant role of these individual metabolic abnormalities on the risk of CKD or eGFR reduction, both in Eastern and Western countries.5–8 The meta-analysis of Thomas et al also reached similar conclusions. After meta-analyzing the conclusions of 10 studies, the researchers found that MetS could increase the risk for eGFR reduction (<60 mL/min per 1.73 m2) by 55%, and every individual metabolic abnormality (such as obesity, elevated BP, dyslipidemia, etc.) also played a significant role.9
However, previous studies had limitations. Almost all the findings were based on the independent impact of metabolic abnormalities on eGFR, rather than the impact of the superposition of specific metabolic abnormalities. This is unfavorable for assessing the filtration function for subjects with multiple metabolic abnormalities. Additionally, conventional adiposity indicators are relatively insufficient to predict the risk of cardiovascular events or reflect the wellbeing of individuals. The emergence of several novel anthropometrics can effectively reflect the degree of fat accumulation and has their own characteristics in predicting the risk of obesity-related diseases. For example, studies have recommended measuring the area of visceral or subcutaneous fat to evaluate the association between abdominal obesity and multiple adverse outcomes.10–12 This evidence has provided more practical suggestions to diagnose and manage obesity.
This study aimed to explore the association between the combined effects of dyslipidemia and obesity on eGFR in subjects with an eGFR higher than 60 mL/min per 1.73 m2. Multiple methods were applied to evaluate anthropometric indicators, ie, body mass index (BMI), waist hip ratio (WHR), subcutaneous fat area (SFA), and visceral fat area (VFA), to determine whether they correlated with eGFR independently or via the combined effects with dyslipidemia.
Materials and Methods
Study Participants
The data analyzed in the present study were derived from the baseline population of a community-based cohort study in Shenyang, Liaoning Province.13–15 Seven hundred fifty subjects aged 40–65 years were recruited for the health examination project [Nanzhan Community Survey of Metabolic Disorders, NOVEMBER Study]. The study was approved by the Ethics Committee of the First Hospital of China Medical University. The study was performed in accordance with the principles of the Declaration of Helsinki. All the participants signed an informed consent form. Participants who met one of the following criteria were preliminarily excluded: 1) pregnant women or within the first year of the postpartum period; 2) participants with a personal history of thyroid dysfunction or currently using thyroid medications; 3) participants with a personal history of malignant tumor or other chronic wasting diseases; 4) participants without complete abdominal MRI information.
Data Collection
All the participants were required to participate in the survey after an overnight fast for at least 10 hours. Demographic information such as sex, date of birth, educational level, smoking and drinking status, and personal and family history of multiple diseases or medications were acquired using a standardized questionnaire. Each subject was measured for waist and hip circumference by trained nurses, and WHR was directly calculated. Weight and height were measured when the participants wore underwear without shoes. The BMI was calculated using the following formula: BMI = weight (kg)/height squared (m2). Systolic blood pressure (SBP) and diastolic blood pressure (DBP) were measured twice using a mercury sphygmomanometer on the right arm after a rest period for over 30 minutes. The average of the two measurements was calculated and regarded as the final BP value.
MRI scans were obtained at the abdominal level between the L4 and L5 vertebrae in the prone position (FOV: 42 cm*42 cm; thickness: 1 cm; 6 layers; GE, USA), using the abdominal coil. SLICE-O-MATIC software (version 4.2; Tomovision Inc., Montreal, QC, Canada) was applied to generate graphical displays of the imaging data and to calculate VFA and SFA by two technicians. Image quality was well-controlled by an experienced operator.
Fasting venous blood was collected from each subject. The samples were stored immediately at −20°C and sent to the Endocrine Laboratory at the First Hospital of China Medical University. Additionally, each participant was asked to complete a 75-g oral glucose tolerance test, and 2-hour plasma glucose levels were also measured in the same laboratory. Serum thyroid-stimulating hormone (TSH) was detected using the Cobas 601 Analyzer (Roche Diagnostics, Basel, Switzerland). High-performance liquid chromatography (BioRad VARIANT II Hemoglobin Analyzer, California, US) was applied to detect glycated hemoglobin (HbA1c) in venous blood samples. Fasting and 2-hour plasma glucose, fasting serum total cholesterol (TC), low-density lipoprotein cholesterol (LDL-c), high-density lipoprotein cholesterol (HDL-c), triglycerides (TG), and serum creatinine were all measured using an autobiochemical analyzer (Mindray BS180, Shenzhen, China).
Renal filtration function was assessed by eGFR. Similar to the nationwide study conducted by Zhang et al, eGFR was estimated using the modified Modification of Diet in Renal Disease (MDRD) equation.2,16 The formula for calculating eGFR was as follows (Scr in mg/dL and age in years), and participants with an eGFR ≤ 60 mL/min per 1.73 m2 were all excluded.

Diagnostic Criteria
If the subjects admitted that they were taking antihypertensive drugs or the average level of SBP or DBP was higher than 140/90 mmHg, hypertension was diagnosed. According to the kit instructions, the reference interval of TSH is 0.27–4.20 mU/L. If TSH exceeds or falls below the range or if the subject admits to a personal history of thyroid disease or is currently taking thyroid medications, the subject would be diagnosed with thyroid dysfunction. Diabetes was diagnosed based on the 2018 American Diabetes Association (ADA) guidelines.17 If the subject had self-reported diabetes or met one of the following items, diabetes was diagnosed: fasting plasma glucose ≥7 mmol/L; two-hour plasma glucose ≥11.1 mmol/L; HbA1c ≥6.5%.
The diagnostic criteria for dyslipidemia were extracted from the Third Report of the National Cholesterol Education Program (NCEP) Expert Panel:18 1.7 mmol/L, 5.2 mmol/L, and 3.4 mmol/L were regarded as the thresholds for TG, TC and LDL-c abnormalities, respectively (described as “borderline high” in the guidelines). Additionally, 1.0 mmol/L and 1.3 mmol/L were applied as the thresholds for HDL-c abnormalities (described as a “marginal risk factor” in the guidelines) among men and women, respectively. If the subject met one of the above items or was currently taking lipid-lowering medications, dyslipidemia was determined.
In the present study, the indicators for assessing obesity mainly included BMI, WHR, VFA and SFA. According to previous studies in Chinese adults, the thresholds of the four obesity indices were defined as follows. High BMI was defined as BMI ≥28 kg/m2, regardless of sex.19 The threshold value of WHR was 0.88 in men and 0.86 in women.20 The optimal threshold value of VFA was set at 80 cm2.21 Additionally, if the subject’s SFA were higher than its 75th percentile, high SFA would be diagnosed.22 Accordingly, 200.72 cm2 was regarded as the 75th percentile threshold for SFA.
Statistical Analysis
The above data were input into the Statistical Package for the Social Sciences version 25 (SPSS Inc., Chicago, US). All p values obtained were based on two-tailed tests, with significance levels set at 0.05. In the descriptive analysis, continuous variables were described as means and standard deviation (SD), and dichotomous variables were described as numbers and corresponding percentages. Single-sample t-test and chi-squared test were used to compare differences in continuous and dichotomous variables, respectively, between the groups with different characteristics. The Pearson correlation coefficient was applied to estimate the relationships between eGFR and variables, including age, smoking status, and drinking status. Univariate and multivariate linear regression were applied to analyze the effects of different variables on eGFR.
Results
Baseline Characteristics
Six hundred forty-six residents aged 45–60 years were enrolled in the final data analysis and included 319 men and 327 women. Table 1 shows the baseline characteristics overall and according to sex. The height and weight of men were both significantly higher than women (170.19±5.85 cm vs 158.90±5.96 cm; p<0.05) (74.15±10.49 kg vs 61.95±9.39 kg; p<0.05). Certain differences were found in the lifestyles of men and women. Among them, the proportion of smokers (78.4% vs 4.6%; p<0.05) and drinkers (75.2% vs 13.5%; p<0.05) was significantly higher in men, who had a relatively unstable dining habit (88.4% vs 95.7%; p<0.05) and preferred to drink tea (40.8% vs 15.3%; p<0.05). Additionally, the prevalence of hypertension (35.7% vs 21.1%; p<0.05) and dyslipidemia (63.9% vs 45.9%; p<0.05) were both significantly higher in men. Among the 354 patients with dyslipidemia, 247 had abnormalities in two or more components, and the remaining patients had abnormalities in only one single lipidemic parameter. The distribution of abdominal fat and obesity indices also showed significant differences between male and female subjects. The SFA and VFA values were lower and higher, respectively, in men (SFA: 139.87±54.57 cm2 vs 189.27±65.35 cm2, p<0.05; VFA: 98.16±45.18 cm2 vs 67.24±30.97 cm2, p<0.05). The values of BMI and WHR were both significantly higher in male subjects (BMI: 25.58±3.25 kg/m2 vs 24.52±3.37 kg/m2, p<0.05; WHR: 0.92±0.05 vs 0.88±0.06, p<0.05). Significant differences were found in glomerular filtration function between the groups. The mean eGFR in men was significantly lower (113.26±21.17 vs 165.30±55.82; p<0.05).
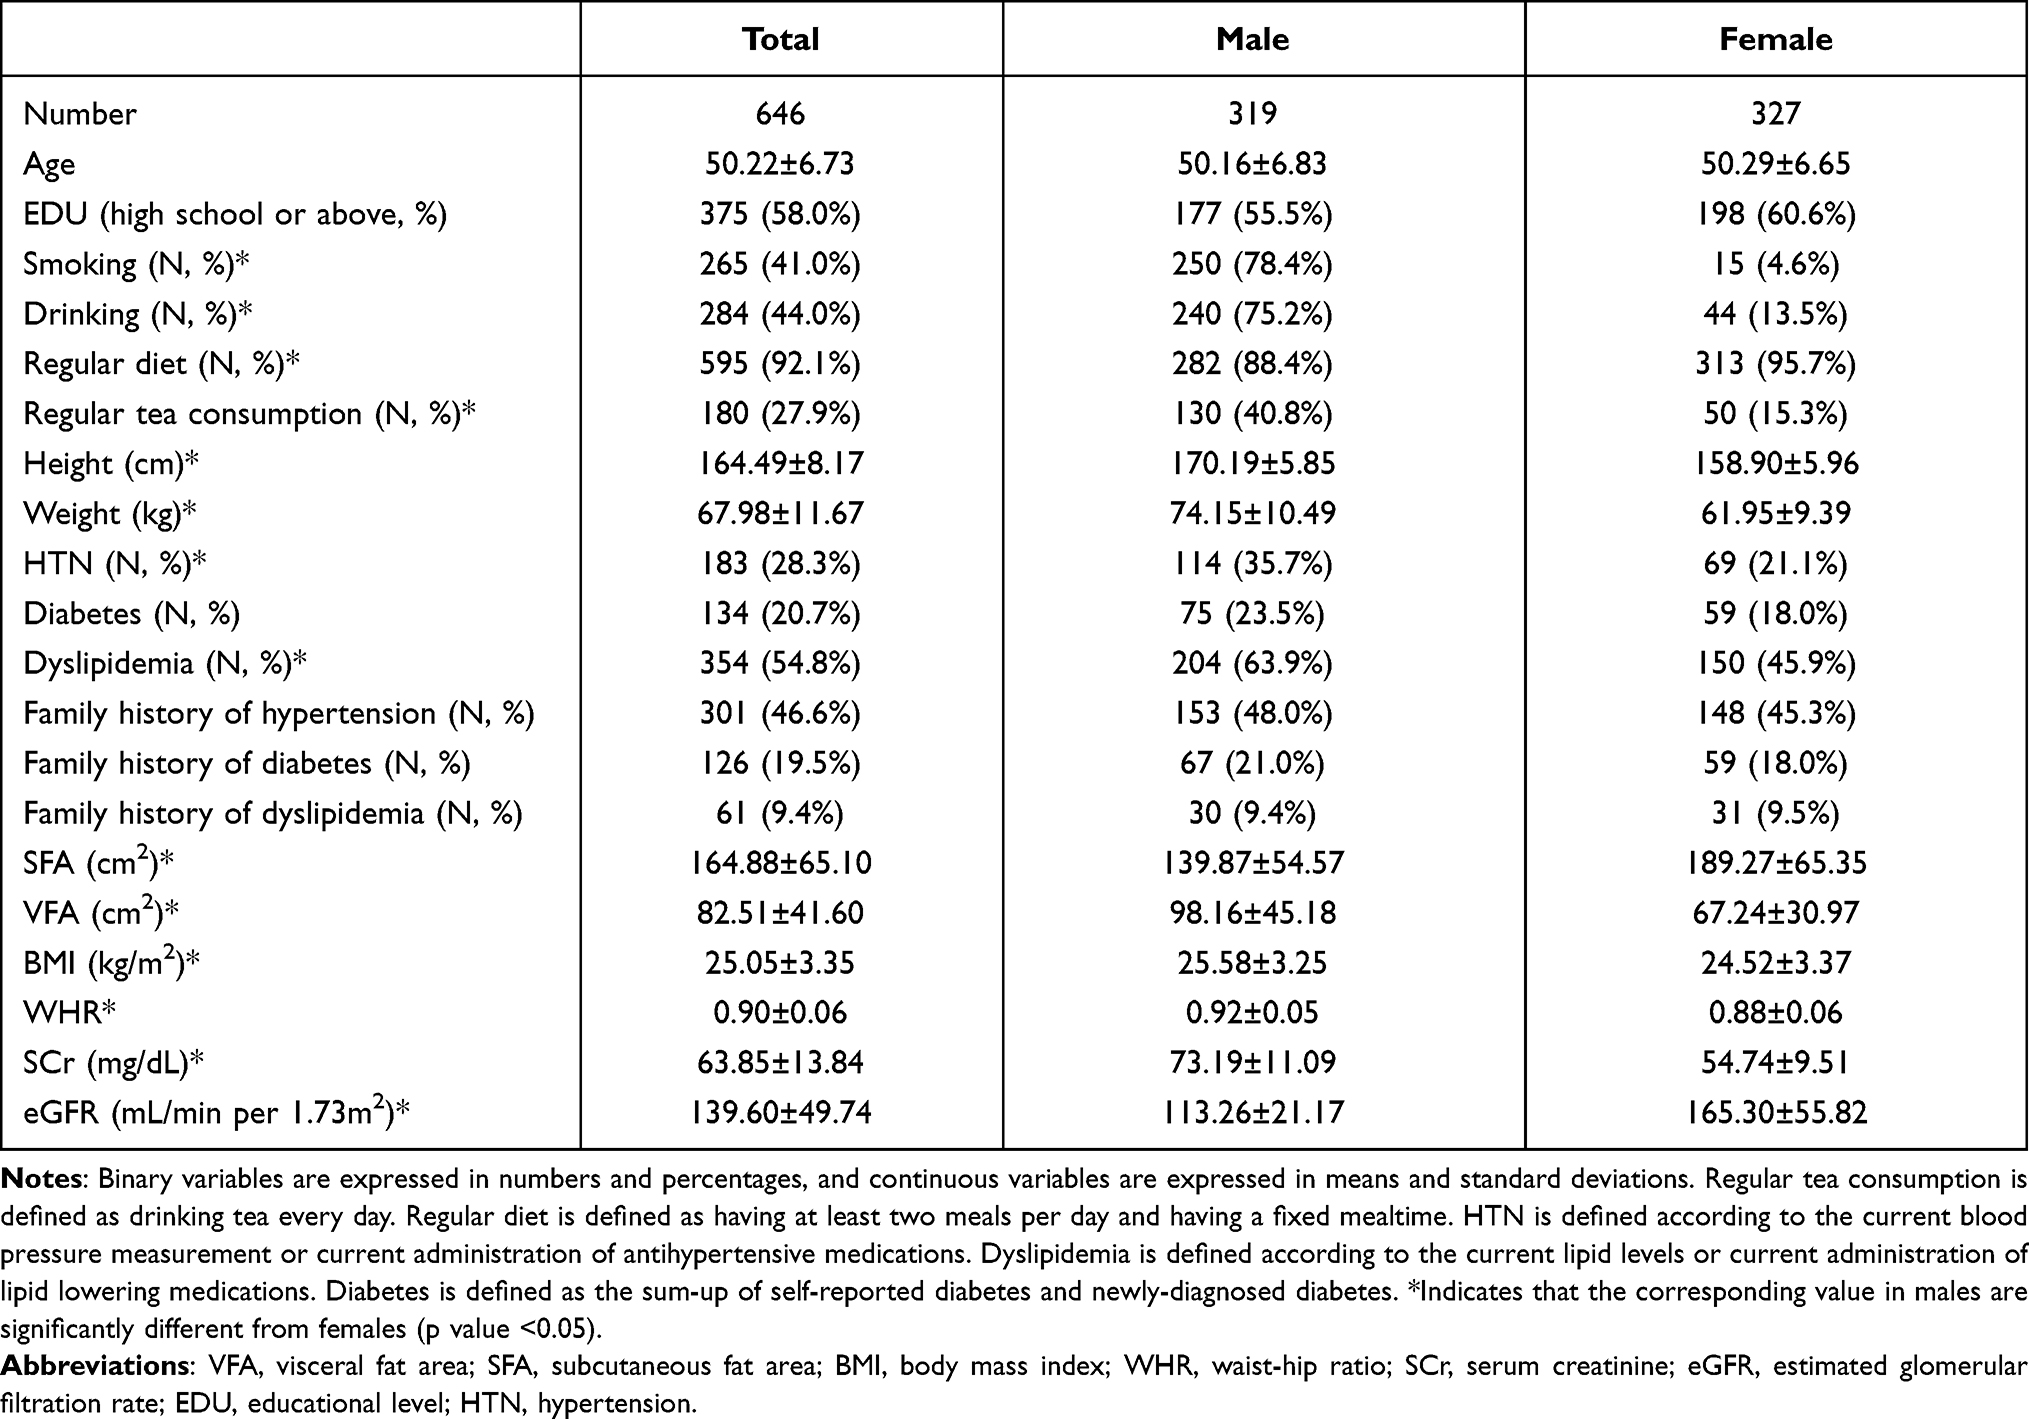 |
Table 1 Baseline Characteristics of the Participants (N=646) |
Correlation Between the eGFR Levels and Variables
The correlation between the eGFR levels and various anthropometric and biochemical parameters according to sex is shown in Table 2. Except for dietary habits, educational level and diabetes, all the correlations were statistically significant at p=0.001 or lower, regardless of sex. In each group with a single sex, some of the variables were also significantly correlated with eGFR. Age and diabetes were both negatively correlated with eGFR in men; and age, BMI, and VFA were all significantly negatively correlated with eGFR in women.
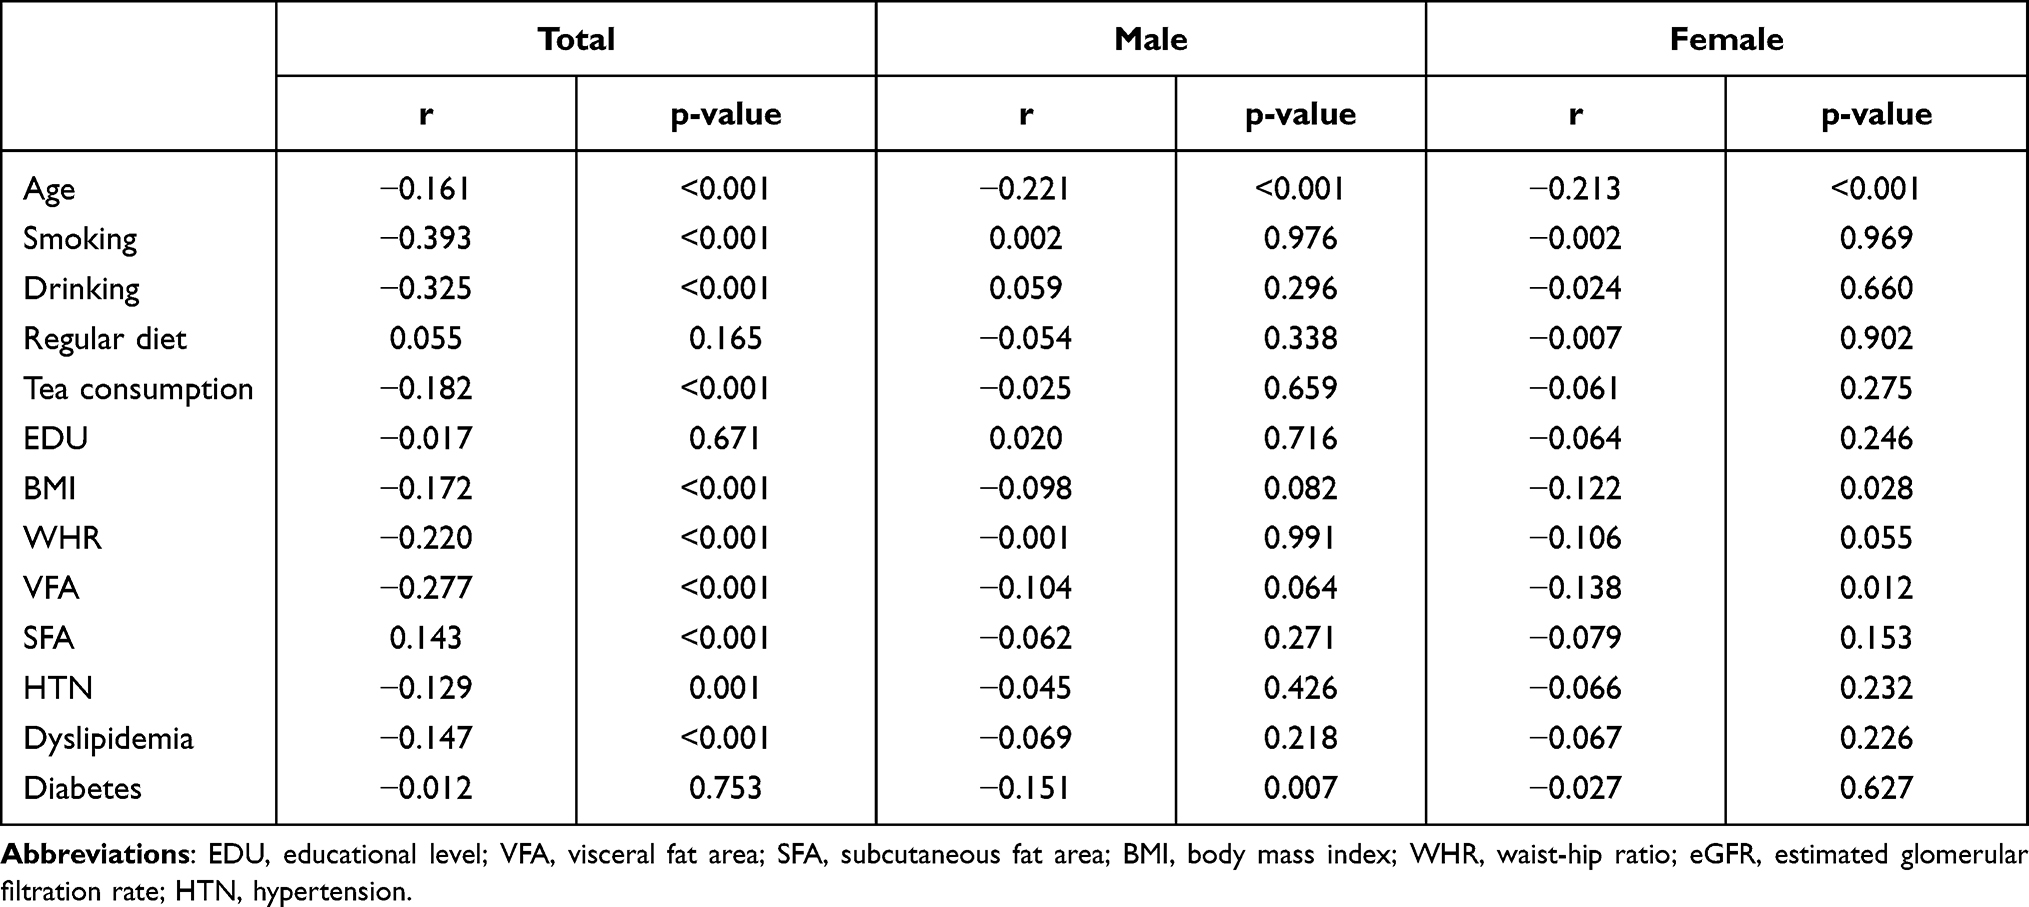 |
Table 2 Pearson Correlation Coefficients of eGFR Levels with Various Anthropometric and Biochemical Parameters |
Subgroup Comparison According to the Combination of Dyslipidemia and Obesity
Table 3 presents the mean eGFR levels of subjects with isolated dyslipidemia without obesity, isolated obesity without dyslipidemia, and subjects with or without both features. The above results were also presented according to sex. Subjects with neither high obesity indices nor dyslipidemia were set as the reference. Regarding men with either dyslipidemia or a high obesity index, the eGFR values were significantly lower in those with isolated high BMI (p=0.009) and isolated dyslipidemia without high WHR (p=0.046). Additionally, except for subjects with both dyslipidemia and high SFA, the eGFR levels were all significantly lower in the other three comorbidity subgroups. In male subjects, the decreasing trend of eGFR reached significance with the superposition of dyslipidemia and high BMI (p=0.002) or SFA (p=0.045).
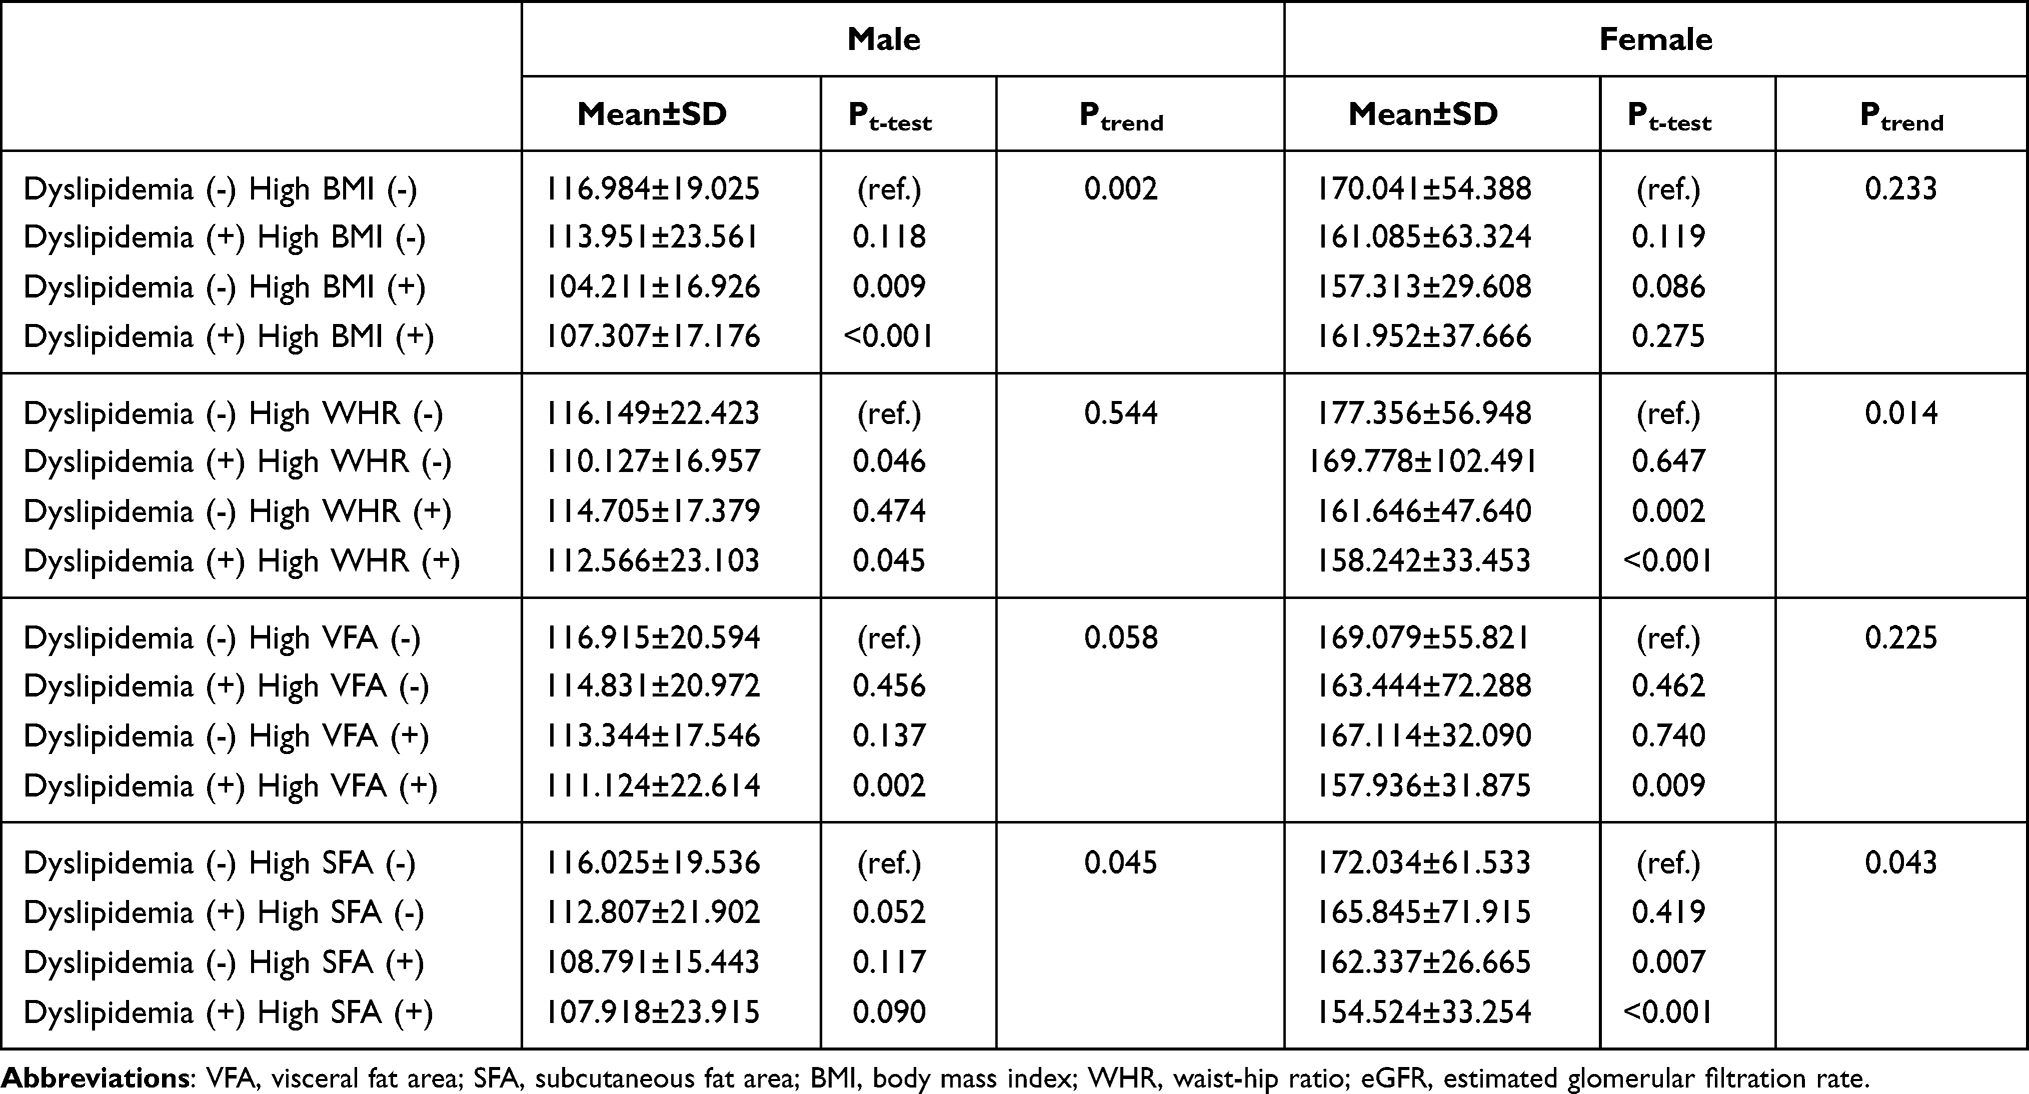 |
Table 3 Mean Value and Standard Deviation (SD) of eGFR According to Combination of Obesity Indices and Dyslipidemia |
Regarding women with either dyslipidemia or a high obesity index, the levels of eGFR were significantly lower in subjects with isolated high WHR (p=0.002) or isolated high SFA (p=0.007). Except for BMI, the other three comorbidity subgroups all showed a significantly lower eGFR in women. In female subjects, the decreasing trend of eGFR reached significance with the superposition of dyslipidemia and high WHR (p=0.014) or SFA (p=0.043).
Multivariate Regression Analysis Between eGFR and Dyslipidemia and Obesity
The abovementioned four obesity indicators (ie, BMI, WHR, VFA, SFA) and dyslipidemia were assessed to determine whether they were independently associated with the decrease in eGFR (Table 4). According to the Pearson correlation results, age, sex, smoking status, drinking status, tea consumption, hypertension and diabetes were set as confounding factors in model 2. None of the factors was adjusted in model 1.
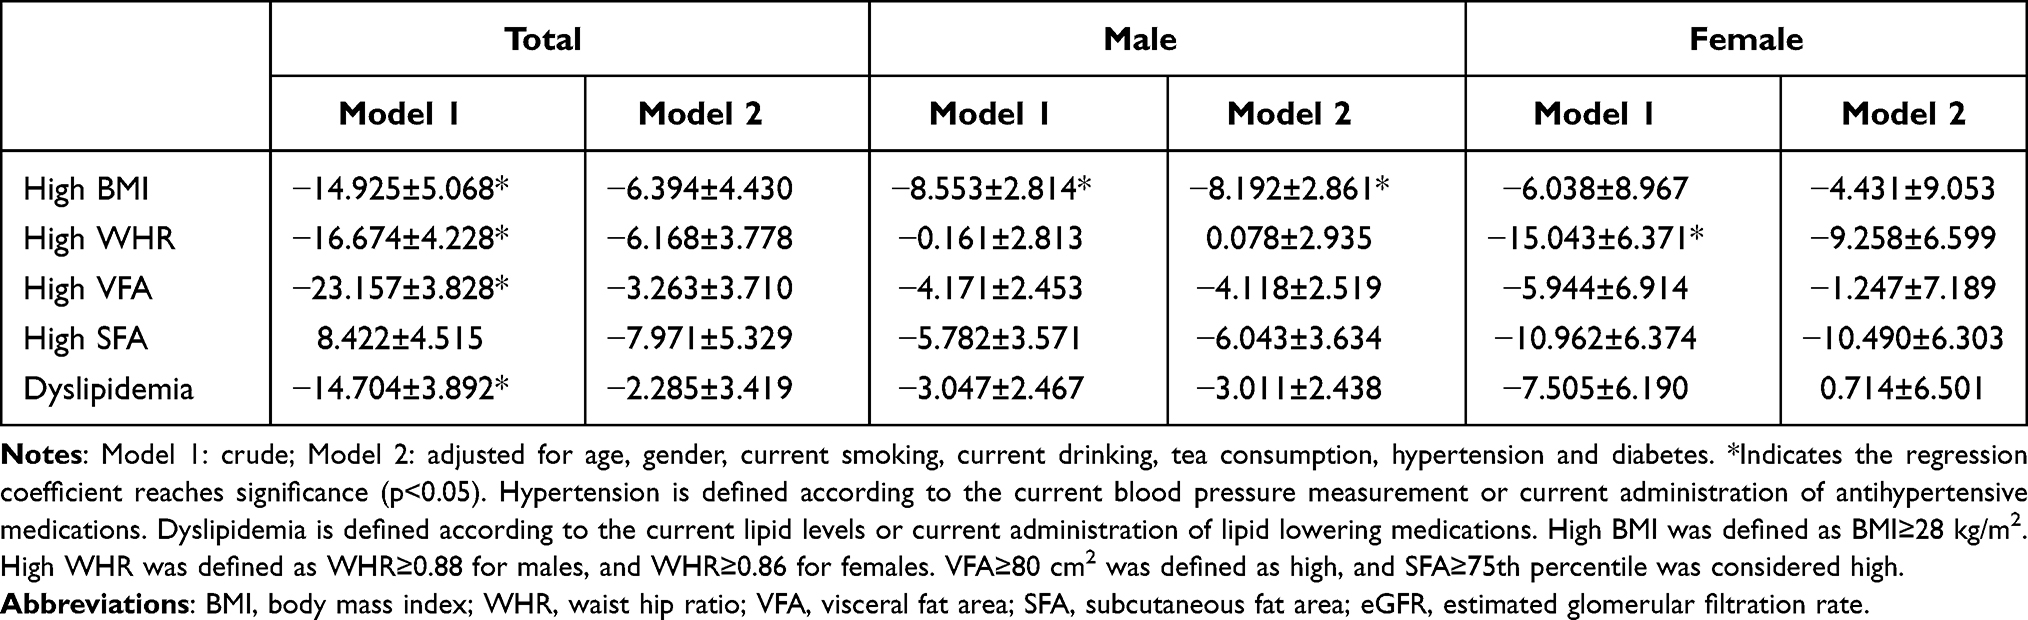 |
Table 4 Multivariate Adjusted Regression Coefficients (β) of the Association of eGFR with Obesity Indices and Dyslipidemia |
According to the results in model 1, high BMI, high WHR, high VFA, and dyslipidemia were all risk factors for decreased eGFR (p<0.05) in the general population. Additionally, high BMI and high WHR were negatively associated with eGFR in men and women, respectively (p<0.05).
However, most of the significant variables in model 1 did not show significance after adjusting for confounding factors. High BMI was an independent risk factor for eGFR reduction (p<0.05) in men, while other obesity indicators or dyslipidemia were not in-dependently associated with the eGFR level overall or specifically in men or women.
Multivariate Regression Analysis Between eGFR and the Combined Effects of Dyslipidemia and Obesity
Multivariate linear regression was performed to determine the association between isolated and combined effects of obesity and dyslipidemia and eGFR (Table 5). Similarly, all the regression coefficients were adjusted for age, sex, smoking status, drinking status, tea consumption, diabetes and hypertension, and the subgroup with neither obesity nor dyslipidemia was regarded as the reference. In the general population, none of the isolated dyslipidemia or isolated high obesity indicators showed a significant association with the variation in eGFR. However, the combined effect of dyslipidemia and high WHR is an independent risk factor for eGFR reduction (p=0.033).
 |
Table 5 Regression Coefficients (β±SD) for eGFR According to Combination of Obesity Indices and Dyslipidemia |
Compared with female subjects, male subjects showed a more profound association. High BMI was an independent risk factor for decreased eGFR in men, both isolated (p=0.004) and combined with dyslipidemia (p=0.016). Additionally, comorbidity of dyslipidemia and high VFA was also negatively associated with the eGFR in men (p=0.039). However, none of the regression coefficients showed significance in women.
Discussion
To our best knowledge, this study is the first concerning the combined effects of dyslipidemia and obesity parameters in relation to eGFR variation. Our study not only confirms some of the previous results but also supplements them. High BMI is an independent risk factor for eGFR reduction, and eGFR declines more significantly under the combined effect of high BMI and dyslipidemia, particularly in men. Regarding other obesity indicators (such as WHR, VFA, and SFA), we found no significant independent association with eGFR. However, several of the abdominal adiposity indicators can be regarded as risk factors for eGFR reduction if superimposed with dyslipidemia, overall or in men. This study provides a reference value for clinical practice. For patients with both dyslipidemia and obesity, glomerular dysfunction should be monitored for timely prevention or intervention.
Recently, with the continued increase in longevity and lifestyle changes in China, the prevalence of various metabolic abnormalities remains high.23–26 The burden of CKD and ESRD caused by this condition is a concern. Although the increasing prevalence of CKD or eGFR reduction may be due to lifestyle changes, life expectancy extension and laboratory technology development, considering the extensive biological effects of metabolic disorders, we should further consider and explore the impact of metabolic abnormalities on eGFR. According to previous evidence, several cardiometabolic abnormalities are independent risk factors for CKD or eGFR reduction, thus a potential impact of the combined effect of dyslipidemia and various obesity phenotypes may exist. For example, studies have revealed a negative independent relationship between BMI and eGFR values, a finding similar to the present results.27–29 However, some scholars have different opinions. A cross-sectional study conducted in Western Cameroon confirmed that high BMI (≥ 25 kg/m2) was neither a risk factor for overall CKD nor higher-stage CKD (G3-G4),30 which reached a similar conclusion to a former survey in Northern Senegal.31 In another Taiwanese cross-sectional study, the researchers divided 14,983 subjects into two groups—metabolically healthy and unhealthy groups. The CKD risk did not increase significantly with increasing weight in the metabolically healthy group, while the trend was significantly positive in the other group. The study suggested that BMI per se is not an independent risk factor for CKD.32 Moreover, a cohort study of 453,946 American veterans with an eGFR lower than 60 mL/min per 1.73m2 obtained a U-shaped association between BMI and the progression of renal disease, with the best outcomes observed in overweight and mildly obese subjects.33 In our study, the significant association between BMI per se and eGFR confirms some of the previous evidence. Moreover, under the combined effect with dyslipidemia, eGFR showed significant differences and a significant decrease between different subgroups, and the combined effects could be considered independent risk factors for eGFR decline. The above conclusion is a supplement to the previous evidence.
As far as we know, there is little previous evidence regarding the association between abdominal obesity and eGFR values. However, the impact of high VFA on eGFR decline or CKD seems to be more obvious than other parameters. In fact, there are opinions that the physiological effects of abdominal fat are quite different in different sites.34 Among the various types of fat depots, the effect of VFA on various cardiometabolic abnormalities may be the most obvious.11,35–37 A Japanese cohort study demonstrated that the VFA/SFA ratio was closely related to the progress of CKD. This cohort study recruited 200 CKD patients with a median follow-up duration of 12.8 years. Different from our opinion, there is a strong correlation between the VFA/SFA ratio and the prognosis in females, but not in males.38 We considered that it may be caused by differences in the inclusion criteria of subjects, the definition of eGFR reduction, and the detection methods of abdominal fat area. Moreover, an earlier Korean cross-sectional study also found that the higher tertiles of VFA and the risk of CKD (eGFR<60 mL/min/1.73m2) were closely related. Our findings are similar to previous conclusions to a certain extent. Comorbidity of dyslipidemia and high VFA are independent risk factors for eGFR decline in males, but the regression analysis results on high SFA have not been found to be significant. We suggest that the two indicators of abdominal fat, SFA and VFA, may have different associations with glomerular filtration function. Given the present conclusions and previous studies, we recommend that VFA fits best the present results, which is also a key obesity indicator that may affect eGFR.
Regarding the impact of dyslipidemia on eGFR or CKD risk, the current evidence remains inconsistent as well. Naghibi et al investigated the prevalence and associated factors of CKD in 1285 Iranian individuals and found that neither overall dyslipidemia nor individual serum lipid levels was an independent risk factor.39 However, two-sample Mendelian randomization studies found that reduced serum HDL-c and elevated TGs lead to significant worsening of the eGFR or CKD risk.40,41 A meta-analysis covering 47 trials also found that a common lipid-lowering medication, statins, significantly delays the decline of eGFR in patients with renal disease.42 The present study also expanded the potential relationship between serum lipids and eGFR. Although some positive conclusions on the relationship between dyslipidemia and eGFR were reported, our study found no significant association between dyslipidemia per se and eGFR. The difference between the previous and present results may be due to sampling bias because we excluded subjects with an eGFR of less than 60 mL/min per 1.73 m2 at the beginning of the study. In the present study, only when dyslipidemia and several obesity indicators were superimposed did eGFR show a significant decrease or association with the comorbidity subgroup.
Overall, the combined effects of dyslipidemia and obesity indicators also show certain differences between different sexes. When we compare the trend of eGFR decline among subjects of different genders, there are certain differences. When we conducted multivariate regression analysis in different sexes, statistical significance was only found in men. More restudies are warranted to confirm whether the above conclusion is valid in women. Previous similar studies have also found that men who are obese or with other metabolic abnormalities may be more likely to have renal dysfunction. In a cross-sectional survey by Xiao et al, researchers found that another novel lipid accumulation index, visceral adiposity index (VAI), is more likely to be associated with CKD, especially in men.43 Another meta-analysis suggested that compared with women, hypertensive men are generally at higher risk of CKD or ESRD. This disparity is unlikely to be explained by biological differences alone.44 We speculate that male subjects have significantly worse lifestyles in the present study, and the prevalence of underlying diseases is also significantly higher, such as hypertension, dyslipidemia, and obesity. The above factors may be related to the significantly lower baseline eGFR in men, and the significant discrepancies in the abovementioned baseline indicators might also contribute to the sex difference of the present results.
This study has several limitations. First, this is a cross-sectional study, so the causal relationship between metabolic indicators and eGFR has not been confirmed. Second, eGFR is a variable determined by multiple factors, and its value is determined by the genetic background and environmental factors. It is somewhat one-sided to analyze the variation in eGFR only from the perspectives of dyslipidemia and obesity. Finally, the sampling scope of this study is relatively limited, only including the middle-aged urban population. Therefore, the present conclusions must be supported by more large-sample studies.
Conclusion
BMI is independently and negatively associated with eGFR in a middle-aged Chinese population. Most importantly, the combined effects of dyslipidemia and obesity indices such as BMI and VFA are synergistically associated with the risk of eGFR reduction in men, and the combination of dyslipidemia and WHR is also associated with eGFR reduction in the general population. Accordingly, a better understanding of the combined effects of these modifiable risk factors can help promote primary prevention in susceptible subgroups.
Data Sharing Statement
The datasets used and analyzed during the current study are available from the corresponding author on reasonable request (Yaxin Lai, Email: [email protected]).
Ethics Approval and Informed Consent
The study was approved by the Ethics Committee of the First Hospital of China Medical University. The study was performed in accordance with the principles of the Declaration of Helsinki. All the participants signed an informed consent form.
Acknowledgments
Our sincere thanks go to all the volunteers, healthcare workers and subjects who participated in the NOVEMBER survey.
Author Contributions
All authors made a significant contribution to the work reported, whether that is in the conception, study design, execution, acquisition of data, analysis and interpretation, or in all these areas; took part in drafting, revising or critically reviewing the article; gave final approval of the version to be published; have agreed on the journal to which the article has been submitted; and agree to be accountable for all aspects of the work.
Funding
This study was funded by the National Natural Science Foundation of China (81300645). The funders had no role in study design, data collection or analysis, or in the presentation or publication of the results.
Disclosure
The authors report no conflicts of interest in this work.
References
1. Drawz P, Rahman M. Chronic kidney disease. Ann Intern Med. 2015;162(11):ITC1–16. doi:10.7326/AITC201506020
2. Zhang L, Wang F, Wang L, et al. Prevalence of chronic kidney disease in China: a cross-sectional survey. Lancet. 2012;379(9818):815–822. doi:10.1016/S0140-6736(12)60033-6
3. Goolsby MJ. National Kidney Foundation Guidelines for chronic kidney disease: evaluation, classification, and stratification. J Am Acad Nurse Pract. 2002;14(6):238–242. doi:10.1111/j.1745-7599.2002.tb00119.x
4. Alberti KG, Eckel RH, Grundy SM, et al. Harmonizing the metabolic syndrome: a joint interim statement of the International Diabetes Federation Task Force on Epidemiology and Prevention; National Heart, Lung, and Blood Institute; American Heart Association; World Heart Federation; International Atherosclerosis Society; and International Association for the Study of Obesity. Circulation. 2009;120(16):1640–1645.
5. Mendy VL, Azevedo MJ, Sarpong DF, et al. The association between individual and combined components of metabolic syndrome and chronic kidney disease among African Americans: the Jackson Heart Study. PLoS One. 2014;9(7):e101610. doi:10.1371/journal.pone.0101610
6. Chen J, Gu D, Chen CS, et al. Association between the metabolic syndrome and chronic kidney disease in Chinese adults. Nephrol Dial Transplant. 2007;22(4):1100–1106. doi:10.1093/ndt/gfl759
7. Ryu S, Chang Y, Woo HY, et al. Time-dependent association between metabolic syndrome and risk of CKD in Korean men without hypertension or diabetes. Am J Kidney Dis. 2009;53(1):59–69. doi:10.1053/j.ajkd.2008.07.027
8. Lucove J, Vupputuri S, Heiss G, North K, Russell M. Metabolic syndrome and the development of CKD in American Indians: the Strong Heart Study. Am J Kidney Dis. 2008;51(1):21–28. doi:10.1053/j.ajkd.2007.09.014
9. Thomas G, Sehgal AR, Kashyap SR, Srinivas TR, Kirwan JP, Navaneethan SD. Metabolic syndrome and kidney disease: a systematic review and meta-analysis. Clin J Am Soc Nephrol. 2011;6(10):2364–2373. doi:10.2215/CJN.02180311
10. Qiu Y, Deng X, Sha Y, et al. Visceral fat area, not subcutaneous fat area, is associated with cardiac hemodynamics in type 2 diabetes. Diabetes Metab Syndr Obes. 2020;13:4413–4422. doi:10.2147/DMSO.S284420
11. Sato F, Maeda N, Yamada T, et al. Association of epicardial, visceral, and subcutaneous fat with cardiometabolic diseases. Circ J. 2018;82(2):502–508. doi:10.1253/circj.CJ-17-0820
12. Shil Hong E, Khang AR, Roh E, et al. Counterintuitive relationship between visceral fat and all-cause mortality in an elderly Asian population. Obesity (Silver Spring). 2015;23(1):220–227. doi:10.1002/oby.20914
13. Wang H, Liu A, Zhou Y, et al. The correlation between serum free thyroxine and regression of dyslipidemia in adult males: a 4.5-year prospective study. Medicine (Baltimore). 2017;96(39):e8163. doi:10.1097/MD.0000000000008163
14. Wang H, Lai Y, Han C, et al. The effects of serum ANGPTL8/betatrophin on the risk of developing the metabolic syndrome - a prospective Study. Sci Rep. 2016;6:28431. doi:10.1038/srep28431
15. Wang H, Yu F, Zhang Z, et al. Effects of circulating member B of the family with sequence similarity 3 on the risk of developing metabolic syndrome and its components: a 5-year prospective study. J Diabetes Investig. 2018;9(4):782–788. doi:10.1111/jdi.12780
16. Ma YC, Zuo L, Chen JH, et al. Modified glomerular filtration rate estimating equation for Chinese patients with chronic kidney disease. J Am Soc Nephrol. 2006;17(10):2937–2944. doi:10.1681/ASN.2006040368
17. American Diabetes Association. 2. Classification and diagnosis of diabetes: standards of medical care in diabetes-2018. Diabetes Care. 2018;41(Suppl 1):S13–S27. doi:10.2337/dc18-S002
18. National Cholesterol Education Program (NCEP). Expert Panel on Detection, Evaluation, and Treatment of High Blood Cholesterol in Adults (Adult Treatment Panel III). Third Report of the National Cholesterol Education Program (NCEP) Expert Panel on Detection, Evaluation, and Treatment of High Blood Cholesterol in Adults (Adult Treatment Panel III) final report. Circulation. 2002;106(25):3143–3421.
19. Zhou BF; Cooperative Meta-Analysis Group of the Working Group on Obesity in China. Predictive values of body mass index and waist circumference for risk factors of certain related diseases in Chinese adults–study on optimal cut-off points of body mass index and waist circumference in Chinese adults. Biomed Environ Sci. 2002;15(1):83–96.
20. Yu Q, Pang B, Liu R, Rao W, Zhang S, Yu Y. Appropriate body mass index and waist-hip ratio cutoff points for overweight and obesity in adults of Northeast China. Iran J Public Health. 2017;46(8):1038–1045.
21. Bao Y, Lu J, Wang C, et al. Optimal waist circumference cutoffs for abdominal obesity in Chinese. Atherosclerosis. 2008;201(2):378–384. doi:10.1016/j.atherosclerosis.2008.03.001
22. Luo Y, Ma X, Pan X, et al. Serum lipocalin-2 levels are positively associated with not only total body fat but also visceral fat area in Chinese men. Medicine (Baltimore). 2016;95(30):e4039. doi:10.1097/MD.0000000000004039
23. Li Y, Teng D, Shi X, et al. Prevalence of diabetes recorded in mainland China using 2018 diagnostic criteria from the American Diabetes Association: national cross sectional study. BMJ. 2020;369:m997. doi:10.1136/bmj.m997
24. Liu R, Han C, Wu D, et al. Prevalence of hyperuricemia and gout in mainland china from 2000 to 2014: a systematic review and meta-analysis. Biomed Res Int. 2015;2015:762820. doi:10.1155/2015/762820
25. Lu J, Lu Y, Wang X, et al. Prevalence, awareness, treatment, and control of hypertension in China: data from 1.7 million adults in a population-based screening study (China PEACE Million Persons Project). Lancet. 2017;390(10112):2549–2558. doi:10.1016/S0140-6736(17)32478-9
26. Pan L, Yang Z, Wu Y, et al. The prevalence, awareness, treatment and control of dyslipidemia among adults in China. Atherosclerosis. 2016;248:2–9. doi:10.1016/j.atherosclerosis.2016.02.006
27. Hyun YY, Lee KB, Rhee EJ, Park CY, Chang Y, Ryu S. Chronic kidney disease and high eGFR according to body composition phenotype in adults with normal BMI. Nutr Metab Cardiovasc Dis. 2016;26(12):1088–1095. doi:10.1016/j.numecd.2016.09.003
28. Kim YJ, Hwang SD, Oh TJ, et al. Association between obesity and chronic kidney disease, defined by both glomerular filtration rate and albuminuria, in Korean adults. Metab Syndr Relat Disord. 2017;15(8):416–422. doi:10.1089/met.2017.0053
29. La Scola C, Guarino S, Pasini A, et al. Effect of body mass index on estimated glomerular filtration rate levels in children with congenital solitary kidney: a cross-sectional multicenter study. J Ren Nutr. 2020;30(3):261–267. doi:10.1053/j.jrn.2019.07.003
30. Kaze FF, Meto DT, Halle MP, Ngogang J, Kengne AP. Prevalence and determinants of chronic kidney disease in rural and urban Cameroonians: a cross-sectional study. BMC Nephrol. 2015;16:117. doi:10.1186/s12882-015-0111-8
31. Seck SM, Doupa D, Gueye L, Dia CA. Epidemiology of chronic kidney disease in northern region of Senegal: a community-based study in 2012. Pan Afr Med J. 2014;18:307. doi:10.11604/pamj.2014.18.307.3636
32. Chen HY, Lu FH, Chang CJ, et al. Metabolic abnormalities, but not obesity per se, associated with chronic kidney disease in a Taiwanese population. Nutr Metab Cardiovasc Dis. 2020;30(3):418–425. doi:10.1016/j.numecd.2019.09.029
33. Lu JL, Kalantar-Zadeh K, Ma JZ, Quarles LD, Kovesdy CP. Association of body mass index with outcomes in patients with CKD. J Am Soc Nephrol. 2014;25(9):2088–2096. doi:10.1681/ASN.2013070754
34. Gruzdeva O, Borodkina D, Uchasova E, Dyleva Y, Barbarash O. Localization of fat depots and cardiovascular risk. Lipids Health Dis. 2018;17(1):218. doi:10.1186/s12944-018-0856-8
35. Lee KH, Kang BK, Ahn BK. Higher visceral fat area/subcutaneous fat area ratio measured by computed tomography is associated with recurrence and poor survival in patients with mid and low rectal cancers. Int J Colorectal Dis. 2018;33(9):1303–1307. doi:10.1007/s00384-018-3065-z
36. Jung CH, Rhee EJ, Kwon H, Chang Y, Ryu S, Lee WY. Visceral-to-subcutaneous abdominal fat ratio is associated with nonalcoholic fatty liver disease and liver fibrosis. Endocrinol Metab (Seoul). 2020;35(1):165–176. doi:10.3803/EnM.2020.35.1.165
37. Favre G, Legueult K, Pradier C, et al. Visceral fat is associated to the severity of COVID-19. Metabolism. 2021;115:154440. doi:10.1016/j.metabol.2020.154440
38. Kataoka H, Mochizuki T, Iwadoh K, et al. Visceral to subcutaneous fat ratio as an indicator of a ≥30% eGFR decline in chronic kidney disease. PLoS One. 2020;15(11):e0241626. doi:10.1371/journal.pone.0241626
39. Naghibi M, Mojahedi MJ, Jarrahi L, et al. Prevalence of chronic kidney disease and its risk factors in Gonabad, Iran. Iran J Kidney Dis. 2015;9(6):449–453.
40. Lanktree MB, Theriault S, Walsh M, Pare G. HDL cholesterol, LDL cholesterol, and triglycerides as risk factors for CKD: a Mendelian randomization study. Am J Kidney Dis. 2018;71(2):166–172. doi:10.1053/j.ajkd.2017.06.011
41. Zhang YB, Sheng LT, Wei W, et al. Association of blood lipid profile with incident chronic kidney disease: a Mendelian randomization study. Atherosclerosis. 2020;300:19–25. doi:10.1016/j.atherosclerosis.2020.03.020
42. Su X, Zhang L, Lv J, et al. Effect of statins on kidney disease outcomes: a systematic review and meta-analysis. Am J Kidney Dis. 2016;67(6):881–892. doi:10.1053/j.ajkd.2016.01.016
43. Xiao H, Xiong C, Shao X, et al. Visceral adiposity index and chronic kidney disease in a non-diabetic population: a cross-sectional study. Diabetes Metab Syndr Obes. 2020;13:257–265. doi:10.2147/DMSO.S231656
44. Weldegiorgis M, Woodward M. The impact of hypertension on chronic kidney disease and end-stage renal disease is greater in men than women: a systematic review and meta-analysis. BMC Nephrol. 2020;21(1):506. doi:10.1186/s12882-020-02151-7
 © 2021 The Author(s). This work is published and licensed by Dove Medical Press Limited. The full terms of this license are available at https://www.dovepress.com/terms.php and incorporate the Creative Commons Attribution - Non Commercial (unported, v3.0) License.
By accessing the work you hereby accept the Terms. Non-commercial uses of the work are permitted without any further permission from Dove Medical Press Limited, provided the work is properly attributed. For permission for commercial use of this work, please see paragraphs 4.2 and 5 of our Terms.
© 2021 The Author(s). This work is published and licensed by Dove Medical Press Limited. The full terms of this license are available at https://www.dovepress.com/terms.php and incorporate the Creative Commons Attribution - Non Commercial (unported, v3.0) License.
By accessing the work you hereby accept the Terms. Non-commercial uses of the work are permitted without any further permission from Dove Medical Press Limited, provided the work is properly attributed. For permission for commercial use of this work, please see paragraphs 4.2 and 5 of our Terms.