")
Back to Journals » International Journal of Nanomedicine » Volume 14
Combined administration of PTX and S-HM-3 in TPGS/Solutol micelle system for oncotarget therapy
Received 5 October 2018
Accepted for publication 7 January 2019
Published 7 February 2019 Volume 2019:14 Pages 1011—1026
DOI https://doi.org/10.2147/IJN.S189864
Checked for plagiarism Yes
Review by Single anonymous peer review
Peer reviewer comments 3
Editor who approved publication: Dr Linlin Sun
Weiguang Li, Jianpeng Xue, Hanmei Xu
State Key Laboratory of Natural Medicines, The Engineering Research Center of Synthetic Polypeptide Drug Discovery and Evaluation of Jiangsu Province, Department of Marine Pharmacy, China Pharmaceutical University, Nanjing 211198, PR China
Background: S-HM-3 is a tumor angiogenesis inhibitor with short half-life (25 min). In this present, TPGS/Solutol polymeric micelles was prepared to load together insoluble paclitaxel (PTX) and soluble S-HM-3, expecting to together deliver them to the tumor site with long-circulating, targeting function and combating multi-drug resistance (MDR).
Materials and methods: PTX and S-HM-3 loaded TPGS/Solutol micelles (PHTSm) were prepared by the method of thin-film evaporation, and characterized by dynamic light scattering, transmission electron microscope (TEM), atomic force microscopy (AFM) and releasing properties. The anticancer effect of the polymeric micelles system was evaluated and confirmed by experiments of in vitro cell uptake study, in vivo pharmacokinetics, and pharmacodynamics studies.
Results: Micelles exhibited smooth spherical morphology with 20~30 nm and low critical micelle concentration (CMC) value of 0.000124 mg/mL. Only about 30% of PTX were slowly released from micelles at 48h, which can beneficial to the long circulation in blood. The results of in vitro cell assay proved that S-HM-3 could be easier to get into MDA-MB-231 cell, and its angiogenesis inhibition ability was also enhanced after integrating into micelles. In particular, the results of in vivo studies showed that the half-life of S-HM-3 and PTX was significantly prolonged 25.27 and 5.54 folds, and their AUC0-∞ was enhanced 129.78 and 15.65 times, respectively. Meanwhile 83.05% tumor inhibition rate of PHTSm was achieved compared with 59.99% of PTX.
Conclusions: TPGS and Solutol micelles hold promising potential to resolve the conundrum of combined therapy of cytotoxic drug and angiogenesis inhibitor with different physicochemical property and anticancer mechanism in clinical use.
Keywords: paclitaxel, angiogenesis inhibitor, combination therapy, TPGS, Solutol, anti-multidrug resistance
Introduction
Paclitaxel (PTX), known as Taxol, is the first-line chemotherapy drug for the treatment of breast cancer, metastatic breast cancer, ovarian cancer, non-small-cell lung cancer (NSCLC), bladder cancer, prostate cancer, melanoma, esophageal cancer, and other types of solid tumors.1 As an antimicrotubule agent, PTX works through impairing the transition of G2-Phase to M-Phase during the cell cycle, resulting in inhibiting multiplication of malignant cells. Due to its poor solubility, PTX is commercially available as a nonaqueous concentrate of dehydrated ethanol and polyoxyethylenated castor oil administrated by intravenous infusion. The use of solubilizer and the toxicity of PTX itself have accounted for their side effects in clinical application, such as hypersensitivity reactions, peripheral sensory neuropathy, myelosuppression, and gastric digestive tract mucositis. In order to reduce solvent hypersensitivity risks, improve body distribution target, and enhance the human body’s tolerance to PTX, liposomal formulation (Lipusu® approved by state FDA of PR China) and the albumin-based formulation of PTX have been used in clinical application.2–4 The tumor cell killing efficiency of PTX and its drug resistance were not settled appropriately. Therefore, the challenge to improve the cancer cell sensitivity of PTX and simultaneously reduce its undesirable side effects still remains.5
Tumor-associated angiogenesis is one of the important marks of cancer development and metastasis. Antiangiogenesis therapy can restrain cancer progression by blocking formation of new blood vessels in tumors, which is expected to turn a tumor into a “dormant” disease. Benefits of using direct or indirect tumor angiogenesis inhibitors in clinical trials showed an improvement of response rate and a decline of disease progression in many tumor types, as well as modest survival.6,7 Because the combination therapy of antiangiogenic agents and chemotherapy drugs provides potential treatment effect to compensate for the limitations of each therapy type, their synergistic use of different anticancer drug has been progressive and attracted the attention of oncologists.8–12
Meanwhile, multidrug resistance (MDR) of tumor cells to anticancer drugs is a serious problem for cancer therapy. The expression of one or more proteins belonging to the ABC transporter gene family (ATP-binding cassette) in tumor cells is one of the mechanisms involved in the MDR.13,14 Among these ABC transporters, P-glycoprotein (P-gp) was the first protein transporter identified and the most extensively studied.15,16 Reportedly, a P-gp inhibitor combination could increase the intracellular bioavailability of antitumor drugs and improve the efficiency of cytotoxicity.17–20 Furthermore, not only the chemotherapy drug such as PTX but also the antiangiogenic agents faced the severe challenge of drug resistance. Series of preclinical and clinical studies have highlighted the enigma of drug resistance with functional bypass pathways and identified compensatory or alternative angiogenic mechanisms assuring tumor growth in the midst of an antiangiogenic stress environment.21,22
HM-3 is an antiangiogenic agent designed by our lab, and it consisted of 18 amino acids with an arginine–glycine–aspartic acid (RGD) in the terminal of the molecular structure. It is proved that HM-3 has an efficient binding motif to interact with αvβ3, which will block the binding of ligands to αvβ3 and destroy tumor vessels without the harmful effects. In in vitro and in vivo experiments, HM-3 showed significant antitumor angiogenesis and antitumor effects.23,24 However, its short half-life (25 minutes only) restricts the clinical application, which need to be solved urgently.25
Here, we designed a simple and novel polymeric micelles system to load PTX and HM-3 together based on tocopheryl polyethylene glycol succinate (TPGS) and Solutol copolymers. The PTX was solubilized and encapsulated into the hydrophobic core of the micelles, while HM-3 peptide was modified with stearic acid to form S-HM-3 and inserted on the surface of micelles (Figure 1). By virtue of inhibitor function of P-gp by the TPGS to overcoming multidrug resistance, which was able to bypass the efflux pumps, the therapeutic efficacy of PTX and HM-3 could be further enhanced and the side effects of PTX could be reduced. Meanwhile, the half-life of HM-3 peptide could also be extended to resolve the compliance problem of clinical application owing to the nano effect of polymeric micelles.26–30 The polymeric micelles system of anticancer effect was evaluated and confirmed by a series of experiments such as in vitro cell uptake study, in vivo pharmacokinetics, and pharmacodynamics studies.
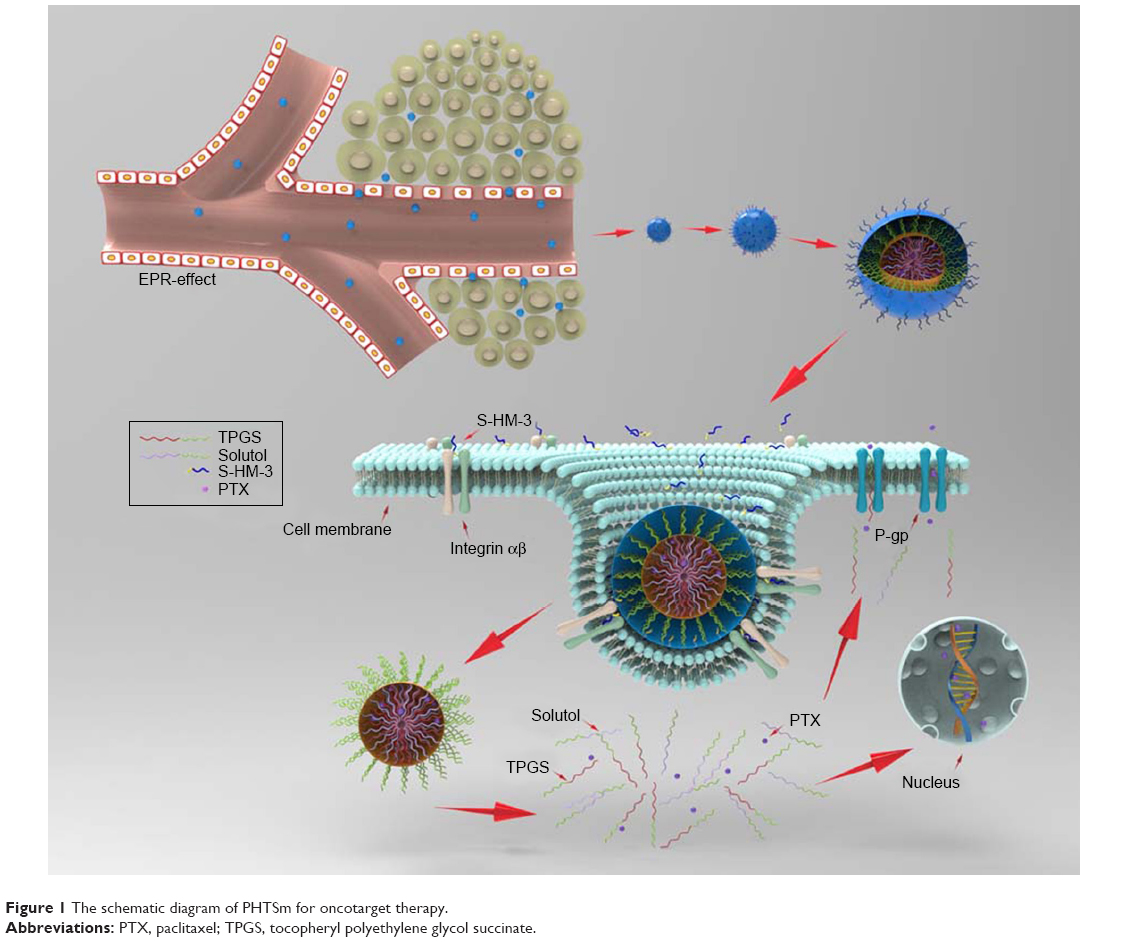 | Figure 1 The schematic diagram of PHTSm for oncotarget therapy. |
Materials and methods
Materials
PTX was purchased from the Chengdu Biopurify Phytochemicals Ltd. (Sichuan, PR China). TPGS (1000) were obtained from Aladdin Biotechnology Co., Ltd. (Shanghai, PR China). Solutol HS 15 was kindly gifted by Basf China (Shanghai, PR China). S-HM-3 was designed by us and synthesized by GL Biochem Co., Ltd. (Shanghai, PR China). Cell culture medium, trypsine, EDTA, penicillin, streptomycin, and fetal bovine serum (FBS) were provided from Thermo Fisher Scientific (Waltham, MA, USA). Extracellular matrix (ECM) cell culture medium and endothelial cell growth supplement (ECGS) were provided from ScienCell Research Laboratories (Carlsbad, CA, USA). PAGE and ECL Kit were purchased from Lianke Biotechnology (Nanjing, PR China). Other reagents were all of analytical grade.
A549 and MDA-MB-231 cell lines were kindly provided by Professor Zhangjuan in China Pharmaceutical University. Human umbilical vein endothelial cells (HUVECs) were purchased from ScienCell Research Laboratories. All cell experiments were permitted by the Ethical Committee of China Pharmaceutical University.
Methods
Micelles preparation
In brief, PTX, Solutol, and TPGS (1:6:34) were dissolved in chloroform and evaporated at 60°C. The organic solvent was evaporated until 1/4 at the speed of 40 rpm, and then evaporated to form a thin lipid film under vacuum at 5 rpm. Then, the lipid film was hydrated in 10 mL of deionized water without or with S-HM-3 solution (0.35 mg/mL) for 30 minutes to obtain the micelles of PTX-TPGS Solutol (PTSm) and PTX-S-HM-3-TPGS Solutol (PHTSm). Finally, the solution was filtered through a 0.22 μm filter and added 5% glucose as lyoprotectant to lyophilize, resulting in the powder of micelles.
Characterization
The critical micelle concentration (CMC) of TPGS-Solutol was determined by a pyrene fluorescence method.31 The characterization of the PHTSm including particle size distribution, polydispersity index (PDI), and zeta potential were measured by a Zetasizer (Nano ZS90; Malvern Panalytical, Malvern, UK). Its morphology was observed through a transmission electron microscope (TEM) and atomic force microscopy (AFM).
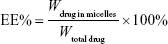
The encapsulation efficiency and drug loading percentage of PTSm and PHTSm were determined as below.22,25 The EE% and DL% were calculated using the following formula:
|
|
|
|
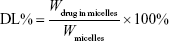
where Wdrug in micelles is defined as the PTX or S-HM-3 amount in the polymeric micelles, Wtotal drug and Wmicelles represent the whole PTX or S-HM-3 amount added into the micelles and the PHTSm weights, respectively.
In vitro release of PTSm and PHTSm
The release of PTX from micelles was investigated by dialysis method. A measured quantity of 1.0 mL PTX solution, PTSm and PHTSm solutions (equivalently containing 1 mg PTX) was placed in a dialysis tubing (MWCO =5 kDa) and immersed into 500 mL PBS (1% Tween 80, pH 7.4) with a speed of 50 rpm at 37°C. A volume of 1.0 mL release medium was sampled at predetermined time intervals (0.5, 1, 2, 4, 8, 12, 24, and 48 hours) followed by immediate replacement with an equal volume of fresh PBS. The collected medium was filtered through 0.22 μm millipore filter before HPLC analysis.
Cytotoxicity test by MTT assay
To evaluate the cytotoxicity of micelles, the inhibition of A549 and MDA-MB-231 cells’ growth was determined by the MTT assay. A549 (MDA-MB-231) cells were seeded into 96-well plates at 6,000 cells/well and incubated at 37°C, 5% CO2 in a humidified atmosphere for 24 hours. Then, the medium was replaced by fresh DMEM (L15) medium containing a series of samples. Then, the cells were incubated for 48 hours. After that, 20 μL of MTT solution (5 mg/mL in PBS) was added to each well and incubated for additional 4 hours. Subsequently, the medium was replaced with 10 μL DMSO per well. The absorbance was measured at 570 nm using a microplate reader with the reference wavelength 630 nm. Cell viability was calculated using the following formula:
|
|
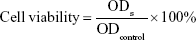
where ODs and ODcontrol are the absorbance of experimental samples and blank controls, respectively.
Cellular uptake
In order to evaluate the uptake ability of PTSm and PHTSm in cells, the coumarin-6 (C6) was chosen as fluorescence probe. C6 with or without S-HM-3-loaded TPGS–Solutol micelles was prepared using the same method as PHTSm. MDA-MB-231 cells were seeded in glass-base dishes at a density of 1×10⁵ per dish and incubated for 12 hours at 37°C. The cells were washed twice with PBS, then C6-TSm and C6-HTSm were added, which had an equivalent concentration of C6 (0.5 μg/mL). The cells were incubated for 0, 0.5, 1, and 3 hours at 37°C and washed thrice with ice-cold PBS and added with 0.5 mL Hoechst33342 for 30 minutes. The cells were washed thrice with ice-cold PBS and fixed with 4% (w/w) formaldehyde solution for 30 minutes. The formaldehyde solution was removed, and the cells were washed thrice with ice-cold PBS. Finally, the cells were observed using a confocal laser scanning microscopy (CLSM).
Cell migration
Matrigel, 10 mg/mL, was diluted with serum-free ECM Cell culture medium (v/v, 1:3) and coated onto the membrane of transwell. HUVECs were seeded in the transwell chambers at a density of 1×10⁵ cells/well in 100 μL of serum-free medium. Cells were incubated for 24 hours with blank medium (as control). Avstin at a concentration of 10 μg/mL, S-HM-3, blank micelles (THm), and HTSm at a concentration of 9 μg/mL were used and added into the well of a 24-well plate. Six hundred microliters of medium supplemented with 5% FBS and 1% ECGS was used as a chemoattractant of cell migration. The cells were incubated in a 5% CO2 incubator at 37°C. After 24 hours, the cells on the bottom side of the chamber (invasive cells) were fixed by ethanol and stained with 0.1% crystal violet for 10 minutes. Finally, the migrating cells were photographed and counted microscopically. The migration inhibition (MI) was calculated with the following formula:
|
|
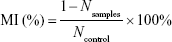
where Nsamples and Ncontrol are defined as the count of migrating cells of the experiment groups and control group, respectively.
In vivo studies
In vivo pharmacokinetic studies of S-HM-3
The experiments of Sprague Dawley rats and female Balb/c nude mice were carried out in compliance with the guidelines of the Institutional Animal Care and Use Committee of China and were permitted by the Ethical Committee of China Pharmaceutical University.
Six male Sprague Dawley rats (180–200 g) were divided into two groups randomly and then intravenous injected with different formulation. Rats in S-HM-3 group and PHTSm were given a 2.415 mg/kg dose (S-HM-3 equivalent) of S-HM-3, respectively. S-HM-3 group’s blood samples were collected at predetermined time points (1, 3, 5, 7, 10, 15, 20, 30, 40, 60, and 90 minutes) and PHTSm group’s blood samples were collected at predetermined time points (0, 0.25, 0.5, 0.75, 1, 2, 4, 8, 12, 24, and 48 hours). All samples were centrifuged at 12,000 rpm for 3 minutes. The supernatant was collected, mixed with deionized water (1:2), and then put into water bath for 40 minutes at 80°C. The solution was centrifuged at 12,000 rpm for 3 minutes. The supernatant was stored in −20°C. The amount of S-HM-3 was tested by ELISA.
In vivo distribution studies of S-HM-3
Nude mice were inoculated via injection with MDA-MB-231 cells. Until their tumor grows up to 300–400 mm3, six tumor-bearing mice were randomly assigned to two groups and administrated with 0.2 mL S-HM-3 solution (containing 0.35 mg/kg S-HM-3) and PHSTm solution (equivalent 0.35 mg/kg S-HM-3) by vein injection. The mice of S-HM-3 group were euthanized at 2 minutes, 24 minutes, and 1 hour, and those of PHSTm group were euthanized at 2 minutes, 12 hours, and 24 hours. The organs, such as heart, liver, spleen, lung, and kidney, and tumor were eviscerated and washed by normal saline. The organs were added 5–10 times (W:V) solution normal saline and then grinded by tissue homogenizer. After centrifugation at 12,000 rpm speed for 2 minutes, the supernatant was put into 80°C water bath for 20 minutes. Again, it was centrifuged at 12,000 rpm speed for 2 minutes, and the supernatant was tested by ELISA.
In vivo pharmacokinetic studies of PTX
Six male Sprague Dawley rats (180–200 g) were divided into two groups at random and then intravenous injected with different formulations. PTX and PHTSm were injected i.v. as a single dose (7 mg/kg PTX). Blood samples were collected at predetermined time points (PTX group at 0, 5, 10, 15, 30, 45 minutes, and 1, 2, 4, 6, and 8 hours, while PHTSm group at 0, 0.25, 0.5, 0.75, 1, 2, 4, 8, 12, 24, and 48 hours). All samples were centrifuged at 12,000 rpm for 3 minutes. The supernatant was stored in −20°C.
Withdraw above 300 μL supernatant sample and 50 μL diazepam methanol solution and add them into 5 mL diethyl ether solution. Vortex this mixed solution for 5 minutes at 3,000 rpm speed. The supernatant of diethyl ether was transferred into an eggplant-shaped bottle and vacuum-rotary evaporated. The residuum was dissolved with 300 μL methanol, and then filtered through 0.22 μm millipore filter before HPLC analysis.
In vivo tumor targeting assays
Micelles of Dir-HTSm and Dir-TSm were prepared using the same method as PHTSm. Eight nude mice were inoculated via injection with MDA-MB-231 cells and were randomly assigned to two groups, Dir-HTSm and Dir-TSm. All mice were administered with the formulation (0.1 mL/10 g) via tail vein injections, then anesthetized with diethyl ether. In vivo fluorescence imaging was taken with in vivo imaging system at predetermined time points (0, 1, 2, 4, 8, 12, 24, and 48 hours), and then imaged using Carestream Molecular Imaging Standard Edition.
In vivo antitumor efficacy
Nude mice were inoculated via injection on the right side of axilla with 2×10⁶ MDA-MB-231 cells. When the volume of tumors reached to 30–40 mm3, mice were administrated via injections (tail vein) as shown in Table 1. Tumors were measured every 2 days. Fourteen days after treatment, the mice were sacrificed, and excised tumors were weighted.
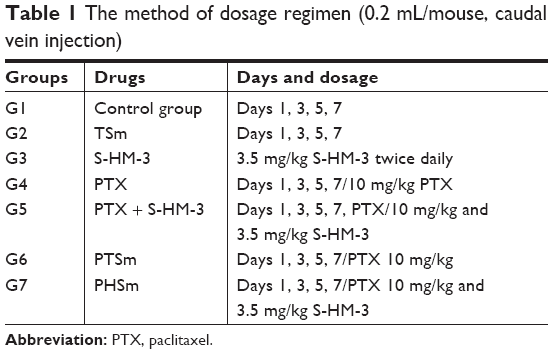 | Table 1 The method of dosage regimen (0.2 mL/mouse, caudal vein injection) |
Tumor volume (TV) was calculated with the following formula:
|
|

Relative tumor volume (RTV) was calculated with the following formula:
|
|

where V0 is volume of tumors in the beginning and Vt is the volume of tumors every 2 days.
Relative tumor proliferation rate (T/C) was calculated with the following formula:
|
|
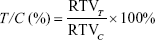
where RTVT and RTVC are defined as the RTV of the experiment groups and control group, respectively.
After 14 days of treatment, the mice were sacrificed, and excised tumors were weighted. The tumor inhibitory rate was calculated as shown in Equation 8.
|
|
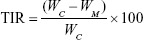
where WC and WM are defined as the tumor mean weight of the control group and that of micelles treated group, respectively.
H&E staining and immunohistochemical analysis (CD31 and p53)
Solid tumors were fixed with 10% phosphate buffered formalin, processed, and embedded in paraffin.
The sections were dewaxed and stained with H&E under a light microscope at 10× magnification. Immunohistochemistry (IHC) was performed according to the manufacturer’s instructions (LSAB kit; Dako, Carpinteria, CA, USA). Images were taken using a microscope. Cryosections of tumors were stained with anti-CD31 (eBioscience) and anti-phospho-Stat 3 (Santa Cruz) antibodies, respectively, followed by a biotinylated secondary antibody and streptavidin-FITC with DAPI counterstaining to detect tumor vasculature. The fluorescence images were taken by a microscope (Nikon Eclipse ci, Tokyo, Japan), and processed by using Image pro-plus 6.0 software.
Statistical analysis
All the data in this study were analyzed by the statistic package SPSS 12.0. Direct comparison between two groups was conducted by independent sample’s t-test. Data are expressed as mean ± SD. P-value of <0.05 was considered statistically significant. P-value of <0.01 was considered highly statistically significant.
Results and discussion
Preparation and characterization of micelles
Optimal PHTSm’s formulation was obtained after orthogonal experiment design. The ratio of Solutol/TPGS and the feeding amount of PTX were the leading factors affecting the drug loading and encapsulation efficiency, but barely influence on particle sizes of the micelles (as shown in Table 2). According to the PDI, the drug loading and encapsulation efficiency, the ratio of 17:3 of Solutol/TPGS was chosen as the best formulation. The encapsulation efficiency of S-HM-3 was always >97% regardless of its concentration ranging from 0.1 to 0.7 mg/mL (data not shown).
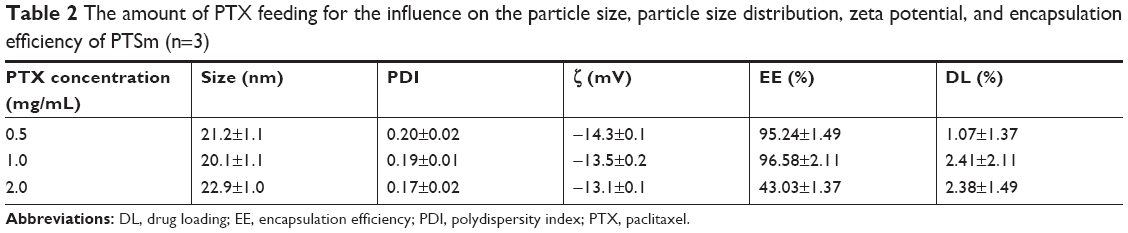 | Table 2 The amount of PTX feeding for the influence on the particle size, particle size distribution, zeta potential, and encapsulation efficiency of PTSm (n=3) |
As shown in Tables 2 and 3, the particle size of PTSm and PHTSm was between 20 and 30 nm, which was further proved by results of TEM and AFM images. As shown in Figure 2A–C, PTSm and PHTSm exhibited smooth spherical morphology and showed very good distribution of particle size from 20 to 30 nm. The CMC value of TPGS/Solutol is 0.000124 mg/mL in Figure 2D. This low CMC value could make TPGS and Solutol be easily self-assemble into polymeric micelle system, and also protect this system from diluting and destroy of blood.
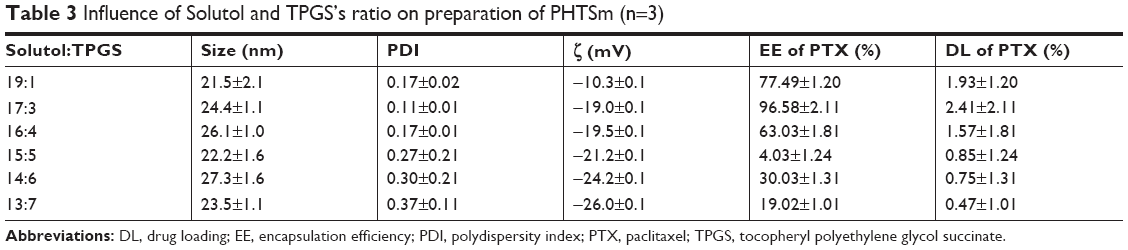 | Table 3 Influence of Solutol and TPGS’s ratio on preparation of PHTSm (n=3) |
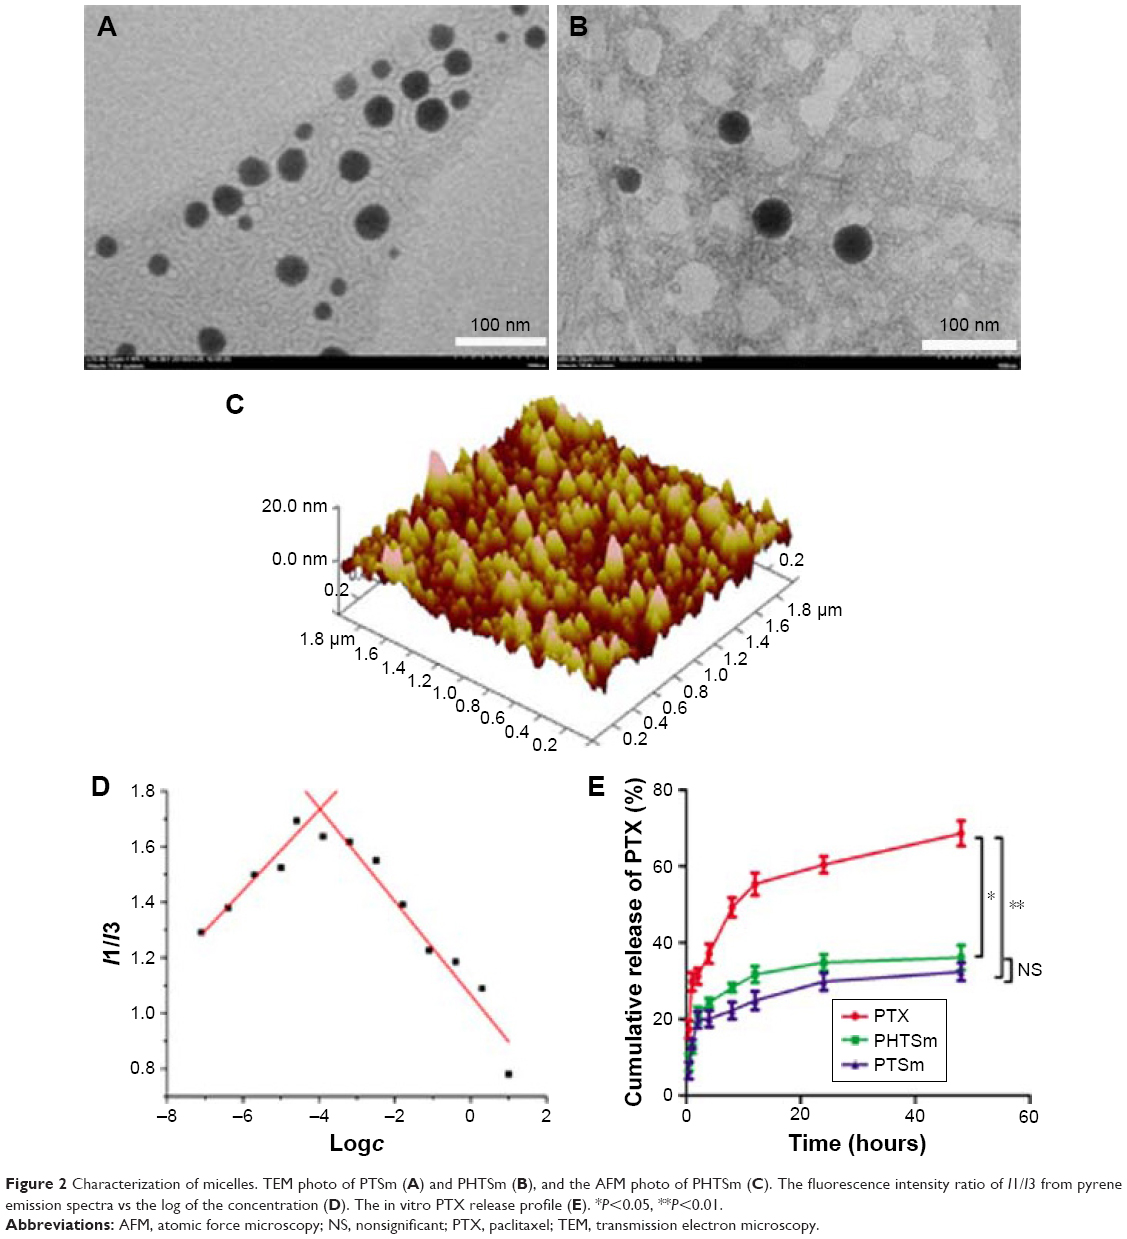 | Figure 2 Characterization of micelles. TEM photo of PTSm (A) and PHTSm (B), and the AFM photo of PHTSm (C). The fluorescence intensity ratio of I1/I3 from pyrene emission spectra vs the log of the concentration (D). The in vitro PTX release profile (E). *P<0.05, **P<0.01. |
Although the particle size of micelles was small, the release of PTX from PTSm and PHTSm was slow and has obviously sustained effect. As shown in Figure 2E, 68.55% of PTX was rapidly released from the solution of Cremophor EL and Ethanol (commercial preparation) at 48 hours, while 36.06% and 32.33% of PTX were slowly released from micelles of PTSm and PHTSm. Statistical analysis showed that the difference between commercial preparation and PTSm was very significant (P<0.01), and that of commercial preparation and PHTSm was significant (P<0.05). However, there was no significant difference between PTSm and PHTSm groups, which suggests that the release of PTX keeps constant with or without modifying S-HM-3. Meanwhile, the sustained release of PTX from micelles could be beneficial to their long circulation in blood.
In vitro cytotoxicity assay
As shown in Table 4 and Figure 3A and B, the IC50 of S-HM-3 and TSm (blank micelles) groups was >100 μg/mL, indicating it was safe in the range of 0.125–100 μg/mL, whereas the cytotoxicity of PTX, PTX/S-HM-3, PTSm, and PHTSm groups on A549 and MDA-MB-231 cells ranged from 0.125 to 100 μg/mL in a dose-dependent manner. There was no difference of IC50 between PTX group and PTX/S-HM-3 group (P>0.05), suggesting that the S-HM-3 has no cytotoxicity on both A549 and MDA-MB-231 cells. Similarly, there was no difference between PTX, PTSm, and PHTSm (P>0.05), indicating that the cytotoxic effect of PTX did not change after being coated into micelles of PTSm and PHTSm.
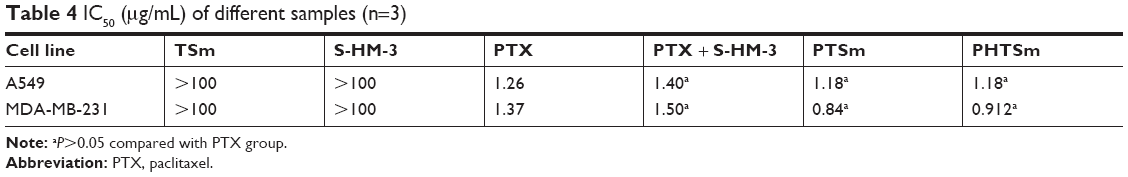 | Table 4 IC50 (μg/mL) of different samples (n=3) |
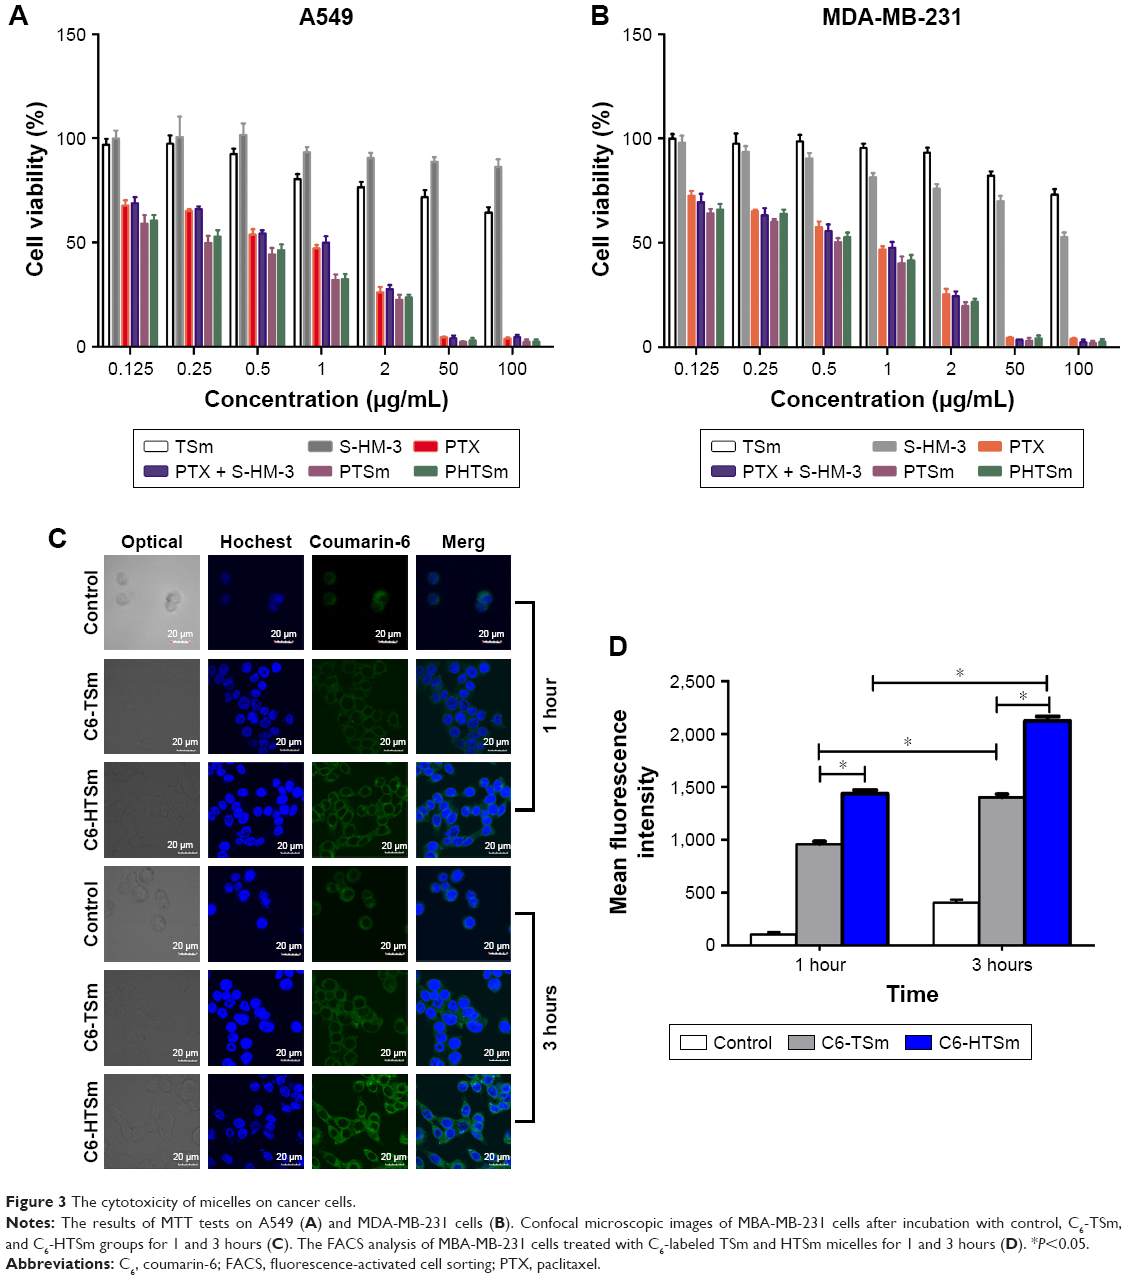 | Figure 3 The cytotoxicity of micelles on cancer cells. |
Intracellular uptake of micelles
To evaluate the intracellular uptake of micelles, MDA-MB-231 cells treated with C6-labeled TSm and HTSm micelles for 1 and 3 hours were observed by CLSM (Leica, TCS SP5) and quantitatively analyzed by flow cytometry analysis (Becton Dickinson, FACS Calibur). As shown in Figure 3C, compared with control group of free C6, intracellular fluorescent intensity was observed significantly at 1 hour and increased at 3 hours for both TSm and HTSm groups. Based on this, it is indicated that the TPPGS/Solutol micelles could enhance the intracellular uptake.
As shown in Figure 3D, the fluorescence intensity of C6-HTSm group was higher than that of C6-TSm group both at 1 and 3 hours, while the fluorescence intensity of control is lowest. This result was well in consistent with flow cytometry result. It might attribute to the RGD sequence of HM-3 peptide, which could bind competitively with the receptors of αvβ3 and α5β1 in the membrane of tumor cell, hence increase the uptake ability of HTSm micelles in MDA-MB-231 cell.
Cell migration assay
Vascular endothelial is an important part of angiogenesis. Cell migration assay was used to evaluate the effect of the S-HM-3 after forming micelles on cell migration. Avstin (10 μg/mL) and free S-HM-3 (9 μg/mL) were the positive control group; meanwhile, the cell incubation medium and the blank micelles of TSm were the negative control group.22 The results showed that the sequence of endothelial cell MI rate was HTSm (76.26%)>Avstin (69.89%)>S-HM-3 (60.55%)>TSm (20.96%)>Control (Figure 4). Interestingly, the difference of MI rate between TSm (20.96%) and control groups was very significant (P<0.001), which might be attributable to inhibition of TPGS.26 However, there is also noticeable difference in TSm with Avstin, S-HM-3, and HTSm groups (P<0.001), indicating S-HM-3 played the leading role of cell MI for HTSm group even TSm showed 20.96% cell MI rate. Notably, Avstin with HTSm and S-HM-3 groups exerted equivalent effect on cell migration (P>0.05). There was an obvious difference showed by HTSm and S-HM-3 groups (P<0.01). These results indicated that the enhancement of cell migration inhibition of S-HM-3 when it was modified on the surface of TSm, which will further validated by the latter of in vivo assay.
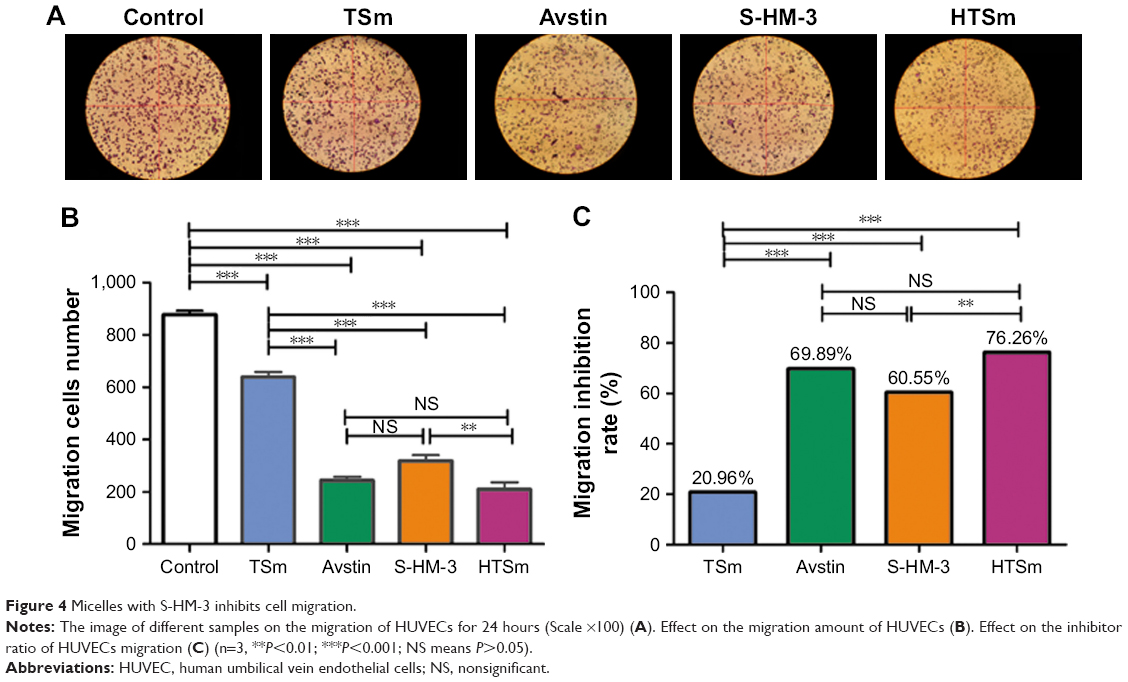 | Figure 4 Micelles with S-HM-3 inhibits cell migration. |
In vivo tumor targeting assays of whole-body fluorescence imaging
The real-time, whole-body fluorescence images of MDA-MB-231 tumor-bearing mice after i.v. injection of free DiR and DiR micelles were used to investigate the optimized ratio of Solutol and TPGS. As Figure 5A shows, three groups of micelles made of Solutol and TPGS with different ratios (19:1, 17:3, and 16:4) mostly accumulated in the liver. It highlighted the strongest signal at 2 and 4 hours, then the signal intensity gradually reduced as time passed by. The fluorescence signal started to distribute to tumor site in the group with the ratio of 17:3 at 1 hour, and reached to the peak at 4 and 8 hours, and even exhibited at 48 hours, which proved that the ratio of 17:3 was the best one with best targeting. Based on the result of micelles preparation shown in Table 3, the micelles with 17:3 Solutol and TPGS were chosen to do the following experiment.
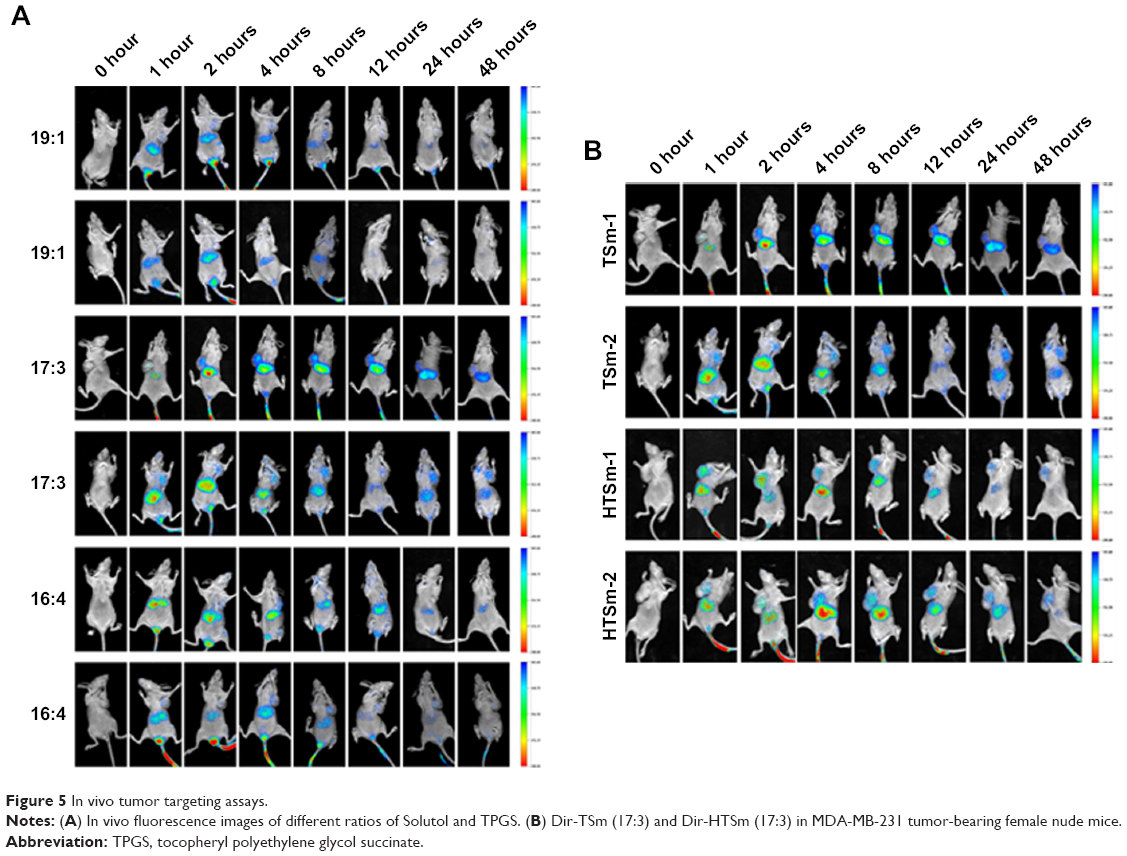 | Figure 5 In vivo tumor targeting assays. |
Obvious DiR signals were observed in the liver during 1–48 hours for Dir-TSm group, while Dir-HTSm exhibited weak signals (Figure 5B). By contrast, strong DiR signals were observed in the tumor site during 1–48 hours for Dir-HTSm group. Although there was a similar trend in Dir-TSm group, the signal intensity was significantly weaker than that in Dir-HTSm group, indicating that TSm modified with S-HM-3 partly enhanced the targeting ability of micelles.
In vivo distribution and pharmacokinetic studies of S-HM-3
The indirect competitive ELISA method was carried out to investigate the distribution of S-HM-3 in different organ and tumor site. The concentration of S-HM-3 in different organs at different time points is listed in Figure 6A and B. As shown in Figure 6A, S-HM-3 had already distributed into different organs at 2 minutes and reached the peak at 24 minutes (which was consist with the half-time of HM-3), and then been nearly cleared at 60 minutes. Meanwhile, a few S-HM-3 was distributed to the tumor site. As time went on, the S-HM-3 concentration at tumor site was increasing, which indicates that S-HM-3 was accumulated in the tumor tissue.22 This might be beneficial from specific binding function of terminal RGD sequence of S-HM-3 with receptor of integrin in the tumor cell membrane. As shown in Figure 6B, S-HM-3 in the PHTS micelles distributed to the lung and kidney, specifically to the tumor site at 2 minutes, reached to the peak at 12 hours, and almost be cleared at 24 hours in different organs except tumor. The change of pharmacokinetics behavior of S-HM-3 further confirmed that the PHTSm possessed the targeting ability and sustained release function after forming micelles. These results were consistent with that of tumor targeting assays of in vivo fluorescence images.
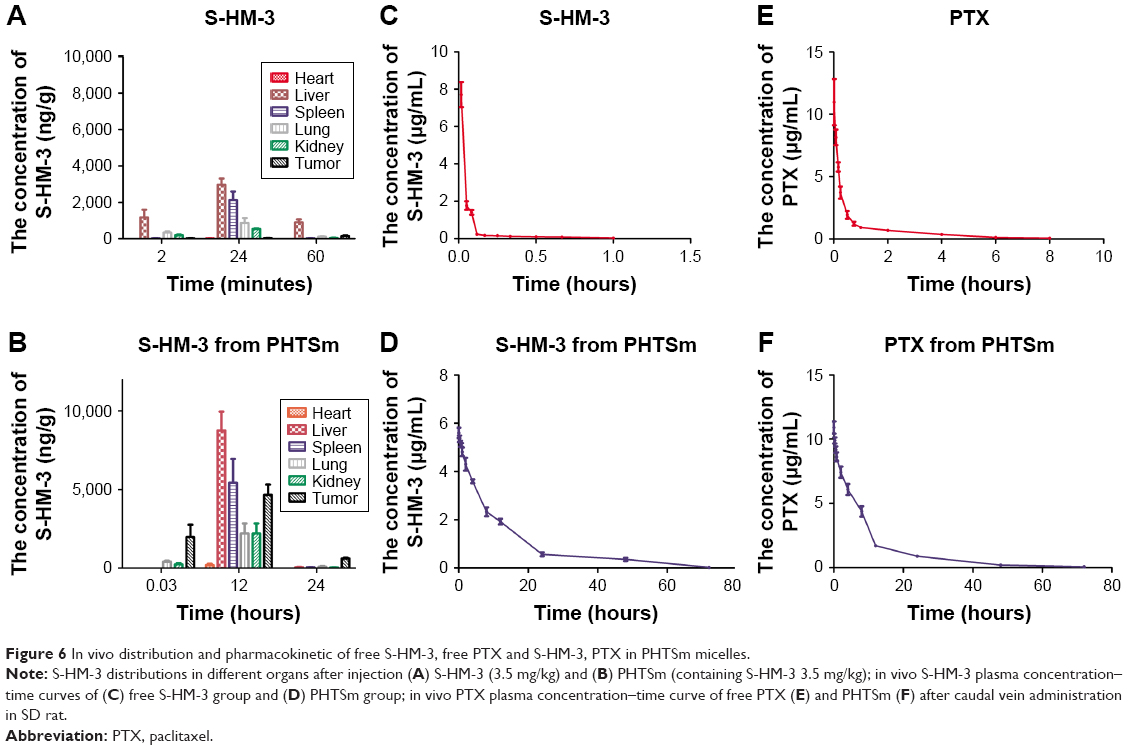 | Figure 6 In vivo distribution and pharmacokinetic of free S-HM-3, free PTX and S-HM-3, PTX in PHTSm micelles. |
The data of pharmacokinetic studies of S-HM-3 are listed in Table 5 and shown in Figure 6C and D based on the analytical result of DAS version 1.0. The half-life of S-HM-3 was about 0.43 hours (25.80 minutes), consistent with the result previously reported, which indicated that modification by stearic acid did not improve its half-life.22 The half-life of S-HM-3 from PHTSm increased remarkably to 10.87 hours, which is 25.27 times longer than that of free S-HM-3. In the meanwhile, the area under the curve (AUC0–∞) of PHTSm increased 129.78 folds, confirming the remarkable enhancement of S-HM-3 peptide’s bioavailability and in vivo half-life resulting from encapsulation into the TPGS/Solutol polymer micelles.
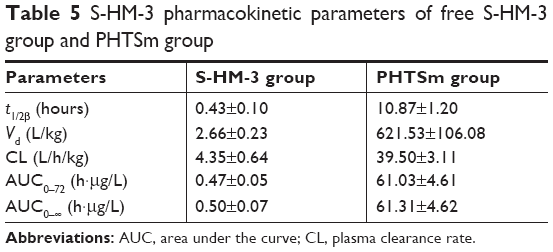 | Table 5 S-HM-3 pharmacokinetic parameters of free S-HM-3 group and PHTSm group |
In vivo pharmacokinetic studies of PTX
The data of PTX pharmacokinetic studies are also listed in Table 6. Figure 6E and F shows the PTX blood concentration–time curve. From these results, it was observed that the t1/2 of PTX was also increased from 1.79 to 9.93 hours (5.54 times) after encapsulating into micelles, and the CL of PHTSm group was increased 63.46 times from 1.2 to 81.87 L/h/kg. AUC0–∞ of PHTSm group robustly increased 15.65 times from 5.47 to 85.61 h·μg/L.
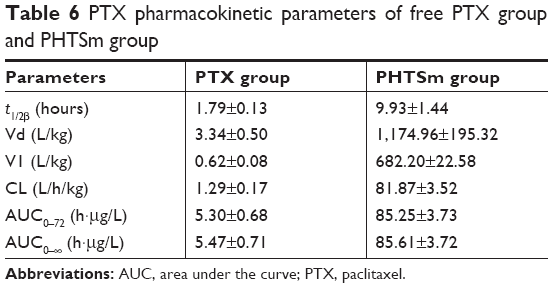 | Table 6 PTX pharmacokinetic parameters of free PTX group and PHTSm group |
Considering changes of S-HM-3 and PTX from PHTSm group, the t1/2 of S-HM-3 was extended from 0.43 to 10.87 hours, while that of PTX from 1.79 to 9.93 hours. Although their increased fold was different (25.28 times of S-HM-3 and 5.54 times of PTX, respectively), both of t1/2 were about 10 hours, indicating that S-HM-3 and PTX were loaded into one micelle on another side. It also suggested that dose intervals of S-HM-3 and PTX were lengthened after forming nanopreparation, which could solve the short half-life problem of proteins and peptides in clinical application.
In vivo antitumor assay
According to the data in Table 7 and Figure 7A and B, the order of tumor inhibition rate (IR) was PHTSm>PTSm>PTX + S-HM-3>PTX>S-HM-3>TSm. Interestingly, free micelles (TSm) showed 22.92% tumor IR, which might attribute to the anticancer function of TPGS polymer as Hou et al reported.32 The IR percentage of S-HM-3 was 51.29%, similar to 56.11%±12.23% of PTX and 65.29%±6.09% of PTX + S-HM-3 group (P>0.05). We inferred that dosage changed in different groups could affect their antitumor efficacy. The reduced dosage of PTX + S-HM-3 group was injected from twice per day to once every 2 days, while the S-HM-3 dosage of combining group was only 1/4 of S-HM-3 group. The synergetic effect of PTX and S-HM-3 was not significant because of the short half-life of S-HM-3. However, statistical analysis showed the differences between PTSm and PTX, PTX + S-HM-3 and PHTSm were significant (P<0.05), while that of PTX and PHTSm was extremely significant (P<0.001). It indicated that the synergetic effect of PTX and S-HM-3 performed through TPGS and Solutol micelles. Furthermore, the results of TV changed in different groups confirmed the improved antitumor effect of PHTSm as shown in Figure 7C. The tumor growth speed of PHTSm was the slowest compared with the other groups. The xenograft tumors of different groups harvested at 14 days are shown in Figure S1, which also validated this result.
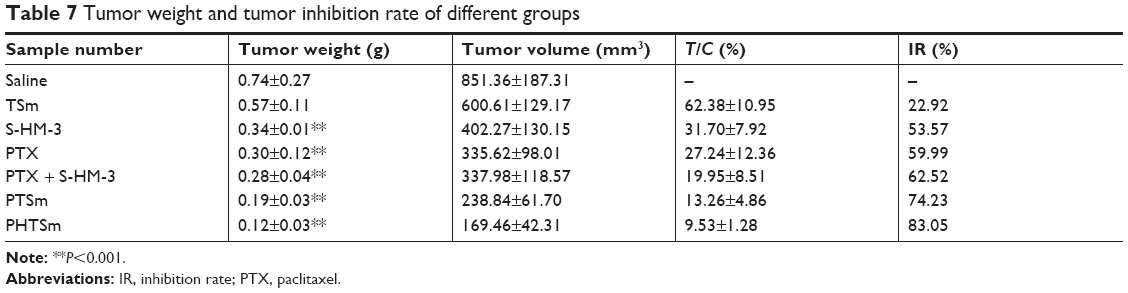 | Table 7 Tumor weight and tumor inhibition rate of different groups |
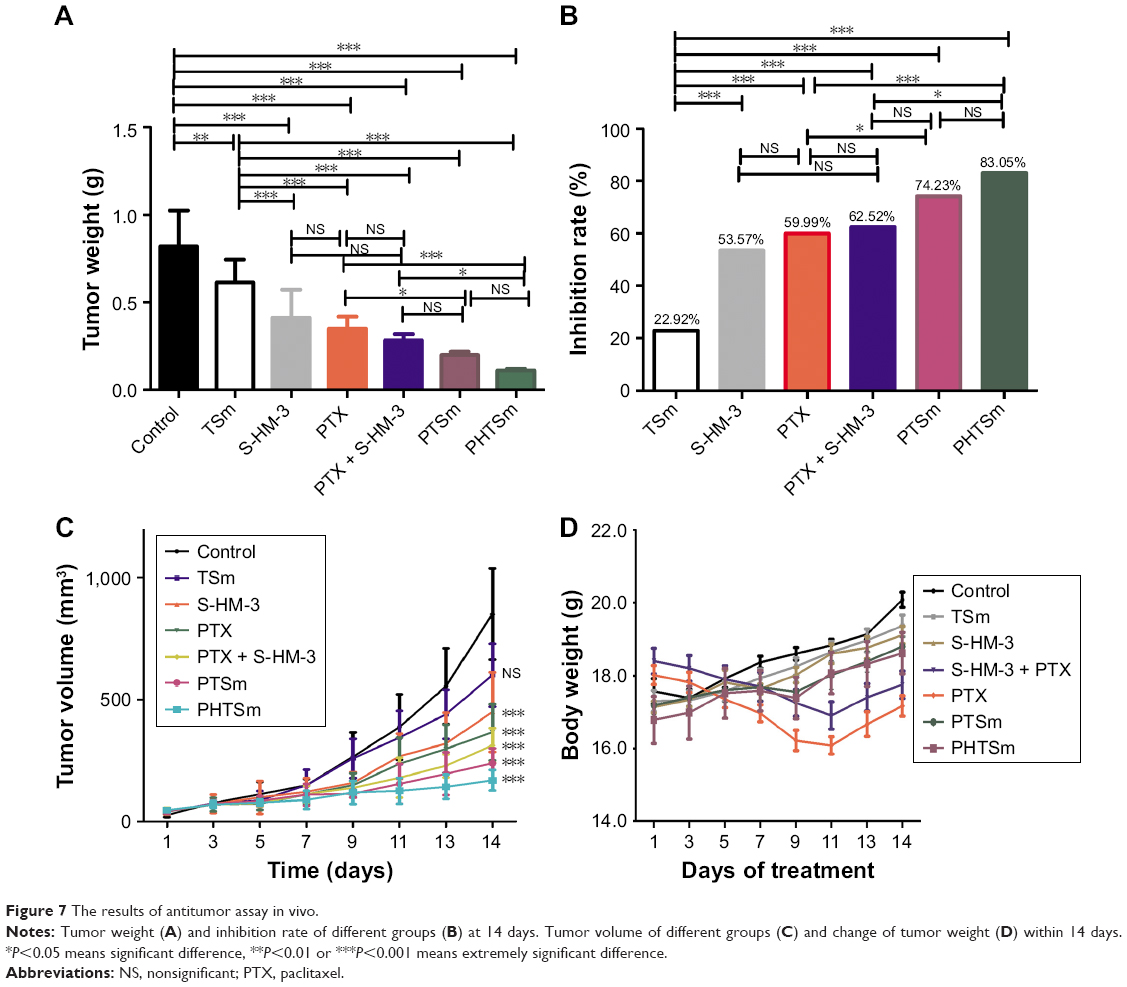 | Figure 7 The results of antitumor assay in vivo. |
None of the mice died throughout in vivo experiment. As seen in Figure 7D, the weight loss of PTX and PTX + S-HM-3 groups was obvious during the 0–10 days, indicating high toxicity of PTX. After stopping the administration at 7 days, the weight regained in 10–14 days. The control group, S-HM-3 and TSm groups were significantly increased during the test period, proved that S-HM-3 and TSm were of very low toxicity or nontoxic. Although there is a relatively small weight change in PTSm and PHTSm groups, considering the above improved antitumor effect of PHTSm group, the synergy and attenuation actions were achieved by the micelles system of PHTSm.
H&E and IHC analyses
To illuminate the antitumor effect on the tumor cell, H&E and IHC analyses were performed, and the result is shown in Figure 8. From the analysis of H&E (Figure 8A), the tumor cells, except control and TSm groups histological regression, were observed in the rest of groups. PTSm and PHTSm groups showed a better therapeutic effect, particularly decreased tumor cell density.
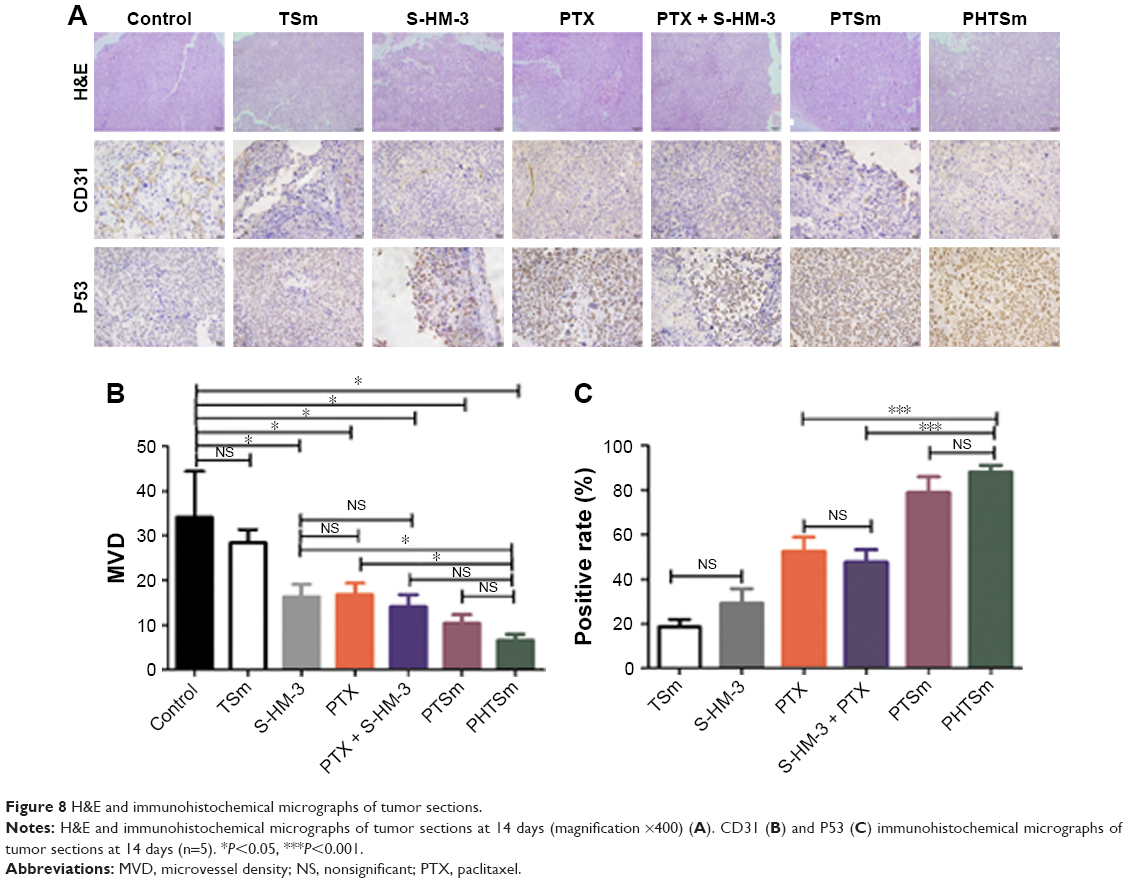 | Figure 8 H&E and immunohistochemical micrographs of tumor sections. |
Figure 8B shows the microvessel density in each group. CD31 was used to evaluate the tumor angiogenesis. S-HM-3, PTX, and PTX + S-HM-3 groups had almost the same antiangiogenesis effect (P>0.05), indicating that PTX could inhibit its angiogenesis of tumor through killing tumor cells. The inhibiting ability of tumor angiogenesis was PTX + S-HM-3>S-HM-3>PTX, indicating the function of S-HM-3 as an inhibitor of tumor angiogenesis. There is a significant difference between PHSTm with S-HM-3 and PTX (P<0.05), suggesting the enhancement of antiangiogenesis ability of PHSTm after encapsulating S-HM-3.
The p53 protein is a transcription factor responding to a wide variety of stress signals (DNA damage, hypoxia, etc.) that decrease the fidelity of the cellular replication processes. The duplication of damaged DNA results in a high mutation rate and activates the p53 protein, and induces cell-cycle arrest, senescence, or cell death. The higher positive p53 rate means the more obvious apoptotic tumor cell. There was no difference between S-HM-3 and TSm, indicating that S-HM-3 did not induce significant apoptosis in tumor cells in Figure 8C. But extremely significant difference was shown between PHSTm with PTX and PTX + S-HM-3 (P<0.001), which proved the remarkable apoptosis accelerated by PHSTm (Figure 8C).
Conclusion
In the present work, novel multitargeting loaded micelles based on TPGS and Solutol copolymers were constructed, which was loaded with PTX and S-HM-3. PTX was encapsulated into the hydrophobic core of the polymer micelles to enhance its solubility and reduce the side effects. As the inhibitor of P-gp, TPGS was able to inhibit the efflux pumps which can overcome the MDR for PTX and HM-3, therefore enhance therapeutic efficacy of PTX/HM-3 and reduce side effects. Moreover, the stearic acid group of S-HM-3 was inserted into the lipid core of the micelle easily and HM-3, on the surface of the micelles, can interact with αvβ3 and be released immediately when reached the tumor site. Meanwhile, the half-life of HM-3 and PTX can also be extended using micelle system. This design purpose has been confirmed by the detailed in vitro and in vivo studies. Collectively, our study concludes that TSm holds a promising potential for combined therapy of cytotoxic drug and angiogenesis inhibitor.
Acknowledgments
This work was supported by the National Natural Science Foundation of China (81403346 and 81673830), Double First-class University project (CPU2018GY28), and the Six Talent Peaks Project of Jiangsu Province (2016/YY-053). The present study was also supported by the Natural Science Foundation of Jiangsu Province (BK20160757).
Disclosure
The authors report no conflicts of interest in this work.
References
Chemocare. Paclitaxel. Available from: http://www.chemocare.com/chemotherapy/drug-info/Paclitaxel.aspx. Accessed January 1, 2018. | ||
Ye L, He J, Hu Z, et al. Antitumor effect and toxicity of Lipusu in rat ovarian cancer xenografts. Food Chem Toxicol. 2013;52:200–206. | ||
Sofias AM, Dunne M, Storm G, Allen C. The battle of “nano” paclitaxel. Adv Drug Deliv Rev. 2017;122:20–30. | ||
Wang X, Liu X, Li Y, et al. Sensitivity to antitubulin chemotherapeutics is potentiated by a photoactivable nanoliposome. Biomaterials. 2017;141:50–62. | ||
Bernabeu E, Cagel M, Lagomarsino E, Moretton M, Chiappetta DA. Paclitaxel: what has been done and the challenges remain ahead. Int J Pharm. 2017;526(1–2):474–495. | ||
Adrian LH, Daniele G. Inhibitors of tumor angiogenesis. In: Neidle S, editor. Cancer Drug Design and Discovery. 2nd ed. New York: Academic Press; 2014:275–317. | ||
Yang WH, Xu J, Mu JB, Xie J. Revision of the concept of anti-angiogenesis and its applications in tumor treatment. Chronic Dis Transl Med. 2017;3(1):33–40. | ||
Siim BG, Lee AE, Shalal-Zwain S, Pruijn FB, Mckeage MJ, Wilson WR. Marked potentiation of the antitumour activity of chemotherapeutic drugs by the antivascular agent 5,6-dimethylxanthenone-4-acetic acid (DMXAA). Cancer Chemother Pharmacol. 2003;51(1):43–52. | ||
Sandler A, Gray R, Perry MC, et al. Paclitaxel-carboplatin alone or with bevacizumab for non-small-cell lung cancer. N Engl J Med. 2006;355(24):2542–2550. | ||
Reck M, von Pawel J, Zatloukal P, et al. Overall survival with cisplatin-gemcitabine and bevacizumab or placebo as first-line therapy for nonsquamous non-small-cell lung cancer: results from a randomised phase III trial (AVAiL). Ann Oncol. 2010;21(9):1804–1809. | ||
Garon EB, Ciuleanu TE, Arrieta O, et al. Ramucirumab plus docetaxel versus placebo plus docetaxel for second-line treatment of stage IV non-small-cell lung cancer after disease progression on platinum-based therapy (REVEL): a multicentre, double-blind, randomised phase 3 trial. Lancet. 2014;384(9944):665–673. | ||
Manegold C, Dingemans AC, Gray JE, et al. The potential of combined immunotherapy and antiangiogenesis for the synergistic treatment of advanced NSCLC. J Thorac Oncol. 2017;12(2):194–207. | ||
Trédan O, Galmarini CM, Patel K, Tannock IF. Drug resistance and the solid tumor microenvironment. J Natl Cancer Inst. 2007;99(19):1441–1454. | ||
Sharom FJ. ABC multidrug transporters: structure, function and role in chemoresistance. Pharmacogenomics. 2008;9(1):105–127. | ||
Yuan H, Li X, Wu J, et al. Strategies to overcome or circumvent P-glycoprotein mediated multidrug resistance. Curr Med Chem. 2008;15(5):470–476. | ||
Aller SG, Yu J, Ward A, et al. Structure of P-glycoprotein reveals a molecular basis for poly-specific drug binding. Science. 2009;323(5922):1718–1722. | ||
Wolking S, Schaeffeler E, Lerche H, Schwab M, Nies AT. Impact of genetic polymorphisms of ABCB1 (MDR1, P-glycoprotein) on drug disposition and potential clinical implications: update of the literature. Clin Pharmacokinet. 2015;54(7):709–735. | ||
Muthu MS, Kulkarni SA, Xiong J, Feng SS. Vitamin E TPGS coated liposomes enhanced cellular uptake and cytotoxicity of docetaxel in brain cancer cells. Int J Pharm. 2011;421(2):332–340. | ||
Jin X, Li M, Yin L, Zhou J, Zhang Z, Lv H. Tyroservatide-TPGS-paclitaxel liposomes: Tyroservatide as a targeting ligand for improving breast cancer treatment. Nanomedicine. 2017;13(3):1105–1115. | ||
Vardhan H, Mittal P, Adena SKR, Upadhyay M, Yadav SK, Mishra B. Process optimization and in vivo performance of docetaxel loaded PHBV-TPGS therapeutic vesicles: a synergistic approach. Int J Biol Macromol. 2018;108:729–743. | ||
Liu H, Tu L, Zhou Y, et al. Improved bioavailability and antitumor effect of docetaxel by TPGS modified Proniosomes: in vitro and in vivo evaluations. Sci Rep. 2017;7(1):43372. | ||
Al-Abd AM, Alamoudi AJ, Abdel-Naim AB, Neamatallah TA, Ashour OM. Anti-angiogenic agents for the treatment of solid tumors: potential pathways, therapy and current strategies – a review. J Adv Res. 2017;8(6):591–605. | ||
Gacche RN, Assaraf YG. Redundant angiogenic signaling and tumor drug resistance drug resistance updates. Drug Resist Updat. 2018;36:47–76. | ||
Xu HM. HM-3, angiogenesis inhibitor preparative method and application. China Patent. 2006;1830487:13. Available from: https://worldwide.espacenet.com/publicationDetails/biblio?DB=EPODOC&II=0&ND=3&adjacent=true&locale=en_EP&FT=D&date=20060913&CC=CN&NR=1830487A&KC=A. Accessed January 30, 2019. | ||
Xu HM, Yin R, Chen L, et al. An RGD-modified endostatin-derived synthetic peptide shows antitumor activity in vivo. Bioconjug Chem. 2008;19(10):1980–1986. | ||
Zhu B, Xu HM, Zhao L, Huang X, Zhang F. Site-specific modification of anti-angiogenesis peptide HM-3 by polyethylene glycol molecular weight of 20 kDa. J Biochem. 2010;148(3):341–347. | ||
Chandrasekharan P, Maity D, Yong CX, Chuang KH, Ding J, Feng SS. Vitamin E (d-alpha-tocopheryl-co-poly(ethylene glycol) 1000 succinate) micelles-superparamagnetic iron oxide nanoparticles for enhanced thermotherapy and MRI. Biomaterials. 2011;32(24):5663–5672. | ||
Muthu MS, Kulkarni SA, Liu Y, Feng SS. Development of docetaxel-loaded vitamin E TPGS micelles: formulation optimization, effects on brain cancer cells and biodistribution in rats. Nanomedicine. 2012;7(3):353–364. | ||
Jin X, Li M, Yin L, Zhou J, Zhang Z, Lv H. Tyroservatide-TPGS-paclitaxel liposomes: Tyroservatide as a targeting ligand for improving breast cancer treatment. Nanomedicine. 2017;13(3):1105–1115. | ||
Xu HL, Fan ZL, Zhuge DL, et al. Therapeutic supermolecular micelles of vitamin E succinate-grafted ε-polylysine as potential carriers for curcumin: enhancing tumour penetration and improving therapeutic effect on glioma. Colloids Surf B Biointerfaces. 2017;158:295–307. | ||
Yang L, Zhang Z, Hou J, et al. Targeted delivery of ginsenoside compound K using TPGS/PEG-PCL mixed micelles for effective treatment of lung cancer. Int J Nanomedicine. 2017;12:7653–7667. | ||
Hou J, Sun E, Zhang ZH, et al. Improved oral absorption and anti-lung cancer activity of paclitaxel-loaded mixed micelles. Drug Deliv. 2017;24(1):261–269. |
Supplementary material
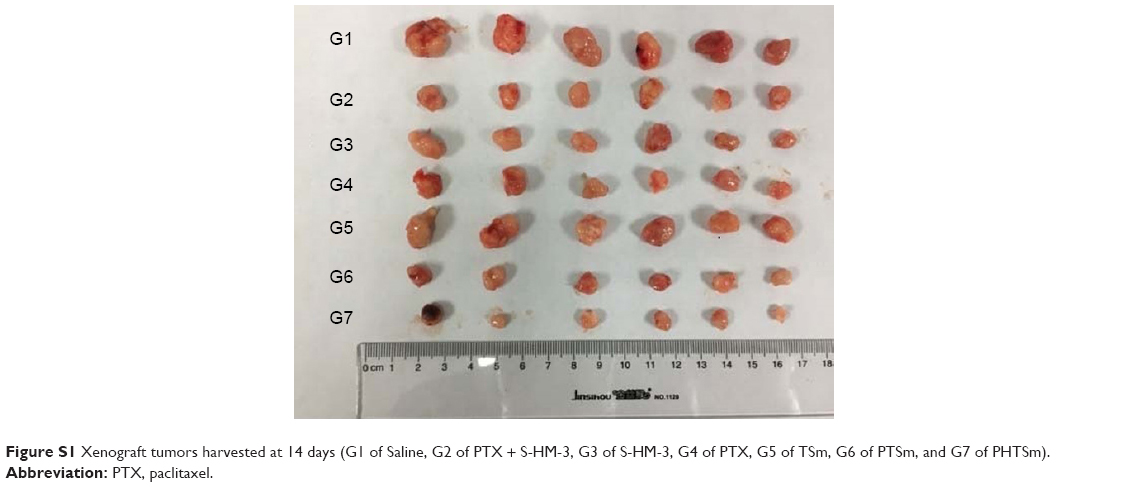 | Figure S1 Xenograft tumors harvested at 14 days (G1 of Saline, G2 of PTX + S-HM-3, G3 of S-HM-3, G4 of PTX, G5 of TSm, G6 of PTSm, and G7 of PHTSm). |
 © 2019 The Author(s). This work is published and licensed by Dove Medical Press Limited. The full terms of this license are available at https://www.dovepress.com/terms.php and incorporate the Creative Commons Attribution - Non Commercial (unported, v3.0) License.
By accessing the work you hereby accept the Terms. Non-commercial uses of the work are permitted without any further permission from Dove Medical Press Limited, provided the work is properly attributed. For permission for commercial use of this work, please see paragraphs 4.2 and 5 of our Terms.
© 2019 The Author(s). This work is published and licensed by Dove Medical Press Limited. The full terms of this license are available at https://www.dovepress.com/terms.php and incorporate the Creative Commons Attribution - Non Commercial (unported, v3.0) License.
By accessing the work you hereby accept the Terms. Non-commercial uses of the work are permitted without any further permission from Dove Medical Press Limited, provided the work is properly attributed. For permission for commercial use of this work, please see paragraphs 4.2 and 5 of our Terms.