")
Back to Journals » OncoTargets and Therapy » Volume 9
Combination of vatalanib and a 20-HETE synthesis inhibitor results in decreased tumor growth in an animal model of human glioma
Authors Shankar A, Borin T, Iskander A, Varma N, Achyut B, Jain M, Mikkelsen T, Guo A, Chwang W, Ewing J, Bagher-Ebadian H, Arbab AS
Received 5 August 2015
Accepted for publication 31 December 2015
Published 9 March 2016 Volume 2016:9 Pages 1205—1219
DOI https://doi.org/10.2147/OTT.S93790
Checked for plagiarism Yes
Review by Single anonymous peer review
Peer reviewer comments 5
Editor who approved publication: Dr Faris Farassati
Adarsh Shankar,1 Thaiz F Borin,2 Asm Iskander,1 Nadimpalli RS Varma,3 Bhagelu R Achyut,1 Meenu Jain,1 Tom Mikkelsen,4 Austin M Guo,5 Wilson B Chwang,3 James R Ewing,6 Hassan Bagher-Ebadian,6 Ali S Arbab1
1Tumor Angiogenesis Laboratory, Cancer Center, Georgia Regents University, Augusta, GA, USA; 2Laboratory of Molecular Investigation of Cancer (LIMC), Faculty of Medicine of Sao Jose do Rio Preto, Sao Jose do Rio Preto, Brazil; 3Department of Radiology, Cellular and Molecular Imaging Laboratory, 4Department of Neurosurgery, Henry Ford Health System, Detroit, MI, 5Department of Pharmacology, New York Medical College, Valhalla, NY, 6Department of Neurology and Radiology, Henry Ford Health System, Detroit, MI, USA
Background: Due to the hypervascular nature of glioblastoma (GBM), antiangiogenic treatments, such as vatalanib, have been added as an adjuvant to control angiogenesis and tumor growth. However, evidence of progressive tumor growth and resistance to antiangiogenic treatment has been observed. To counter the unwanted effect of vatalanib on GBM growth, we have added a new agent known as N-hydroxy-N'-(4-butyl-2 methylphenyl)formamidine (HET0016), which is a selective inhibitor of 20-hydroxyeicosatetraenoic acid (20-HETE) synthesis. The aims of the studies were to determine 1) whether the addition of HET0016 can attenuate the unwanted effect of vatalanib on tumor growth and 2) whether the treatment schedule would have a crucial impact on controlling GBM.
Methods: U251 human glioma cells (4×10⁵) were implanted orthotopically. Two different treatment schedules were investigated. Treatment starting on day 8 (8–21 days treatment) of the tumor implantation was to mimic treatment following detection of tumor, where tumor would have hypoxic microenvironment and well-developed neovascularization. Drug treatment starting on the same day of tumor implantation (0–21 days treatment) was to mimic cases following radiation therapy or surgery. There were four different treatment groups: vehicle, vatalanib (oral treatment 50 mg/kg/d), HET0016 (intraperitoneal treatment 10 mg/kg/d), and combined (vatalanib and HET0016). Following scheduled treatments, all animals underwent magnetic resonance imaging on day 22, followed by euthanasia. Brain specimens were equally divided for immunohistochemistry and protein array analysis.
Results: Our results demonstrated a trend that HET0016, alone or in combination with vatalanib, is capable of controlling the tumor growth compared with that of vatalanib alone, indicating attenuation of the unwanted effect of vatalanib. When both vatalanib and HET0016 were administered together on the day of the tumor implantation (0–21 days treatment), tumor volume, tumor blood volume, permeability, extravascular and extracellular space volume, tumor cell proliferation, and cell migration were decreased compared with that of the vehicle-treated group.
Conclusion: HET0016 is capable of controlling tumor growth and migration, but these effects are dependent on the timing of drug administration. The addition of HET0016 to vatalanib may attenuate the unwanted effect of vatalanib.
Keywords: magnetic resonance imaging, glioblastoma, antiangiogenic treatments, HET0016, vascular parameters, protein array
Introduction
Glioblastoma (GBM) is a hypervascular malignant brain tumor with poor prognosis, even with the best combination of treatments.1 The hypervascular nature of GBM has made antiangiogenic treatment (AAT) a popular adjuvant to inhibit angiogenesis and tumor growth.2–5 However, clinical results indicate transient beneficial effects of AAT (measured in weeks or months), followed by tumor restoration and progression.6 Presently, a number of compounds that are intended to control the abnormal angiogenesis are being studied.7,8 Agents, such as vatalanib (PTK787, a vascular endothelial growth factor receptor 2 [VEGFR2] tyrosine kinase inhibitor), cediranib, sunitinib, and so forth, which play a role in interfering with the VEGFR signaling transduction pathways have shown varying degrees of clinical success with relapse or recurrence of tumors,4,9 thus demonstrating the development of tumor resistance to AAT.10 In some cases, inhibiting angiogenesis has also shown an increase in lymphatic and metastatic activities.11 Bevacizumab is a ligand-based monoclonal antibody against VEGF, unlike all of the other receptor-based therapies. According to the recently published studies, bevacizumab in clinical settings showed adverse effect and did not improve the patient’s survival.12,13 In GBMs, AAT actually induced a phenotypic change from a single-cell infiltration to a cluster of cells migrating along normal blood vessels.8,14–16 The invasive growth pattern may imply a qualitative change in tumor response after AAT. To avoid further potential therapeutic failures, these mechanisms of resistance to antiangiogenic therapy in clinical settings need to be better understood.
An important feature of AAT is the disrupted tumor vasculature and associated marked hypoxia, which may be one of the important reasons for AAT resistance. Following marked hypoxia, a chain of mechanisms are triggered which, we believe, establish some alternative pathways for angiogenesis via various tumor secreted factors, such as basic fibroblast growth factor (bFGF), stromal cell-derived factor-1 alpha (SDF-1α), protein–regulated upon activation, normal T-cell expressed and secreted (RANTES) or CCL5, VEGF, and many other proangiogenic factors.4,16–19 Another potentially distinct resistant mechanism may also be the recruitment of endothelial progenitor cells (EPCs), as well as proangiogenic monocytes from bone marrow to the tumor site.20 Hypoxia creates a permissive condition for the recruitment of a heterogeneous population of monocytic bone marrow-derived cells, which promotes angiogenesis and tumor growth.21,22
To create a clinically relevant treatment, it is important to control both tumor cell proliferation and neovascularization. N-Hydroxy-N′-(4-butyl-2-methylphenyl) formamidine (HET0016), a highly selective inhibitor of 20-hydroxyeicosatetraenoic acid (20-HETE) synthesis, has been reported to inhibit the enzymatic activity of the CYP4A and CYP4F families.23 The significant findings of treatment with HET0016 are the ability to inhibit several growth factors, as well as angiogenesis in an U251-induced cornea angiogenesis model.24 Further studies with HET0016 identified some of the agent’s hallmarks in controlling tumorigenesis via multiple pathways. The agent controlled the growth of tumor cells, inhibited the effect of growth factors on tumor angiogenesis and vasculogenesis, and inhibited the angiogenic effects of EPCs.25,26 A possible mechanism of action of HET0016 in relation to growth factor pathways is shown in Figure 1. There has not been any report showing the effectiveness of HET0016 in controlling GBM resistance to AAT, especially vatalanib. Therefore, we hypothesize that HET0016 has the potential to control alternative angiogenic pathways induced by vatalanib in GBM and control the resistant of GBM to vatalanib treatment.
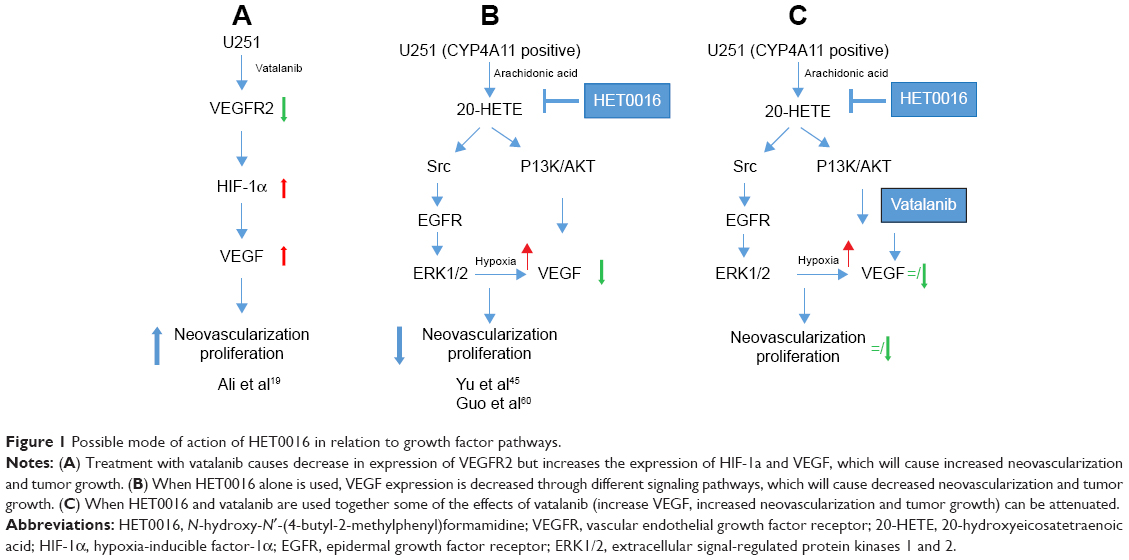 | Figure 1 Possible mode of action of HET0016 in relation to growth factor pathways. |
Unlike normal cerebral vasculature, hypervascular regions of the tumor are typically permeable to contrast agents (CAs) and thus can be detected by magnetic resonance imaging (MRI) or computed tomography modalities. These studies allow for the analysis of tumor size, perfusion, tumor blood volume, permeability, and extravascular and extracellular space volume fraction. The parameters provided by MRI help identify changes in tumor vascular physiology after AAT. In particular, investigators have utilized dynamic contrast-enhanced (DCE)-MRI to generate maps of vascular permeability (forward volumetric transfer constant, Ktrans), tumor plasma volume (vp), backward transfer constant (Kep), and interstitial space volume fraction (ve) in GBM patients.27 These parameters may allow for a better understanding of the physiological characteristics of the regional tumor environment and vascularity.
The purposes of the study were to determine whether the timing of treatment using either HET0016 and vatalanib alone or in combination would have a crucial impact on controlling the growth of GBM, whether addition of HET0016 would prevent the drug resistance of GBM to vatalanib, and whether the parametric analysis of MRI could detect significant changes in the tumors following different treatments.
Materials and methods
Ethical statement
All animal experiments were approved and performed based on the National Institutes of Health guidelines and by the Institutional Animal Care and User Committee of Henry Ford Health Systems and Georgia Regents University. The study protocols was approved by the Ethics Committees of Henry Ford Health Systems and Georgia Regents University.
Animal model
Nude rats (RNU nu/nu) (Charles River Laboratories, Inc., Frederick, MD, USA), ~150–170 g in weight, were included in this study. An orthotopic glioma model was established by injecting human glioma U251 cells (4×10⁵), suspended in 5 μL of serum-free Roswell Park Memorial Institute (RPMI) 1640, into the right hemisphere of the brain. The suspended cells were injected at 3 mm to the right and 1 mm anterior to bregma according to the previously published methods.16,19,28,29
Drug treatments and schedule
Establishing a tumor model that mimics clinical scenarios has become a very important aspect in preclinical research. Animals were randomly assigned to two treatment schedules. The first sets of animals were designated to mimic a clinical scenario, in which treatment was started after diagnosing an established tumor in a hypoxic microenvironment and prominent neovascularization. We waited for 7 days after implantation, allowing the tumor to grow ~3 mm in size, and started the treatment on day 8, 5 days/wk until day 21. The second sets of animals were designated to mimic clinical postsurgical cases, in which a small number of cells may remain outside of the surgical field, resulting in a recurrent tumor. Animals in this group were treated from day 0, along with tumor implantation, 5 days/wk until day 21. In both treatment schedules, the animals were further divided into the following four treatment groups: vehicle, vatalanib alone (50 mg/kg/d orally), HET0016 alone (10 mg/kg/d, intraperitoneally), and vatalanib plus HET0016. The doses of the drugs were selected according to our own publications, as well as other reports.30,31 All the animals underwent MRI on day 22, followed by euthanasia.
Each of the postmortem subgroups were divided for either protein array or immunohistochemistry (IHC). There were a total of 75 animals. Out of 75, five animals were excluded due to failure of MRI acquisition or early death of the animals. MRI vascular parametric analysis was not possible in seven animals due to faulty intravascular injection; however, these animals were used for analysis of either IHC or protein array. There were 14 animals in the vehicle (control) group (nine animals for 8–21 days and five animals for 0–21 days), 19 animals for vatalanib treatments (eleven animals for 8–21 days and eight animals for 0–21 days), 19 animals for HET0016 treatments (eleven animals for 8–21 days and eight animals for 0–21 days), and 18 animals for combined vatalanib and HET0016 treatments (ten animals for 8–21 days and eight animals for 0–21 days).
In vivo MRI
As noted earlier, all animals underwent MRI on day 22, according to their treatment schedules. Animals were anesthetized with 2% isoflurane and steadily supplied with oxygen while secured to a customized cradle. All studies were performed in a Varian (now Agilent Technologies, Santa Clara, CA, USA), 7 T, 20 cm bore system with a DirectDrive spectrometer and console. The maximum strength and rise time of gradient were 250 mT/m and 120 μs, respectively. All MRI image sets were acquired with a 32×32 mm2 field of view. Animals were first located with the tumor center corresponding to the magnet center by a triplanar fast low angle shot sequence. Subsequent scans were acquired using T1-weighted (pre- and postcontrast), T2-weighted, dual gradient echo with a variable flip angle, and dual gradient echo DCE-MRI scans to estimate Ktrans, Kep, vp, and ve. The pre- and postcontrast T1-weighted images were acquired in a spin-echo T1-weighted multislice sequence (repetition time [TR]/echo time [TE] =800/15.68 ms, 128×96 matrix, 27 slices [0.4 mm thick and gap 0.1 mm], and number of summed acquisitions [NEX] =4). Spin-echo T2-weighted images were obtained using standard two-dimensional Fourier transformation multislice (27 slices, 0.4 mm thick and gap 0.1 mm) multiecho sequence: TE/TR =20, 40, 60, 80/3,000, 128×96 matrix, and NEX =2. Prior to the DCE-MRI sequence, and immediately after, two Driven Equilibrium Single Pulse Observation of T1 (DESPOT1) sequences32 were run, using a dual-echo SPGRE sequence (the “mgems” sequence in the Agilent VnmrJ library) allowing a voxel-by-voxel estimation of T1 in the tissue pre- and post-CA administration. DESPOT1 sequence parameters are as follows: flip angles =3°, 5°, 7°, 12°, 15°, 25°, 45°, and 70°, matrix 128×64, seven 1.8 mm slices on 2 mm centers, and TE/TR =2.0, 4.0/80 ms. The DCE-MRI sequence was a dual-echo SPGRE (2GE) sequence with the same geometry and timing as the DESPOT1 sequence but with a fixed flip angle of 35° and an acquisition of 150 image sets at 5.13 s intervals for a total run time of ~12.8 minutes. At image 15 of the 2GE sequence, a bolus injection of the CA (Magnevist; Bayer Healthcare Pharmaceuticals, Wayne, NJ, USA), 0.25 mmol/kg at undiluted concentration, no flush, was performed by hand push, followed by a slight drawback.
Tumor volume analysis
Postcontrast T1-weighted images were used to determine the tumor volume. Two investigators, blinded to the various treatment groups, determined the volume by drawing irregular region of interests (ROIs) for all slices containing tumor. To calculate the exact volume, investigators summed up the number of slices and multiplied it by the slice thickness.
Kinetic analysis
The model equation
Since the basic approach to the pharmacokinetics of DCE studies has been previously published,27,33,34 we proceeded to the model equation associated with the full standard model used for parametric estimates33 as follows:
|
|

where R1p is the longitudinal relaxation rate of all protons in the blood plasma, R1t is the longitudinal relaxation rate of all protons in the tissue, Ktrans is the unidirectional volume transfer rate of the indicator from plasma across the vascular endothelium and blood–brain barrier into the interstitial space, kep is the transfer rate constant from the interstitial compartment to the vascular compartment, and vp is the fractional volume of the CA’s vascular distribution space, usually thought to be the plasma distribution space. The plasma fractional volume and the blood fractional volume are related via the following relationship: (vb = vp/[1 − Hct]), where Hct is the average hematocrit in the vessels of the voxel and vb is blood fraction volume.
ΔR1 calculation
Under experimental conditions, ie, using a dual-echo gradient echo sequence (the “mgems” sequence in the Agilent VnmrJ library), and assuming that the flip angle is known across the brain of the rodent, an estimate of the time trace of ΔR1 can be calculated from the following equation:
|
|
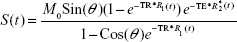
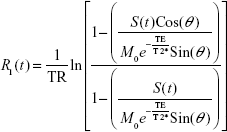
where S(t) is the signal intensity at time t, M0 is the equilibrium magnetization of the protons, θ is the flip angle, TR is the repetition time between pulses, TE is the echo time (the time between the center of the excitation pulse and the readout gradient), and R*2(t) is the transverse relaxation rate. Equation 2 can be solved for R1(t):
|
|
Numerical methods – processing
Using data from the DESPOT1 studies performed before and after the 2GE DCE-MRI study, voxel-by-voxel maps of T1 pre and postcontrast were generated by nonlinear least squares fitting.27 Given the T1 maps and dynamic 2GE data before and following the CA injection, the concentration–time curve of the CA was approximated by the calculated ΔR1 variation in time, using Equation 3. As mentioned in previous publications,33–35 a scaled radiological input function was used as the arterial input function in all studies. A global starting point was selected, usually one or two time points after the arrival of the indicator in the vasculature, and the next 105 data points (~9 minutes) were fitted by minimizing the sum of squared error. A model selection paradigm was used27,33 to ensure the stability in the parametric estimates.
In model 3 regions, the regions where the full model of Equation 1 could be fitted, Ktrans, Kep, vp, and ve, of the whole tumors (control and treated), were determined by drawing irregular ROIs on ImageJ (NIH, Bethesda, MD, USA). Multiple investigators, blinded to both groups, determined the vascular parameters from the whole tumor. For the whole tumor, an irregular ROI was drawn.
Protein extraction from glioma
Euthanized animals were perfused with ice cold ×1 phosphate-buffered saline. Brain tissues were collected and snap frozen immediately for preservation. For protein extraction, both hemispheres were separated, and surrounding tissue around the tumor was carefully removed. Next, investigators carefully cut the sections into small pieces and pulverized the samples. The entire brain tissue processing was done on dry ice to avoid degradation of brain proteins. The collected tissues of the tumor were lysed using RayBiotech protocol (RayBiotech, Norcross, GA, USA). Bovine serum albumin provided by BioRad Protein Assay (Bio-Rad Laboratories Inc., Hercules, CA, USA) was used as a standard to measure total protein concentration.
Protein analysis
The following proangiogenic factors were selected and analyzed based on positive signal intensity: angiogenin, angiostatin, angiopoietin-1, angiopoietin-2, G-CSF, platelet-derived growth factor AA (PDGF-AA), platelet-derived growth factor receptor A (PDGF-Ra), RANTES, bFGF, epidermal growth factor (EGF), EFGR, IGF-1, MMP-9, SDF-1α, Tie-1, Tie-2, VEGF-A, VEGF-C, VEGFR2, and VEGFR3. The membranes were specific for human cytokines, based on a chemiluminescent-labeling quantitative methodology. The developed membranes were imaged using a Multispectral Imaging System (Carestream). Later, the acquired images were analyzed measuring the signal intensity (pixel density) using ImageJ software. All signals emitted from the membrane were normalized to the positive control spots of the corresponding membrane.
Histopathology
Animals were euthanized and perfused by intracardiac injection of 100 mL ice cold ×1 phosphate-buffered saline, followed by 3% paraformaldehyde solution. All collected brain specimens were fixed in a solution containing 3% paraformaldehyde and 3% sucrose. Tissue sections were processed via either frozen or paraffin blocks for standard histology staining procedures. Our focus being on angiogenesis, proliferation, and human-specific marker to determine the position and number of invasive cells, we selected appropriate antibodies to target specific sites in the glioma. Von-Willebrand factor was used as the marker (Dako Denmark A/S, Glostrup, Denmark) for angiogenesis, Ki-67 (EMD Millipore, Billerica, MA, USA) was used to detect the proliferation, and major histocompatibility complex class 1 (MHC-1; now human leukocyte antigen A [HLA-A]; Abcam, [San Francisco, CA, USA]) was used for human-specific marker.
Evaluation of microvessel density
Von-Willebrand factor IHC helped to detect the microvessel in the tumor environment for determining angiogenesis.36–38 After tissue samples were stained, slides were microphotographed in five different areas, in which highly concentrated tube-like formations were observed. Images were taken at ×40 magnification with the AmScope microscope. Microvessel density (MVD) was determined by ImageJ using the color-thresholding image analysis method, in which highly dense positively stained vessels were highlighted and measured. A minimum of two investigators separately conducted the analysis to determine reproducibility and alleviate a biased estimation.
Evaluation of proliferation
Ki-67 IHC helped to detect the proliferation status of tumor cells. Slides were stained and microphotographed in five different areas (center, left, right, upper, and lower). In each image taken, all cells were counted (total cells), brown (positive for Ki-67) and blue (hematoxylin positive) cells. The proliferation rate was calculated by dividing the total number of brown cells (positive for Ki-67) by total number of cell (brown and blue cells).
Evaluation of invasive tumor cells (MHC-1)
MHC-1 IHC helped to detect cells that expressed human markers (ie, human U251 glioma cells in rat brain) and to determine the distance between the invasive MHC-1-positive cells from the primary tumor mass. Images were taken at low magnification, ×4 and ×10, to view the invasive cells away from the periphery of the primary tumor mass. The tumor periphery was confirmed on high magnification before all measurements. An irregular line was drawn at the most peripheral part of the tumor, which showed continuation to the primary tumor mass. Any MHC-1-positive cells away from the drawn line were considered invasive cells. A perpendicular line was drawn from the invasive tumor cells or tumor foci (center of the foci) to the drawn line at the tumor periphery, and the distance was noted. Distance from the migrated individual cell or distal tumor foci to the periphery of the primary tumor mass was determined, and the average values were calculated. The analysis was done using the software supplied by the vendor (ToupView Software; ToupTek Photonics Co. Ltd, Irvine, CA, USA).16 After many data points were collected, all distances were averaged and represented in micrometer (μm).
Statistical analysis
Comparisons between drug- and vehicle-treated groups were done by using a one-way analysis of variance with protected least significant difference (PLSD) post hoc test. All results were expressed as mean ± standard error of mean. A P-value <0.05 was considered significant in all analysis.
Results
Combination of HET0016 and vatalanib attenuated the refractory tumor growth observed with vatalanib alone
Significant differences in tumor volume were observed among the treatment groups or between the two treatment schedules (Figure 2). When the treatment started on day 8 following implantation of tumor cells, vatalanib showed significantly (P=0.0368) increased tumor volume, as shown by MRI on day 22 (Figure 2, upper and lower panels). The effect of vatalanib on tumor growth is similar to that of our previously published data.16,19 The addition of HET0016 to vatalanib attenuated the refractory tumor growth observed with vatalanib alone when the treatment started on day 8. When the treatment started on the day of the tumor implantation, HET0016 and combined treatment showed decreased tumor volume, although a statistically significant difference was not achieved.
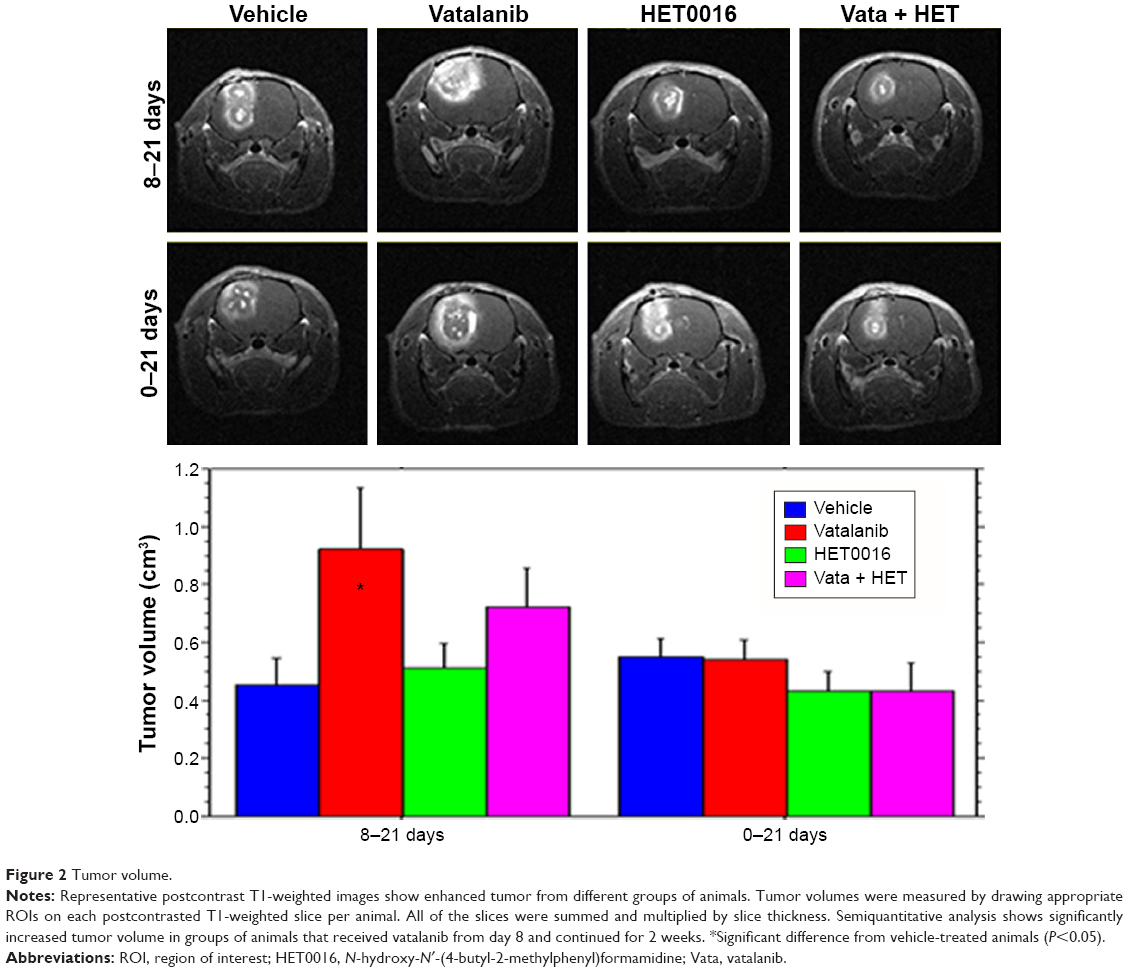 | Figure 2 Tumor volume. |
HET0016, in combination with vatalanib, altered the permeability transfer constant and but not the other vascular parameters
The results from our vascular parametric analysis relayed valuable information about the vascular kinetics in the tumor environment (Figure 3A and B). The first parameter we checked was the vp. There were no differences in vp values among the groups of animals when the treatment started on day 8 (8–21 days) (Figure 3A). The second parameter we analyzed was the vascular forward permeability transfer constant (Ktrans), in which we noted a significant difference between vehicle- and combination of HET0016 plus vatalanib-treated groups (P=0.0232), when animals were treated 8–21 days (Figure 3A). The other two parameters, backward transfer constant (Kep) and interstitial space volume (ve), were analyzed and proved no significant differences among the groups in both treatment schedules. vp was significantly different among the groups of animals that were treated early (0–21 days). There were significant differences observed between vehicle vs vatalanib (P=0.0071) and vehicle vs HET0016 (P=0.0065), when animals were treated from 0 to 21 days (Figure 3B). Although the vp was lower when both drugs were used in combination, significant differences were not achieved between the vehicle- and the combination of HET0016 plus vatalanib-treated groups.
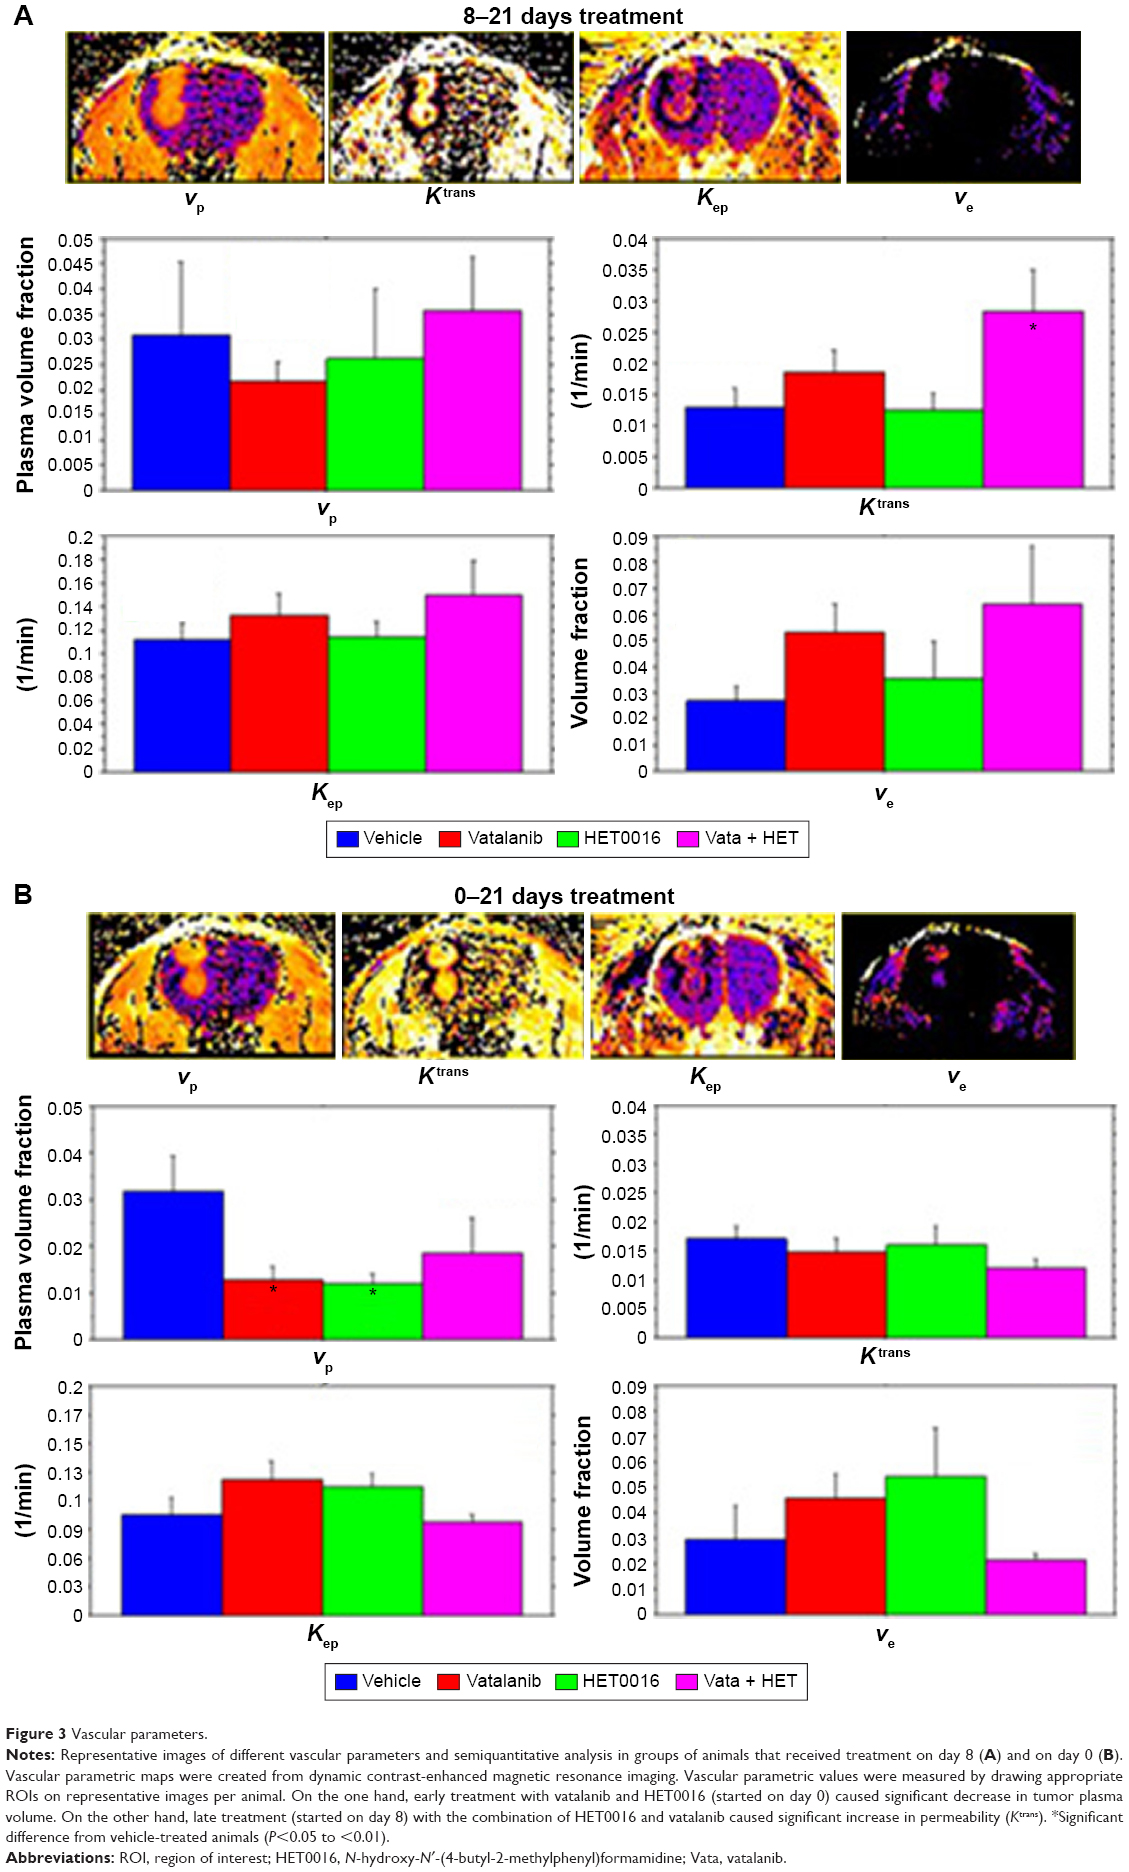 | Figure 3 Vascular parameters. |
HET0016 treatment in developed tumor increased the expression of proangiogenic factors
The 20 proangiogenic factors/receptors were analyzed from the tumor lysate to determine which factors/receptors were modulated during the treatments. Figure 4 and Table 1 summarize the values of different factors following treatments in two different treatment schedules, and significant differences among the groups. There were six growth factors (G-CSF, PDGF-Ra, PDGF-AA, bFGF, EGF, and EGFR) upregulated when animals were treated from 8 to 21 days with HET0016 compared with that of corresponding vehicle-treated animals. Along with the six growth factors, angiogenin (P=0.0173), angiostatin (P=0.0075), and RANTES (P=0.0010) were also upregulated when compared with vehicle. However, there were no significant differences observed for any of the factors between vehicle vs vatalanib and vehicle vs combined treatment groups when the treatment started on day 8 (8–21 days).
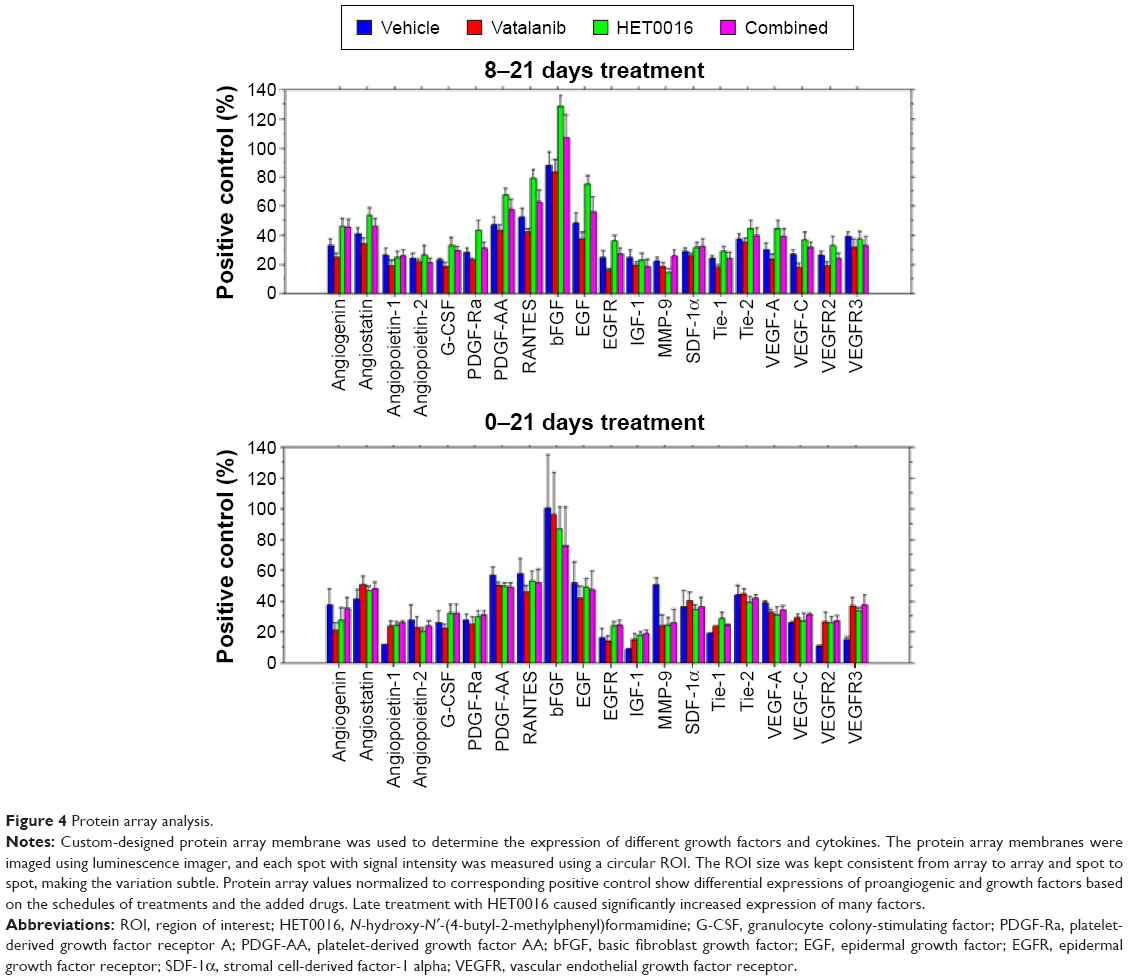 | Figure 4 Protein array analysis. |
 | Table 1 Effect of treatments on protein expression pattern of proangiogenic factors/receptors in glioblastoma tumor |
Interestingly, the 0–21 days treatment group did not show similar trends between vehicle vs HET0016 compared with that of the 8–21 days treatment group. Tie-1 (P=0.0264) and VEGFR3 (P=0.0401) were the only two factors that showed upregulation in the 0–21 days treatment group.
Treatments did not alter MVD
MVD analysis was performed to observe the neovascularization in the tumor following different treatments. There were no significant differences in either of the treatment schedules or among the treatment groups (Figure 5). Comparing across both treatment schedules, we observed no change in the density of vessels.
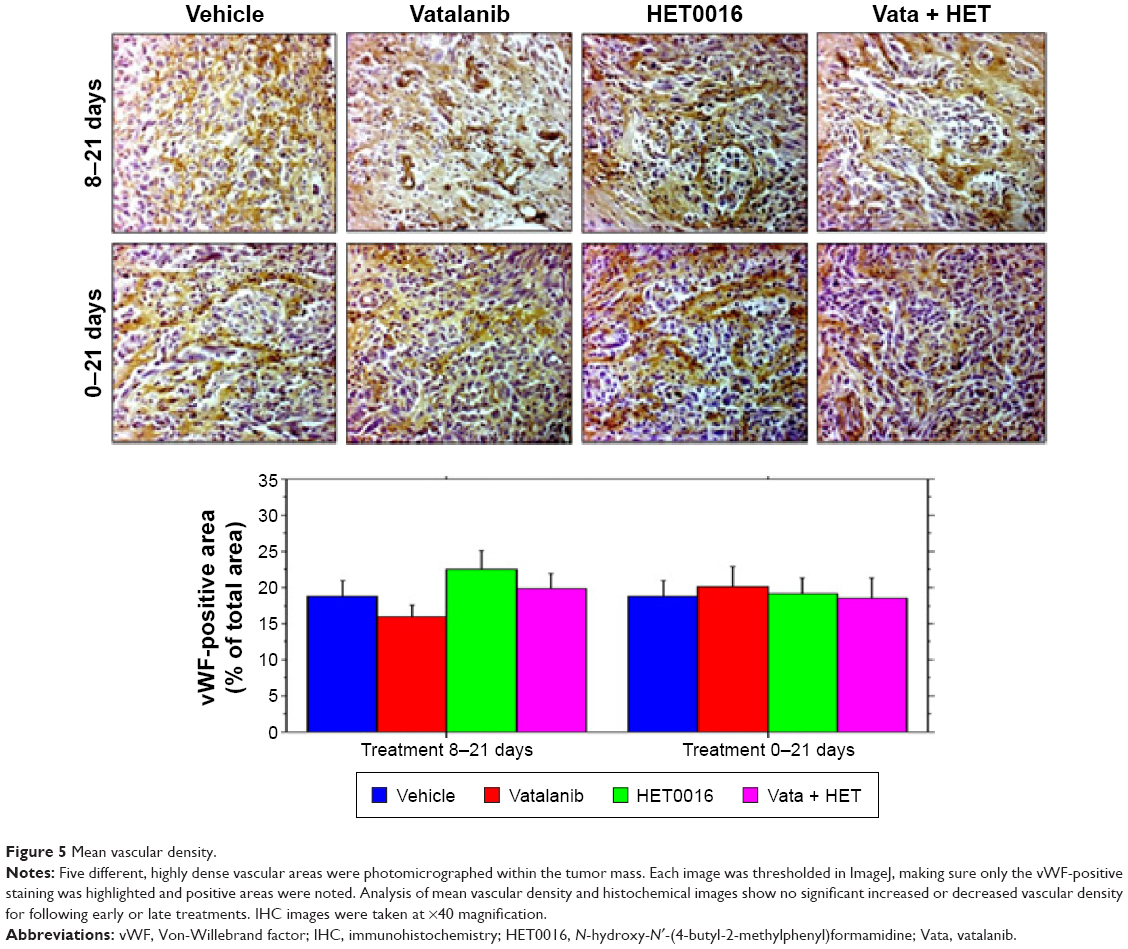 | Figure 5 Mean vascular density. |
Combined treatments of HET0016 and vatalanib decreased proliferation of cells in tumors
Ki-67 staining was performed to observe the proliferation of the tumor cells in different drug-treated animals. The bar graphs show (Figure 6) no statistically significant differences among the groups that were treated from 8 to 21 days, but in treatment schedule 0–21 days, combination of HET0016 plus vatalanib-treated group shows significantly lower (P=0.015) proliferation compared with that of other groups, including the vehicle.
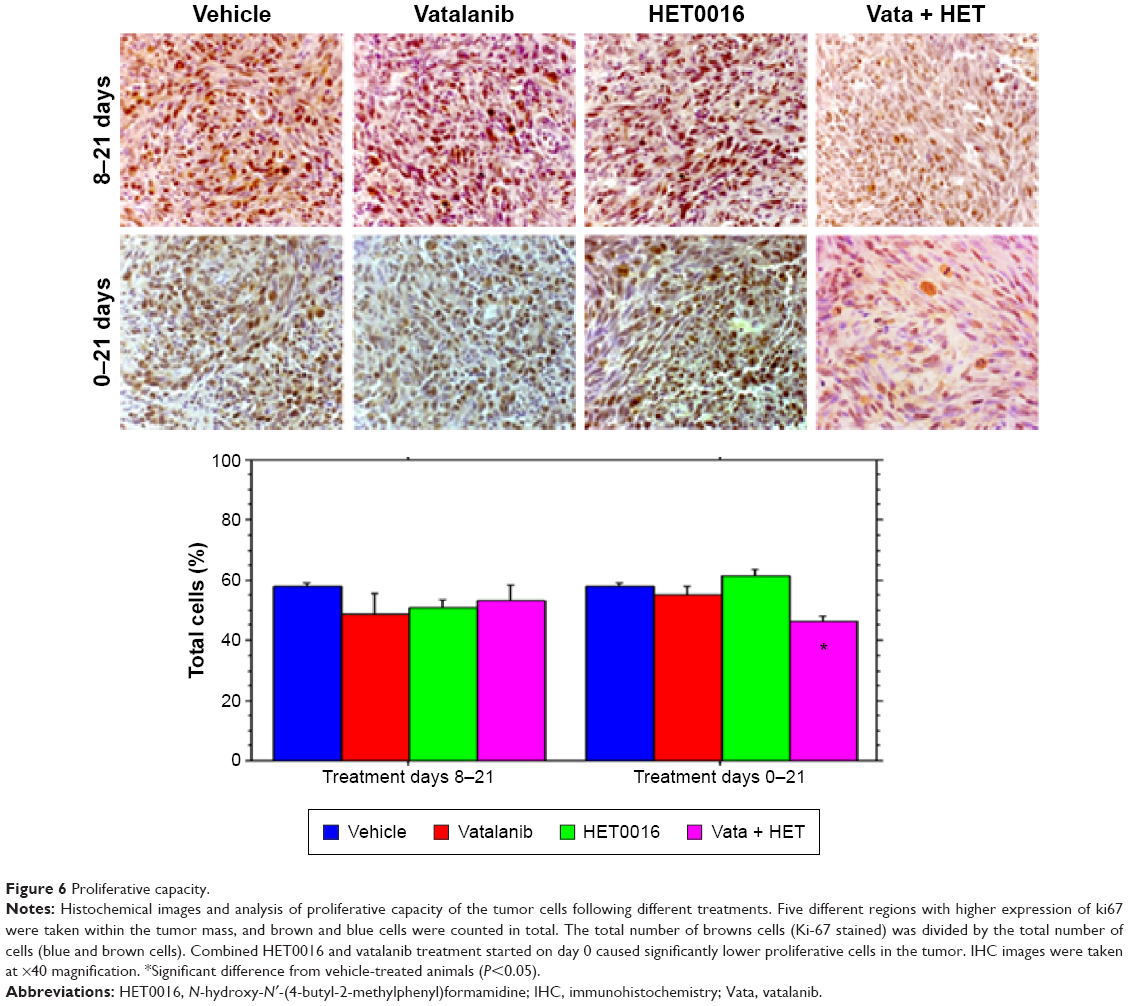 | Figure 6 Proliferative capacity. |
HET0016 treatment decreased migration of tumor cells
MHC-1 staining was performed to observe human glioma tumor cells deep into the rat brain to determine the migration or invasion of tumor cells. All of the drugs caused significantly decreased migration of human cells from the primary tumor mass to deeper part of surrounding rat brain when compared with that of vehicle-treated animals in the 8–21 days treatment schedule (vehicle vs vatalanib, P<0.0001; vehicle vs HET0016, P<0.0001; and vehicle vs combined, P<0.0001) (Figure 7). However, the results were different when the treatment started on day 0 (0–21 days). Treatment with HET0016 alone did not decrease the migration of tumor cells, whereas treatment with vatalanib alone or vatalanib plus HET0016 caused significantly decreased migration of tumor cells compared with that of vehicle-treated group.
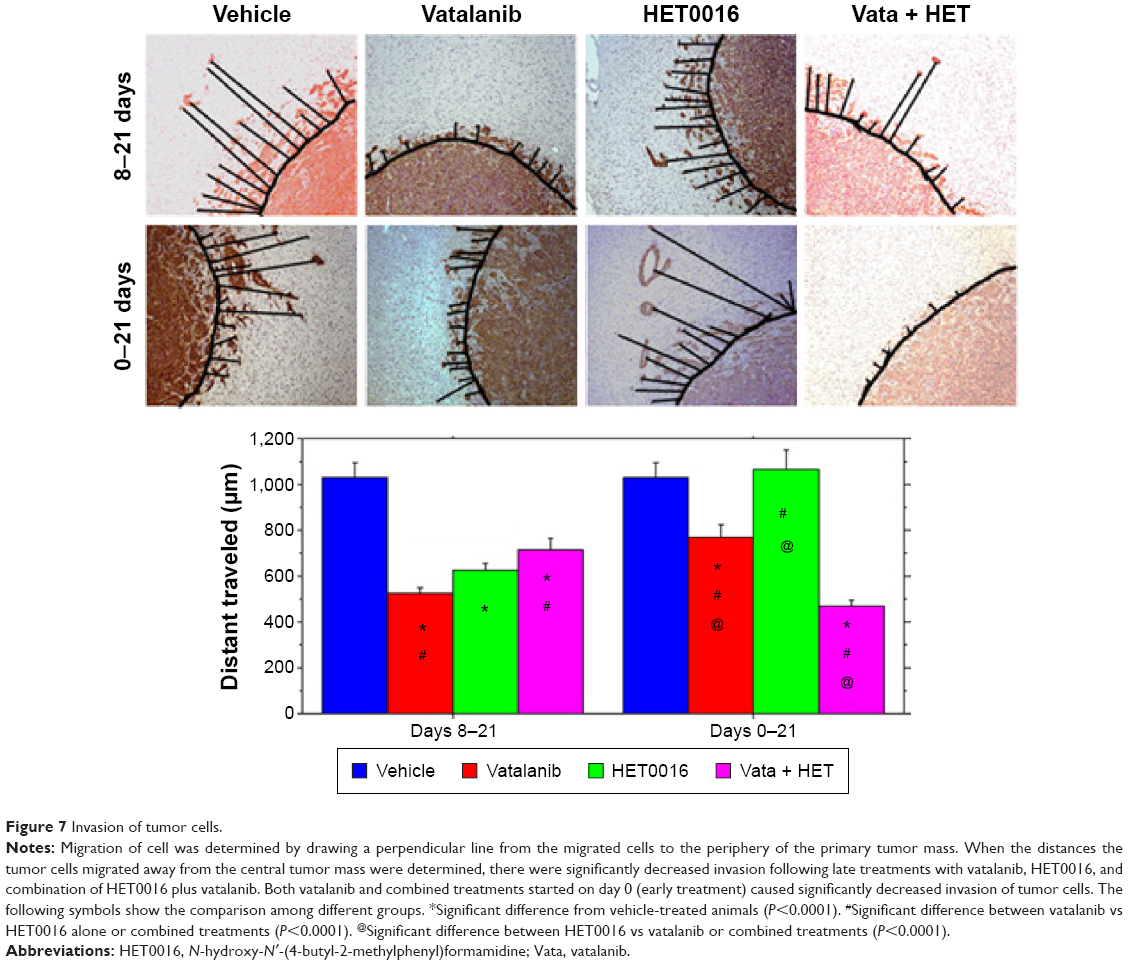 | Figure 7 Invasion of tumor cells. |
Discussion
The results of our studies demonstrated that the effect of vatalanib and HET0016 on glioma is dependent on the timing of the administration of the drug, with respect to the stages of tumor development. We also demonstrated that HET0016, a selective competitive inhibitor of the synthesis of 20-HETE, in combination with vatalanib, is capable of controlling the tumor growth, tumor cell proliferation, cell migration, and different vascular parameters (although not significantly for all). 20-HETE, a metabolite of arachidonic acid (AA) produced by the CYP4A and CYP4F enzyme families, may act as a second messenger for the vasoactive and mitogenic responses of some growth factors, including angiotensin II, norepinephrine, endothelin, vasopressin, serotonin, and EGF, and can be an important mediator of VEGF, inducing angiogenesis.24,39,40 VEGFR2 tyrosine kinase inhibitor, vatalanib, increased the tumor volume and permeability when the drug was administered in a developed tumor (days 8–21 treatment). The current findings are in parallel with our previously published reports.16,19 To our surprise, permeability was significantly increased when vatalanib was added to HET0016. The mechanisms of increasing permeability following vatalanib treatment are not straightforward. Our previous publications indicated paradoxical expression of hypoxia-inducible factor-1α (HIF-1α) at the peripheral part of the tumor following vatalanib treatment, which caused increased production of SDF-1α and VEGF. In the same publications, we indicated dilated vessels at the peripheral part of the tumors.19 SDF-1α is also known to mobilize bone marrow-derived progenitor cells, which induce neovascularization by vasculogenesis.20,41,42 Our recent data also proved increased mobilization and accumulation of bone marrow progenitor cells in the tumors following vatalanib treatments.43 Any type of neovessels (both angiogenesis and vasculogenesis) would be permeable to the administered MRI contrast agent. However, it is not clear why combined treatment (addition of HET0016) would make blood vessels more permeable. HET0016 is shown to normalize blood vessels in the tumor when administered early in the tumor development31 and also inhibit the VEGF-mediated proliferation and migration of EPCs.26 Because of the developed tumor, HET0016 might not have worked as expected, and the addition of vatalanib enhanced neovascularization. However, when both vatalanib and HET0016 were administered together on the day of tumor implantation (0–21 days treatment), tumor volume, tumor blood volume, permeability, and extravascular and extracellular space volume were decreased when compared with the corresponding vehicle-treated group. The results indicate the importance of early treatment as soon as the tumor is resected without being delayed for the appearance of recurrent tumor. It should be mentioned that our postsurgical mimic may not reflect the exact clinical scenario, where leftover cells are already embedded in the surrounding microenvironment with established circulation. However, based on our findings, early treatment would decrease tumor invasion.
There has been no report showing the effects of HET0016 on the expression level of different growth and proangiogenic factors in GBM. Investigators have shown increased level of VEGF and MMP-9 in tumors that overexpress cytochrome P450 ω-hydroxylase, which converts AA to 20-HETE that induces angiogenic responses in vivo and in vitro,44,45 and HET0016 inhibits the synthesis of 20-HETE. HET0016 is shown to inhibit the angiogenic response to EGF, VEGF, and bFGF.24,46 Given the complexity of the angiogenic process, we evaluated several proangiogenic factors to determine their behaviors during the treatment. Current consensus is that VEGF is the most important proangiogenic factor, and it can be modulated and stimulated by several other growth factors. VEGF expression by tumors is upregulated by hypoxia and is often elevated near the areas of tumor necrosis or at the periphery.19 Hypoxia activates an HIF-1α-binding sequence in the VEGF promoter, which leads to VEGF messenger RNA transcription and stability. Guo et al47 showed that 20-HETE first caused an increase in VEGF, which in turn causes the upregulation of HIF-1α. The resulting activation of HIF-1α in these cancers leads to the transcriptional induction, not only of VEGF and VEGFRs but also of endothelin-1, angiopoietins, and angiopoietin receptors (Tie-1 and -2). HET0016 treatment (8–21 days schedule) increased the expression of PDGF-Ra, PDGF-AA, bFGF, EGF, and EGFR, which are well-known proangiogenic factors. In our previous study on a breast cancer model, we noticed two different phenomena.48 With a short-term treatment with HET0016, all these aforementioned factors were downregulated, which was also seen in our in vitro studies (data not shown). The findings are also supported by Guo et al, who had shown that short-term treatment with HET0016 inhibited EGFR in U251 cells.46 However, when the treatment was continued for a longer period of time, there was an upregulation of these factors in the breast cancer.48 In the current studies, we also noticed two phenomena. When the treatment was started on day 8, these factors were upregulated, whereas when the treatment started on day 0 (on the day of tumor implantation), we did not notice any upregulation of these factors. We believe that the changes are due to different tumor cells (breast cancer vs glioma), treatment schedules, and activation of compensatory downstream EGFR signaling mechanisms for survival of tumor. Similar expressions were not observed when HET0016 was combined with vatalanib. Although these factors were increased, there was no increase in angiogenic response in treated tumors as indicated by nonsignificant changes in MVD in all treatment groups. The observed paradoxical effects indicate the importance of timing of treatment in tumors using HET0016 alone or in combination of vatalanib. Chronic inhibition of 20-HETE signaling decreased EGFR phosphorylation in mouse cystic kidneys, suggesting that 20-HETE has the ability of coupling and transactivation of EGFR.49 Similar effects were also found in U251 glioma cells, where 20-HETE inhibition by HET0016 reduced an EGFR activation, and subsequent proliferation stimulated by EGF.46,47 These findings are in accordance with our results when treatment started on day 0. On the other hand, preceding studies have indicated exacerbated signaling of multiple members of the EGFR family, often causing uncontrolled proliferation of cancer cells, possibly justifying the reason for high levels of EGF and EGFR in tumors when the treatment started on day 8 (in a developed tumor) in our study.50
Unlike previous studies, our results did not indicate decreased proliferation capacity of the tumor cells in either of the treatment schedules or in any of the treatment groups except the combined early treatment (day 0). We believe, due to low plasma availability and single-dose administration, it yielded no changes, when compared with previous studies, in which two injections per day were administered. When comparing the invasion of the tumor cells following treatments, all animals in late treatment groups (days 8–21) showed significant decrease in cell migration/invasion in comparison to corresponding vehicle-treated animals. On the other hand, decreased cell migration in vatalanib- and combined-treated animals was observed only in the early treatment groups. These differential effects can be explained as follows: 1) day 8 treatment has already developed tumor with an established microenvironment and 2) day 0 treatment has no established microenvironment, except tumor cell. The decrease in migration suggests that the treatment somehow decreased the invasiveness by affecting the microenvironment (stromal cells) at the invasive front (periphery of tumor), indicating that inhibitors have more effect on the microenvironment rather than the tumor cells. Different chemokine/growth factors and receptors are implicated for tumor cells to become migratory or invasive phenotypes.51,52 One of the complexes is SDF-1/CXCR4, which increases the binding of tumor cells to extracellular matrix through α5β3 integrin activation.52,53 Recently, investigators have demonstrated that α5β1 integrin binds to activate c-Met, which initiates Src/FAK signaling and promotes migration in ovarian cancer cells.54 Integrin EGFR macromolecular signaling complexes are also implicated for the changes in phenotype from normal epithelial to migratory cell types in breast cancer.55,56 Other growth factors, such as EGF and IGF-1 have also been shown to increase migratory capacity of different malignant cells.51 Wild-Bode et al have demonstrated that activity of MMP-2 and MMP-9 is the best predictor of glioma cell migration in an in vitro study.57 Other investigators have also pointed out the importance of MMPs in cell migration and invasion in glioma.58 We also reported increased migration of glioma cells following sublethal irradiation, which caused increased expression of CD44 and MMP-2.59 Despite increased EGF and EGFR expression (protein array data) with HET0016, there was no increased cell invasion/migration away from the primary tumor mass, which could be due to the attenuation of MMP-9. In both early and late HET0016 treatment groups, MMP-9 was lower (borderline significant differences) compared with vehicle-treated animals.
Conclusion
In summary, our results demonstrated that HET0016, a selective competitive inhibitor of the synthesis of 20-HETE, alone or in combination of VEGFR2 tyrosine kinase inhibitor (vatalanib), is capable of attenuating the tumor growth, tumor cell proliferation, cell migration, and different vascular parameters. However, all of these observations are contingent upon respective tumor developmental stages, timing, and selection of the appropriate drug administered.
Acknowledgments
We would like to thank Dr John Falck (UT Southwestern) for supplying HET0016 and Tazkia Bari, Swayampravaa Panda, Glauber Cabral, Roxan Ara, and Syed A Arbab for their assistance in making maps and supplying data. We would like to acknowledge National Institutes of Health (NIH) for funding our studies. This manuscript was supported by NIH grants (R01CA160216 and R01CA172048).
Author contributions
All authors contributed toward data analysis, drafting and critically revising the paper and agree to be accountable for all aspects of the work.
Disclosure
The authors report no conflicts of interest in this work.
References
Remer S, Murphy ME. The challenges of long-term treatment outcomes in adults with malignant gliomas. Clin J Oncol Nurs. 2004;8(4):368–376. | ||
Los M, Roodhart JM, Voest EE. Target practice: lessons from phase III trials with bevacizumab and vatalanib in the treatment of advanced colorectal cancer. Oncologist. 2007;12(4):443–450. | ||
Norden AD, Young GS, Setayesh K, et al. Bevacizumab for recurrent malignant gliomas: efficacy, toxicity, and patterns of recurrence. Neurology. 2008;70(10):779–787. | ||
Norden AD, Drappatz J, Wen PY. Novel anti-angiogenic therapies for malignant gliomas. Lancet Neurol. 2008;7(12):1152–1160. | ||
Dietrich J, Norden AD, Wen PY. Emerging antiangiogenic treatments for gliomas – efficacy and safety issues. Curr Opin Neurol. 2008;21(6):736–744. | ||
Miller KD, Sweeney CJ, Sledge GW Jr. Can tumor angiogenesis be inhibited without resistance? EXS. 2005;94:95–112. | ||
Saharinen P, Eklund L, Pulkki K, Bono P, Alitalo K. VEGF and angiopoietin signaling in tumor angiogenesis and metastasis. Trends Mol Med. 2011;17(7):347–362. | ||
Rahman R, Smith S, Rahman C, Grundy R. Antiangiogenic therapy and mechanisms of tumor resistance in malignant glioma. J Oncol. 2010;2010:251231. | ||
Norden AD, Drappatz J, Wen PY. Antiangiogenic therapy in malignant gliomas. Curr Opin Oncol. 2008;20(6):652–661. | ||
Bergers G, Hanahan D. Modes of resistance to anti-angiogenic therapy. Nat Rev Cancer. 2008;8(8):592–603. | ||
Saidi A, Javerzat S, Bellahcène A, et al. Experimental anti-angiogenesis causes upregulation of genes associated with poor survival in glioblastoma. Int J Cancer. 2008;122(10):2187–2198. | ||
Chinot OL, Wick W, Mason W, et al. Bevacizumab plus radiotherapy-temozolomide for newly diagnosed glioblastoma. N Engl J Med. 2014;370(8):709–722. | ||
Gilbert MR, Dignam JJ, Armstrong TS, et al. A randomized trial of bevacizumab for newly diagnosed glioblastoma. N Engl J Med. 2014;370(8):699–708. | ||
Pàez-Ribes M, Allen E, Hudock J, et al. Antiangiogenic therapy elicits malignant progression of tumors to increased local invasion and distant metastasis. Cancer Cell. 2009;15(3):220–231. | ||
de Groot JF, Fuller G, Kumar AJ, et al. Tumor invasion after treatment of glioblastoma with bevacizumab: radiographic and pathologic correlation in humans and mice. Neuro Oncol. 2010;12(3):233–242. | ||
Ali MM, Kumar S, Shankar A, et al. Effects of tyrosine kinase inhibitors and CXCR4 antagonist on tumor growth and angiogenesis in rat glioma model: MRI and protein analysis study. Transl Oncol. 2013;6(6):660–669. | ||
Kerbel RS. Tumor angiogenesis. N Engl J Med. 2008;358(19):2039–2049. | ||
Batchelor TT, Sorensen AG, di Tomaso E, et al. AZD2171, a pan-VEGF receptor tyrosine kinase inhibitor, normalizes tumor vasculature and alleviates edema in glioblastoma patients. Cancer Cell. 2007;11(1):83–95. | ||
Ali MM, Janic B, Babajani-Feremi A, et al. Changes in vascular permeability and expression of different angiogenic factors following anti-angiogenic treatment in rat glioma. PLoS One. 2010;5(1):e8727. | ||
Arbab AS. Activation of alternative pathways of angiogenesis and involvement of stem cells following anti-angiogenesis treatment in glioma. Histol Histopathol. 2012;27(5):549–557. | ||
Cros J, Sbidian E, Posseme K, et al. Tumor-infiltrating M2-type macrophages have the best prognostic value among a panel of hypoxia, angiogenesis and microenvironment related markers in 257 clear cell renal carcinomas. Virchows Arch. 2013;463(2):336–337. | ||
Maruscakova L, Poljak Z, El-Hassoun O, Kopani M, Jakubovsky J, Hulin I. The dynamics of hypoxia-angiogenesis relation as reflection of evolution of tumor microenvironment. Virchows Arch. 2013;463(2):321. | ||
Seki T, Wang MH, Miyata N, Laniado-Schwartzman M. Cytochrome P450 4A isoform inhibitory profile of N-hydroxy-N'-(4-butyl-2-methylphenyl)-formamidine (HET0016), a selective inhibitor of 20-HETE synthesis. Biol Pharm Bull. 2005;28(9):1651–1654. | ||
Chen P, Guo M, Wygle D, et al. Inhibitors of cytochrome P450 4A suppress angiogenic responses. Am J Pathol. 2005;166(2):615–624. | ||
Chen L, Ackerman R, Saleh M, et al. 20-HETE regulates the angiogenic functions of human endothelial progenitor cells and contributes to angiogenesis in vivo. J Pharmacol Exp Ther. 2014;348(3):442–451. | ||
Guo AM, Janic B, Sheng J, et al. The cytochrome P450 4A/F-20-hydroxyeicosatetraenoic acid system: a regulator of endothelial precursor cells derived from human umbilical cord blood. J Pharmacol Exp Ther. 2011;338(2):421–429. | ||
Bagher-Ebadian H, Jain R, Nejad-Davarani SP, et al. Model selection for DCE-T1 studies in glioblastoma. Magn Reson Med. 2012;68(1):241–251. | ||
Janic B, Arbab AS. Cord blood endothelial progenitor cells as therapeutic and imaging probes. Imaging Med. 2012;4(4):477–490. | ||
Kumar S, Arbab AS, Jain R, et al. Development of a novel animal model to differentiate radiation necrosis from tumor recurrence. J Neurooncol. 2012;108(3):411–420. | ||
Goldbrunner RH, Bendszus M, Wood J, Kiderlen M, Sasaki M, Tonn JC. PTK787/ZK222584, an inhibitor of vascular endothelial growth factor receptor tyrosine kinases, decreases glioma growth and vascularization. Neurosurgery. 2004;55(2):426–432. [discussion 432]. | ||
Guo M, Roman RJ, Fenstermacher JD, et al. 9L gliosarcoma cell proliferation and tumor growth in rats are suppressed by N-hydroxy-N'-(4-butyl-2-methylphenol) formamidine (HET0016), a selective inhibitor of CYP4A. J Pharmacol Exp Ther. 2006;317(1):97–108. | ||
Deoni SC, Peters TM, Rutt BK. High-resolution T1 and T2 mapping of the brain in a clinically acceptable time with DESPOT1 and DESPOT2. Magn Reson Med. 2005;53(1):237–241. | ||
Ewing JR, Bagher-Ebadian H. Model selection in measures of vascular parameters using dynamic contrast-enhanced MRI: experimental and clinical applications. NMR Biomed. 2013;26(8):1028–1041. | ||
Aryal MP, Nagaraja TN, Keenan KA, et al. Dynamic contrast enhanced MRI parameters and tumor cellularity in a rat model of cerebral glioma at 7 T. Magn Reson Med. 2014;71(6):2206–2214. | ||
Nagaraja TN, Aryal MP, Brown SL, et al. Cilengitide-induced temporal variations in transvascular transfer parameters of tumor vasculature in a rat glioma model: identifying potential MRI biomarkers of acute effects. PLoS One. 2013;8(12):e84493. | ||
Arbab AS, Thiffault C, Navia B, et al. Tracking of In-111-labeled human umbilical tissue-derived cells (hUTC) in a rat model of cerebral ischemia using SPECT imaging. BMC Med Imaging. 2012;12:33. | ||
Zhang L, Li Y, Zhang C, Chopp M, Gosiewska A, Hong K. Delayed administration of human umbilical tissue-derived cells improved neurological functional recovery in a rodent model of focal ischemia. Stroke. 2011;42(5):1437–1444. | ||
Christensen K, Aaberg-Jessen C, Andersen C, Goplen D, Bjerkvig R, Kristensen BW. Immunohistochemical expression of stem cell, endothelial cell, and chemosensitivity markers in primary glioma spheroids cultured in serum-containing and serum-free medium. Neurosurgery. 2010;66(5):933–947. | ||
Guo AM, Arbab AS, Falck JR, et al. Activation of vascular endothelial growth factor through reactive oxygen species mediates 20-hydroxyeicosatetraenoic acid-induced endothelial cell proliferation. J Pharmacol Exp Ther. 2007;321:18–27. | ||
Dhanasekaran A, Bodiga S, Gruenloh S, et al. 20-HETE increases survival and decreases apoptosis in pulmonary arteries and pulmonary artery endothelial cells. Am J Physiol Heart Circ Physiol. 2009;296(3):H777–H786. | ||
Ceradini DJ, Kulkarni AR, Callaghan MJ, et al. Progenitor cell trafficking is regulated by hypoxic gradients through HIF-1 induction of SDF-1. Nat Med. 2004;10(8):858–864. | ||
Hattori K, Heissig B, Rafii S. The regulation of hematopoietic stem cell and progenitor mobilization by chemokine SDF-1. Leuk Lymphoma. 2003;44(4):575–582. | ||
Achyut BR, Shankar A, Iskander AS, et al. Bone marrow derived myeloid cells orchestrate antiangiogenic resistance in glioblastoma through coordinated molecular networks. Cancer Lett. 2015;369(2):416–426. | ||
Yu W, Chai H, Li Y, et al. Increased expression of CYP4Z1 promotes tumor angiogenesis and growth in human breast cancer. Toxicol Appl Pharmacol. 2012;264(1):73–83. | ||
Yu W, Chen L, Yang YQ, et al. Cytochrome P450 omega-hydroxylase promotes angiogenesis and metastasis by upregulation of VEGF and MMP-9 in non-small cell lung cancer. Cancer Chemother Pharmacol. 2011;68(3):619–629. | ||
Guo M, Roman RJ, Falck JR, Edwards PA, Scicli AG. Human U251 glioma cell proliferation is suppressed by HET0016 [N-hydroxy-N'-(4-butyl-2-methylphenyl)formamidine], a selective inhibitor of CYP4A. J Pharmacol Exp Ther. 2005;315(2):526–533. | ||
Guo AM, Scicli G, Sheng J, Falck JC, Edwards PA, Scicli AG. 20-HETE can act as a nonhypoxic regulator of HIF-1alpha in human microvascular endothelial cells. Am J Physiol Heart Circ Physiol. 2009;297(2): H602–H613. | ||
Borin TF, Zuccari DA, Jardim-Perassi BV, et al. HET0016, a selective inhibitor of 20-HETE synthesis, decreases pro-angiogenic factors and inhibits growth of triple negative breast cancer in mice. PLoS One. 2014;9(12):e116247. | ||
Park F, Sweeney WE, Jia G, Roman RJ, Avner ED. 20-HETE mediates proliferation of renal epithelial cells in polycystic kidney disease. J Am Soc Nephrol. 2008;19(10):1929–1939. | ||
Alexanian A, Rufanova VA, Miller B, Flasch A, Roman RJ, Sorokin A. Down-regulation of 20-HETE synthesis and signaling inhibits renal adenocarcinoma cell proliferation and tumor growth. Anticancer Res. 2009;29(10):3819–3824. | ||
Friedl P, Wolf K. Tumour-cell invasion and migration: diversity and escape mechanisms. Nat Rev Cancer. 2003;3(5):362–374. | ||
Polacheck WJ, Zervantonakis IK, Kamm RD. Tumor cell migration in complex microenvironments. Cell Mol Life Sci. 2013;70(8):1335–1356. | ||
Engl T, Relja B, Marian D, et al. CXCR4 chemokine receptor mediates prostate tumor cell adhesion through alpha5 and beta3 integrins. Neoplasia. 2006;8(4):290–301. | ||
Mitra AK, Sawada K, Tiwari P, Mui K, Gwin K, Lengyel E. Ligand-independent activation of c-Met by fibronectin and alpha(5)beta(1)-integrin regulates ovarian cancer invasion and metastasis. Oncogene. 2011;30(13):1566–1576. | ||
Giancotti FG, Tarone G. Positional control of cell fate through joint integrin/receptor protein kinase signaling. Annu Rev Cell Dev Biol. 2003;19:173–206. | ||
Cabodi S, Moro L, Bergatto E, et al. Integrin regulation of epidermal growth factor (EGF) receptor and of EGF-dependent responses. Biochem Soc Trans. 2004;32(pt3):438–442. | ||
Wild-Bode C, Weller M, Wick W. Molecular determinants of glioma cell migration and invasion. J Neurosurg. 2001;94(6):978–984. | ||
Wick W, Platten M, Weller M. Glioma cell invasion: regulation of metalloproteinase activity by TGF-beta. J Neurooncol. 2001;53(2):177–185. | ||
Shankar A, Kumar S, Iskander AS, et al. Subcurative radiation significantly increases cell proliferation, invasion, and migration of primary glioblastoma multiforme in vivo. Chin J Cancer. 2014;33(3):148–158. | ||
Guo AM, Sheng J, Scicli GM, et al. Expression of CYP4A1 in U251 human glioma cell induces hyperproliferative phenotype in vitro and rapidly growing tumors in vivo. J Pharmacol Exp Ther. 2008; Oct; 327(1):10–19. |
 © 2016 The Author(s). This work is published and licensed by Dove Medical Press Limited. The full terms of this license are available at https://www.dovepress.com/terms.php and incorporate the Creative Commons Attribution - Non Commercial (unported, v3.0) License.
By accessing the work you hereby accept the Terms. Non-commercial uses of the work are permitted without any further permission from Dove Medical Press Limited, provided the work is properly attributed. For permission for commercial use of this work, please see paragraphs 4.2 and 5 of our Terms.
© 2016 The Author(s). This work is published and licensed by Dove Medical Press Limited. The full terms of this license are available at https://www.dovepress.com/terms.php and incorporate the Creative Commons Attribution - Non Commercial (unported, v3.0) License.
By accessing the work you hereby accept the Terms. Non-commercial uses of the work are permitted without any further permission from Dove Medical Press Limited, provided the work is properly attributed. For permission for commercial use of this work, please see paragraphs 4.2 and 5 of our Terms.