")
Back to Journals » Journal of Inflammation Research » Volume 15
Combination of Uric Acid and Pro-Inflammatory Cytokines in Discriminating Patients with Gout from Healthy Controls
Authors Zha X, Yang B, Xia G, Wang S
Received 5 January 2022
Accepted for publication 21 February 2022
Published 28 February 2022 Volume 2022:15 Pages 1413—1420
DOI https://doi.org/10.2147/JIR.S357159
Checked for plagiarism Yes
Review by Single anonymous peer review
Peer reviewer comments 2
Editor who approved publication: Professor Ning Quan
Xuwen Zha,1,* Bo Yang,2,* Guangyun Xia,1 Shan Wang1
1Department of Rheumatology and Immunology, The First People’s Hospital of Hefei, Binhu Hospital of Hefei, The Third Affiliated Hospital of Anhui Medical University, Hefei, 230000, People’s Republic of China; 2Department of Burn & Plastic Surgery, The First People’s Hospital of Hefei, Binhu Hospital of Hefei, The Third Affiliated Hospital of Anhui Medical University, Hefei, 230000, People’s Republic of China
*These authors contributed equally to this work
Correspondence: Guangyun Xia; Shan Wang, Department of Rheumatology and Immunology, The First People’s Hospital of Hefei, Binhu Hospital of Hefei, The Third Affiliated Hospital of Anhui Medical University, Hefei, 230000, People’s Republic of China, Email [email protected]; [email protected]
Objective: The aim of present study was to explore whether the combination of serum uric acid and pro-inflammatory cytokines could improve the accuracy of diagnosis of gout.
Methods: A total of 94 patients with gout were selected as the patient group, and 52 healthy subjects were selected as the control group. Serum levels of uric acid and pro-inflammatory cytokines (C-reactive protein (CRP), interleukin-6 (IL-6), and tumor necrosis factor-α (TNF-α)) were measured in both groups. Correlation between serum uric acid and pro-inflammatory cytokines was assessed using Pearson correlation analysis. The area under curve (AUC) of CRP, IL-6, TNF-α combined with uric acid for the diagnosis of gout were evaluated by receiver operating characteristic (ROC) curve method.
Results: Compared with the control group, the levels of serum uric acid, CRP, TNF-α and IL-6 were significantly increased in the patients. Moreover, there was a positive correlation between serum uric acid and CRP (r = 0.179, P = 0.033), IL-6 (r = 0.194, P = 0.039), and TNF-α (r = 0.496, P < 0.001) levels. Furthermore, the AUCs of CRP, IL-6, TNF-α combined with uric acid level for the diagnosis of gout were 0.932, 0.884, and 0.972, respectively. Additionally, the AUC for the combination of uric acid, CRP, and TNF-α was 0.982 in discriminating patients with gout from healthy volunteers.
Conclusion: The combination of serum uric acid and pro-inflammatory cytokines could improve the accuracy of diagnosis of gout.
Keywords: gout, uric acid, pro-inflammatory cytokine, diagnosis
Introduction
Gout, characterized by the deposition of monosodium urate crystals (MSU) in joints and tendons, is the most common form of inflammatory arthritis.1 The prevalence of gout varies among ethnic groups with overall lower frequency in Europe (0.9–2.5%) and America (3.9%) as compared to some Oceanic-Pacific ethnic groups (over 6%).2 Despite the availability of valid therapeutic options, gout is often misdiagnosed and its long-term management is suboptimal.3,4 Detection of MSU crystals in synovial fluid is the gold standard for diagnosis of gout, however, this is rarely performed for the reason that obtaining a sample may be technically difficult, painful for the patient and the accuracy of the results may be affected by multiple factors.5 Other diagnostic methods such as X-ray, dual-source CT (DSCT), magnetic resonance imaging (MRI), and high-frequency ultrasound also have disadvantages such as inability to assess early soft tissue changes, low positive rates, and high prices.6,7 Hyperuricemia, defined as a serum urate level above the upper limit of the normal reference range, is considered an important biochemical detection marker for the diagnosis of gout.8–10 Epidemiological data show that serum uric acid levels are closely related to the incident gout.11 However, emerging evidence suggest that not all hyperuricaemic patients have or will develop gout.12,13 Thus, 2018 updated European League Against Rheumatism evidence-based recommendations for the diagnosis of gout suggests that the diagnosis of gout should not be made on the presence of hyperuricaemia alone.13 Therefore, it is of great clinical significance to explore efficient biochemical markers to improve the accuracy of uric acid in the diagnosis of gout.
Gout is now regarded as systemic inflammatory disease driven by activation of the innate immune system.14 Studies on the underlying mechanisms of gouty inflammation provide remarkable insights into the inflammasome and pro-inflammatory cytokine release. Specifically, tumor necrosis factor-α (TNF-α), some interleukins, and NOD-like receptor protein 3 (NLRP3) inflammasome mediate the development of gout and induce a series of cascade inflammatory amplification reactions through the participation of macrophages, monocytes and neutrophils.15 It has been reported that the serum levels of pro-inflammatory cytokines such as interleukin-6 (IL-6) and TNF-α were significantly increased in gout patients compared to healthy controls.16 Therefore, whether pro-inflammatory cytokines could serve as objective and reliable biological indicators for the diagnosis of gout was evaluated in the present study.
Considering the elevated levels of pro-inflammatory cytokines in peripheral blood of patients with gout, together with the crucial role of uric acid in the pathophysiology of gout, the aim of the present study was to investigate whether pro-inflammatory cytokines and uric acid could be used as noninvasive biomarkers for the diagnosis of gout and their combination could improve the accuracy of diagnosis of gout.
Materials and Methods
Patients
A total of 94 patients with gout from Department of Rheumatology and Immunology at Third Affiliated Hospital of Anhui Medical University between May 2018 and November 2021, fulfilling the classification criteria of 2015 American College of Rheumatology/European League Against Rheumatism (ACR/EULAR), were enrolled in the study. Patients with clinical evidence of other autoimmune diseases, hematologic diseases, malignancies, infections and abnormal liver function were excluded. In order to avoid sex-related errors, all patients were male. A total of 50 age- and sex-matched healthy individuals without evidence of illness and abnormal serum urate concentrations were recruited as controls. The study was approved by the Ethics Committee of Hefei First People’s Hospital and was conducted according to the principles of the Declaration of Helsinki. Informed written consent was obtained from all subjects.
Samples and Measurements
The blood samples from patients with gout and healthy controls were collected from the participants’ vein between 7:00 A.M. and 8:00 A.M., and immediately centrifuged at 3000 rpm for 5 minutes at 4°C. Extract supernatant as serum sample was collected. The extracted serum was stored at −80°C until detection. Serum uric acid levels were detected by a BECKMAN DXC800 automatic biochemical analyzer (Brea, USA). Commercially available Enzyme-Linked Immunosorbent Assay (ELISA) kits were used to measure the concentrations of C-reactive protein (CRP), IL-6, and TNF-α (Jianglai Bio, Shanghai, China) according to the manufacturer’s instructions.
Statistical Analysis
Data were analyzed using SPSS (version 17.0; IBM Corp., Armonk, NY, USA). Data are expressed as the mean ± standard error of the mean (SEM), and P < 0.05 was considered statistically significant. A one-sample Kolmogorov–Smirnov test showed a normal distribution of the continuous variables. A Student’s t-test was used to evaluate differences between the groups (with Levene’s test for equality of variances). The correlation analyses were performed using a Pearson correlation test. The receiver operating characteristic (ROC) curve analysis was plotted to evaluate the area under the curve (AUC) of pro-inflammatory cytokines and uric acid for diagnosing gout.
Results
Demographic Values, Uric Acid, and Pro-Inflammatory Cytokines Levels in Serum of the Gout Group and the Control Group
As shown in Table 1, there were no significant differences in age (t = 0.780, P = 0.437) or BMI (t = 1.534, P = 0.127) between the two groups. The levels of uric acid in serum of the gout group were significantly higher than those of the control group. In terms of pro-inflammatory cytokines, the CRP (t = −5.032, P < 0.001), IL-6 (t = −2.040, P = 0.044), and TNF-α (t = −10.996, P < 0.001) levels in serum were also increased in patients with gout (Table 1).
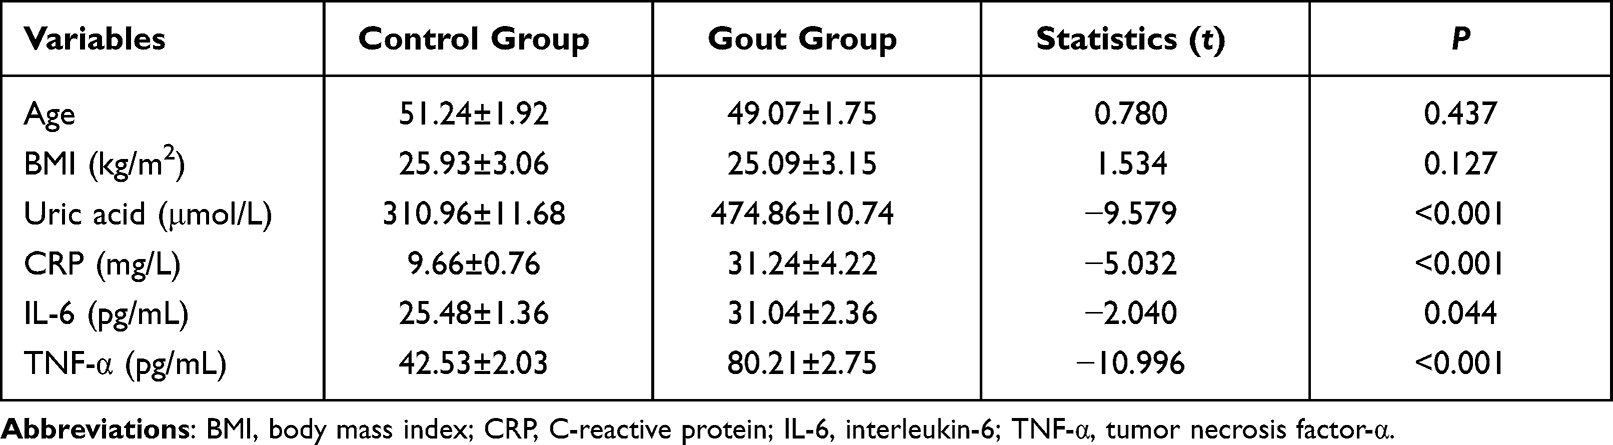 |
Table 1 Comparison of Mean Values of Demographic Data, Uric Acid, CRP, IL-6, and TNF-α Levels in Serum Between the Gout and Control Groups (Mean ± SEM) |
Relationship Between Serum Uric Acid Levels and Pro-Inflammatory Cytokines
As shown in Figure 1, the serum uric acid levels were positively correlated with the CRP (r = 0.179, P = 0.033), IL-6 (r = 0.194, P = 0.039), and TNF-α (r = 0.496, P < 0.001) levels.
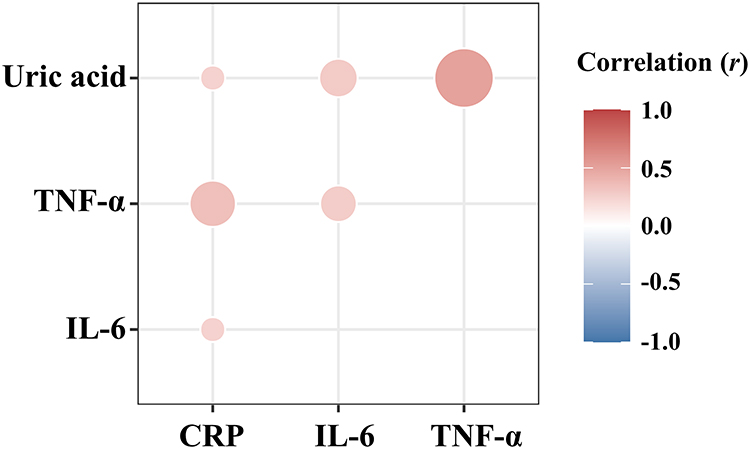 |
Figure 1 Correlation between serum uric acid and pro-inflammatory cytokines levels (Pearson correlation analysis). Abbreviations: CRP, C-reactive protein; IL-6, interleukin-6; TNF-α, tumor necrosis factor-α. |
Diagnostic Values of Serum Uric Acid Levels and Pro-Inflammatory Cytokines in Patients with Gout
As shown in Figure 2A and Table 2, ROC analysis indicated the potential diagnostic value of the serum uric acid concentrations in discriminating patients with gout from healthy volunteers with an AUC of 0.893 (P < 0.001; 95% confidence interval (CI): 0.838–0.948). In terms of pro-inflammatory cytokines, the AUCs of CRP, IL-6, and TNF-α levels were 0.681 (P = 0.004; 95% CI: 0.595–0.766; Figure 2B and Table 2), 0.610 (P = 0.0443; 95% CI: 0.505–0.715; Figure 2C and Table 2), and 0.956 (P < 0.001; 95% CI: 0.910–1.000; Figure 2D and Table 2), respectively.
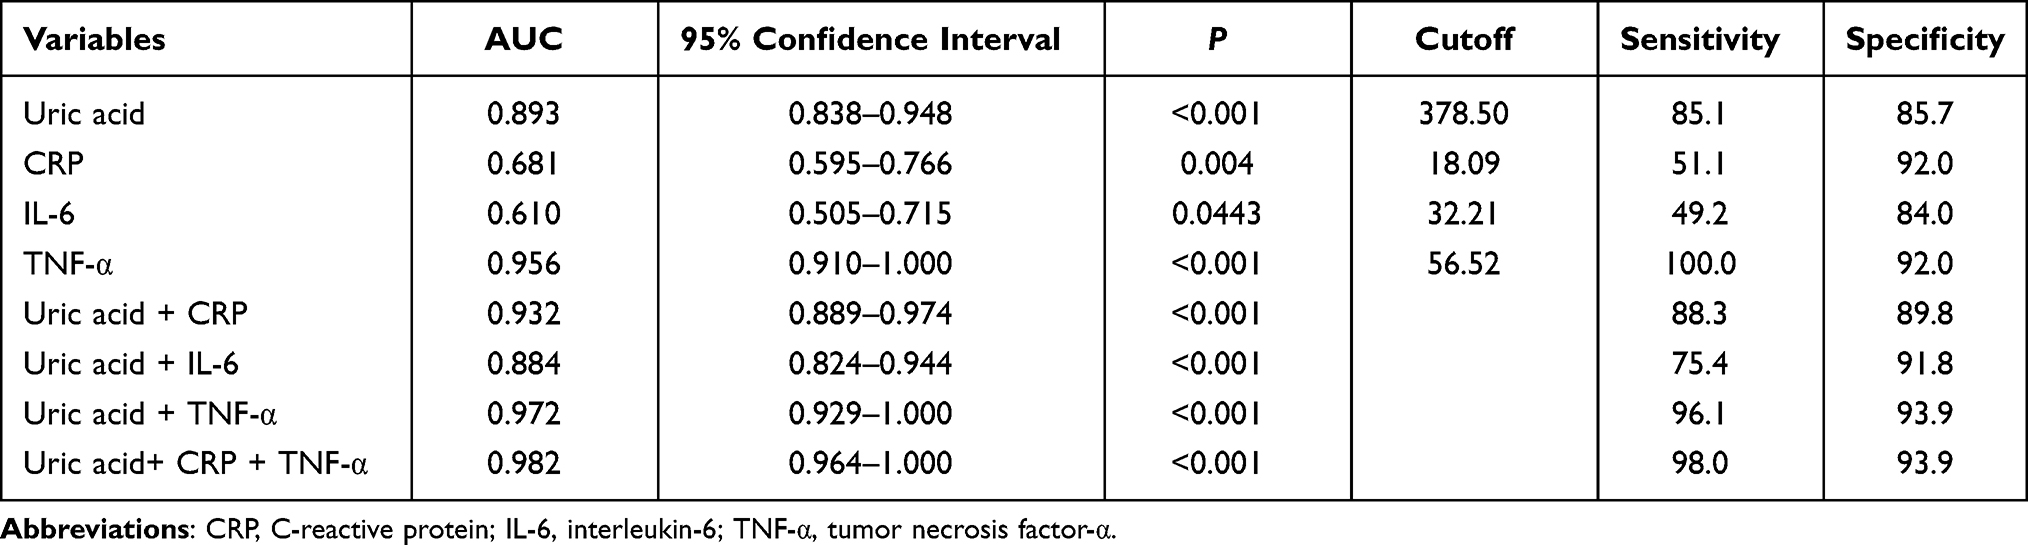 |
Table 2 ROC Analysis of Various Indicators for Diagnosis of Gout |
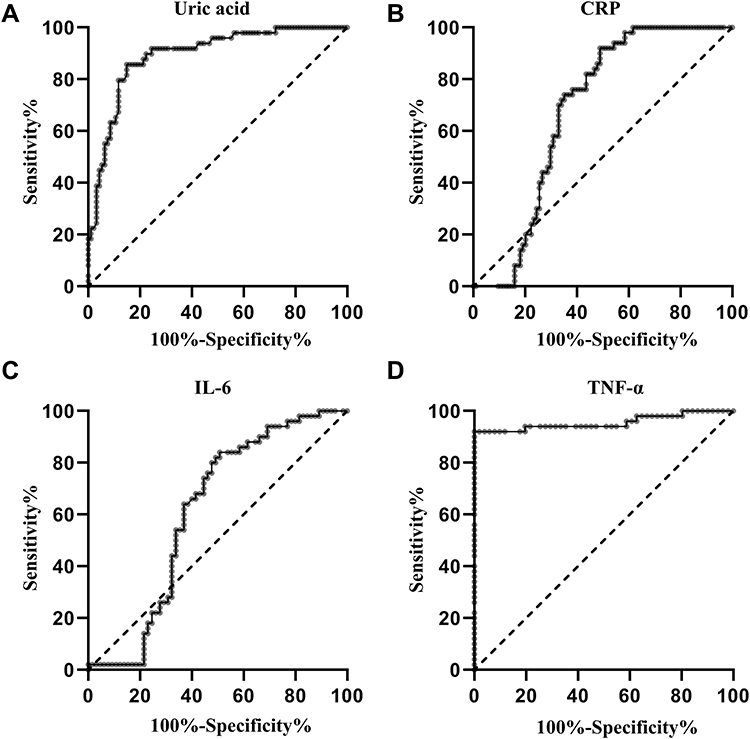 |
Figure 2 ROC curve of serum uric acid and pro-inflammatory cytokines in identification of the patients with gout. (A) ROC curve of uric acid; (B) ROC curve of CRP; (C) ROC curve of IL-6; (D) ROC curve of TNF-α. Abbreviations: CRP, C-reactive protein; IL-6, interleukin-6; TNF-α, tumor necrosis factor-α; ROC, receiver operating characteristic. |
At a cut-off point of 378.50 μmol/L for uric acid, the sensitivity and specificity were 85.1% and 85.7% for separating patients with gout from healthy volunteers. At a cut-off point of 18.09 mg/L for CRP, the sensitivity and the specificity were 51.1% and 92.0%, respectively. At a cut-off point of 32.21 pg/mL for IL-6, the sensitivity and the specificity were 49.2% and 84.0%, respectively. At a cut-off point of 56.52 pg/mL for TNF-α, the sensitivity and the specificity were 100.0% and 92.0%, respectively (Table 2).
When the test results for uric acid and pro-inflammatory cytokines were considered jointly, the ROC analysis revealed an AUC of 0.932 (P < 0.001; 95% CI: 0.889–0.974; Figure 3A and Table 2) for the combination of uric acid and CRP, an AUC of 0.884 (P < 0.001; 95% CI: 0.824–0.944; Figure 3B and Table 2) for combination of uric acid and IL-6, an AUC of 0.972 (P < 0.001; 95% CI: 0.929–1.000; Figure 3C and Table 2) for combination of uric acid and TNF-α, respectively. The AUC for the combination of uric acid, CRP, and TNF-α was 0.982 (P < 0.001; 95% CI: 0.964–1.000; Figure 3D and Table 2) in discriminating patients with gout from healthy volunteers.
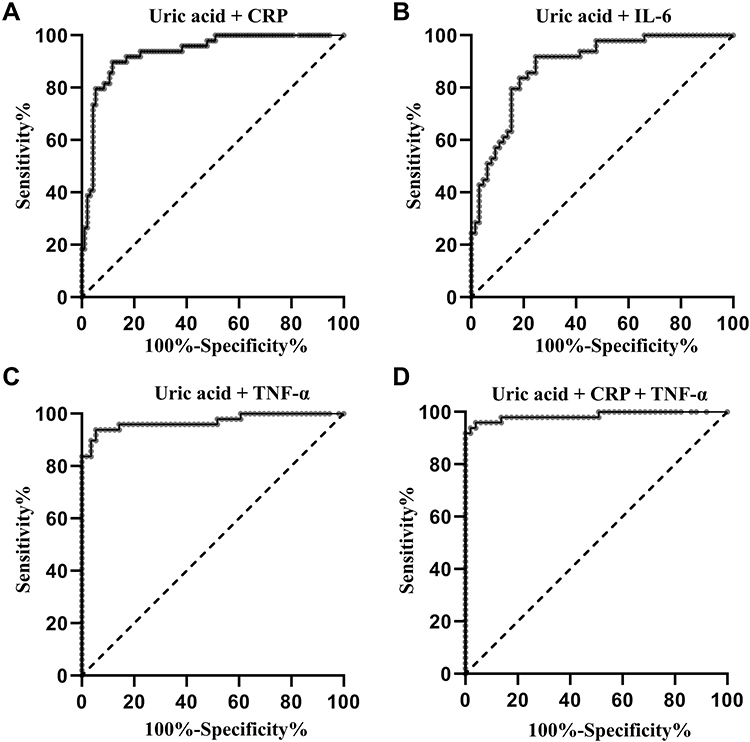 |
Figure 3 ROC curve for the combination of uric acid and pro-inflammatory cytokines in identification of the patients with gout. (A) ROC curve for the combination of uric acid and CRP; (B) ROC curve for the combination of uric acid and IL-6; (C) ROC curve for the combination of uric acid and TNF-α; (D) ROC curve for the combination of uric acid, CRP, and TNF-α. Abbreviations: CRP, C-reactive protein; IL-6, interleukin-6; TNF-α, tumor necrosis factor-α; ROC, receiver operating characteristic. |
Discussion
In the present study, we demonstrated that the levels of serum uric acid, CRP, TNF-α, and IL-6 were significantly increased in the patients compared with the control group. Moreover, the results of the Pearson correlation analysis showed that there was a positive correlation between serum uric acid and CRP, IL-6, and TNF-α levels. Furthermore, the results of the ROC curve analysis revealed that the AUCs of CRP, IL-6, TNF-α combined with uric acid level for the diagnosis of gout were 0.932, 0.884, and 0.970, respectively. Additionally, the AUC for the combination of uric acid, CRP, and TNF-α was 0.986 in discriminating patients with gout from healthy volunteers, suggesting that combination of serum uric acid and pro-inflammatory cytokines could improve the accuracy of diagnosis of gout.
Hyperuricemia is considered to be a crucial causal factor for gout. It has been demonstrated that all patients with gout experience hyperuricemia for at least a period of time.17,18 Numerous evidence has indicated a close relationship between serum uric acid levels and the risk suffering from gout.19–21 Due to the low solubility of uric acid, long-term hyperuricemia leads to destructive crystalline urate deposits around joints, which causes inflammation and destroys the joint structure, eventually leads to the occurrence and development of gout.22 Thus, the American Rheumatism Association 1977 case definition of primary gout takes hyperuricemia as one of the 12 diagnostic indicators of gout symptoms.23 In the present study, the serum levels of uric acid of the gout group were significantly higher than those of the control group. Moreover, the results of ROC curve analysis showed that the AUC for serum uric acid was 0.893 in discriminating patients with gout from healthy volunteers, suggesting that serum uric acid may be a potential marker for the diagnosis of gout. However, although hyperuricemia is often used as the main diagnostic index in hospitals, gout can still occur when serum uric acid levels are normal.8 Thus, there is an urgent need to develop other biochemical indicators to improve the diagnostic accuracy of uric acid.
Activation of the innate immune response is crucial in the pathogenesis of gout, which leads to the release of pro-inflammatory cytokines.24 Consistent to the result that the concentrations of CRP, IL-6, and TNF-α were significantly higher in acute gout attack patients,25 the levels of serum CRP, TNF-α, and IL-6 were significantly increased in the patients compared with the control group in the present study. It is well known that uric acid crystals clearly have the potential to induce inflammation given their role in pathogenesis of gout and elevated serum uric acid levels have been associated with increased levels of proinflammatory cytokines.26,27 In the present Consistently, a positive correlation between serum uric acid and CRP, IL-6, and TNF-α level was observed in the present study, providing more data linking uric acid to inflammation.
Based on the observation that combining the detection of different biomarkers may help to increase the sensitivity and specificity over the use of a single biomarker,28,29 a combined ROC analysis using uric acid and pro-inflammatory cytokines was further conducted. The results showed that the AUC for the combination of uric acid, CRP, and TNF-α increased to 0.986 compared with the AUC value (0.893) of uric acid alone. These findings suggest that the combination of uric acid and pro-inflammatory cytokines (CRP, and TNF-α) may offer a useful tool for the detection of gout.
Due to the fact that the most common types of arthritis are rheumatoid arthritis (RA), osteoarthritis (OA), psoriatic arthritis (PsA), ankylosing spondylitis (AS), gout, and pseudogout,30 it is of great clinical significance to explore efficient biochemical markers to distinguish patients with gout from patients with other types of inflammatory arthritis. Uric acid levels in serum has been reported to be useful to distinguish quickly gouty from other types of inflammatory arthritis.31 Considering that serum levels of pro-inflammatory cytokines were increased in patients with various types of inflammatory arthritis, it is rational to assume that combination of serum uric acid and pro-inflammatory cytokines cannot improve the diagnostic accuracy of serum uric acid alone for distinguishing patients with gout from those with other types of inflammatory arthritis. Further studies need to be performed to investigate other indicator but not pro-inflammatory cytokines to improve the diagnostic accuracy of serum uric acid for distinguishing patients with gout from those with other types of inflammatory arthritis. In the present study, the aim of present study was to explore whether uric acid and pro-inflammatory cytokines could improve the diagnostic accuracy for distinguishing patients with gout from healthy people. Consistently, numerous studies have also used healthy subjects as controls to find biomarkers of gout diagnosis.32–34 Our results may help to screen out gout patients in the health checkup.
There are some limitations to this study. Firstly, all the subjects in this study were men, limiting the ability to expand these results to the whole population due to the sex differences in the incidence of gout35 and in controlled clinical trials testing SUA-lowering drugs.36 Secondly, since epidemiological surveys have confirmed the strong relationship of gout and hyperuricaemia with hypertension,37 the blood pressure values of the subjects should be observed. Thirdly, there may be some misclassification bias since the identification of patients with gout was based on a clinical diagnosis of gout (the gold standard of urate crystal identification in synovial aspirate is not mandatory for inclusion into the study).
Conclusion
In conclusion, this study is the first to reveal that combination of serum uric acid and pro-inflammatory cytokines could improve the accuracy of diagnosis of gout. Multicentric studies are clearly required to validate the potential value of this combination for the diagnosis of gout.
Disclosure
The authors declare no conflicts of interest in this work.
References
1. Dalbeth N, Gosling A, Gaffo A, Abhishek A. Gout. Lancet. 2021;397:1843–1855. doi:10.1016/s0140-6736(21)00569-9
2. Dehlin M, Jacobsson L, Roddy E. Global epidemiology of gout: prevalence, incidence, treatment patterns and risk factors. Nat Rev Rheumatol. 2020;16:380–390. doi:10.1038/s41584-020-0441-1
3. Kuo C, Grainge M, Mallen C, Zhang W, Doherty M. Rising burden of gout in the UK but continuing suboptimal management: a nationwide population study. Ann Rheum Dis. 2015;74:661–667. doi:10.1136/annrheumdis-2013-204463
4. Nannoni G, Volterrani G, Mattarocci A, Minoretti P, Emanuele E. Comparative efficacy and safety of Verbascox - a proprietary herbal extract capable of inhibiting human cyclooxygenase-2 - and celecoxib for knee osteoarthritis. Drug Discov Ther. 2020;14:129–134. doi:10.5582/ddt.2020.03034
5. Davies J, Riede P, van Langevelde K, Teh J. Recent developments in advanced imaging in gout. Ther Adv Musculoskelet Dis. 2019;11:1759720X19844429. doi:10.1177/1759720x19844429
6. Newberry S, FitzGerald J, Motala A, et al. Diagnosis of Gout: a Systematic Review in Support of an American College of Physicians Clinical Practice Guideline. Ann Intern Med. 2017;166:27–36. doi:10.7326/m16-0462
7. Underwood M. Diagnosis and management of gout. BMJ. 2006;332:1315–1319. doi:10.1136/bmj.332.7553.1315
8. Schlesinger N. Diagnosing and treating gout: a review to aid primary care physicians. Postgrad Med. 2010;122:157–161. doi:10.3810/pgm.2010.03.2133
9. Cicero A, Fogacci F, Cincione R, Tocci G, Borghi C. Clinical Effects of Xanthine Oxidase Inhibitors in Hyperuricemic Patients. Med Principles Practice. 2021;30:122–130. doi:10.1159/000512178
10. Cicero A, Fogacci F, Kuwabara M, Borghi C. Therapeutic Strategies for the Treatment of Chronic Hyperuricemia: an Evidence-Based Update. Medicina. 2021;57. doi:10.3390/medicina57010058
11. Dalbeth N, Phipps-Green A, Frampton C, Neogi T, Taylor W, Merriman T. Relationship between serum urate concentration and clinically evident incident gout: an individual participant data analysis. Ann Rheum Dis. 2018;77:1048–1052. doi:10.1136/annrheumdis-2017-212288
12. Lin K, Lin H, Chou P. The interaction between uric acid level and other risk factors on the development of gout among asymptomatic hyperuricemic men in a prospective study. J Rheumatol. 2000;27:1501–1505.
13. Richette P, Doherty M, Pascual E, et al. updated European League Against Rheumatism evidence-based recommendations for the diagnosis of gout. Ann Rheum Dis. 2018;2020(79):31–38. doi:10.1136/annrheumdis-2019-215315
14. Ragab G, Elshahaly M, Bardin T. Gout: an old disease in new perspective - A review. J Adv Res. 2017;8:495–511. doi:10.1016/j.jare.2017.04.008
15. So A, Martinon F. Inflammation in gout: mechanisms and therapeutic targets. Nat Rev Rheumatol. 2017;13:639–647. doi:10.1038/nrrheum.2017.155
16. Zeng M, Dang W, Chen B, et al. IL-37 inhibits the production of pro-inflammatory cytokines in MSU crystal-induced inflammatory response. Clin Rheumatol. 2016;35:2251–2258. doi:10.1007/s10067-015-3109-5
17. Trifirò G, Morabito P, Cavagna L, et al. Epidemiology of gout and hyperuricaemia in Italy during the years 2005-2009: a nationwide population-based study. Ann Rheum Dis. 2013;72:694–700. doi:10.1136/annrheumdis-2011-201254
18. Luk A, Simkin P. Epidemiology of hyperuricemia and gout. Am j Managed Care. 2005;11:S435–442.
19. Primatesta P, Plana E, Rothenbacher D. Gout treatment and comorbidities: a retrospective cohort study in a large US managed care population. BMC Musculoskelet Disord. 2011;12:103. doi:10.1186/1471-2474-12-103
20. Choi H, Ford E. Prevalence of the metabolic syndrome in individuals with hyperuricemia. Am J Med. 2007;120:442–447. doi:10.1016/j.amjmed.2006.06.040
21. Stamp L, Dalbeth N. Screening for hyperuricaemia and gout: a perspective and research agenda. Nature Reviews Rheumatology. 2014;10(12):752–756. doi:10.1038/nrrheum.2014.139
22. Rock K, Kataoka H, Lai J. Uric acid as a danger signal in gout and its comorbidities. Nat Rev Rheumatol. 2013;9:13–23. doi:10.1038/nrrheum.2012.143
23. Wallace S, Robinson H, Masi A, Decker J, McCarty D, Yü T. Preliminary criteria for the classification of the acute arthritis of primary gout. Arthritis Rheum. 1977;20:895–900. doi:10.1002/art.1780200320
24. Cabău G, Crișan T, Klück V, Popp R, Joosten L. Urate-induced immune programming: consequences for gouty arthritis and hyperuricemia. Immunol Rev. 2020;294:92–105. doi:10.1111/imr.12833
25. Jiang X, Li M, Yang Q, Du L, Du J, Zhou J. Oxidized low density lipoprotein and inflammation in gout patients. Cell Biochem Biophys. 2014;69:65–69. doi:10.1007/s12013-013-9767-5
26. Higgins P, Dawson J, Walters M. The potential for xanthine oxidase inhibition in the prevention and treatment of cardiovascular and cerebrovascular disease. Cardiovasc Psychiatry Neurol. 2009;2009:282059. doi:10.1155/2009/282059
27. Jin M, Yang F, Yang I, et al. Uric acid, hyperuricemia and vascular diseases. Front Biosci. 2012;17:656–669. doi:10.2741/3950
28. Lu Z, Chen Y, Jing X, Wang N, Zhang T, Hu C. Detection and Identification of Serum Peptides Biomarker in Papillary Thyroid Cancer. Med Sci Monitor. 2018;24:1581–1587. doi:10.12659/msm.907768
29. Enroth S, Berggrund M, Lycke M, et al. High throughput proteomics identifies a high-accuracy 11 plasma protein biomarker signature for ovarian cancer. Commun Biol. 2019;2:221. doi:10.1038/s42003-019-0464-9
30. Tang Y. Prevalence of doctor-diagnosed arthritis and arthritis-attributable activity limitation–United States, 2010-2012. Morbidity Mortality Weekly Rep. 2013;62:869–873.
31. Lenski M, Scherer M. Analysis of synovial inflammatory markers to differ infectious from gouty arthritis. Clin Biochem. 2014;47:49–55. doi:10.1016/j.clinbiochem.2013.10.019
32. Qing Y, Zheng J, Tang Y, Dai F, Dong Z, Zhang Q. LncRNAs Landscape in the patients of primary gout by microarray analysis. PLoS One. 2021;16:e0232918. doi:10.1371/journal.pone.0232918
33. Ning Y, Yang G, Chen Y, et al. Characteristics of the Urinary Microbiome From Patients With Gout: a Prospective Study. Front Endocrinol (Lausanne). 2020;11:272. doi:10.3389/fendo.2020.00272
34. Guo Z, Zhang J, Wang Z, et al. Intestinal Microbiota Distinguish Gout Patients from Healthy Humans. Sci Rep. 2016;6:20602. doi:10.1038/srep20602
35. Gregolini L, Ferrari S, Marcolongo R, Aleo M, Marinello E, Bianchi E. Hormonal aspects of human gout–excretion of adrenal hormone derivatives in gouty patients. Clin Chim Acta. 1983;130:269–277. doi:10.1016/0009-8981(83)90300-5
36. Fogacci F, Borghi C, Di Micoli A, Degli Esposti D, Cicero A. Inequalities in enrollment of women and racial minorities in trials testing uric acid lowering drugs. Nutrition Metab Cardiovascular Dis. 2021;31:3305–3313. doi:10.1016/j.numecd.2021.09.011
37. Gibson T. Hypertension, its treatment, hyperuricaemia and gout. Curr Opin Rheumatol. 2013;25:217–222. doi:10.1097/BOR.0b013e32835cedd4
 © 2022 The Author(s). This work is published and licensed by Dove Medical Press Limited. The full terms of this license are available at https://www.dovepress.com/terms.php and incorporate the Creative Commons Attribution - Non Commercial (unported, v3.0) License.
By accessing the work you hereby accept the Terms. Non-commercial uses of the work are permitted without any further permission from Dove Medical Press Limited, provided the work is properly attributed. For permission for commercial use of this work, please see paragraphs 4.2 and 5 of our Terms.
© 2022 The Author(s). This work is published and licensed by Dove Medical Press Limited. The full terms of this license are available at https://www.dovepress.com/terms.php and incorporate the Creative Commons Attribution - Non Commercial (unported, v3.0) License.
By accessing the work you hereby accept the Terms. Non-commercial uses of the work are permitted without any further permission from Dove Medical Press Limited, provided the work is properly attributed. For permission for commercial use of this work, please see paragraphs 4.2 and 5 of our Terms.