")
Back to Journals » Diabetes, Metabolic Syndrome and Obesity » Volume 15
Combination of TyG Index and GRACE Risk Score as Long-Term Prognostic Marker in Patients with ACS Complicated with T2DM Undergoing PCI
Authors Qin Z, Xu S, Yuan R, Wang Z, Lu Y, Xu Y, Lv Y, Yu F, Bai J, Zhang H, Zhang L, Zhang J, Tang J
Received 25 May 2022
Accepted for publication 8 September 2022
Published 28 September 2022 Volume 2022:15 Pages 3015—3025
DOI https://doi.org/10.2147/DMSO.S376178
Checked for plagiarism Yes
Review by Single anonymous peer review
Peer reviewer comments 2
Editor who approved publication: Prof. Dr. Muthuswamy Balasubramanyam
Zhen Qin,1– 3 Shuai Xu,1– 3 Ruixia Yuan,4 Zeyu Wang,1– 3 Yongzheng Lu,1– 3 Yanyan Xu,1– 3 Yan Lv,1– 3 Fengyi Yu,1– 3 Jing Bai,1– 3 Hui Zhang,1– 3 Li Zhang,1– 3 Jinying Zhang,1– 3 Junnan Tang1– 3
1Department of Cardiology, The First Affiliated Hospital of Zhengzhou University, Zhengzhou, Henan, 450052, People’s Republic of China; 2Henan Province Key Laboratory of Cardiac Injury and Repair, Zhengzhou, Henan, 450052, People’s Republic of China; 3Henan Province Clinical Research Center for Cardiovascular Diseases, Zhengzhou, Henan, 450018, People’s Republic of China; 4Clinical Big Data Center, The First Affiliated Hospital of Zhengzhou University, Zhengzhou, Henan, 450052, People’s Republic of China
Correspondence: Junnan Tang, Department of Cardiology, The First Affiliated Hospital of Zhengzhou University, Zhengzhou, Henan, 450052, People’s Republic of China, Tel +86 15890696166, Email [email protected] Jinying Zhang, Department of Cardiology, The First Affiliated Hospital of Zhengzhou University, Zhengzhou, Henan, 450052, People’s Republic of China, Tel +86 13503830283, Email [email protected]
Objective: We aimed to investigate the prognostic value of the triglyceride-glucose (TyG) index combined the with Global Registry of Acute Coronary Events (GRACE) score in adult acute coronary syndrome (ACS) patients with type 2 diabetes mellitus (T2DM) who underwent percutaneous coronary intervention (PCI).
Methods: The study enrolled total 899 ACS patients with T2DM who underwent PCI. TyG index and the GRACE risk score were calculated and assessed by median. The correlation was analyzed by Spearman’s rank correlation coefficient. The cumulative major adverse cardiovascular event (MACE) curve was generated using the Kaplan–Meier method. Multivariate Cox regression was used to identify predictors of MACEs. Additionally, the receiver operating characteristic curve (ROC), net reclassification index (NRI) and Integrated Discrimination Improvement (IDI) were applied to analyze the performance of each single factor index and combined multivariate index in predicting MACE.
Results: In the ACS patients with T2DM after PCI, there were significant differences in the TyG index and GRACE risk score between the MACE group and the MACE-free group (P < 0.001). Kaplan–Meier analysis showed that the TyG index combined with the GRACE risk score was positively correlated with the occurrence of MACEs (log rank P < 0.001). Multivariate Cox regression analyses showed that the TyG index, the GRACE risk score, and the TyG index combined with the GRACE risk score were independent predictors of long-term MACEs (adjusted HR: 1.805; 95% CI: 1.479– 2.203, P < 0.001; adjusted HR: 1.012; 95% CI: 1.009– 1.016, P < 0.001; and adjusted HR: 2.337; 95% CI: 1.805– 3.025, P < 0.001, respectively). Correlation analysis indicated that the TyG index was positively correlated with the GRACE risk score (R = 0.140, P < 0.001). The analysis of AUC, NRI and IDI revealed that the combined multivariate index performed better prognostic role than each single factor index in predicting the occurrence of MACE.
Conclusion: Both the GRACE risk score and the TyG index could be significant and independent predictors of clinical outcomes in ACS patients with T2DM after PCI. A combination of them could be enhanced predictions of clinical outcomes in these patients.
Keywords: triglyceride-glucose index, GRACE risk score, predictive biomarker, acute coronary syndrome, type 2 diabetes mellitus, percutaneous coronary intervention
Introduction
Cardiovascular disease (CVD), especially coronary artery disease (CAD), is the leading cause of death worldwide. According to the World Health Organization, the number of cardiovascular disease-related deaths worldwide increased from 12.1 million in 1990 to 18.6 million in 2019.1 Acute coronary syndrome (ACS), as a complex CAD lesion, is characterized by high mortality and disability rates.2
Diabetes mellitus (DM), especially type 2 DM (T2DM), is one of the most important risk factors for the development and aggravation of CVD,3 particularly CAD. DM is present in almost one-third of ACS patients, and patients with DM tend to present with more complex coronary lesions.4 Furthermore, ACS patients with DM are associated with worse clinical outcomes such as higher all-cause mortality. Not only are the mortality rates higher in patients with DM than in their non-DM counterparts, but repeat revascularization, stroke, and myocardial infarction are also more common during follow-up. Therefore, there is an urgent need to improve the management of patients with ACS-T2DM, and by monitoring prognostic markers, long-term clinical outcomes can be improved. At present, abnormal blood lipid metabolism and insulin resistance (IR) induced by T2DM have been reported to reduce plaque stability in atherosclerosis patients, which in turn affects the pathological process of diabetes.5 The triglyceride-glucose (TyG) index, a simple surrogate estimate of IR,6 has been demonstrated to predict CVD morbidity and mortality in the general population and many patient cohorts. Studies have shown that elevated TyG index levels are a significant predictor of adverse cardiovascular events in non-diabetic patients diagnosed with NSTE-ACS and undergoing elective PCI.7 Guo et al showed that the TyG index was closely associated with the risk of developing MACCE in ACS patients with T2DM.8
The Global Registry of Acute Coronary Events (GRACE) score has been widely applied as a predictor of prognosis in ACS patients. Moreover, the GRACE risk score has increased consistency in the investigation and management of ACS patients in multiple cohorts.9 Although the GRACE risk score has been validated, the score does not include the measurement of important biomarkers.10
However, to the best of our knowledge, the predictive value of the TyG index and the GRACE risk score, either separately or combined, for major adverse cardiac events (MACEs) in patients with ACS and T2DM undergoing percutaneous coronary intervention (PCI) and the potential incremental prognostic value of TyG index combined with GRACE risk score has not been determined.
Methods
Design and Study Population
The study is a single-center, retrospective, observational cohort study of T2DM patients with ACS undergoing PCI for the first time in the First Affiliated Hospital of Zhengzhou University between December 2017 and December 2020.
ACS was defined as a clinical phenotype with at least one coronary heart disease, including non-ST-elevation myocardial infarction, ST-elevation myocardial infarction, and unstable angina.11 PCI was performed using standard techniques after qualitative and quantitative coronary angiographic analyses. All procedural decisions, including device selection and adjunctive pharmacotherapy, were made at the discretion of experienced interventional cardiologists according to the 2007 focused update of the ACC/AHA/SCAI 2005 guideline for PCI. Patients with T2DM were diagnosed based on Classification and Diagnosis of Diabetes: Standards of Medical Care in Diabetes-2018. Diagnostic criteria included the following: (1) self-reported diabetes, previously diagnosed by a doctor; (2) active use of hypoglycemic drugs for treatment; (3) fasting plasma glucose ≥ 126 mg/dL (7.0 mmol/L), two-hour plasma glucose ≥ 200 mg/dL (11.1 mmol/L) in the oral glucose tolerance test, or HbA1c ≥ 6.5%.12
Exclusion criteria of patients included the following: (1) age < 18 years; (2) hyperthyroidism, anemia, or any other high-intensity heart disease; (3) hypertrophic cardiomyopathy; (4) pulmonary heart disease; (5) congenital heart disease; (6) autoimmune disease; (7) malignancy; and (8) patients with incomplete clinical records.
Initially, 950 patients were enrolled. However, 51 patients were lost to follow-up. As a result, 899 patients were enrolled. The study was conducted in accordance with the Declaration of Helsinki and the study protocol was approved by the Ethics Committee of the First Affiliated Hospital of Zhengzhou University. Additionally,the writtern/oral informed consent was also obtained by us from the participants. Details of the study design are available at http://www.chictr.org (identifier: ChiCTR-2200055450). Follow-up data were obtained by consulting medical records and/or conducting telephone interviews. The study flow chart is shown in Figure 1.
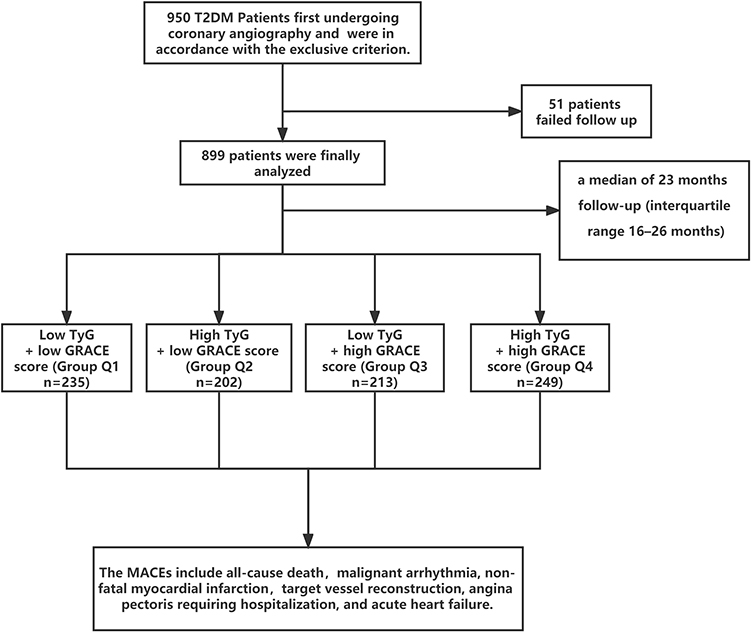 |
Figure 1 The flow chart of participants inclusion. |
Clinical and Demographic Characteristics
Blood samples were collected from patients within 24 hours of admission and before PCI. Clinical and demographic characteristics including age, gender, history of hypertension and T2DM, smoking status, alcohol consumption, and history of medication were collected from medical records. The left ventricular ejection fraction (LVEF) and laboratory data were recorded, including fasting blood glucose (FBG), glycated hemoglobin, urea and uric acid, total cholesterol (TC), low-density lipoprotein cholesterol (LDL-C), high-density lipoprotein cholesterol (HDL-C) and triglyceride (TG) levels, NT-pro BNP, fibrinogen, complete blood count, and white blood cell (WBC) count. The data of GRACE risk score items were recorded on admission. The score is derived from several variables, including age, systolic blood pressure, heart rate, ST-segment depression, cardiac function classification, creatinine level, cardiac arrest, and cardiac enzyme/marker levels at admission.
Calculation of GRACE Risk Score
The GRACE risk score was calculated using the GRACE risk score website (https://www.mdcalc.com/GRACE-acs-risk-mortality-calculator#evidence).
Calculation of TyG Index
The TyG index was calculated from admission fasting glucose and blood lipid levels using the following formula:

Division of Patient Groups
The patients were divided into four groups according to the median GRACE risk score (Groups Q1 and Q2, GRACE risk score < 116; Groups Q3 and Q4, GRACE risk score ≥ 116) and TyG index (Groups Q1 and Q3, TyG index < 9.872; Groups Q2 and Q4, TyG index ≥ 9.872). In Group Q1 (low TyG index + low GRACE risk score), n = 235; in Group Q2 (high TyG index + low GRACE risk score), n = 202; in Group Q3 (low TyG index + high GRACE risk score), n = 213; and in Group Q4 (high TyG index + high GRACE risk score), n = 249. Subsequently, the patients were divided into the MACE group (n = 262) and the non-MACE group (n = 637) according to if the patient presented MACEs during the follow-up period.
Clinical Endpoint and Follow-Up
All-cause death, malignant arrhythmia, non-fatal myocardial infarction, target vessel reconstruction, angina pectoris requiring hospitalization, and acute heart failure were defined as MACEs. All patients were followed up by telephone, email, or outpatient clinic visits. If the patients presented with MACEs, the follow-up would be endorsed. Otherwise, the patients would be followed up until the study was terminated.
Statistical Analysis
All analyses were performed using SPSS 26.0 for Windows (SPSS Inc., Chicago, IL, USA) and R software (Version 4.0.2; https://www.r-project.org). The Kolmogorov–Smirnov test was used to assess the normal distribution of quantitative variables. Continuous data are presented as the mean ± standard deviation, and the differences between normally distributed numeric variables were analyzed by Student’s t-test and analysis of variance, while non-normally distributed variables were analyzed by the Mann–Whitney U-test. Categorical variables are presented as percentages and were compared using the Chi-square (χ2) test. Pearson correlation coefficient analysis was used to explore the correlation between the TyG index and the GRACE risk score. Multivariate Cox regression analysis was used to test the predictive value of prognosis during follow-up. To construct the Cox model, univariate models for each of the predictor variables were run. Collinearity analysis was used to explore the variables significantly associated with MACEs, excluding those with a variance inflation factor (VIF) ≥ 5, and those variables that were significant (P < 0.05) in our univariate Cox models were then simultaneously entered into a multivariable Cox model. The hazard ratios (HRs) and 95% confidence intervals (CIs) were calculated. We used Kaplan–Meier analysis to calculate the cumulative incidence of long-term outcomes, with the Log rank test for comparisons between groups. P < 0.05 was considered significant. Receiver operating characteristic (ROC) curves were generated to analyze the prognostic value of risk factors. By comparing the ROC curve areas, the diagnostic effect was proved to be better. The reclassification improvement index (NRI) and the integrated discriminant improvement index (IDI) were used to analyze whether the TyG index combined with the GRACE risk score improved the diagnostic ability and clinical benefit compared with the single model.
Results
Baseline Clinical Characteristics of Patients
This study included 899 patients with T2DM and ACS who underwent primary PCI with a median follow-up of 23 months (range 1–36 months). The clinical, echocardiographic, and laboratory data of the study population are shown in Table 1. There was no statistically significant difference in the application of drugs among the four groups of patients except for SGLT2 drugs and α-glucosidase inhibitors. Patients in Group Q4 were significantly older, and in Group Q4, the GRACE risk score, TyG index, WBC count, neutrophil count, TC, TG, HbA1c, FBG, Creatinine, fibrinogen, NT-pro BNP and cardiac enzymes were higher, and there were more daily smokers and daily drinkers. In Group Q4, systolic blood pressure (SBP) (on admission), diastolic blood pressure (DBP)(on admission), LVEF was lower than in Group Q1.
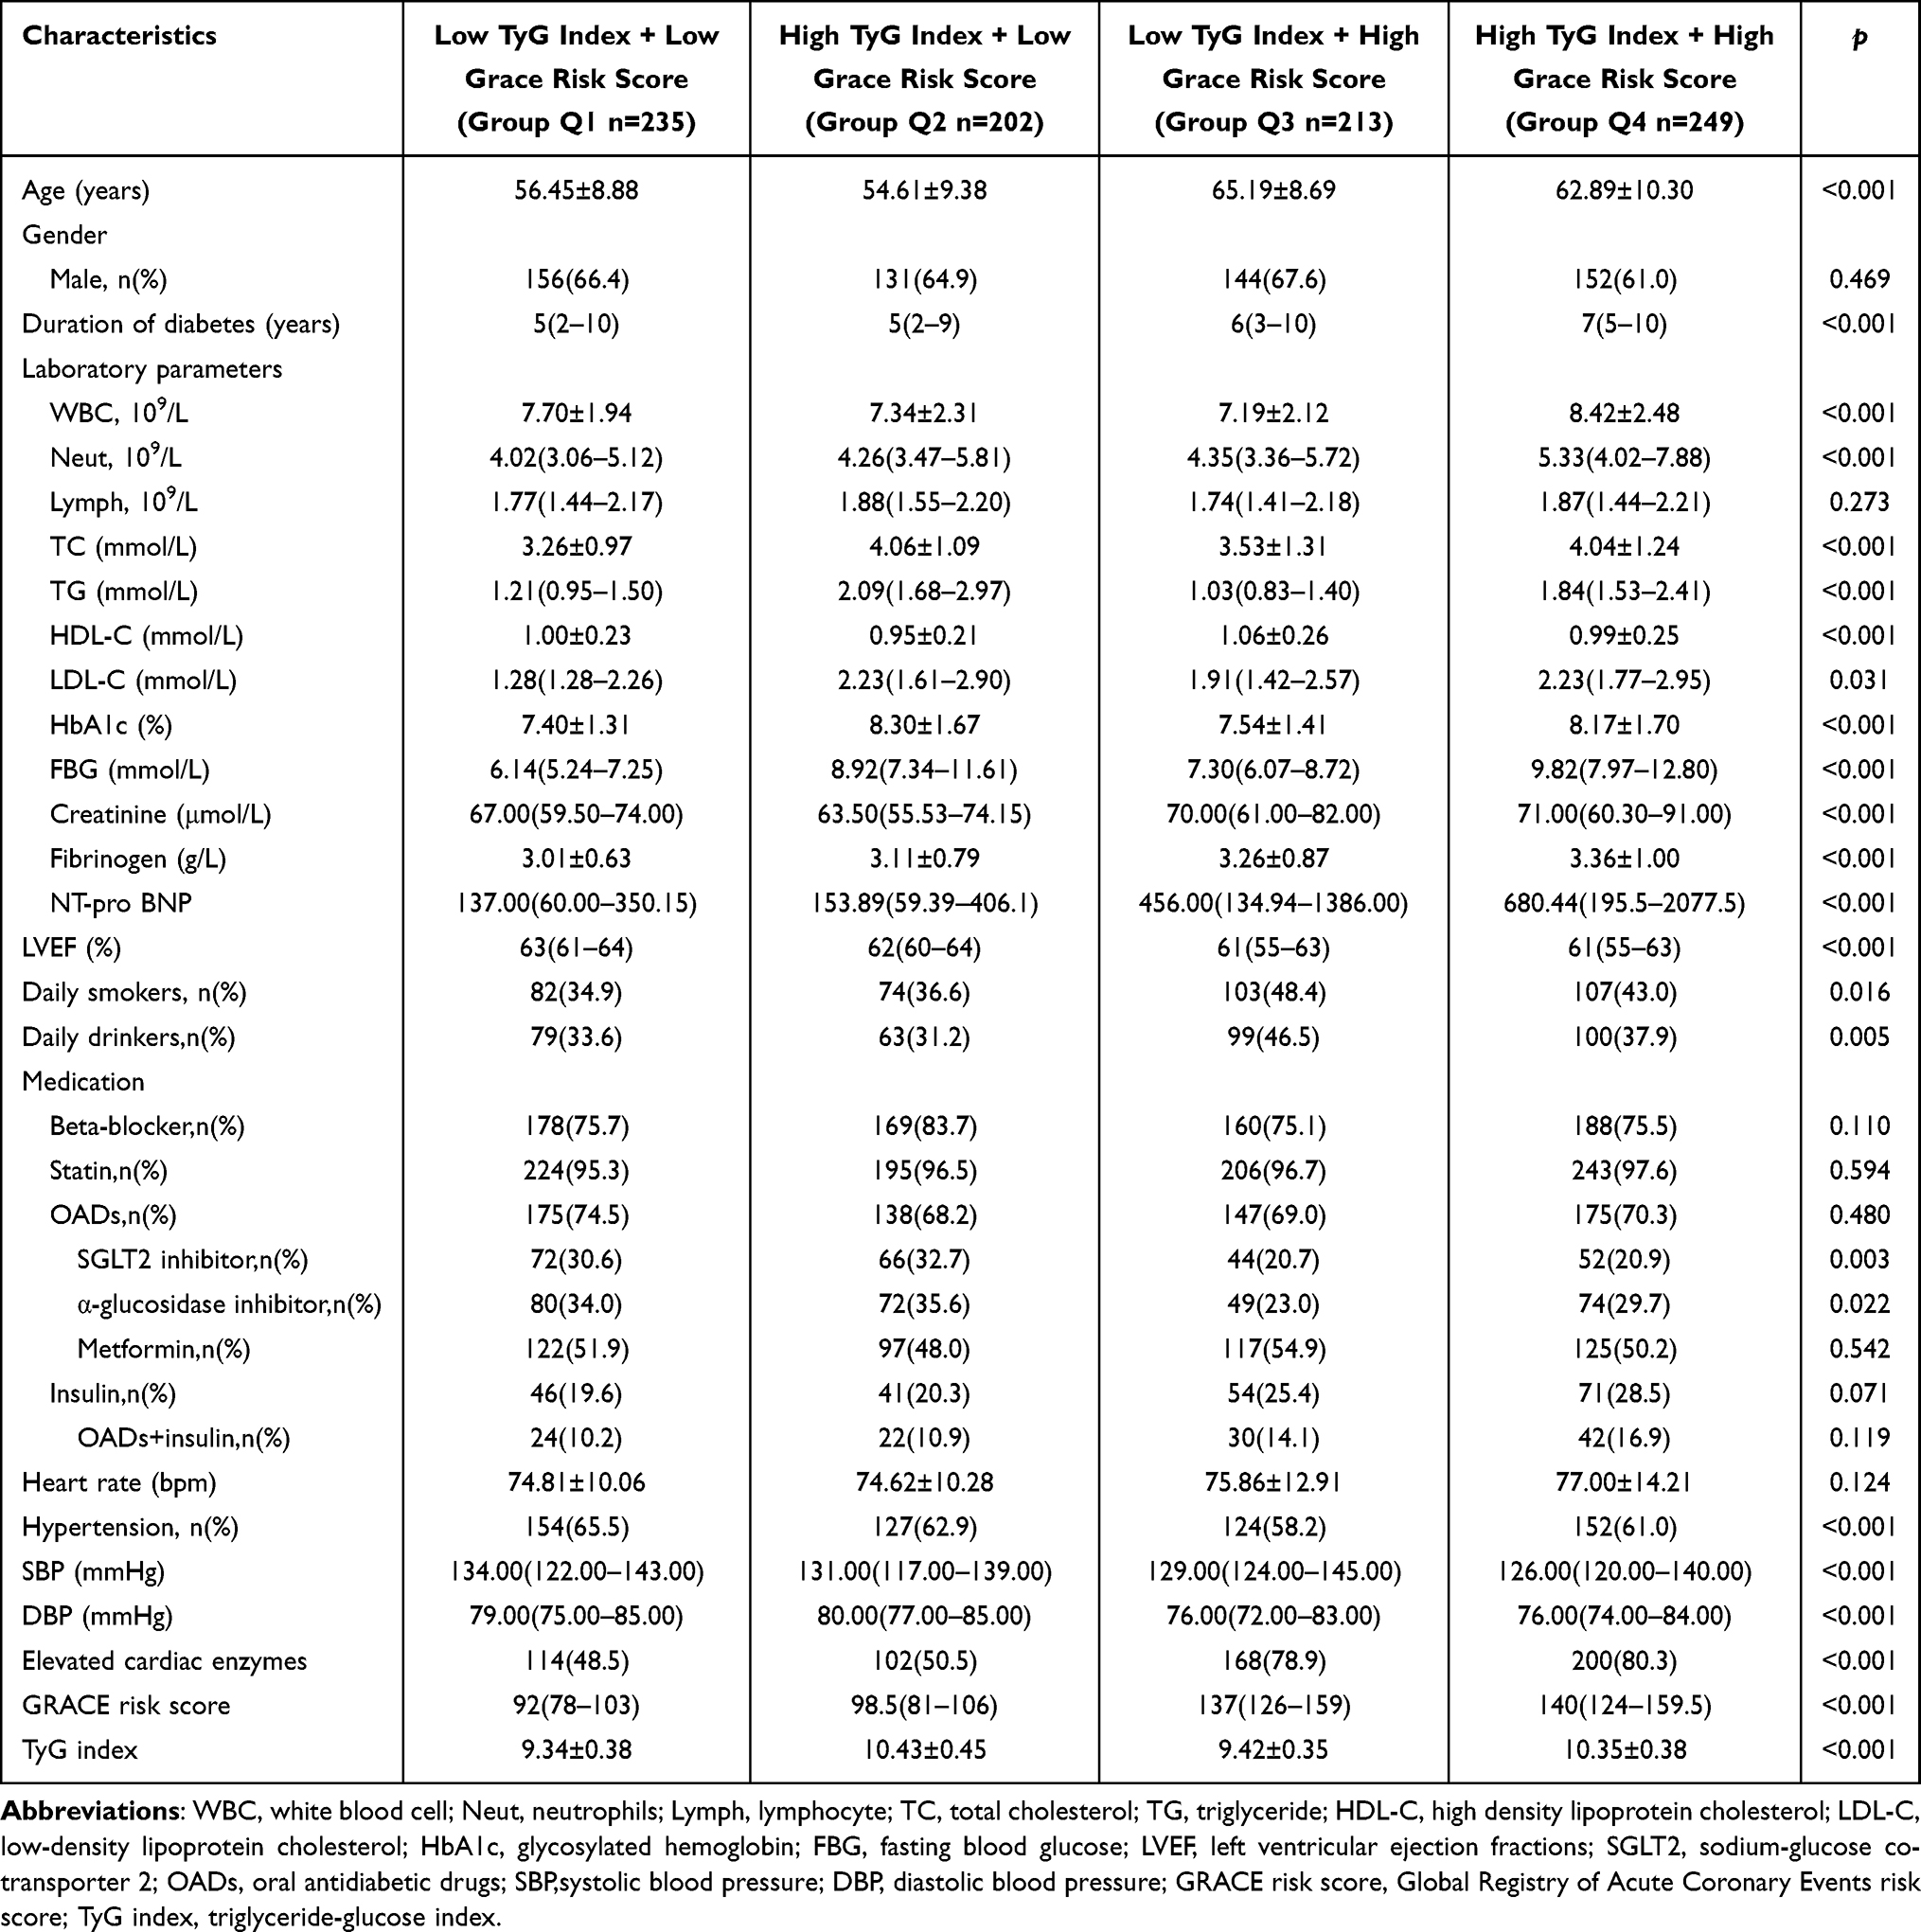 |
Table 1 Clinical and Laboratory Characteristics of Enrolled Patients According to the Expression of TyG Index and Grace Risk Score |
Clinical Characteristics of Patients with and without MACEs
In the present study, a total of 262 (29.14%) patients developed MACEs, as a composite endpoint including 44 cases of all-cause death (4.89%); 19 cases (2.11%) of malignant arrhythmia; 192 cases of re-hospitalization for angina pectoris (21.40%), of which 148 cases (16.46%) of target vessel reconstruction; and 28 cases (3.11%) of acute heart failure. Notably, Mace patients were older, had longer duration of diabetes, and had a higher proportion of hypertensive patients. Moreover, in the MACEs group, the WBC count, neutrophil count, TG, FBG, Creatinine, fibrinogen, NT-pro BNP, GRACE risk score, and TyG index were higher compared to the MACE-free group. In addition, the LVEF was lower in the MACE group, and the history of OAD + insulin use was shorter (Table 2).
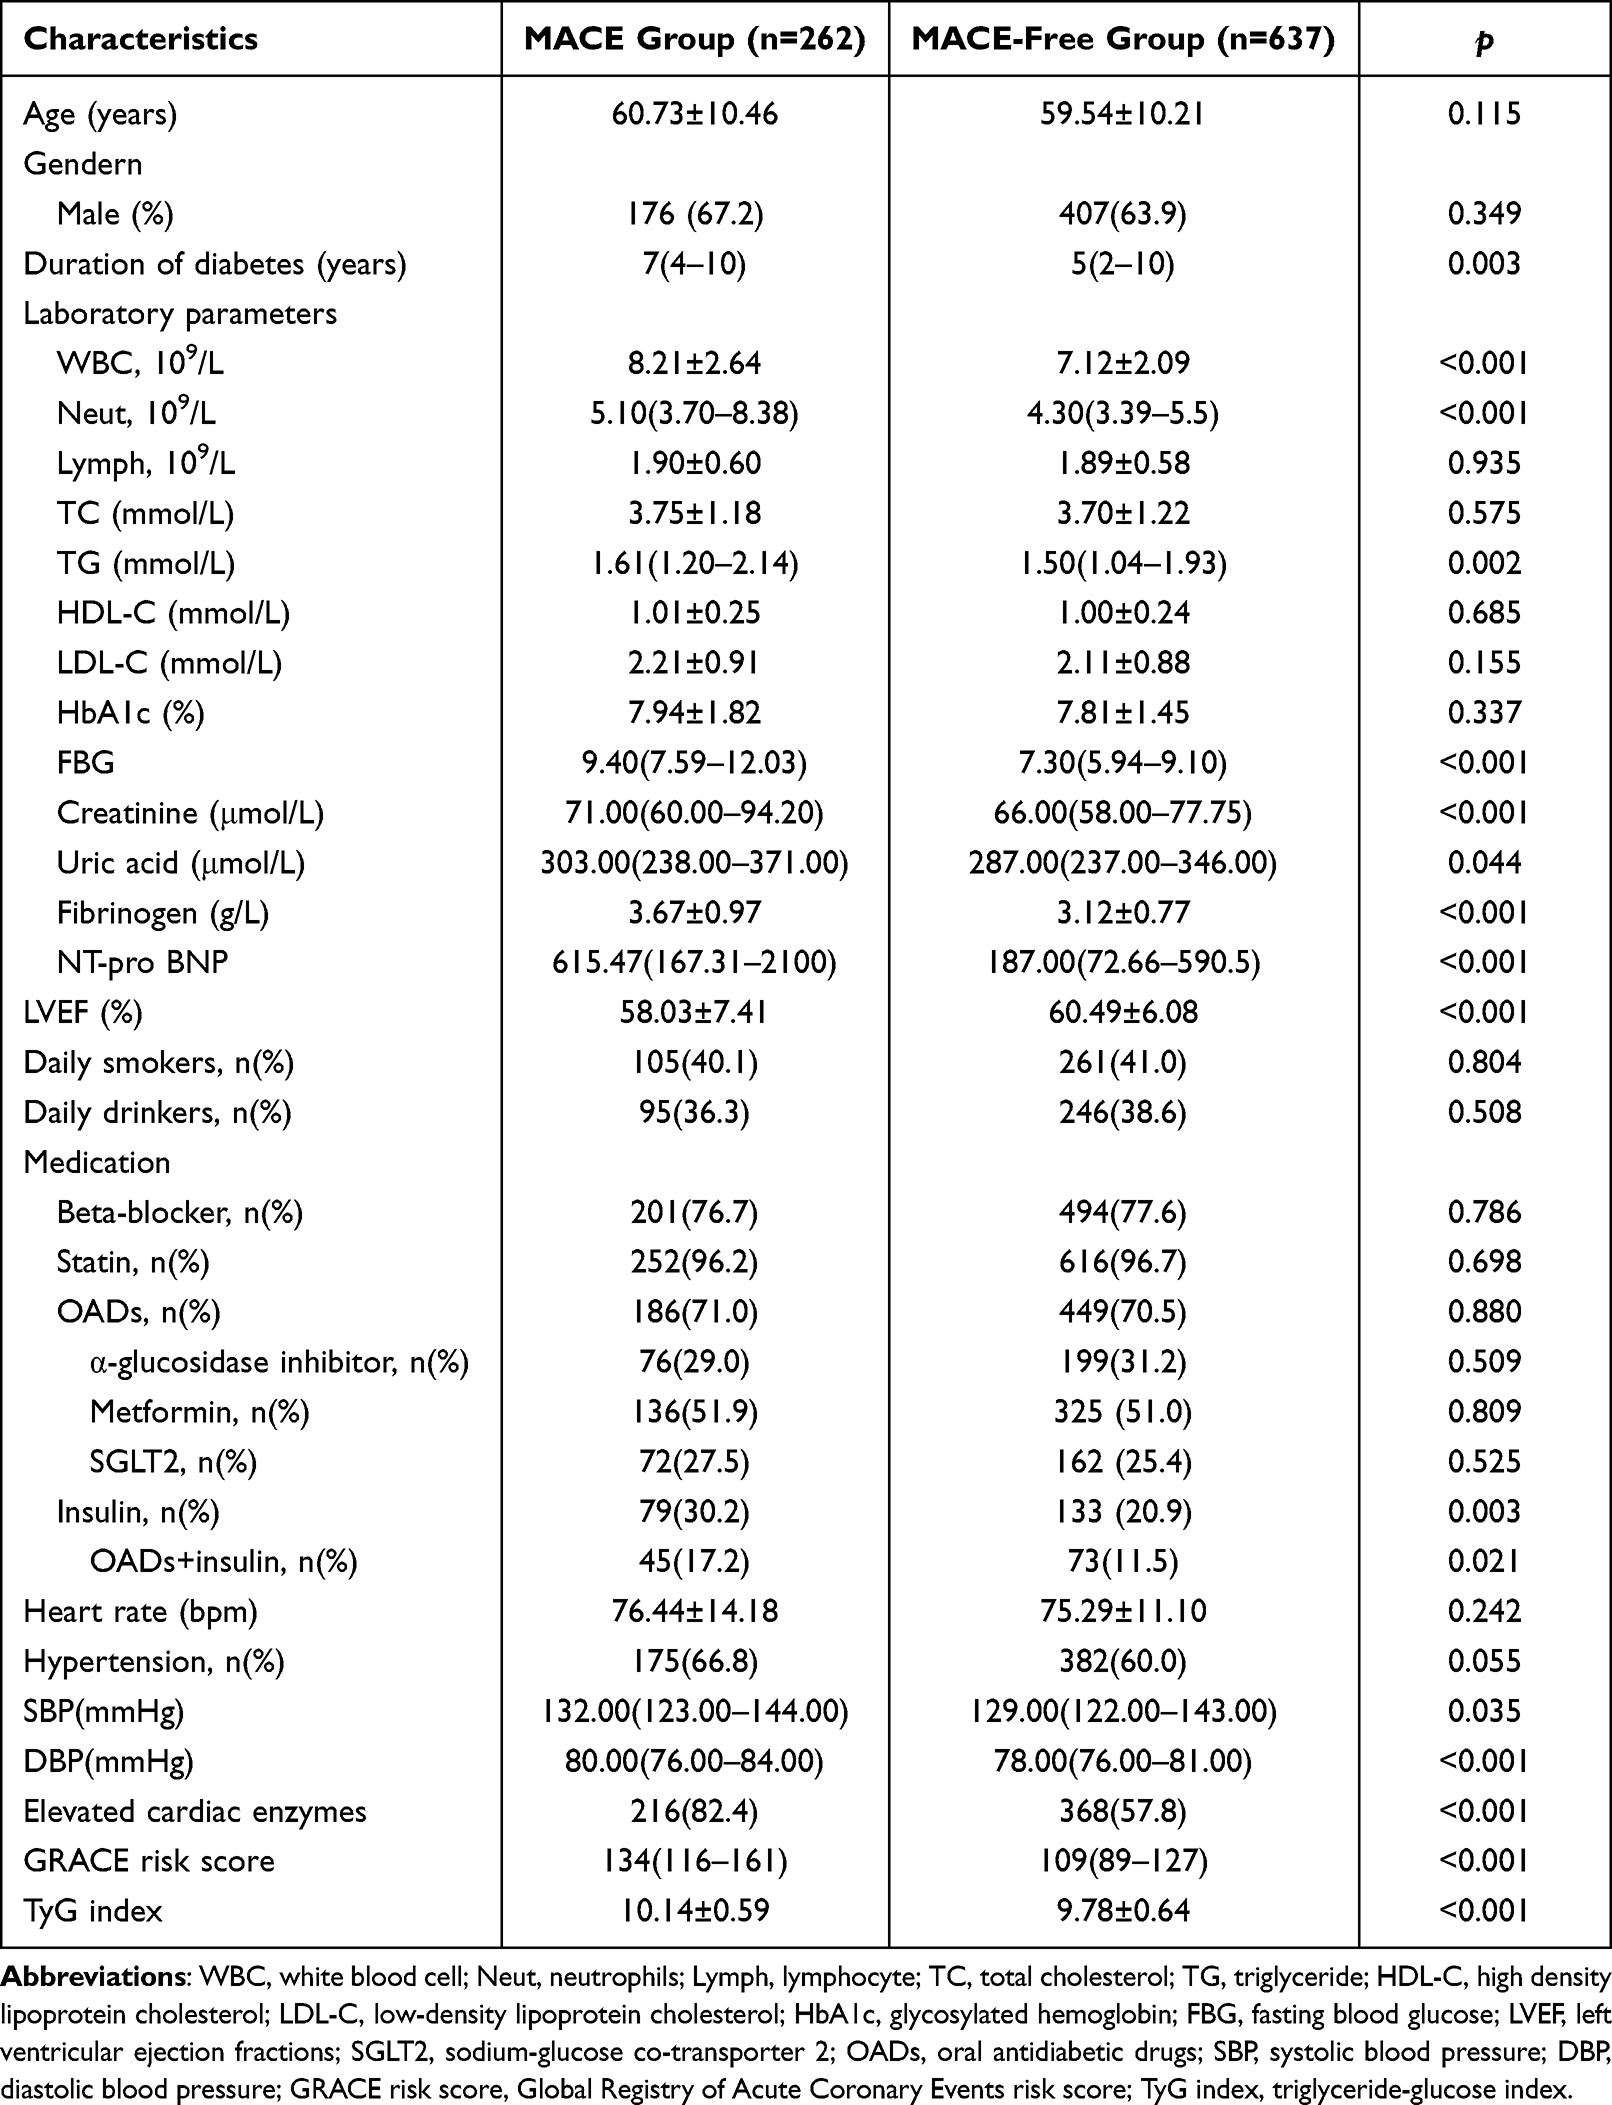 |
Table 2 Comparison of Clinical and Laboratory Characteristics of Enrolled Patients According to the Occurrence of MACEs |
Risk Factor Analysis for the Occurrence of MACEs
We aimed to identify independent predictors of MACEs. Cox proportional hazards analysis was used to construct model 1 and model 2 to predict the risk factors of MACE after primary PCI for T2DM patients with ACS (Table 3).
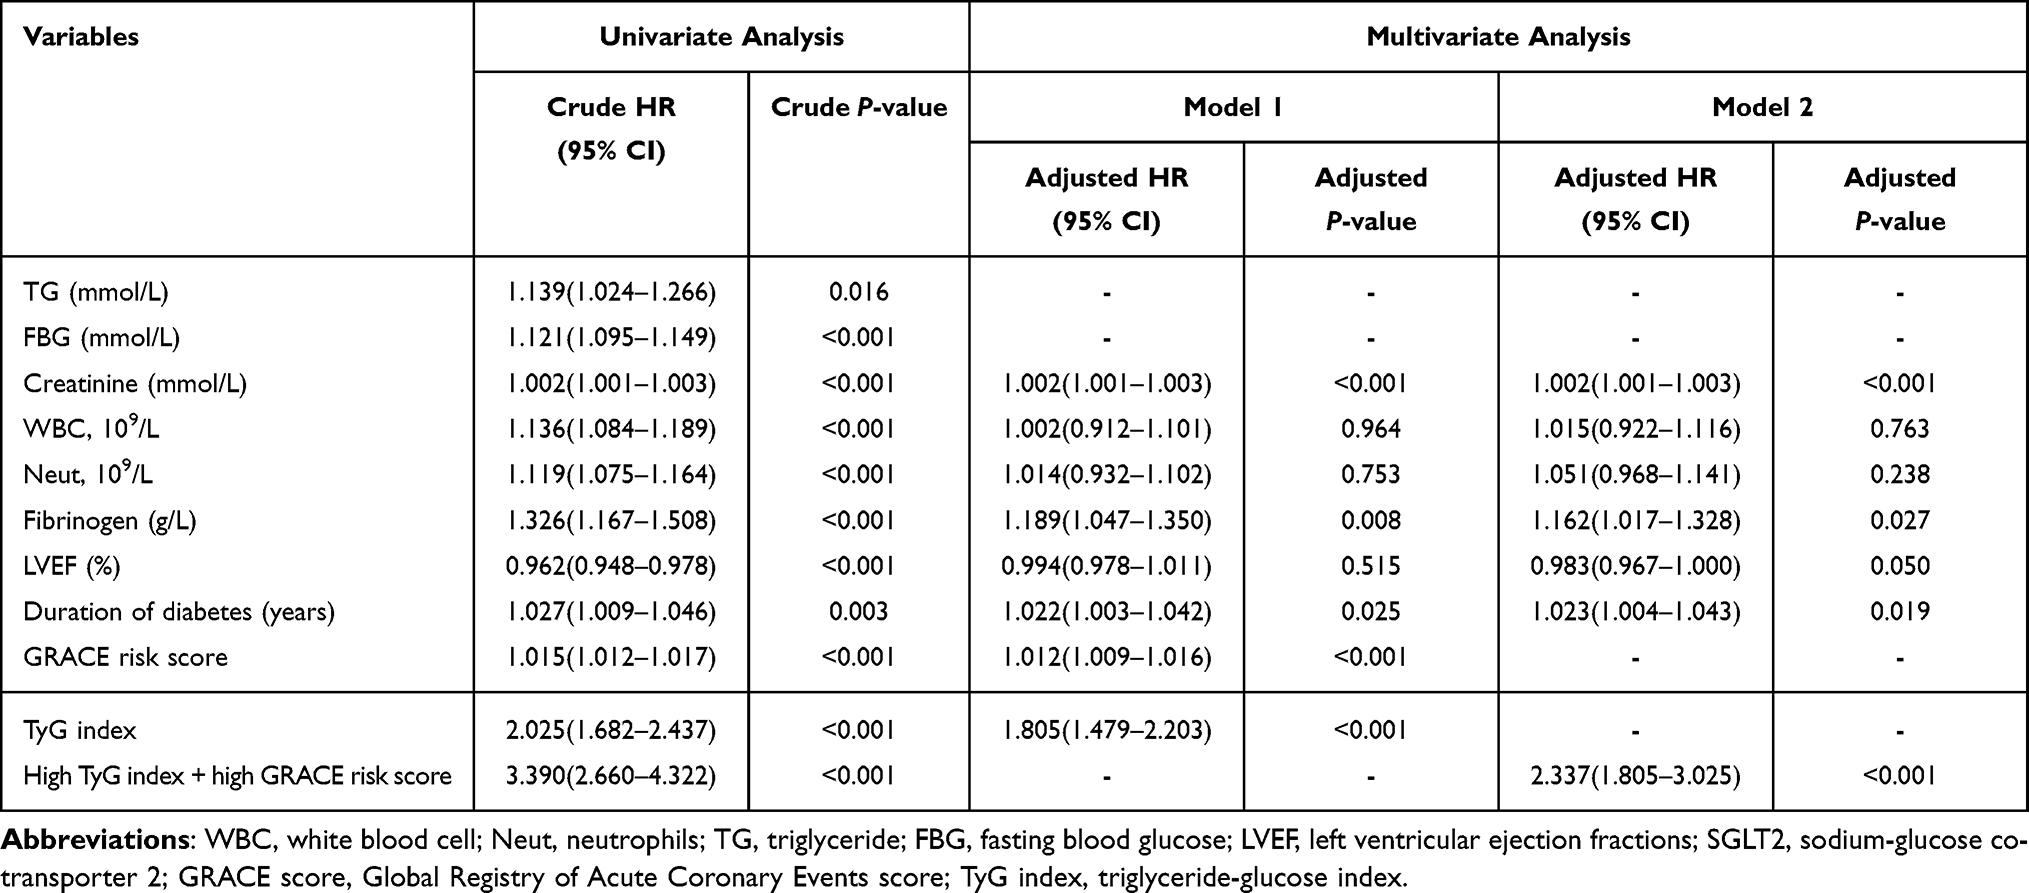 |
Table 3 Univariate and Multivariate Cox Regression Analysis Results for MACEs |
Univariate analysis showed that TG (HR: 1.139; 95% CI: 1.024–1.266, P = 0.016), FBG (HR: 1.121; 95% CI: 1.095–1.149, P < 0.001), Creatinine (HR: 1.002; 95% CI: 1.001–1.003, P < 0.001), WBC (HR: 1.136; 95% CI: 1.084–1.189, P < 0.001), neutrophil count (HR: 1.119; 95% CI: 1.075–1.164, P < 0.001), fibrinogen (HR: 1.326; 95% CI: 1.167–1.508, P < 0.001), LVEF (HR: 0.962; 95% CI: 0.948–0.978, P < 0.001), duration of diabetes (years) (HR: 1.027; 95% CI: 1.009–1.046, P = 0.003), GRACE risk score (HR: 1.015; 95% CI: 1.012–1.017, P < 0.001), TyG index (HR: 2.025; 95% CI: 1.682–2.437, P < 0.001), and high TyG index + high GRACE risk score (HR: 3.390; 95% CI: 2.660–4.322, P < 0.001) were independent risk factors for MACEs.
Collinearity analysis revealed that TG and FBG had collinearity (VIF≥5), and the rest collinearity analysis revealed no collinearity. After adjusting the covariates of Model 1, Creatinine (HR: 1.002; 95% CI: 1.001–1.003, P < 0.001), fibrinogen (HR: 1.189; 95% CI: 1.047–1.350, P = 0.008), duration of diabetes (years) (HR: 1.022; 95% CI: 1.003–1.042, P = 0.025), GRACE risk score (HR: 1.012; 95% CI: 1.009–1.016, P < 0.001), and TyG index (HR: 1.805; 95% CI: 1.479–2.203, P < 0.001) were significant independent predictors of MACEs.
Multivariate Cox analysis of Model 2 showed that Creatinine (HR: 1.002; 95% CI: 1.001–1.003, P = 0.001), fibrinogen (HR: 1.162; 95% CI: 1.017–1.328, P = 0.027), duration of diabetes (years) (HR: 1.023; 95% CI: 1.004–1.043, P = 0.019) and high TyG index + high GRACE risk score (HR: 2.337; 95% CI: 1.805–3.025, P < 0.001) were independent predictors of MACEs.
The long-term survival rate of patients was analyzed by Kaplan–Meier survival analysis. There were significant differences in 3-year MACEs among the four groups, as shown in Figure 2. The incidence of MACEs was higher in the high TyG index group (log rank, P < 0.001).
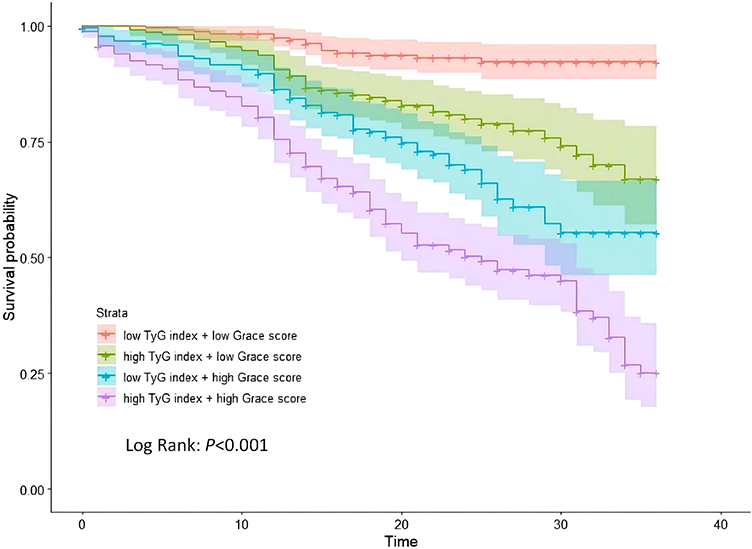 |
Figure 2 Kaplan–Meier survival curves of MACEs in patients with ACS complicated with T2DM undergoing PCI according to the levels of TyG index and GRACE risk score. Based on the the median GRACE risk score (Groups Q1 and Q2, GRACE risk score < 116; Groups Q3 and Q4, GRACE risk score ≥ 116) and TyG index (Groups Q1 and Q3, TyG index < 9.872; Groups Q2 and Q4, TyG index ≥ 9.872). |
Correlation Between the GRACE Risk Score and the TyG Index
Correlation counts between the GRACE risk score and the TyG index were performed by Pearson correlation analysis. The results showed a positive correlation between the GRACE risk score and the TyG index (R = 0.140, P <0.001).
Effect of the GRACE Risk Score and the TyG Index Combined on MACE Occurrence
To assess whether the TyG index and the GRACE risk score combined could improve the prediction of long-term CVD, ROC analysis was performed. ROC curve analysis showed that for the TyG index, the AUC was 0.670 (95% CI: 0.633–0.707, P < 0.001), for the GRACE risk score, the AUC was 0.712 (95% CI: 0.676–0.747, P < 0.001), and for the TyG index and the GRACE risk score combined, the AUC was 0.751 (95% CI: 0.718–0.784, P < 0.001) (Figure 3). In addition, the NRI of the TyG index and the GRACE risk score combined model calculated by the formula is 7.77% and 36.39%, and the IDI is 14.46% and 7.52%, respectively, compared with the TyG index model and the GRACE risk score model. All values > 0, indicating that the diagnostic accuracy of the joint model is improved.
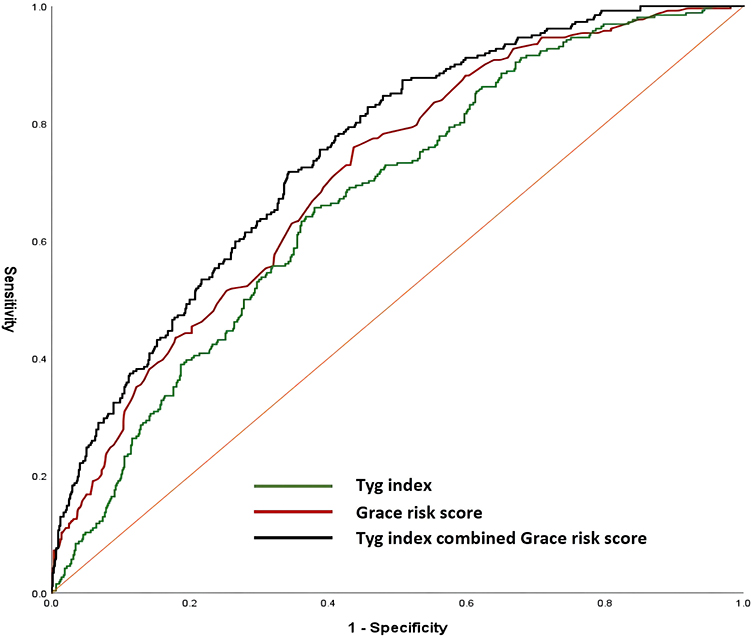 |
Figure 3 Receiver operating characteristic curves of TyG index, GRACE risk score, TyG index combined with GRACE risk score for 3-year MACEs prediction. |
Discussion
It has been estimated that the global prevalence of diabetes in 2021 was 10.5% (536.6 million people); this percentage is expected to rise to 12.2% (783.2 million) by 2045.13 As such, T2DM strongly affects the occurrence and development of ACS as well as patient prognosis. It has been acknowledged that the metabolic and inflammatory responses of patients with T2DM and ACS are significantly aggravated compared to those in patients with ACS alone.14 Thus, the management of ACS-T2DM patients should be improved based on risk stratification.
It has been verified that cardiovascular adverse events are closely related to IR, which is the main feature of T2DM, defined as a decreased efficiency of insulin to promote glucose uptake and utilization, and is a marker of metabolic disorders and systemic inflammation.15 IR is thought to develop from a coordinated interplay between various cellular stresses and stress responses, as a result of exposure of insulin-responsive cells to hypoxia, excess sugar, or certain types of fatty acids, environmental pollutants, or hormones released during stress and obesity. Studies have shown that IR is a key pathophysiological process in the early stage of atherosclerosis,16 which can directly stimulate the proliferation and migration of vascular smooth muscle cells to the intima, leading to endothelial dysfunction, and participate in the formation of fibrous caps.17
In recent years, it has been proposed that the TyG index, a simple surrogate estimate of IR, has been demonstrated to predict CVD morbidity and mortality in the general population and many patient cohorts. Li et al18 found that a high TyG index was associated with poor short-term prognosis in acute ischemic stroke patients undergoing reperfusion therapy. Guo et al19 found that the TyG index was positively correlated with the prognosis of patients with chronic heart failure and T2DM. The TyG index may be an effective predictor of cardiovascular outcomes in patients with acute myocardial infarction.20 We found that the TyG index could serve as a long-term predictor of the occurrence of MACEs in ACS patients with T2DM.
The use of the GRACE risk score is currently endorsed by the latest clinical guidelines for risk stratification of patients with ACS.11,21 The GRACE risk score was developed from the GRACE Registry from 1999 to 2001 to assess the risk of ACS-related in-hospital mortality.22 The score has been validated in multinational ACS cohorts, but then it was originally developed to predict relatively short-term prognosis; for long-term outcome validation, it remains inadequate, with studies showing decreased predictive values of elegant risk scores when long-term cardiovascular risk prediction is performed.23 We found that the GRACE risk score could serve as a long-term predictor of the occurrence of MACEs in ACS patients with T2DM.
However, it has been reported recently that the incorporation of the TyG index into the baseline risk model can significantly improve the prediction of MACEs in ACS patients.24 At the same time, the GRACE risk score is a limited index.25 The included variables are few and only reflect some pathophysiological dimensions related to the prognosis of ACS, such as NT-pro BNP, and other indicators that are closely related to the prognosis of heart failure are not included.26 Along with the application of new stents and balloons and noval drugs such as ticagrelor, the application of PCI surgery in developing countries, the proportion of hyperlipidemia, and changes in the age of and prevalence of diabetes in the population, the evaluative GRACE risk score of the year was included in the ACS cohort. The ACS cohort combined index has become a new research direction.27 The GRACE risk score is a valid predictor of cardiovascular events in patients with ACS. Previous studies have shown that the predictive value of cardiovascular events is enhanced when the GRACE risk score is combined with other potential risk factors for ACS, such as the neutrophil to lymphocyte ratio or monocyte to high-density lipoprotein cholesterol ratio.28,29 In the present study, we incorporated the TyG index into the GRACE risk score model to verify the predictive effect for MACEs in ACS patients with T2DM undergoing PCI. It has been revealed that the TyG index at baseline was significantly and positively associated with the GRACE risk score. Patients with higher TyG index together with higher GRACE risk score could occur the MACEs more frequently and easily. Thus, the combination of these two markers can be superior predictor for the long-term outcome of post-PCI T2DM patients with ACS.
Limitation
Our present study still has several limitations. Firstly, TyG index was calculated based on the number of FBG and TG, which were detected from the collecting blood samples in the morning fasting time ≥ 8 hours. Since the study was designed as one retrospective study, it was not possible to evaluate the change of the TyG index according to the progression of ACS and T2DM. Secondly, the study was observed in single clinical center and the number of patients in the cohort was relatively small. We only observed the ACS patients complicated with T2DM undergoing PCI, part of ACS patients with T2DM would need CABG surgery therapy, a much more complex and comprehensive study is needed to evaluate the different therapies for ACS patients with T2DM in the future. Thirdly, ACS includes the disease of myocardial infarction and unstable angina, we would further perform sub-group analysis as different types of ACS complicated with T2DM. What’s more, the findings of present study need to be verified by multi-center large-cohort clinical validation study and better to be verified in other ethnic groups except from Chinese.
Conclusion
In this study, it could be found that the GRACE risk score and the TyG index in ACS patients with T2DM undergoing PCI could be applied to predict the occurrence of MACEs. The TyG index was positively related to the GRACE risk score. A combination of the GRACE risk score and the TyG index may enhance the predictive value for clinical outcomes in these patients.
Data Sharing Statement
Unless there are legal or ethical reasons not to do so, datasets will be provided from corresponding authors upon request in accordance with the original ethics and approval of relevant government authorities. For ethical and moral reasons, the data are not made public.
Acknowledgments
This work was supported by the National Natural Science Foundation of China (Nos. 82222007, 82170281, and U2004203), the Henan Thousand Talents Program (No. ZYQR201912131), and the Excellent Youth Science Foundation of Henan Province (No. 202300410362), Central Plains Youth Top Talent, Advanced funds (No. 2021-CCA-ACCESS-125).
Disclosure
The authors declare that they have no potential conflicts of interest for this work.
References
1. Roth GA, Mensah GA, Johnson CO, et al. Global burden of cardiovascular diseases and risk factors, 1990–2019: update from the GBD 2019 study. J Am Coll Cardiol. 2020;76(25):2982–3021. doi:10.1016/j.jacc.2020.11.010
2. Smith JN, Negrelli JM, Manek MB, Hawes EM, Viera AJ. Diagnosis and management of acute coronary syndrome: an evidence-based update. J Am Board Fam Med. 2015;28(2):283–293. doi:10.3122/jabfm.2015.02.140189
3. Einarson TR, Acs A, Ludwig C, Panton UH. Prevalence of cardiovascular disease in type 2 diabetes: a systematic literature review of scientific evidence from across the world in 2007–2017. Cardiovasc Diabetol. 2018;17(1):83. doi:10.1186/s12933-018-0728-6
4. Naito R, Miyauchi K. Coronary Artery Disease and Type 2 Diabetes Mellitus. Int Heart J. 2017;58(4):475–480. doi:10.1536/ihj.17-191
5. Poznyak A, Grechko AV, Poggio P, Myasoedova VA, Alfieri V, Orekhov AN. The Diabetes Mellitus-Atherosclerosis Connection: the Role of Lipid and Glucose Metabolism and Chronic Inflammation. Int J Mol Sci. 2020;21:5. doi:10.3390/ijms21051835
6. Mirr M, Skrypnik D, Bogdański P, Owecki M. Newly proposed insulin resistance indexes called TyG-NC and TyG-NHtR show efficacy in diagnosing the metabolic syndrome. J Endocrinol Invest. 2021;44(12):2831–2843. doi:10.1007/s40618-021-01608-2
7. Zhao Q, Zhang TY, Cheng YJ, et al. Triglyceride-glucose index as a surrogate marker of insulin resistance for predicting cardiovascular outcomes in nondiabetic patients with non-ST-segment elevation acute coronary syndrome undergoing percutaneous coronary intervention. J Atheroscler Thromb. 2021;28(11):1175–1194. doi:10.5551/jat.59840
8. Guo Q, Feng X, Zhang B, et al. Influence of the Triglyceride-Glucose Index on Adverse Cardiovascular and Cerebrovascular Events in Prediabetic Patients With Acute Coronary Syndrome. Front Endocrinol (Lausanne). 2022;13:843072. doi:10.3389/fendo.2022.843072
9. Ascenzo F, Biondi-Zoccai G, Moretti C, et al. TIMI, GRACE and alternative risk scores in acute coronary syndromes: a meta-analysis of 40 derivation studies on 216,552 patients and of 42 validation studies on 31,625 patients. Contemp Clin Trials. 2012;33(3):507–514. doi:10.1016/j.cct.2012.01.001
10. Lu PJ, Gong XW, Liu Y, et al. Optimization of GRACE risk stratification by N-terminal pro-B-type natriuretic peptide combined with D-dimer in patients with non-ST-elevation myocardial infarction. Am J Cardiol. 2021;140:13–19. doi:10.1016/j.amjcard.2020.10.050
11. Levine GN, Bates ER, Bittl JA, et al. 2016 ACC/AHA guideline focused update on duration of dual antiplatelet therapy in patients with coronary artery disease: a report of the American College of Cardiology/American heart association task force on clinical practice guidelines. Circulation. 2016;134(10):e123–55. doi:10.1161/CIR.0000000000000404
12. Cefalu WT, Berg EG, Saraco M, Petersen MP, Uelmen S, Robinson S. Classification and diagnosis of diabetes: standards of medical care in diabetes-2018. Diabetes Care. 2018;41(Suppl1):S13–S27. doi:10.2337/dc18-S002
13. Cho NH, Shaw JE, Karuranga S, et al. IDF Diabetes Atlas: global estimates of diabetes prevalence for 2017 and projections for 2045. Diabetes Res Clin Pract. 2018;138:271–281. doi:10.1016/j.diabres.2018.02.023
14. Wang XL, Zhang W, Li Z, et al. Vascular damage effect of circulating microparticles in patients with ACS is aggravated by type 2 diabetes. Mol Med Rep. 2021;23:6. doi:10.3892/mmr.2021.12113
15. Yaribeygi H, Farrokhi FR, Butler AE, Sahebkar A. Insulin resistance: review of the underlying molecular mechanisms. J Cell Physiol. 2019;234(6):8152–8161. doi:10.1002/jcp.27603
16. Galicia-Garcia U, Benito-Vicente A, Jebari S, et al. Pathophysiology of type 2 diabetes mellitus. Int J Mol Sci. 2020;21:17. doi:10.3390/ijms21176275
17. Beneit N, Martín-Ventura JL, Rubio-Longás C, et al. Potential role of insulin receptor isoforms and IGF receptors in plaque instability of human and experimental atherosclerosis. Cardiovasc Diabetol. 2018;17(1):31. doi:10.1186/s12933-018-0675-2
18. Lee M, Kim CH, Kim Y, et al. High triglyceride glucose index is associated with poor outcomes in ischemic stroke patients after reperfusion therapy. Cerebrovasc Dis. 2021;50(6):691–699. doi:10.1159/000516950
19. Guo W, Zhao L, Mo F, et al. The prognostic value of the triglyceride glucose index in patients with chronic heart failure and type 2 diabetes: a retrospective cohort study. Diabetes Res Clin Pract. 2021;177:108786. doi:10.1016/j.diabres.2021.108786
20. Zhang Y, Ding X, Hua B, et al. High triglyceride-glucose index is associated with adverse cardiovascular outcomes in patients with acute myocardial infarction. Nutr Metab Cardiovasc Dis. 2020;30(12):2351–2362. doi:10.1016/j.numecd.2020.07.041
21. Roffi M, Patrono C, Collet JP, et al. 2015 ESC guidelines for the management of acute coronary syndromes in patients presenting without persistent ST-segment elevation: task force for the management of acute coronary syndromes in patients presenting without persistent ST-segment elevation of the European Society of Cardiology (ESC). Eur Heart J. 2016;37(3):267–315. doi:10.1093/eurheartj/ehv320
22. Fox KA, Eagle KA, Gore JM, Steg PG, Anderson FA. The Global Registry of Acute Coronary Events, 1999 to 2009–GRACE. Heart. 2010;96(14):1095–1101. doi:10.1136/hrt.2009.190827
23. Chen X, Shao M, Zhang T, et al. Prognostic value of the combination of GRACE risk score and mean platelet volume to lymphocyte count ratio in patients with ST-segment elevation myocardial infarction after percutaneous coronary intervention. Exp Ther Med. 2020;19(6):3664–3674. doi:10.3892/etm.2020.8626
24. Wang L, Cong HL, Zhang JX, et al. Triglyceride-glucose index predicts adverse cardiovascular events in patients with diabetes and acute coronary syndrome. Cardiovasc Diabetol. 2020;19(1):80. doi:10.1186/s12933-020-01054-z
25. Fox KA, Fitzgerald G, Puymirat E, et al. Should patients with acute coronary disease be stratified for management according to their risk? Derivation, external validation and outcomes using the updated GRACE risk score. BMJ Open. 2014;4(2):e004425. doi:10.1136/bmjopen-2013-004425
26. Carvalho L, Bogniotti L, de Almeida O, et al. Change of BNP between admission and discharge after ST-elevation myocardial infarction (Killip I) improves risk prediction of heart failure, death, and recurrent myocardial infarction compared to single isolated measurement in addition to the GRACE score. Eur Heart J Acute Cardiovasc Care. 2019;8(7):643–651. doi:10.1177/2048872617753049
27. Kawai T, Nakatani D, Yamada T, et al. Clinical impact of estimated plasma volume status and its additive effect with the GRACE risk score on in-hospital and long-term mortality for acute myocardial infarction. Int J Cardiol Heart Vasc. 2021;33:100748. doi:10.1016/j.ijcha.2021.100748
28. Ma X, Han K, Yang L, et al. Adjustment of the GRACE risk score by monocyte to high-density lipoprotein ratio improves prediction of adverse cardiovascular outcomes in patients with acute coronary syndrome undergoing percutaneous coronary intervention. Front Cardiovasc Med. 2021;8:755806. doi:10.3389/fcvm.2021.755806
29. Öncel CR. Value of neutrophil-to-lymphocyte ratio and its combination with GRACE risk score in predicting PCI outcomes in acute coronary syndrome. Anatol J Cardiol. 2016;16(6):452. doi:10.14744/AnatolJCardiol.2016.6989
 © 2022 The Author(s). This work is published and licensed by Dove Medical Press Limited. The full terms of this license are available at https://www.dovepress.com/terms.php and incorporate the Creative Commons Attribution - Non Commercial (unported, v3.0) License.
By accessing the work you hereby accept the Terms. Non-commercial uses of the work are permitted without any further permission from Dove Medical Press Limited, provided the work is properly attributed. For permission for commercial use of this work, please see paragraphs 4.2 and 5 of our Terms.
© 2022 The Author(s). This work is published and licensed by Dove Medical Press Limited. The full terms of this license are available at https://www.dovepress.com/terms.php and incorporate the Creative Commons Attribution - Non Commercial (unported, v3.0) License.
By accessing the work you hereby accept the Terms. Non-commercial uses of the work are permitted without any further permission from Dove Medical Press Limited, provided the work is properly attributed. For permission for commercial use of this work, please see paragraphs 4.2 and 5 of our Terms.