")
Back to Journals » International Journal of Nanomedicine » Volume 16
Combination of Chemotherapy and Photodynamic Therapy with Oxygen Self-Supply in the Form of Mutual Assistance for Cancer Therapy
Authors Chen Y, Zhang L, Li F , Sheng J, Xu C, Li D, Yu H, Liu W
Received 31 December 2020
Accepted for publication 19 April 2021
Published 28 May 2021 Volume 2021:16 Pages 3679—3694
DOI https://doi.org/10.2147/IJN.S298146
Checked for plagiarism Yes
Review by Single anonymous peer review
Peer reviewer comments 3
Editor who approved publication: Dr Ebrahim Mostafavi
Ying Chen,1– 3 Lei Zhang,1– 3 Fangxuan Li,4 Jindong Sheng,1 Changxiao Xu,1 Dan Li,1 Hu Yu,1 Wenxin Liu1
1Department of Gynecologic Oncology, Tianjin Medical University Cancer Institute and Hospital, Tianjin, 300060, People’s Republic of China; 2Tianjin’s Clinical Research Center for Cancer, Key Laboratory of Cancer Prevention and Therapy, Tianjin, 300060; 3National Clinical Research Centre of Cancer, Tianjin, 300060, People’s Republic of China; 4Department of Cancer Prevention, Tianjin Medical University Cancer Institute and Hospital, Tianjin, 300060, People’s Republic of China
Correspondence: Ying Chen
Department of Gynecologic Oncology, Tianjin Medical University Cancer Institute and Hospital, Huanhuxi Road, Hexi District, Tianjin, 300060, People’s Republic of China
Email [email protected]
Introduction: Photodynamic therapy (PDT) has been widely researched by cancer therapists in recent years. This study aims to establish a drug delivery system combining PDT and chemotherapy to show that chemotherapeutic drugs provide oxygen to PDT, while PDT promotes the release of chemotherapeutic drug.
Methods: Firstly, poly(ethylene glycol)-lysine(Ce6)-block-poly(L-glutamate)-imidazole (mPEG-lys(Ce6)-PGA-AIM) was synthesized and self-assembled into micelles that exhibited pH- and ROS-responsiveness and buffering capacity. Perfluorohexanoate-modified cisplatin (FCP), as oxygen carriers, was encapsulated into mPEG-lys(Ce6)-PGA-AIM micelles. Then, the properties of micelles and their biological functions in vivo and in vitro were investigated.
Results: The micelles exhibited remarkabe stability, pH regulated drug release, good biocompatibility and effective tumor penetration. Cellular uptake demonstrated the efficient endosome/lysosome escape of CFMs, which facilitates the intracellular drug release. Both in vitro and in vivo experiments reflected that CFMs with laser irradiation showed significantly improved therapeutic activity compared with single PDT or chemotherapy.
Conclusion: Chemotherapy and PDT were combined in the form of mutual assistance to provide a promising strategy for clinical treatment.
Keywords: chemotherapy, photodynamic therapy, dual-responsiveness, oxygen carriers
Introduction
Photodynamic therapy (PDT) has been widely researched by cancer therapists in recent years. Photosensitizers absorb energy from the laser and convert oxygen into cytotoxic reactive oxygen species (ROS) to kill cancer cells.1,2 The main advantages of PDT are the ability to control the exposure area and duration of light to maximize the therapeutic effect and reduce damage to normal tissues, especially compared with conventional strategies, such as chemotherapy. However, the effectiveness of PDT is largely limited by the amount of oxygen in solid tumors.3–5 The situation becomes worse after PDT consumes oxygen, which aggravates the hypoxia of the tumor and causes PDT to eventually lose its effect.
In view of tumor hypoxia, some strategies have been developed, such as hyperbaric oxygen inhalation or multiple step-by-step irradiations of light.6 Besides, another strategy has been developed to alleviate the hypoxic environment of tumors based on oxygen generating materials. As reported, catalase-integrated HA-CAT@aCe6 NPs have been successfully developed to reduce hypoxia to ensure high efficacy of PDT in vitro and in vivo.7 Intelligent MnO2 nanosheets anchored with upconversion nanoprobes have also been designed for the concurrent stimuli-responsive imaging/therapy of solid tumors by overcoming hypoxia.8 Besides, recent studies have shown that perfluorocarbons (PFCs), as oxygen tanks, are capable of enriching high levels of oxygen because of the weak molecular cohesion in PFC, thus facilitating the insertion of O2 molecules.9 However, PFCs usually need to be formulated into emulsions and exhibit rapid release of oxygen.10 Against these defects of PFCs, PEGylated fluorinated poly (β-amino ester)s (PF-PEG) was synthesized, based on which a multifunctional nanoplatform with large oxygen-carrying capacity was established for enhanced PDT therapy.11
In addition to relieving tumor hypoxia, numerous research work has been devoted to the combination of chemotherapy and PDT, and great progress has been made. ROS-sensitive thioketal-linked polyphosphoester-doxorubicin (DOX) conjugate has been prepared for precisely photo-triggered locoregional chemotherapy.12 Under irradiation of light, thioketal linkage was cut off by generated ROS and the conjugated DOX was released to facilitate the chemotherapy. A cisplatin drug delivery system with near-infrared light-stimuli drug release property was developed by encapsulating cisplatin and Indocyanine Green (ICG) in the novel tellurium-containing polymer (PEG-PUTe-PEG) based nanoparticles.13 Tellurium is easily oxidized by ROS under the stimulation of a near-infrared laser at the tumor site and thus cisplatin could be rapidly released from the nanocarriers with the oxidation. Furthermore, dual-responsive polymeric micelles have been prepared for enhanced combined delivery of doxorubicin and zinc (II) phthalocyanine in a tumor-bearing mice model.14 Upon laser irradiation and the reduction of glutathione (GSH), the hydrophobic segments of micelles became hydrophilic, leading to micelle disassembly and cargo release. In these studies, PDT was responsible for promoting the release of chemotherapeutic drugs in different ways to achieve better anti-tumor effects. However, what can chemotherapy do for PDT?
In our research, we aim to establish a drug delivery system combining PDT and chemotherapy to show that chemotherapeutic drugs provide oxygen to PDT, while PDT promotes the release of chemotherapeutic drugs. Firstly, mPEG-lys(Ce6)-PGA-AIM was synthesized to contain imidazoles that provide cross-linking sites with Zn2+ and proton sponge effects which considered that nanocarriers containing imidazole can improve cellular uptake and rapid endosomal escape.15 More importantly, imidazoles, as the hydrophobic segments, could be oxidized by ROS, which promoted micelle disassembly and achieved fast drug release.16 Secondly, perfluorohexanoic acid modified cisplatin (FCP) was synthesized as the chemotherapeutic prodrug and oxygen generation materials. Finally, FCP was loaded into mPEG-lys(Ce6)-PGA-AIM micelles and Zn2+ was added to form core cross-linked FCP-loaded micelles (CFMs). As demonstrated in Figure 1, the cross-linkage stabilized micelles in the process of blood circulation and avoided the premature release of the drug. Negative surface charge of these micelles could reduce the protein adsorption and avoid capture by the reticuloendothelial system (RES). Due to the enhanced permeability and retention (EPR) effect, these micelles would accumulate in tumor tissue, where the negative surface charge would be converted to positive surface charge in the weakly acidic environment of tumor tissue. After CFMs were internalized into tumor cells, imidazoles began protonation, promoting the endosome/lysosome escape. Meanwhile, conjugated Ce6 would generate ROS under laser irradiation with the aid of oxygen. These generated ROS further induced the imidazole-urea transformation and changed the hydrophobicity/hydrophilicity balance to achieve a rapid release of FCP. Finally, generated ROS and FCP jointly inhibit tumor growth.
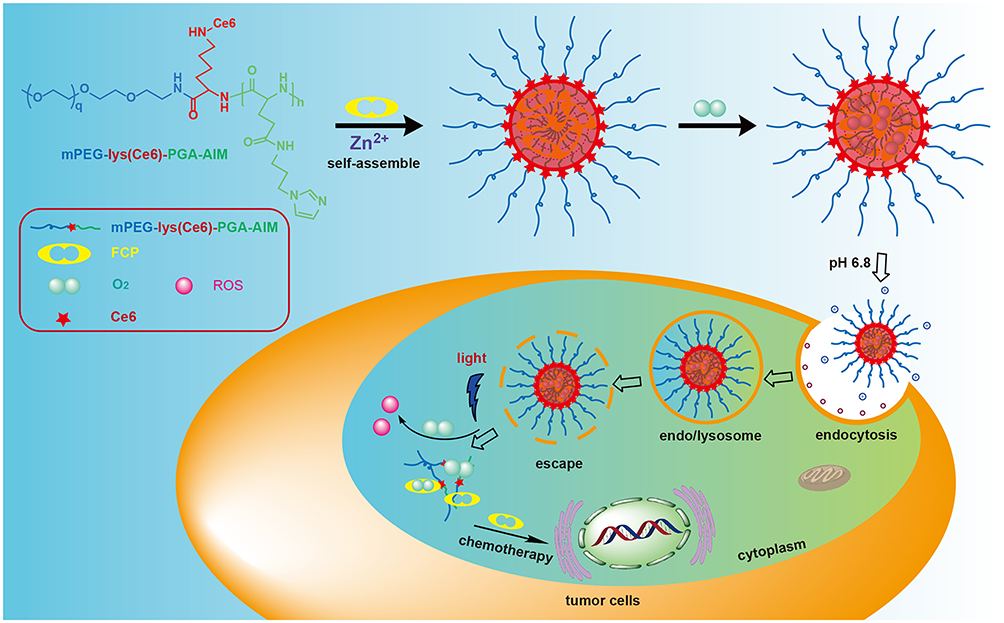 |
Figure 1 The chemical structure of mPEg-Lys (Ce6)-PGA-AIM and the mechanism of drug delivery system combining chemotherapy and PDT. |
Materials and Methods
Materials
Methoxy (polyethylene glycol) amine (mPEG-NH2, MW 5000), Fmoc-lys(Boc)-OH, 5-benzyl-L-glutamate (BLG) and 2-hydroxypyridine (2-HP) were bought from Shanghai McLean biochemical Technology Co., Ltd. N, N’-Dicyclohexylcarbodiimide (DCC), N-hydroxysuccinimide (NHS) and trifluoroacetic acid (TFA) were purchased from Energy Chemical. 1-(3-Aminopropyl) imidazole (AIM), hexanoic anhydride (HA) and perfluorohexanoic anhydride (PHA) were bought from Mayer Chemical Technology (Shanghai, China). Chlorine e6 (Ce6) and cisplatin were obtained from Sigma-Aldrich. Diethylamine (DEA) and triphosgene were bought from Aladdin Biochemical Technology (Shanghai, China). All solvents, including dichloromethane (DCM), diethyl ether, triethylamine (TEA) and N, N-dimethylformamide (DMF) were bought from General-reagent. SKOV3 cells were purchased from Procell (Wuhan, China).
Synthesis of mPEG-Lys (Boc/Fmoc)
Before synthesis of mPEG-lys (Boc/Fmoc), Fmoc-Lys (Boc)-OH was treated by DCC/NHS method. In short, Fmoc-Lys (Boc)-OH (0.8 g, 1.7 mmol) and NHS (0.3 g, 2.6 mmol) were dissolved in 20 mL DCM. DCC (0.8 g, 3.9 mmol) was added and reacted for 12 h. After filtration, the mixture was concentrated and mixed with mPEG-NH2 (2 g, 0.4 mmol) in 10 mL DCM. After stirring for another 24 h, the reaction was filtrated and rinsed 2 times with a saturated NaCl solution. Organic phase was gathered and dried with anhydrous Na2SO4. mPEG-lys (Boc/Fmoc) was obtained by reprecipitation into excess diethyl ether. Yield: 92.1%.
Synthesis of mPEG-Lys (Boc)
mPEG-lys (Boc/Fmoc) (1 g) was dissolved in 10 mL DCM followed by addition of 5 mL DEA. After stirring at room temperature for 4 h, the reaction was washed with saturated NaCl solution twice. Then, organic phase was gathered and dehydrated with anhydrous Na2SO4. After concentration, the residue was added into excess diethyl ether three times to obtain mPEG-lys (Boc). Yield: 76.0%.
Synthesis of mPEG-Lys(Boc)-PBLG
mPEG-lys(Boc)-PBLG was synthesized by two steps. Firstly, BLG-NCA was synthesized according to the report.17 Under N2 atmosphere, mPEG-lys (Boc) (0.85 g, 0.16 mmol) and BLG-NCA (1.68 g, 6.4 mmol) were dissolved into 15 mL DMF at 35°C for 72 h. After concentration, the residue was re-dissolved in DCM and reprecipitated into excess diethyl ether. mPEG-lys (Boc)-PBLG was obtained by vacuum drying. Yield: 86.9%.
Synthesis of mPEG-Lys-PBLG
The deprotection was performed according to the typical method. Briefly, mPEG-lys (Boc)-PBLG (1.2 g) was dissolved into 10 mL DCM and 5 mL TFA was added. The mixture was stirred at room temperature for 4 h. After concentration under reduced pressure, the residue was re-dissolved into DCM and reprecipitated into excess diethyl ether. mPEG-lys-PBLG was obtained by vacuum drying. Yield: 93.2%.
Synthesis of mPEG-Lys (Ce6)-PBLG
Ce6 (0.06 g, 0.1 mmol) was mixed with DCC (0.03 g, 0.15 mmol) in 5 mL DMSO. After adding NHS (0.013 g, 0.11 mmol), the reaction was mixed at room temperature for 4 h. After adding the PEG-lys-PBLG (1.2 g, 0.09 mmol) in 10 mL DMSO with 12.5 μL TEA, the reaction was mixed for 24 h, then filtrated and dialyzed (MW 5000) against DMSO for 24 h with DMSO changed three times and against pure water for another 24 h with water changed four times . mPEG-lys (Ce6)-PBLG was obtained by lyophilization. Yield: 83.4%.
Synthesis of mPEG-Lys (Ce6)-PGA-AIM
mPEG-lys (Ce6)-PBLG and AIM were dissolved in 5 mL anhydrous DMF plus 2-HP. Under N2 atmosphere, the reaction was mixed at 40 °C for 48 h. After that, the reaction mixture was dialyzed in pure water for 48 h with water changed five times. mPEG-lys (Ce6)-PGA-AIM was obtained by lyophilization. Yield: 71.6%.
Synthesis of HCP and FCP
HCP and RCP were synthesized according to the report.18–20 Cisplatin (0.69 g, 2.05 mmol) was firstly oxidized by H2O2. Then, the cis-platinum oxide solution in DMSO was mixed with 10 mL of the corresponding aliphatic anhydride in DMF: HA and PHA. After stirring for 48 h at room temperature, the mixture was mixed with 20 mL water to precipitate a pale-yellow solid, which was then filtered and separated. The yellow solid was washed several times with diethyl ether and dried. Yield: HCP 53.4%; FCP 49.1%.
Preparation Micelles
Blank micelles (BMs), HCP-loaded (HMs) micelles and FCP-loaded (FMs) micelles were made through the dialysis method. Briefly, 10 mg of mPEG-lys(Ce6)-PGA-AIM was dissolved in 2 mL DMSO. After that, BMs were collected by lyophilization and stored at 4 °C for use. 10 mg of mPEG-lys(Ce6)-PGA-AIM and 1 mg HCP or FCP were dissolved in 2 mL DMSO, followed by filtration through 0.45 μm filter and dialysis against pure water. HMs and FMs were obtained by lyophilization and stored at 4 °C for use. Core cross-linked micelles were prepared according to the report.16 Solution of Zn2+ was added into BMs, HMs and FMs suspension, followed by dialysis to remove redundant Zn2+ to generate CMs, CHMs and CFMs, respectively.
Reverse-phase high-performance liquid chromatography (HPLC) was used to detect the drug loading content (DLC) and drug loading efficiency (DLE) of HCP and FCP from HMs and FMs. Briefly, HMs or FMs were dispersed in DMSO and stirred for 4 h. After filtration through a 0.22 μm filter, drugs were measured (245 nm, flow rate: 1.0 mL/min, 30 °C). The standard curves of HCP and FCP were drawn in advance. DLC and DLE were counted according to the following formula:
Size distribution and morphology of micelles were detected by dynamic light scattering (DLS) on a Zetasizer Nano ZS (Malvern Instrument Ltd., Malvern, UK) and transmission electron microscopy (TEM) on JEM-2100F (Tokyo, Japan). Briefly, micelles and core cross-linked micelles were dispersed in pure water. TEM samples were prepared by the typical method. A drop of micelle suspension was placed on the carbon film copper mesh for 5 min. Finally, the suspension was removed and the samples were dried at room temperature for 24 h before TEM measurement.
Buffer Capacity
The buffering capacity of the CMs and control micelles (mPEG-lys(Ce6)-PBLG) was investigated according to a previously published method.21 Both types of micelle aqueous solutions (0.5 mg/mL) were prepared and the pH was adjusted to 10 using NaOH (1 mol/L). The micellar suspension was titrated with 0.1 mol/L HCl solution and the pH of the obtained mixture was recorded continuously. The titration curve was obtained via plotting the system pH against the volume of HCl solution.
Stimuli-Responsiveness
To demonstrate the pH-responsivity, size distribution and Zeta potential of BMs and CMs were analyzed by DLS. mPEG-lys (Ce6)-PBLG micelles were used as control group. Briefly, micelles (0.5 mg/mL) were measured in PBS solutions at pH 7.4, 6.8, and 5.5. Micelle size distribution and Zeta potential were assessed by DLS, and micelle morphology was assessed by TEM. To further evaluate the cross-linkage of micelles, BMs and CMs were dispersed in DMSO and PBS, respectively. To survey ROS-responsive degradation of micelles, BMs and CMs were incubated in PBS pH 7.4 containing 0, 0.1 mM and 1 mM H2O2. DLS and TEM record particle size distribution and morphology. For practical observation of this phenomenon, a picture of micelles was taken.
Dilution of Micelles
The blank mPEG-lys (Ce6)-PGA-AIM micelle was diluted with 0.9 mL DMSO, and Zn2+ (0.1 mL, 1 mg/mL) was added or not added. Pictures were taken to observe the Tyndall effect. In order to further realize the cross-linking of micelles, the FL spectra of micelles at 400 ~ 800 nm were recorded. In addition, the particle size distribution and morphology of the diluted micelles were determined by DLS and TEM.
Drug Release
The dialysis method was performed to detected drug release from FMs or CFMs in vitro. FMs or CFMs (1 mg/mL) were transferred into a Float-A-Lyzer G2 dialysis device (MWCO 100 KDa, Spectrum) and drug release was conducted in PBS (pH 7.4) at 37 °C. At predetermined time points, 1.0 mL of sample solution was taken out and Pt concentration was quantified by atomic absorption spectroscopy (AAS).19 An equal volume of fresh PBS was immediately replenished. The same drug release procedure was carried out in triplicate in PBS pH 6.5 and pH 5.5 with or without 0, 0.1 mM and 1 mM H2O2, respectively.
Cellular Uptake
To evaluate the enhanced cellular uptake by slightly acidic microenvironment, SKOV3 cells (1.0 × 10⁶ cells/well) were placed in 6-well plates for 12 h. Then, culture medium of half wells was substituted with adjusted medium (pH 6.8, adjusted with 0.1 M HCl solution). BMs were added into each well and cells were incubated for 0.5 h and 1 h. After that, cells were washed with PBS, fixed with 4% formaldehyde for 15 min and stained with DAPI for 10 min. Coverslips were placed onto glass microscope slides and the fluorescence imaging of cells was analyzed by confocal laser scanning microscopy (CLSM) on a Leica confocal system.
To evaluate the endosome escape of micelles and accumulation of drugs into cells, SKOV3 cells (1.0 × 10⁶ cells/well) were placed in 6-well plates for 12 h. Then, cells were induced with mPEG-lys (Ce6)-PBLG micelles (negative control, NC) or BMs for 4 h, 8 h and 12 h. After that, cells were stained with Lysotracker Green following the instructions then washed with PBS. And cells were fixed with 4% formaldehyde for 15 min and stained with DAPI for 10 min. CLSM was used to analyze the fluorescence imaging of cells by placing the covering membrane on a glass slide.
MTT Assay
SKOV3 cells (4 × 10³ cells/well) were plated in 96-well plates. Oxygen-saturated CMs, CHMs and CPMs were added with equivalent Pt concentrations ranging from 0.05 to 1.6 μM. Then the light irradiation was applied for 10 min (660 nm, 100 mW/cm2). After incubation for 24 h, the cell viability was assessed by the standard 3-(4, 5-dimethylthiazol-2-yl)-2, 5-diphenyltetrazolium bromide (MTT) assay. Cell viability of cells treated with CMs, CHMs and CPMs without light irradiation was evaluated by the same method. Cell viability was counted according to the following formula:
Cell Apoptosis
Cell apoptosis was detected by flow cytometry. Firstly, the cells stimulated with saline, CMs, CHMs and CPMs with or without light irradiation were collected, resuspended in cold PBS, centrifuged at 1000 rpm in room temperature for 5–10 min. Then, cells were incubated with 5 μL AnnexinV-Alexa Fluor 647 for 15 min and then co-incubated with 5 μL PI before detection. In the end, the apoptosis rate was tested via flow cytometer (Beckman Coulter, CA, USA).
Animal Model and Biodistribution
The model of heterogeneous prostate cancer was structured by subcutaneous injection of SKOV3 cells. Mice were randomly divided into three groups (n = 5). To visually observe the biodistribution of micelles, saline, free Ce6 and CMs were injected via tail vein with Ce6 amount of 2 mg/kg. After 12 h, 24 h and 48 h, mice of each group were exposed on an infrared imaging system (Caliper, XenoFluor 750) with excitation wavelength at 780 nm. Afterwards, mice were euthanized and tissues, including heart, liver, spleen, lung, kidney and tumor, were harvested for imaging ex vivo. The Institutional Animal Care and Use Committee of Tianjin Medical University Cancer Institute and Hospital authorized this research.
Drug Administration
6-week-old male nude mice were inoculated subcutaneously in the right flank with SKOV3 cells (1.5 × 10⁶). When the xenografts tumor volume grew to an appropriate size successfully, mice were divided into 7 groups (n = 5) and treated with different drugs including saline, CMs, CHMs and CFMs with or without light irradiation (Pt: 10 μM/kg). The body weight and tumor size were recorded every 2 days. Besides, after mice were sacrificed, tissues including heart, liver, spleen, lung, kidney and tumor were collected and fixed for HE and TUNEL staining.
Results and Discussion
Characterization of Polymers
The synthesis procedure of polymers is depicted in Figure 2. The 1H NMR spectra of polymers are shown in Figure 3A–F. The peak a (1.37 ppm) and b (7.92–7.31 ppm) labeled in Figure 3A were attributed to the typical peak of Boc and Fmoc, respectively. After deprotection, peak b disappeared, while peak a was still there, which proves the successful synthesis of mPEG-lys(Boc) (Figure 3B). After ring-opening polymerization, the signals at 7.26 ppm and 5.07 ppm (peak d and c) were observed and attributed to the phenyl and methylene groups, respectively (Figure 3C). The numbers of repeated units of the hydrophobic blocks in mPEG-lys(Boc)-PBLG were calculated to be 38 on average from the spectra of 1H NMR by comparing the integral area of PEG segments and benzene groups. Thus, the molecular weight (Mn) of mPEG-lys(Boc)-PBLG was 13,550 g/mol. mPEG-lys(Boc)-PBLG was successfully de-protected, proved by the disappearance of peak a as shown in Figure 3D. Ce6 was successfully conjugated as shown in Figure 3E. After aminolysis, both peak c and d disappeared and emerging peaks (f, g and h) appeared that were attributed to imidazoles (7.63 ppm, 7.15 ppm and 6.88 ppm), while peak e can still be observed (Figure 3F).
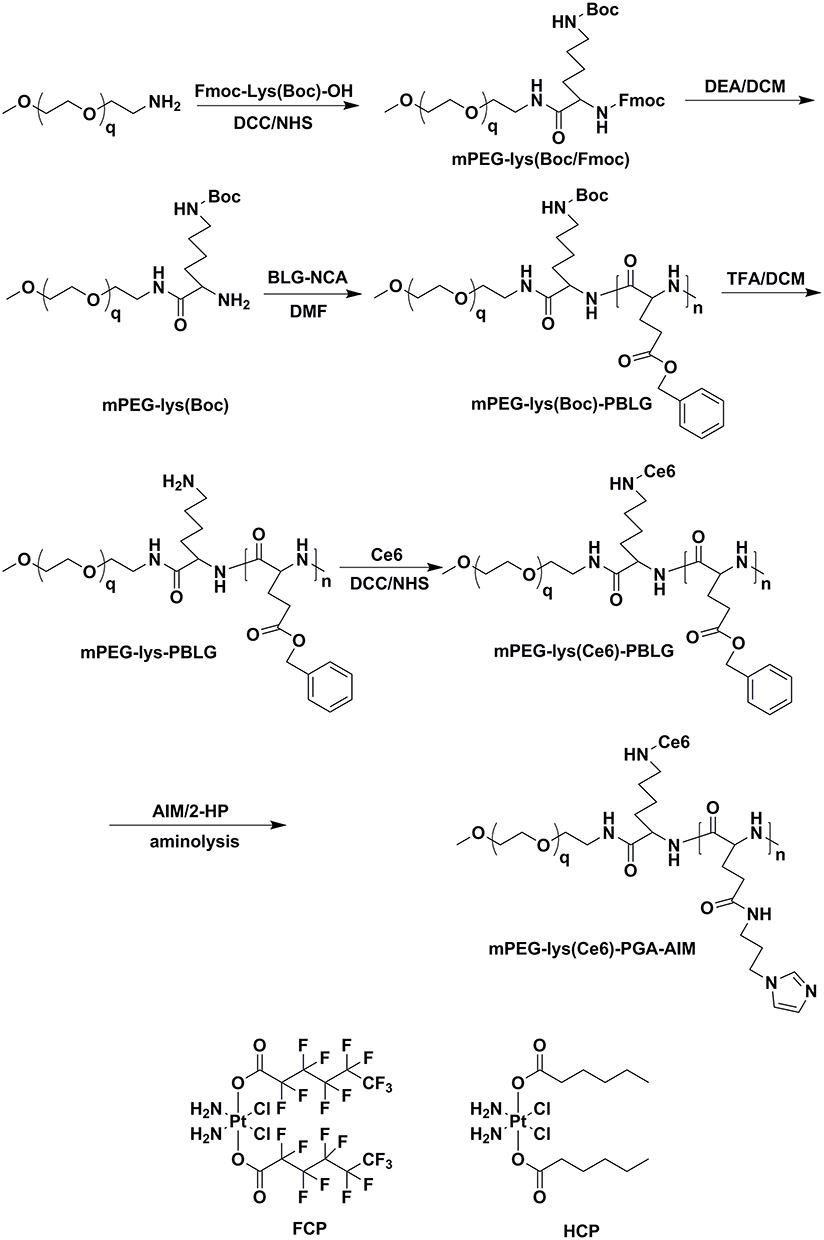 |
Figure 2 Synthesis scheme of polymers. |
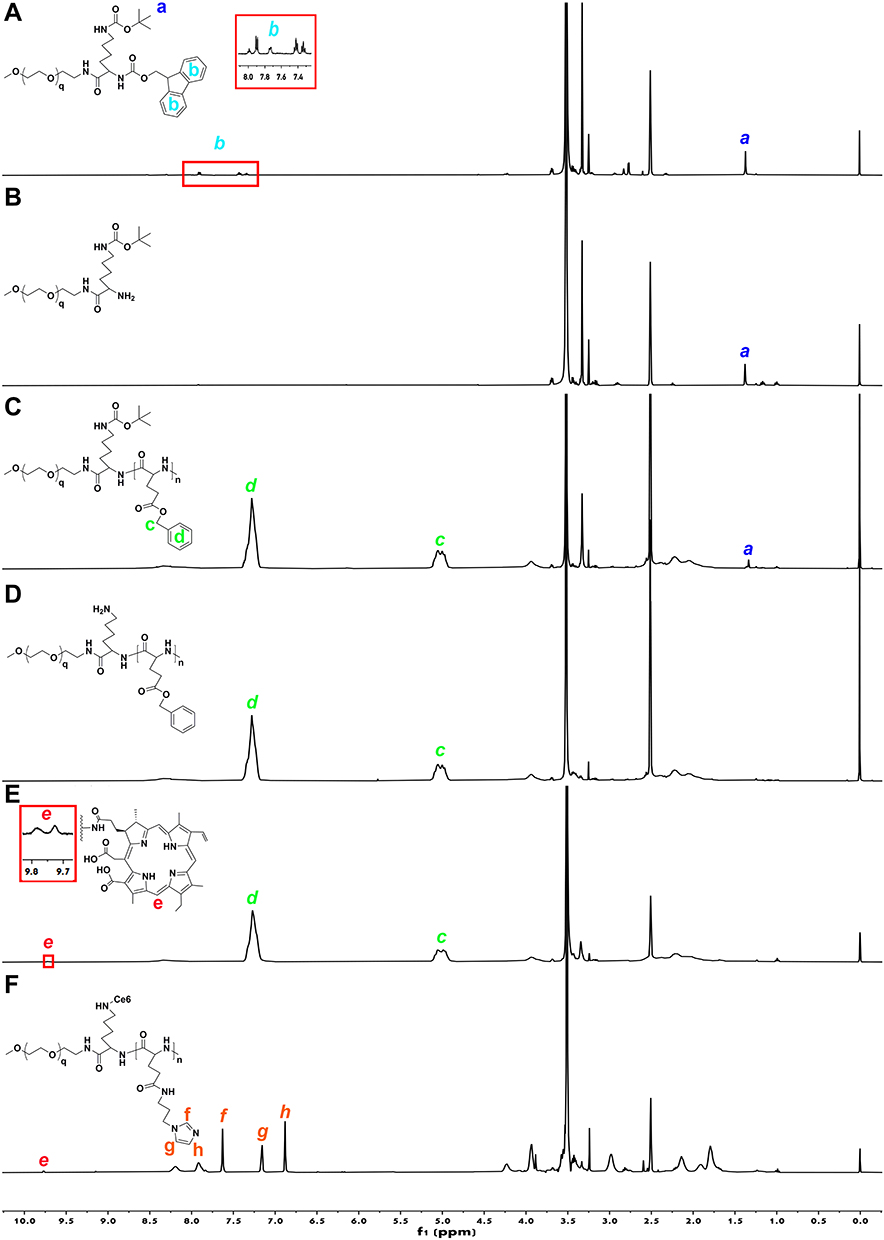 |
Figure 3 1H NMR of polymers in DMSO-d6: mPEG-lys(Boc/Fmoc) (A); mPEG-lys(Boc) (B); mPEG-lys(Boc)-PBLG (C); mPEG-lys-PBLG (D); mPEG-lys(Ce6)-PBLG (E); and mPEG-lys(Ce6)-PGA-AIM (F). |
Characterization of Micelles
To evaluate pH-responsive size distribution, mPEG-lys(Ce6)-PBLG micelles, BMs and CMs were exposed on buffer solution of pH 7.4, 6.8 and 5.5. As shown in Figure 4A, mPEG-lys(Ce6)-PBLG micelles exhibited narrow size distribution with average size of 231.6 ± 9.8 nm and pH values did not change the size distribution. However, size distribution of BMs changed with pH values as shown in Figure 4B. BMs exhibited average size of 169.7 ± 6.2 nm in pH 7.4. It increased to 243.9 ± 10.3 nm in pH 6.8 and 265.1 ± 13.7 nm in pH 5.5. Furthermore, significantly broadened size distribution was observed in pH 6.8 and 5.5, which was further proved by the TEM photos of BMs in different pH values (Figure 4E). Changes of size distribution of BMs were caused by the protonation of imidazoles. CMs exhibited decreased average size of 113.7 ± 4.8 nm in pH 7.4 compared with BMs, which was possibly caused by the cross-linkage. Besides, size increased with decreasing pH, as shown in Figure 4C.
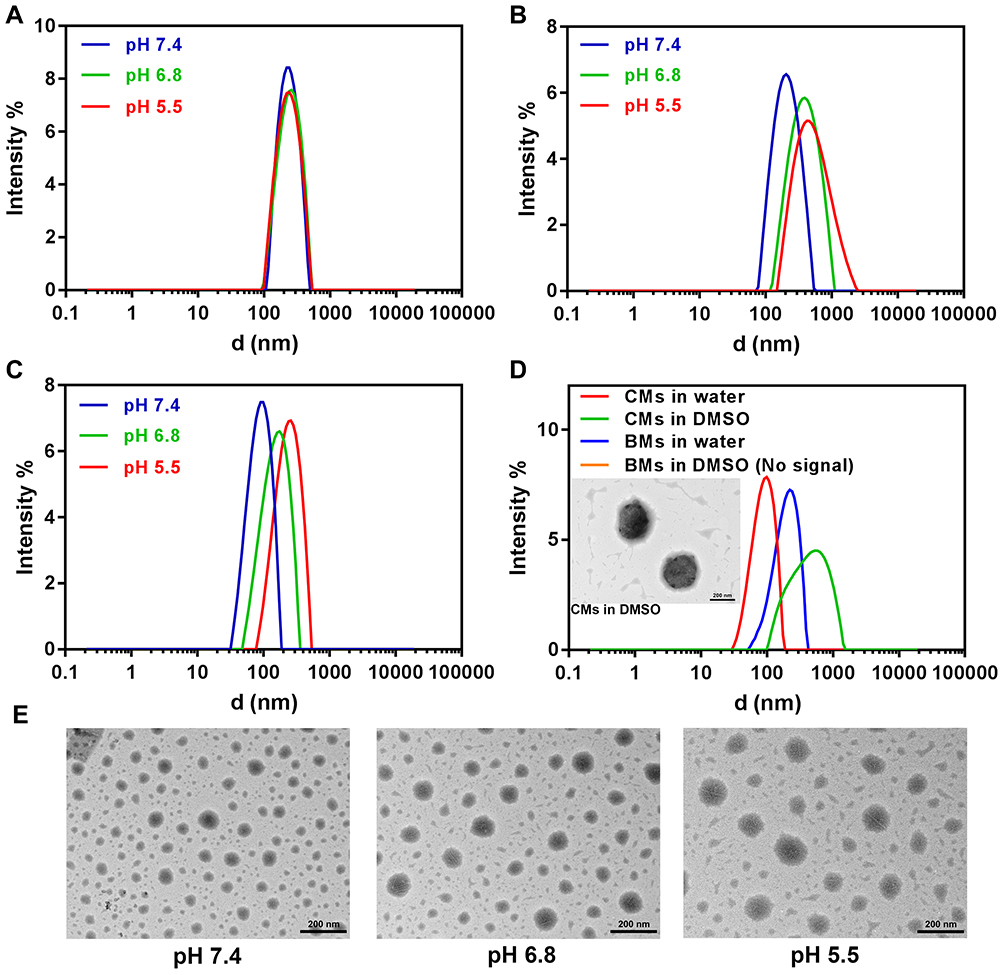 |
Figure 4 Size distribution of micelles in buffer solution of pH 7.4, 6.8 and 5.5: mPEG-lys(Ce6)-PBLG micelles (A); BMs (B); and CMs (C). Size distribution of BMs and CMs in water or DMSO (D). The inserted picture was TEM photo of CMs in DMSO. Morphology of BMs in different pH values (E). |
To demonstrate the cross-linkage, BMs and CMs were dispersed in water or DMSO and the corresponding size distribution was measured as shown in Figure 4D. BMs in water exhibited larger size than CMs in water. CMs in DMSO exhibited broadened size distribution, while no signal was detected when BMs were dispersed in DMSO. To further evaluate the long-term stability, the micelles were dispersed in water, PBS and FBS and incubated at 37 °C for 12 days. The particle size changes of the micelles were detected using DLS. The results showed that the size of the micelles did not change significantly in the water. It shows that micelles have the most stable structure in water and can be used as the first choice during long-term storage (Figure S1). Additionally, the corresponding size of CMs, CHMs and CPMs were also measured as shown in Figure S2.
ROS-Responsiveness
mPEG-lys(Ce6)-PBLG micelles, BMs and CMs were incubated with 1 mM H2O2. Corresponding size distribution was demonstrated in Figure 5. Average size of mPEG-lys(Ce6)-PBLG micelles fluctuated around 180 nm, indicating good stability during incubation for 14 h (Figure 5A). CMs can keep stable during the first 6 h, while fast degradation occurs during the next 8 h (Figure 5B). BMs exhibited a similar degradation progress (Figure 5C). Interestingly, BMs kept stable during the first 4 h, indicating faster degradation than CMs. Figure 5D demonstrated the size distribution of BMs and CMs after H2O2 treatment. As Figure 5E shows, no particular morphology can be observed in TEM photo of BMs after H2O2 treatment, indicating complete degradation. While, degradation still occurred after CMs were treated with H2O2 and spherical-like morphology still can be observed in Figure 5F.
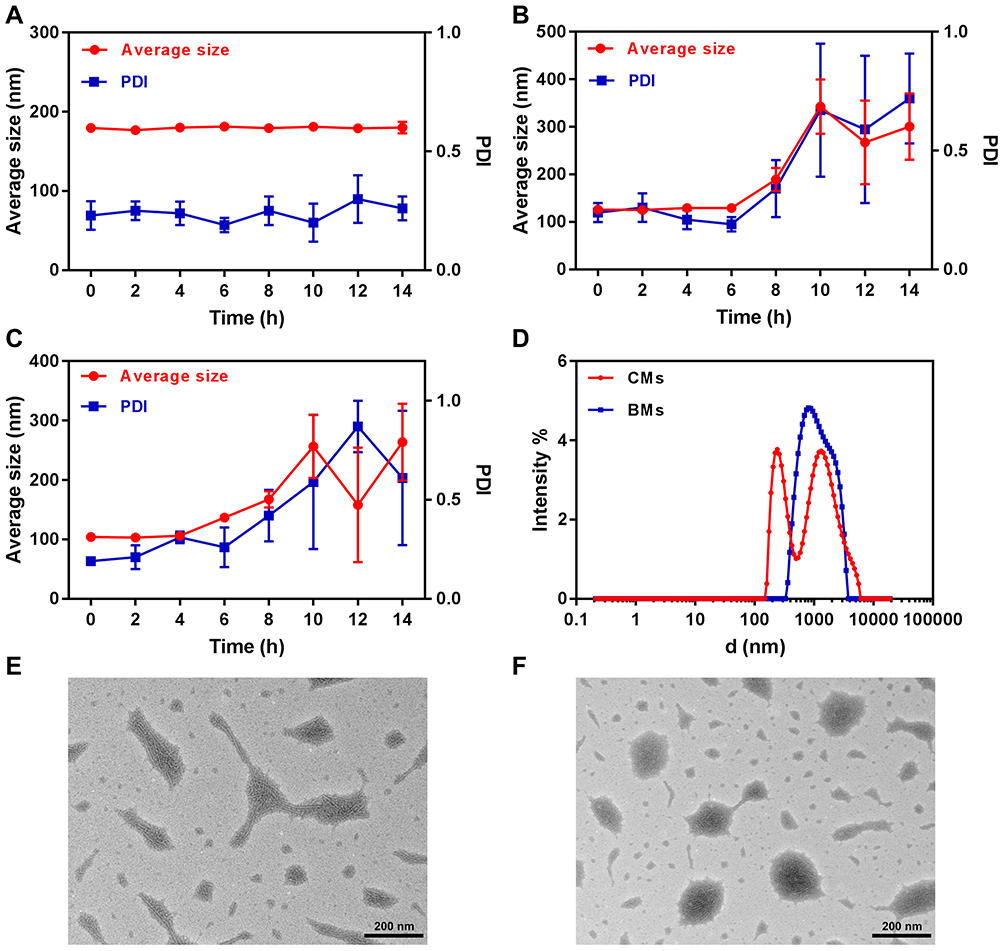 |
Figure 5 Changes of average size and PDI with time of different micelles: mPEG-lys(Ce6)-PBLG micelles (A); CMs (B); and BMs (C). Size distribution of BMs and CMs after H2O2 treatment (D). TEM photo of BMs (E) and CMs (F) treated with H2O2. |
Drug Release
Drug release from FCP-loaded mPEG-lys(Ce6)-PBLG micelles, FMs and CFMs was investigated in different conditions. To evaluate the influence of pH values on drug release, mPEG-lys(Ce6)-PBLG micelles, FMs and CFMs were dialyzed against buffer solution of pH 7.4, 6.8 and 5.5. As shown in Figure 6A, at pH 7.4, all micelles exhibited rather slow drug release with cumulative drug release of 48 h less than 20%. Among these drug-loaded micelles, CFMs exhibited slower drug release than FMs, due to the cross-linkage of CFMs, facilitating prevention of premature release of encapsulated drugs during blood circulation. When pH decreased to 6.8 drug release of FMs was dramatically enhanced with cumulative amount of drugs 26.9% for 48 h, while FCP-loaded mPEG-lys(Ce6)-PBLG micelles and CFMs at pH 6.8 exhibited similar drug release profiles with those at pH 7.4 (Figure 6B). With the further reduction of pH to 5.5 (Figure 6C), drug release of FMs and CFMs was rather enhanced than that at pH 7.4 and 6.8, as well as FCP-loaded mPEG-lys(Ce6)-PBLG micelles. Specifically, the cumulative drug release of FCP-loaded mPEG-lys(Ce6)-PBLG micelles, FMs and CFMs was 15.6%, 69.7%, and 55.1%, respectively. Because of cross-linkage, CFMs exhibited slower drug release than FMs. These results indicated cross-linked mPEG-lys(Ce6)-PGA-AIM micelles can encapsulate drugs efficiently during blood circulation and extracellular tumor cells, while achieving fast drug release in endosome/lysosomes in tumor cells. To evaluate the effects of ROS on drug release, drug-loaded micelles were incubated with 0.1 mM H2O2 and 1 mM H2O2. As shown in Figure 6D, drug release from FCP-loaded mPEG-lys(Ce6)-PBLG micelles in 0.1 mM H2O2 condition was similar with that in 1 mM H2O2, with cumulative drug release amount less than 16% for 48 h. Both FMs and CFMs exhibited faster drug release than FCP-loaded mPEG-lys(Ce6)-PBLG micelles. And drug release from micelles in 1 mM H2O2 was enhanced compared with that in 0.1 mM H2O2. For example, 92.0% of drugs were released from FMs in 1 mM H2O2 for 48 h, while 74.1% were released in 0.1 mM H2O2 (Figure 6E). Interestingly, the difference of drug release between 0.1 mM H2O2 and 1 mM H2O2 was more obvious. 88.6% of drugs were released from CFMs in 1 mM H2O2 for 48 h, while 60.3% were released in 0.1 mM H2O2 (Figure 6F). The difference mainly resulted from cross-linkage of CFMs. More importantly, cross-linkage did not restrain drug release and ROS-triggered drug release was achieved. In addition, we detected the changes in ROS levels before and after PDT (Figures S5 and S6).
 |
Figure 6 Drug release from FCP-loaded mPEG-lys(Ce6)-PBLG micelles, FMs and CFMs at different conditions: pH 7.4 (A), pH 6.8 (B) and pH 5.5 (C). Drug release at conditions of pH 7.4 with 0.1 mM H2O2 or 1 mM H2O2 from different micelles: FCP-loaded mPEG-lys(Ce6)-PBLG micelles (D), FMs (E) and CFMs (F). |
Cellular Uptake and Cytotoxicity
To evaluate the influence of pH values on cellular uptake of pH-responsive micelles, SKOV3 cells were treated with mPEG-lys(Ce6)-PBLG or mPEG-lys(Ce6)-PGA-AIM micelles in adjusted culture media of pH 7.4 and pH 6.8. As shown in Figure 7A, almost no difference of Ce6 fluorescence was observed after cells were treated with mPEG-lys(Ce6)-PBLG micelles. However, cells treated with mPEG-lys(Ce6)-PGA-AIM micelles at pH 6.8 showed increased Ce6 fluorescence compared with that at pH 7.4. To further quantitatively measure the internalized amount of micelles, mean fluorescence intensity of cells treated with different micelles at pH 7.4 and pH 6.8 was detected as shown in Figure 7B. Cells with pretreatment at both pH values exhibited significantly increased fluorescence compared with cells without treatment. Cells at pH 6.8 treated with mPEG-lys(Ce6)-PBLG micelles showed slightly increased fluorescence compared with these at pH 7.4, which is possibly caused by the enhanced permeability of cell membrane at lower pH values. However, cells at pH 6.8 treated with mPEG-lys(Ce6)-PGA-AIM micelles showed significantly increased fluorescence compared with these at pH 7.4, which is supported by the results of Zeta potential in Figure S3.
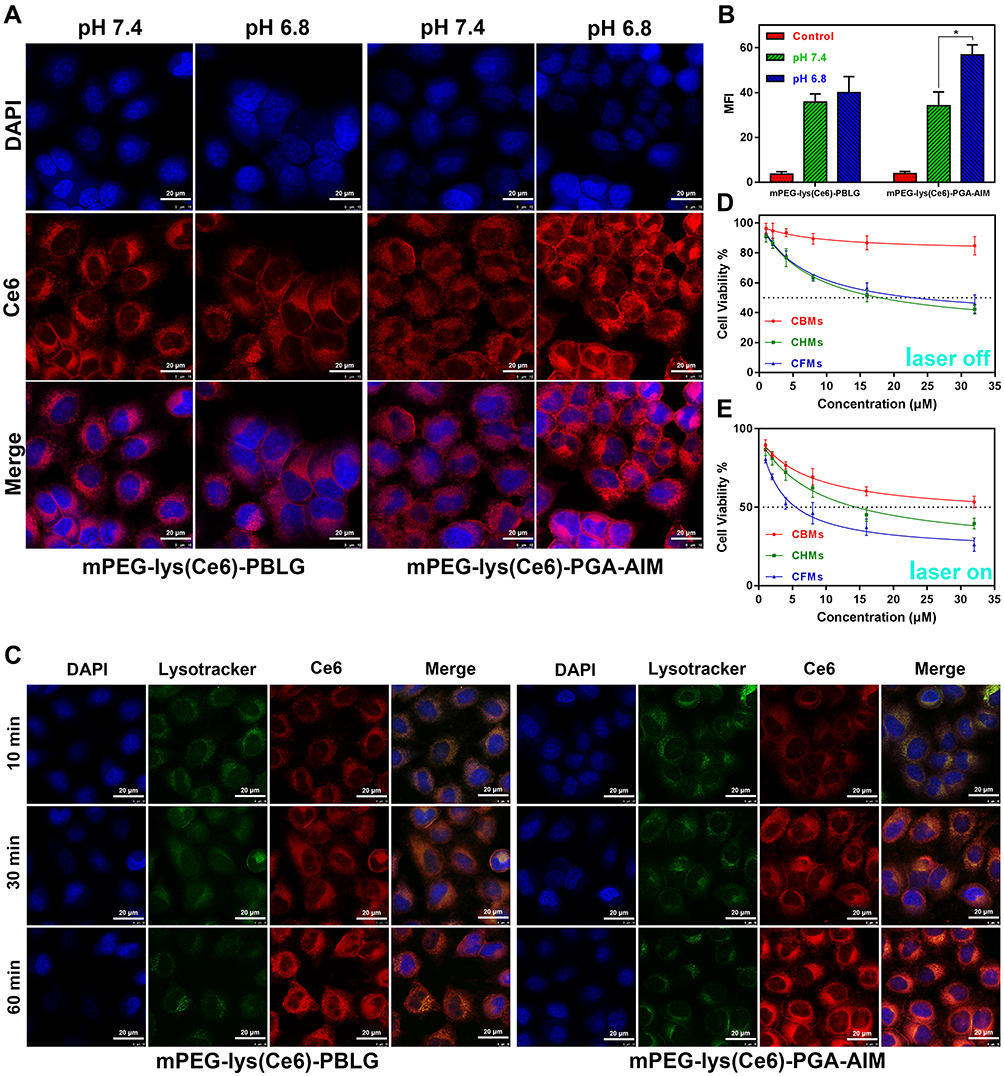 |
Figure 7 CLSM images (A) and quantitative analysis of fluorescence intensity (B) of SKOV3 cells cultured in medium of pH 7.4 or pH 6.8 treated with mPEG-lys(Ce6)-PBLG or mPEG-lys(Ce6)-PGA-AIM micelles for 1 h. Intracellular location of mPEG-lys(Ce6)-PBLG or mPEG-lys(Ce6)-PGA-AIM micelles observed by CLSM (C). The late endosomes and lysosomes were stained by Lysotracker Green. Cytotoxicity of CMs, CHMs and CFMs without irradiation of light (D) and with light irradiation (E) against SKOV3 cells for 48 h. Scale bar: 50 μm. |
To further evaluate the ability of endosome/lysosome escape, cells were treated with mPEG-lys(Ce6)-PBLG or mPEG-lys(Ce6)-PGA-AIM micelles and labeled with Lysotracker Green. As shown in Figure 7C, increased Ce6 fluorescence of cells was observed after cells were treated with both micelles, indicating time-dependent intracellular accumulation of micelles. Also, it was worth noting that mPEG-lys(Ce6)-PGA-AIM micelles led to enhanced fluorescence compared with mPEG-lys(Ce6)-PBLG micelles after cells were co-incubated for 30 min and 60 min, which is mainly caused by the expansion of mPEG-lys(Ce6)-PGA-AIM micelles to further relieve aggregation induced quenching (ACQ) of Ce6.22 Entrapped micelles in endosome/lysosomes showed yellow regions in merged photos. A large area of overlap of Lysotracker Green stained endosome/lysosomes and mPEG-lys(Ce6)-PBLG micelles can be observed after cells were co-incubated for 10 min and 30 min, while endosome/lysosome escape of mPEG-lys(Ce6)-PBLG micelles was observed after 60 min of incubation. mPEG-lys(Ce6)-PGA-AIM micelles exhibited faster endosome/lysosome escape than mPEG-lys(Ce6)-PBLG micelles. Specifically, obvious endosome/lysosome escape of mPEG-lys(Ce6)-PGA-AIM micelles was observed after 30 min of incubation
Cytotoxicity of CBMs, CHMs and CFMs against SKOV3 cells with or without laser irradiation was measured by MTT assay (Figure 7D and E). Without laser irradiation, CBMs exhibited lower cytotoxicity than CHMs and CFMs. Specifically, cell viability of CBMs was 84.7%, while it was 42.3% and 45.8% for CHMs and CFMs, respectively. However, after laser irradiation, all these micelles exhibited decreased cell viability. Cell viability of CBMs was 54.3%, and it was 39.6% and 26.1% for CHMs and CFMs, respectively. It is worth noting that CFMs exhibited comparative cytotoxicity with CHMs without laser irradiation, while significantly increasing cytotoxicity compared with CHMs with laser irradiation. These results directly proved oxygen self-supplied enhanced PDT, which was further proved by the results of cell apoptosis as shown in Figure S4.
Biodistribution
To demonstrate the in vivo targeting ability of nanoparticles, mice were treated with saline, free Ce6 and CMs for 6 h, 12 h and 24 h, and exposed on photographic imaging system. We found that tumors exhibited significant fluorescence signals after CMs were treated for 12 h (Figure 8A). Enhanced fluorescence signals were observed after injection for 24 h compared with that of injection for 12 h, indicating time-dependent accumulation of nanoparticles. It was noteworthy that fluorescence signals of free Ce6 was weak after 12 h and disappeared after 24 h, suggesting fast metabolism of free Ce6. As shown in Figure 8B, organs and tumors were exposed to observe Ce6 fluorescence after being treated for 24 h. Ce6 fluorescence was mainly located in liver and tumors. In Ce6 imaging, free Ce6 was mainly accumulated in liver and kidney. CMs exhibited higher fluorescence in tumor and lower fluorescence in liver than free Ce6, indicating enhanced tumor-targeting ability of CMs.
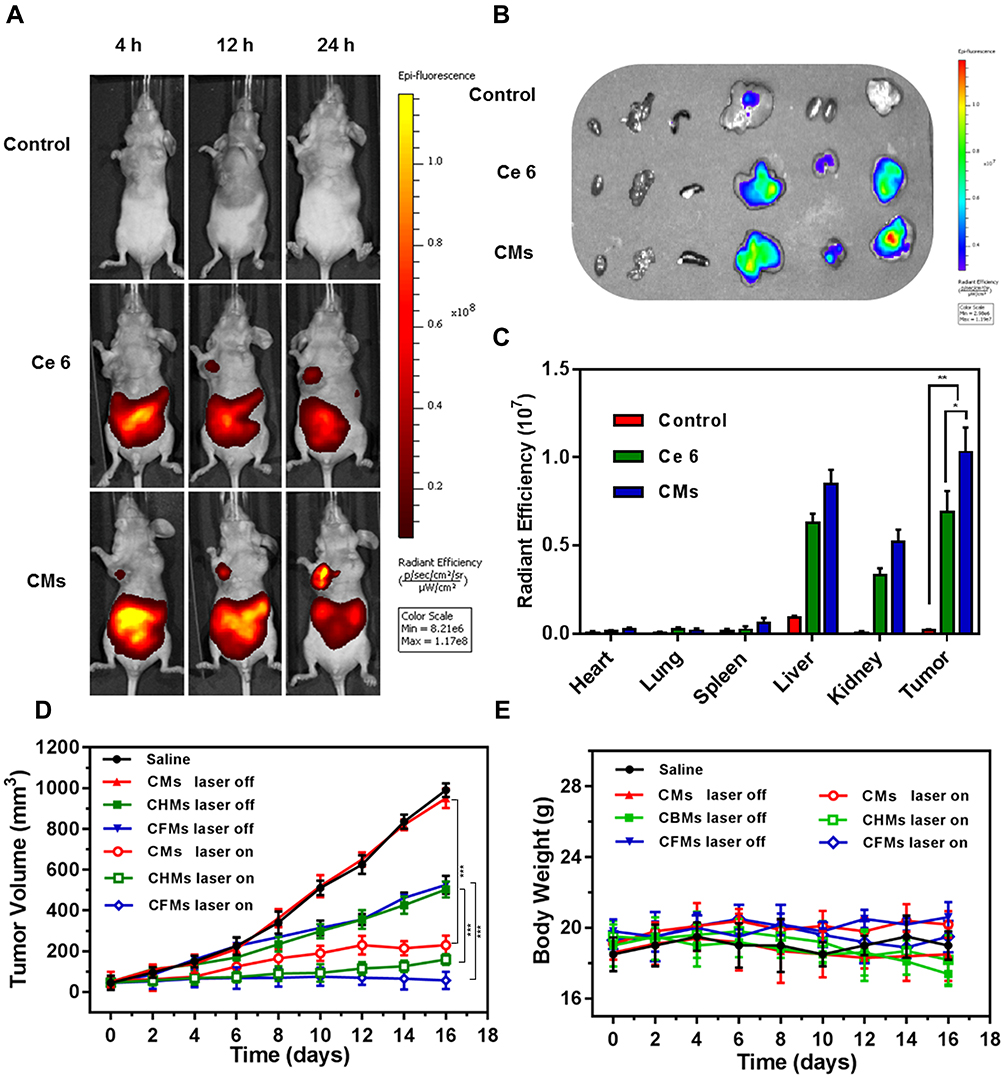 |
Figure 8 Representative fluorescence images of tumor-bearing mice treated with saline, free Ce6 and CMs for 6 h, 12 h and 24 h (A), and their dissected organs (B) with quantified radiation efficiency (C) at 24-h post-injection with saline, free Ce6 and CMs. The tumor volume (D) and body weight change (E) of mice treated with saline, CMs, CHMs and CFMs with or without laser. *p < 0.05, **p < 0.01, ***p < 0.001. |
In vivo Tumor Therapy
To evaluate the anticancer effect, tumor-bearing mice were randomly divided into seven groups. Mice were stimulated with saline, Cur, CMs, CHMs and CFMs with or without laser. Firstly, the tumor size of each group was measured every 2 days (Figure 8D). All drug formulations, except CMs without laser, exhibited significant anticancer effect. Both CHMs and CFMs without laser showed better tumor growth inhibition than CMs without laser. CHMs and CFMs without laser exhibited the similar anti-tumor effect. However, it was found that CFMs with laser exhibited better antitumor efficiency than any other groups. The loss of body weight induced by all groups was recorded in Figure 8E. These results demonstrated that CFMs with laser exerted great antitumor effect and decreased systemic toxicity compared with CMs and CHMs with laser. Besides, histological analysis of tumors from each group was conducted as shown in Figure 8E. Notably, it was found that CFMs exhibited better anti-tumor effects compared with other groups. The above results confirm that the synergistic photothermal chemotherapy has a highly effective therapeutic effect.
TUNEL and Ki67 immunofluorescence staining of tumor tissue were performed to assess the effects of different groups on apoptosis induction and proliferation inhibition. As shown in Figure 9A and B, CMs, CFMs and CHMs under laser irradiation showed better apoptotic induction and proliferation inhibition than other groups. In the absence of laser irradiation, the inhibition of CFMs and CHMs on cell proliferation was indistinctive, but the induction of apoptosis was more obvious. Notably, CFMs with laser exhibited the most significant anti-tumor effect on tumor. Moreover, similar conclusions were summarized from HE staining results of tumor sections.
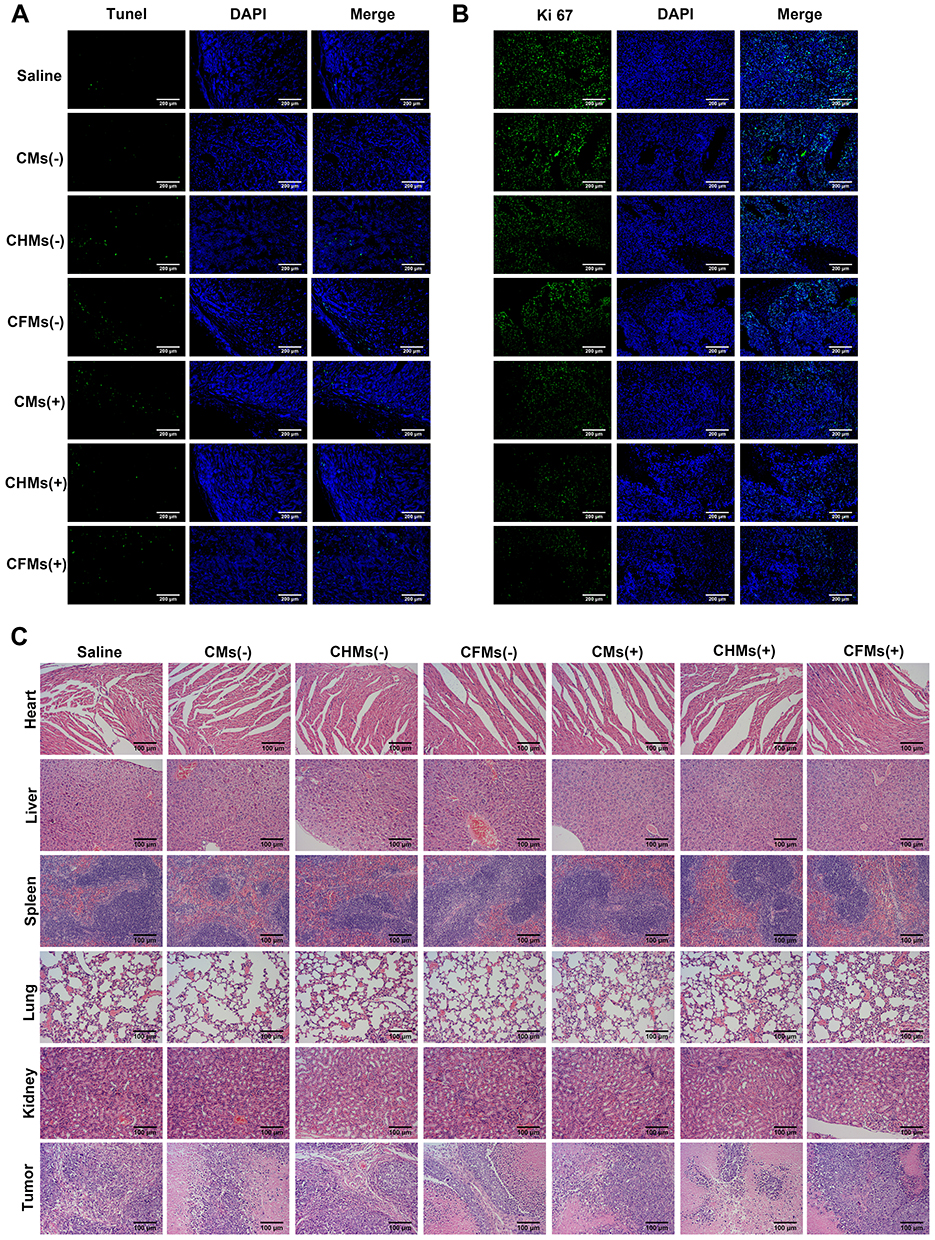 |
Figure 9 Representative TUNEL (A) and Ki67 (B) immunofluorescence of tumor sections and H&E staining (C) of various organs from mice stimulated with Saline, CMs, CHMs and CFMs with or without laser, respectively. |
Besides, H&E staining of various organs was further used to evaluate the systemic toxicity of CMs, CFMs and CHMs on mice in vivo. As shown in Figure 9C, the effects of each group on the mice’s heart, spleen, lungs and kidneys were mild, regardless of the laser exposure. Liver damage was observed in the CHMs and CFMs groups, indicating that acid-modified Cisplatin (HCP) and perfluorohexanoic acid (FCP) exerted a certain cumulative liver toxicity.
Conclusion
In conclusion, a novel theranostic agent based on PDT and chemotherapy, namely CFMs was successfully synthesized and drug-loaded core cross-linked micelles have been prepared. The micelles exhibited remarkable stability, pH regulated drug release, good biocompatibility and effective tumor penetration. Cellular uptake demonstrated the efficient endosome/lysosome escape of CFMs, which facilitates the intracellular drug release. Both in vitro and in vivo experiments reflected that CFMs with laser irradiation showed significantly improved therapeutic activity compared with single PDT or chemotherapy. Besides, oxygen-saturated CFMs with laser irradiation exhibited higher cytotoxicity against SKOV3 cells than other formulations, indicating great potential of the synergistic effect. Collectively, CFMs can provide a promising platform for effective diagnosis and treatment of cancer cells, which could substantially improve therapeutic outcomes by chemo-phototherapy.
Ethical Approval
This study was approved by the Institutional Animal Care and Use Committee of Tianjin Medical University Cancer Institute and Hospital (Permission number: NSFC-AE-2019210). The animals were handled in strict compliance with the Welfare and Ethics of Laboratory Animals Regulations established by the Chinese Association for Laboratory Animal Sciences.
Funding
This work was supported by Tianjin Science and Technology Plan (20YFZCSY00040).
Disclosure
The authors report no conflicts of interest in this work.
References
1. Liu Y, Bhattarai P, Dai Z, Chen X. Photothermal therapy and photoacoustic imaging: via nanotheranostics in fighting cancer. Chem Soc Rev. 2019;48:2053–2108.
2. Yang N, Xiao W, Song X, Wang W, Dong X. Recent advances in tumor microenvironment hydrogen peroxide-responsive materials for cancer photodynamic therapy. Nano Micro Lett. 2020:1–27.
3. Shi JH, Wang TR, You YQ, et al. Enhancement of ultralow-intensity NIR light-triggered photodynamic therapy based on exo- and endogenous synergistic effects through combined glutathione-depletion chemotherapy. Nanoscale. 2019;11(27):13078–13088. doi:10.1039/C9NR03052B
4. Wang H, Han RL, Yang LM, et al. Design and synthesis of Core-Shell-Shell upconversion nanoparticles for nir-induced drug release, photodynamic therapy, and cell imaging. ACS Appl Mater Interfaces. 2016;8:4416–4423. doi:10.1021/acsami.5b11197
5. Yuan Y, Min Y, Hu Q, Xing B, Liu B. NIR photoregulated chemo- and photodynamic cancer therapy based on conjugated polyelectrolyte-drug conjugate encapsulated upconversion nanoparticles. Nanoscale. 2014;6:11259–11272. doi:10.1039/C4NR03302G
6. Dang J, He H, Chen D, Yin L. Manipulating tumor hypoxia toward enhanced photodynamic therapy (PDT). Biomater Sci. 2017;5:1500–1511. doi:10.1039/C7BM00392G
7. Phua SZF, Yang G, Lim WQ, et al. Catalase-integrated hyaluronic acid as nanocarriers for enhanced photodynamic therapy in solid tumor. ACS Nano. 2019;13:4742–4751. doi:10.1021/acsnano.9b01087
8. Fan W, Bu W, Shen B, et al. Intelligent MnO2 nanosheets anchored with upconversion nanoprobes for concurrent pH-/H2O2-responsive UCL imaging and oxygen-elevated synergetic therapy. Adv Mater. 2015;27:4155–4161. doi:10.1002/adma.201405141
9. Lee AL, Gee CT, Weegman BP, et al. Oxygen sensing with perfluorocarbon-loaded ultraporous mesostructured silica nanoparticles. ACS Nano. 2017;11:5623–5632. doi:10.1021/acsnano.7b01006
10. Hu DR, Zhong L, Wang MY, et al. Perfluorocarbon-loaded and redox-activatable photosensitizing agent with oxygen supply for enhancement of fluorescence/photoacoustic imaging guided tumor photodynamic therapy. Adv Funct Mater. 2019;29:1–14. doi:10.1002/adfm.201806199
11. Xing L, Gong JH, Wang Y, et al. Hypoxia alleviation-triggered enhanced photodynamic therapy in combination with IDO inhibitor for preferable cancer therapy. Biomaterials. 2019;206:170–182. doi:10.1016/j.biomaterials.2019.03.027
12. Pei P, Sun C, Tao W, Li J, Yang X, Wang J. ROS-sensitive thioketal-linked polyphosphoester-doxorubicin conjugate for precise phototriggered locoregional chemotherapy. Biomaterials. 2019;188:74–82. doi:10.1016/j.biomaterials.2018.10.010
13. Li F, Li T, Cao W, Wang L, Xu H. Near-infrared light stimuli-responsive synergistic therapy nanoplatforms based on the coordination of tellurium-containing block polymer and cisplatin for cancer treatment. Biomaterials. 2017;133:208–218. doi:10.1016/j.biomaterials.2017.04.032
14. Gao D, Lo PC. Polymeric micelles encapsulating pH-responsive doxorubicin prodrug and glutathione-activated zinc(II) phthalocyanine for combined chemotherapy and photodynamic therapy. J Control Release. 2018;282:46–61. doi:10.1016/j.jconrel.2018.04.030
15. Lu D, An Y, Feng S, et al. Imidazole-bearing polymeric micelles for enhanced cellular uptake, rapid endosomal escape, and on-demand cargo release. AAPS PharmSciTech. 2018;19:2610–2619. doi:10.1208/s12249-018-1092-2
16. Li X, Gao M, Xin K, et al. Singlet oxygen-responsive micelles for enhanced photodynamic therapy. J Control Release. 2017;260:12–21. doi:10.1016/j.jconrel.2017.05.025
17. Hou G, Qian J, Xu W, et al. Multifunctional PEG-b-polypeptide-decorated gold nanorod for targeted combined chemo-photothermal therapy of breast cancer. Colloids Surf B Biointerfaces. 2019;181:602–611. doi:10.1016/j.colsurfb.2019.05.025
18. Ling X, Chen X, Riddell IA, et al. Glutathione-scavenging Poly(disulfide amide) nanoparticles for the effective delivery of Pt(IV) prodrugs and reversal of cisplatin resistance. Nano Lett. 2018;18:4618–4625. doi:10.1021/acs.nanolett.8b01924
19. Johnstone TC, Lippard SJ. The effect of ligand lipophilicity on the nanoparticle encapsulation of Pt(IV) prodrugs. Inorg Chem. 2013;52:9915–9920. doi:10.1021/ic4010642
20. Dhar S, Gu FX, Langer R, Farokhza OC, Lippard SJ. Targeted delivery of cisplatin to prostate cancer cells by aptamer functionalized Pt(IV) prodrug-PLGA-PEG nanoparticles. Proc Natl Acad Sci U S A. 2008;105:17356–17361. doi:10.1073/pnas.0809154105
21. Qiang yuan Z, Liang chen W, Gang You B, et al. Multifunctional nanoparticles co-delivering EZH2 siRNA and etoposide for synergistic therapy of orthotopic non-small-cell lung tumor. J Control Release. 2017;268:198–211. doi:10.1016/j.jconrel.2017.10.025
22. Liu N, Liu H, Chen H, Wang G, Teng H, Chang Y. Polyphotosensitizer nanogels for GSH-responsive histone deacetylase inhibitors delivery and enhanced cancer photodynamic therapy. Colloids Surf B Biointerfaces. 2020;188:110753. doi:10.1016/j.colsurfb.2019.110753
 © 2021 The Author(s). This work is published and licensed by Dove Medical Press Limited. The full terms of this license are available at https://www.dovepress.com/terms.php and incorporate the Creative Commons Attribution - Non Commercial (unported, v3.0) License.
By accessing the work you hereby accept the Terms. Non-commercial uses of the work are permitted without any further permission from Dove Medical Press Limited, provided the work is properly attributed. For permission for commercial use of this work, please see paragraphs 4.2 and 5 of our Terms.
© 2021 The Author(s). This work is published and licensed by Dove Medical Press Limited. The full terms of this license are available at https://www.dovepress.com/terms.php and incorporate the Creative Commons Attribution - Non Commercial (unported, v3.0) License.
By accessing the work you hereby accept the Terms. Non-commercial uses of the work are permitted without any further permission from Dove Medical Press Limited, provided the work is properly attributed. For permission for commercial use of this work, please see paragraphs 4.2 and 5 of our Terms.