")
Back to Journals » Cancer Management and Research » Volume 13
Combination of 99mTc-Labeled PSMA-SPECT/CT and Diffusion-Weighted MRI in the Prediction of Early Response After Carbon Ion Therapy in Prostate Cancer: A Non-Randomized Prospective Pilot Study
Authors Li P, Liu C, Wu S, Deng L, Zhang G, Cai X, Hu S, Cheng J, Xu X , Wu B, Guo X, Zhang Y, Fu S, Zhang Q
Received 3 October 2020
Accepted for publication 21 January 2021
Published 3 March 2021 Volume 2021:13 Pages 2191—2199
DOI https://doi.org/10.2147/CMAR.S285167
Checked for plagiarism Yes
Review by Single anonymous peer review
Peer reviewer comments 3
Editor who approved publication: Dr Eileen O'Reilly
Ping Li,1– 3,* Chang Liu,4– 6,* Shuang Wu,2,3,7 Lin Deng,2,3,8 Guangyuan Zhang,2,3,8 Xin Cai,1– 3 Silong Hu,4– 6 Jingyi Cheng,2,3,6,9 Xiaoping Xu,4– 6 Bin Wu,2,3,10 Xiaomao Guo,2,3,7 Yingjian Zhang,4– 6 Shen Fu,5,11 Qing Zhang1– 3
1Department of Radiation Oncology, Shanghai Proton and Heavy Ion Center, Shanghai, People’s Republic of China; 2Shanghai Key Laboratory of Radiation Oncology, Shanghai, People’s Republic of China; 3Shanghai Engineering Research Center of Proton and Heavy ion Radiation Therapy, Shanghai, People’s Republic of China; 4Department of Nuclear Medicine, Fudan University Shanghai Cancer Center, Shanghai, People’s Republic of China; 5Key Laboratory of Nuclear Physics and Ion-Beam Application (MOE), Fudan University, Shanghai, People’s Republic of China; 6Shanghai Engineering Research Center for Molecular Imaging Probes, Shanghai, People’s Republic of China; 7Department of Radiation Oncology, Shanghai Proton and Heavy Ion Center, Fudan University Cancer Hospital, Shanghai, People’s Republic of China; 8Department of Radiology, Shanghai Proton and Heavy Ion Center, Shanghai, People’s Republic of China; 9Department of Nuclear Medicine, Shanghai Proton and Heavy Ion Center, Fudan University Cancer Hospital, Shanghai, People’s Republic of China; 10Department of Radiology, Shanghai Proton and Heavy Ion Center, Fudan University Cancer Hospital, Shanghai, People’s Republic of China; 11Department of Radiation Oncology, Shanghai Concord Cancer Hospital, Shanghai, People’s Republic of China
*These authors contributed equally to this work
Correspondence: Qing Zhang
Department of Radiation Oncology, Shanghai Proton and Heavy Ion Center, Shanghai, People’s Republic of China
Tel +86 139 1737 4609
Fax +86 2138296518
Email [email protected]
Shen Fu
Department of Radiation Oncology, Shanghai Proton and Heavy Ion Center, Shanghai, People’s Republic of China
Email [email protected]
Purpose: The purpose of this study was to assess the potential of 99mTc-labeled PSMA-SPECT/CT and diffusion-weighted image (DWI) for predicting treatment response after carbon ion radiotherapy (CIRT) in prostate cancer.
Patients and Methods: We prospectively registered 26 patients with localized prostate cancer treated with CIRT. All patients underwent 99mTc-labeled PSMA-SPECT/CT and multiparametric magnetic resonance imaging (MRI) before and after CIRT. The tumor/background ratio (TBR) and mean apparent diffusion coefficient (ADCmean) were measured on the tumor and the percentage changes before and after therapy (ΔTBR and ΔADCmean) were calculated. Patients were divided into two groups: good response and poor response according to clinical follow-up.
Results: The median follow up time was 38.3months. The TBR was significantly decreased (p=0.001), while the ADCmean was significantly increased compared with the pretreatment value (p< 0.001). The ΔTBR and ΔADCmean were negatively correlated with each other (p = 0.002). On ROC curve analysis for predicting treatment response, the area under the ROC curve (AUC) of ΔTBR (0.867) for predicting good response was higher than that of ΔADCmean (0.819). The AUC of combined with ΔTBR and ΔADCmean (0.895) was higher than that of either ΔADCmean or ΔTBR alone. The combined use of ΔTBR and ΔADCmean showed 91.4% sensitivity and 95.2% specificity.
Conclusion: Our preliminary data indicate that the changes of TBR and ADCmean maybe an early bio-marker for predicting prognosis after CIRT in localized prostate cancer patients. In addition, the ΔTBR seems to be a more powerful prognostic factor than ΔADCmean in prostate cancer treated with CIRT.
Keywords: PSMA, DWI, prostate cancer, carbon ion radiotherapy
Introduction
External beam radiotherapy (EBRT) is commonly used as a curative strategy for man diagnosed with localized prostate cancer. Because there are some critical organs at risk (OARs) surrounding the prostate, it is very difficult to deliver a high dose to prostate while minimizing the radiation dose to the adjacent OARs, such as, rectum and bladder. Carbon ion radiotherapy (CIRT) is considered to be the most advanced and promising radiotherapy technique. The physical and biological advantage of carbon ion that allow for the application of a high dose to the prostate while maintaining a steep gradient to the surrounding normal tissue.1 Shanghai Proton and Heavy Ion Center (SPHIC) started CIRT for prostate cancer in 2014. Until November 2019, there are more than 200 prostate cancer patients have been treated at our center. However, CIRT is a novel and to date not thoroughly investigated technique. Until now, there are only about 3000 patients with prostate cancer received CIRT around the world.2,3 So, the experience for CIRT is very limited for prostate cancer. In addition, Prostate cancer often has a long natural history, it often takes a decade or more to judge the therapeutic efficacy of prostate cancer. An early prediction of treatment response may allow for therapeutic optimization; such as radiation dose modification. Thus, we assessed whether molecular imaging can act as an early predictive tool for these patients’ outcome after CIRT.
Prostate-specific membrane antigen (PSMA), a unique membrane-bound type II glycoprotein, is known to be over-expressed in almost all prostate cancer cells, with only 5–10% primary prostate cancer not having PSMA expression.4 PSMA-targeted molecular imaging have been approved to be a better diagnostic tool in patients with prostate cancer than conventional imaging.5 However, the clinical data focusing on the predictive value of PSMA imaging for primary localized prostate cancer patients treated with radiotherapy (especially CIRT) was limited. In addition, our primary study shown that apparent diffusion coefficient (ADC) vales may be an useful imaging bio-marker for early assessment of therapeutic response of prostate cancer to CIRT.6
To our knowledge, there were limited studies addressed the relationship between PSMA targeted imaging and diffusion-weighted image (DWI) of prostate cancer.7 And there was no data comparing the predictive value of these two functional imaging for prostate cancer patients underwent CIRT. Therefore, we designed a prospective clinical trial to evaluate and compare the potential value of 99mTc-labeled PSMA-single photon emission computed tomography/computed tomography (SPECT/CT) and DWI for predicting outcome after CIRT in prostate cancer.
Patients and Methods
Patients
This study was a Phase I study evaluating the CIRT for localized prostate cancer in dose escalation at SPHIC. Prior to screening procedures and treatment, signed informed consent was obtained from all patients. This trial is registered with ClinicalTrials.gov, number NCT02739659.
Eligible men were required to be aged 20–85 years and have Karnofsky Performance Score ≥70, pathologically confirmed adenocarcinoma of the prostate. And localized patients (T1-4 N0 M0, AJCC 7th) without pelvic lymph nodes or distant metastasis planned for CIRT were eligible for this study. PSMA-SPECT/CT and MRI examinations were conducted at two time points: before and immediately (1 week after the last irradiation) after CIRT. And the interval between SPECT/CT and MRI examination was less than one week. Men who had received prior chemotherapy or radioisotopes for prostate cancer were excluded. The study protocol was approved by Shanghai Proton and Heavy Ion Center Review Committee (No.1510-03-02-1907A). The study was conducted in accordance with the Declaration of Helsinki.
Radiopharmaceuticals and SPECT/CT Imaging Protocols
This small-molecular inhibitor of PSMA, 6-hydrazinonicotinate-Aminocaproic acid-Lysine-Urea-Glutamate (HYNIC-ALUG) was radiolabeled by 99mTc as described previously.8 The prepared radiotracer was injected into patient within 1 h of preparation. Patients underwent 99mTc-HYNIC-PSMA SPECT/CT using a rotating, large field-of-view gamma camera (Discovery NM/CT 670, General Electric Medical Systems, Waukesha, WI) at 120 min after tracer injection of 750 MBq 99mTc-HYNIC-PSMA.
MRI Acquisition
All MRI examinations were performed using a 3-T MR system (Magnetom Skyra Siemens) equipped with a phased-array coil at SPHIC. T1-weighted, T2-weighted, and DWI sequences were acquired, but only DWI sequence was used for analysis in this study. The following imaging parameters were used: TR range/TE range, 7300/60; slice thickness, 3.5 mm; inter-slice gap, 0 mm; matrix, 126 × 140; FOV, 200 mm; GRAPPA factor, 3; and b values, 0 and 800 s/mm2. Parametric maps of ADC values were automatically measured by the image software with the use of the two b values.
Images Analysis
SPECT/CT image readout was performed on a work Station and software (Xeleris, General Electric, Waukesha, WI). Two board-certified specialists in nuclear medicine, who blinded to patient-related medical data, independently read all datasets and resolved any disagreements by consensus. Areas of abnormal tracer uptake within the prostate gland were determined and recorded. For semi-quantitative analysis, the tumor/background ratio (TBR) was calculated for each visually detected lesion or other tissue within each lobe (right/left) of the prostate using the quotient of maximal counts within a circular region-of-interest and mean counts within the obturator muscle.9
Similarly, all acquired MRI was analyzed and interpreted by two radiologists independently using the manufacturer supplied software (Simens Healthcare). For calculating the mean ADC (ADCmean) value of tumor, the region of interest (ROI) was manually drawn by two radiologists on single axial image where the tumor shows the maximum dimension. If the two readers disagreed about the exact tumor localization on the MR images, consensus was reached using information from SPECT/CT image or pathological results of biopsies.
To assess the changes of TBR and ADC values after CIRT, percentage changes in TBR and ADCmean were calculated by the following equation: ΔTBR (%) = [(preTx TBR - postTx TBR)/preTx TBR] × 100; ΔADC (%) =[(preTx ADCmean - postTx ADCmean)/preTx ADCmean] × 100.
Carbon Ion Radiotherapy
The radiation dose was 59.2Gy (relative biological effectiveness, RBE)/16Fx with carbon ion only, and the clinical target volume (CTV) consisted of the prostate and seminal vesicle but not the pelvic lymph nodes. Combined androgen blockade (CAB) was concurrently administered to the all patients. Patients with intermediate risk received CAB for about 6 months, and high/very high-risk patients received CAB for 2–3 years.
Evaluations of Patient Outcomes
After the treatments, these patients were followed up every 3 months. Physical examinations and prostate specific antigen (PSA) were performed at each visit. Naik’s report10 showed that 6 months post-treatment PSA >0.1 ng/mL in prostate cancer patients treated with EBRT was associated with worse biochemical relapse free survival (bRFS), distant metastasis free survival (DMFS), and prostate cancer specific mortality (PCSM). Therefore, clinical outcomes were divided into two groups: good response (PSA≤0.1ng/mL at 6 months after therapy) and poor response (PSA > 0.1ng/mL at 6 months after therapy).
Statistical Analysis
The data were analyzed using SPSS statistical software (version 22.0; IBM Corp.). All continuous variables were tested for normal distribution using the Kolmogorov–Smirnov test. Clinical data and parametric data from images were compared using the χ2 test for categorical data, the Student t test for continuous data, and the Mann–Whitney test for nonparametric analysis. We calculated the Spearman rank-order correlation coefficient to characterize correlation strength between imaging features (TBR and ADCmean) and clinical features (GS, PSA). The correlation between percentage change in TBR (ΔTBR) and ADCmean (ΔADCmean) were also evaluating using the Spearman correlation coefficient. We used receiver-operating - characteristic (ROC) curves and calculated areas under the curves (AUCs) for each parameter. The combinations of parameters that distinguished good responders from poor responders were tested by multi-ROC curve analysis. For all statistical comparisons, a p value of less than 0.05 was considered significant.
Results
Clinical Characteristics and Treatment Outcomes
A total of 30 consecutive patients with biopsy confirmed prostate cancer being considered for CIRT were prospectively recruited at SPHIC between Apr. 2016 and Mar. 2017. Of them, 4 patients were excluded due to not performed PSMA-SPECT/CT before or after CIRT. Finally, 26 patients with localized prostate cancer, who completely received the CIRT and had adequate 99mTc-labeled PSMA-SPECT/CT and multiparametric MRI image information at our institution were analyzed in this study.
The characteristics of the 26 patients are summarized in Table 1. The median age was 66.5 (Inter Quartile Range, IQR: 58.8–72.8). A total of 8 patients had intermediate risk, 9 patients had high risk and 9 patients had very high risk of prostate cancer. The median PSA level among patients before CIRT was 7.09 ng/mL (IQR: 1.16–9.37 ng/mL), and the median PSA level decreased to 1.65 ng/mL (IQR: 0.17–3.80 ng/mL) after CIRT.
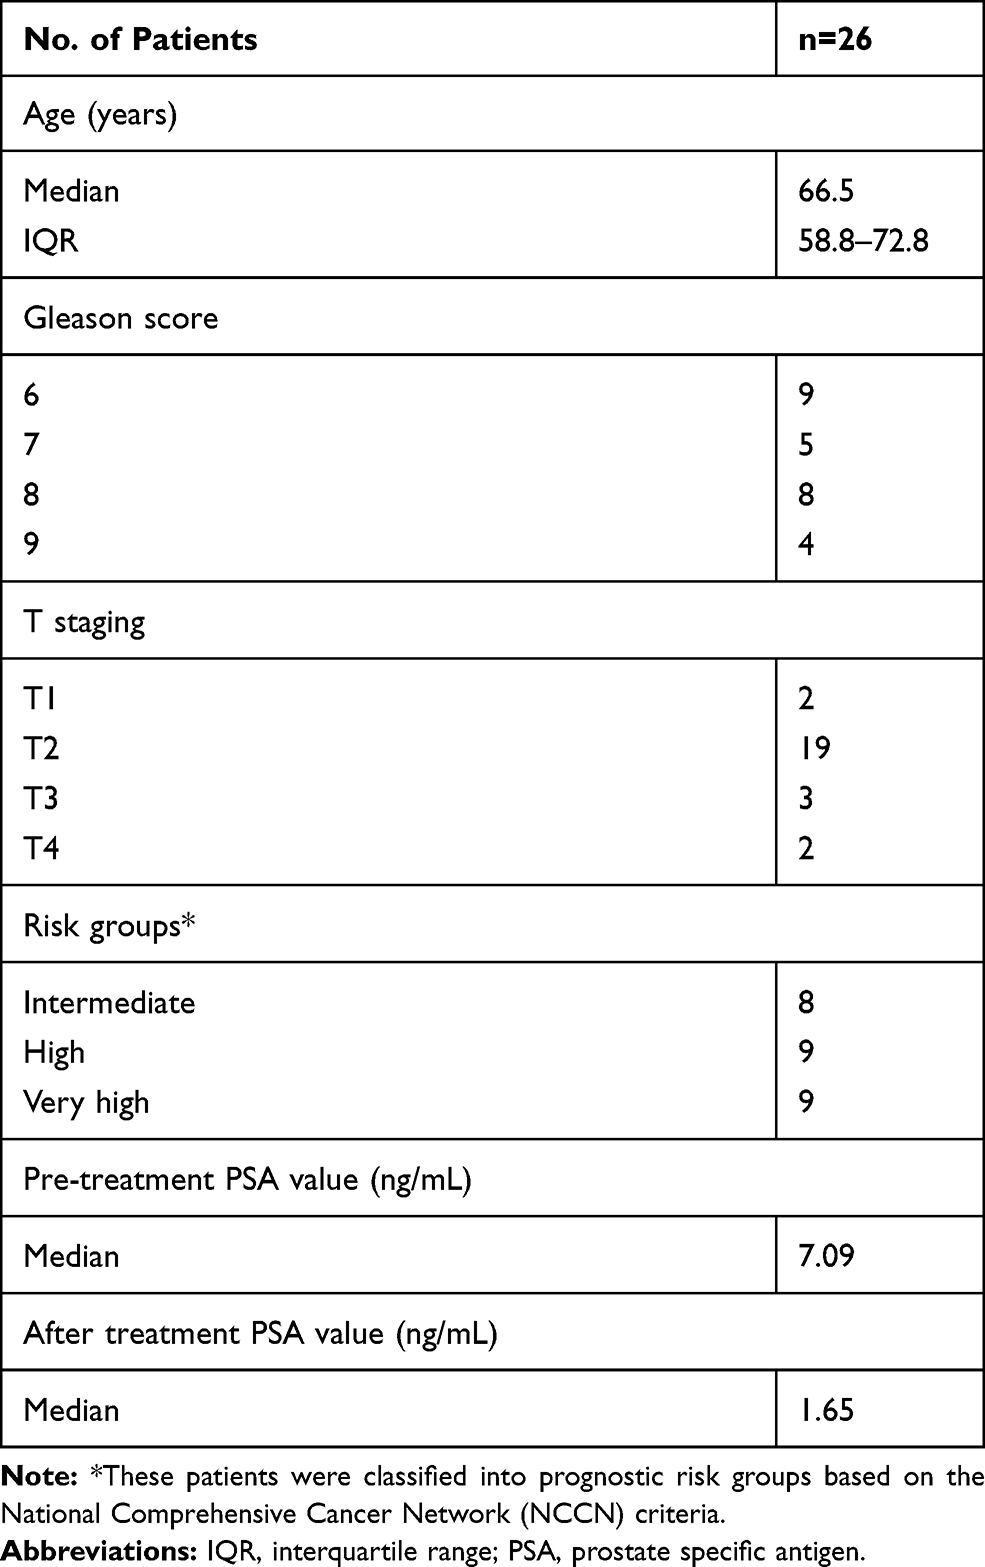 |
Table 1 The Clinical Characteristics of All the Patients |
All of the patients completed their CIRT without any problem. After a median follow up of 38.3 months (IQR 25.7–31.4 months), 21 of the 26 (80.77%) patients were evaluated as good response, whereas 5 (19.23%) patients were poor response. At the time of analysis, 1 patient evaluated as good response died due to cerebrovascular accident, and 1 patient evaluated as poor response died due to pulmonary infection. 1 patient evaluated as poor response developed into biochemical recurrence (Phoenix consensus). And another patient with poor response developed bone metastases. In addition to the above mentioned patients, other patients remained alive and disease-free.
TBR and ADCmean
Before CIRT, TBR significantly correlated with baseline PSA (correlation coefficient r = 0.588; p = 0.002). However, there was no correlation between ADCmean and baseline PSA (correlation coefficient r = −0.167; p = 0.415). There was no significant difference of TBR (p = 0.128) and ADCmean (p = 0.991) among different Gleason score groups.
After CIRT, the mean TBR of the 26 patients significantly decreased from 15.183 ± 14.703 to 5.503 ± 3.096 (p = 0.001). And the ADCmean value increased from 0.771 × 10⁻³ ± 0.204 × 10⁻³ mm2/s to 1.172 × 10⁻³ ± 0.154 × 10⁻³ mm2/s (p < 0.001). In addition, there was an inverse correlation between TBR and ADCmean before CIRT (Spearman correlation coefficient, −0.488; p = 0.011). But there was no correlation between TBR and ADCmean after CIRT (Spearman correlation coefficient, 0.005; p = 0.980).
Table 2 presents the results of quantitative parameters of PSMA and DWI before and after CIRT with the two groups. Before CIRT, there were no significant difference in TBR (p = 0.200) and ADCmean (p = 0.138) between good responders and poor responders. And after CIRT, there were still no significant difference in ADCmean (p = 0.374) between good responders and patients with poor responders. But there was significant difference in TBR between the two groups after CIRT (p = 0.019). There was no significant difference in treatment response between Patient with low GS (6–7) and high GS (8–9) (p=0.091). Significant differences were also not observed for risk classification based on the National Comprehensive Cancer Network (NCCN) criteria (p=0.413)
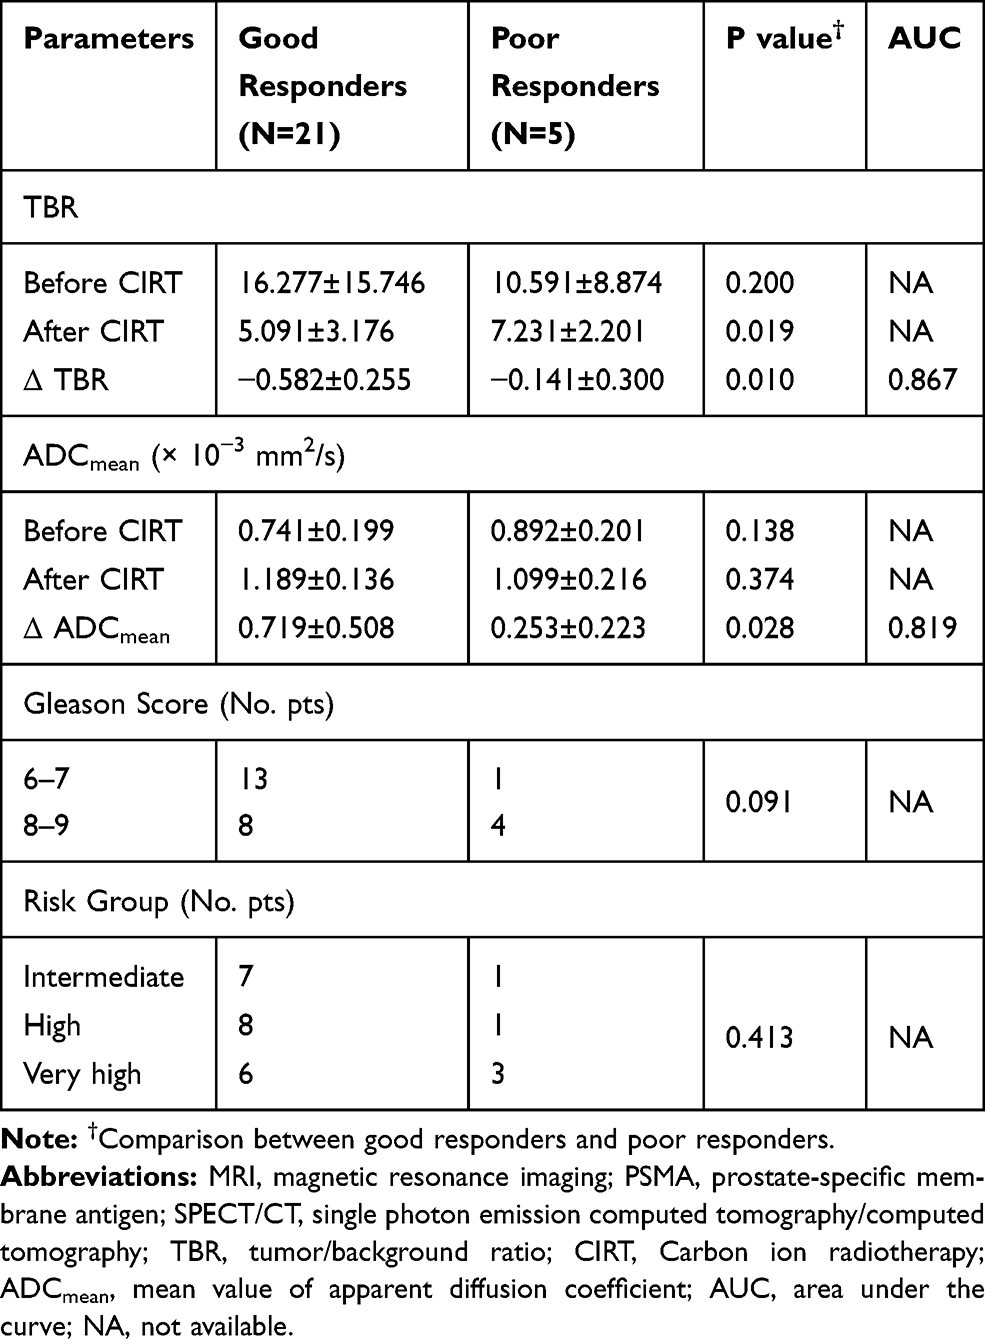 |
Table 2 Comparison of MRI, PSMA-SPECT/CT and Clinical Parameters Between Good Responders and Poor Responders |
The ΔTBR and ΔADCmean
In a subgroup of patients with good response, the mean TBR significantly decreased from 17.688 ± 16.484 to 6.122 ± 3.605 (p=0.003), and the ADCmean significantly increased from 0.715 ± 0.200 × 10⁻³ mm2/s to 1.186 ± 0.169 × 10⁻³ mm2/s (p<0.001), after CIRT. In another subgroup of patients with poor response, the ADCmean also increased from 0.892 ± 0.201 × 10⁻³ mm2/s to 1.099 ± 0.216 × 10⁻³ mm2/s (p=0.038). However, there was no significant difference between TBR before (10.591 ± 8.875) and after (7.231 ± 2.201) CIRT (p=0.325) (Figure 1). The ΔTBR and ΔADCmean were negatively correlated with each other (Spearman correlation coefficient, −0.586; p = 0.002) (Figure 2).
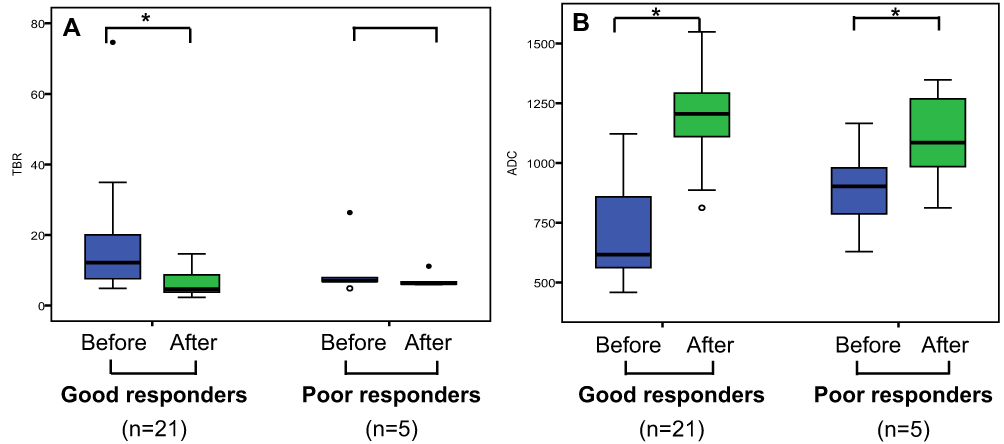 |
Figure 1 TBR (A) and ADC (B) changes after CIRT of good responders and poor responders. *p< 0.05. |
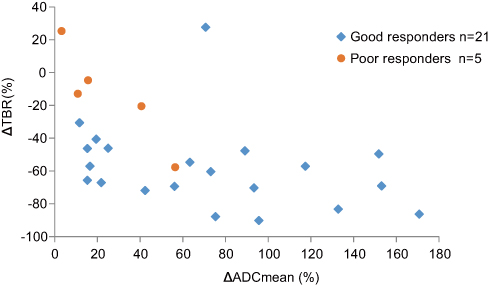 |
Figure 2 Scatter-plot showing relationship between Δ TBR and Δ ADCmean after CIRT. |
On ROC curve analysis for predicting treatment response, the AUC of ΔTBR (0.867, 95% confidence interval [CI], 0.686, 1.000) for predicting good response was higher than ΔADCmean (0.819, 95% confidence interval [CI], 0.631, 1.000). The optimal cutoff for distinguishing good response from poor response in the ROC analysis were ΔTBR < −25.5% and ΔADCmean > 59.9%, respectively. And ΔTBR showed 80.0% sensitivity and 95.2% specificity, and ΔADCmean showed 57.1% sensitivity and 100% specificity for predicting good response using these criteria.
The AUC of combined with ΔTBR and ΔADCmean (0.895, 95% confidence interval [CI], 0.747, 1.000) was higher than that of either ΔADCmean or ΔTBR alone. The combined use of ΔTBR and ΔADCmean showed 91.4% sensitivity and 95.2% specificity (Figure 3).
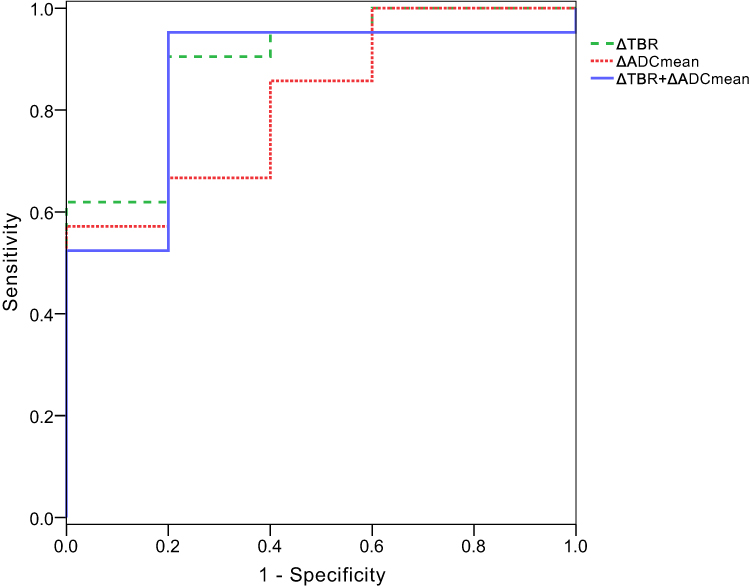 |
Figure 3 ROC curves used to evaluate good response to CIRT with Δ TBR, Δ ADCmean and combined used of Δ TBR and Δ ADCmean, AUC of Δ TBR (0.867) was higher than that of Δ ADCmean (0.819). AUC increased with combined used of Δ TBR and Δ ADCmean (0.895). |
Discussion
Our study demonstrated that ΔTBR and ΔADCmean after CIRT were negatively correlated. And both of them provide a noninvasive imaging biomarker for the early assessment of treatment response (Figures 4 and 5). In addition, the ΔTBR was a more powerful prognostic factor than ΔADCmean in prostate cancer treated with CIRT. The combined use of ΔTBR and ΔADCmean served to better distinguish the good responders from poor responders.
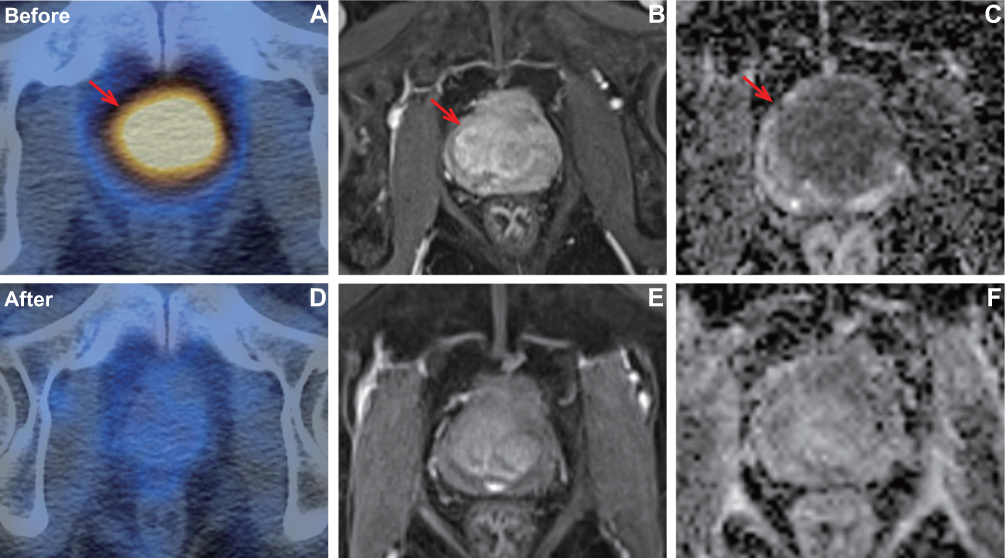 |
Figure 4 A patient with pathology confirmed prostate cancer of Gleason score 4+4 (T3bN0M0, very high risk) who showed good response after CIRT. PSMA uptake (A) was visualized on the prostate with TBR of 34.9. After CIRT, the SPECT/CT (D) showed PSMA uptake was significantly decreased with TBR of 3.4. Axial T1 weighted MRI showed the tumor before (B) and after (E) CIRT. In baseline ADC map (C), ADCmean was 0.616×10⁻³ mm2/s. In post CIRT ADC map (F), ADCmean was 1.205 × 10⁻³ mm2/s. |
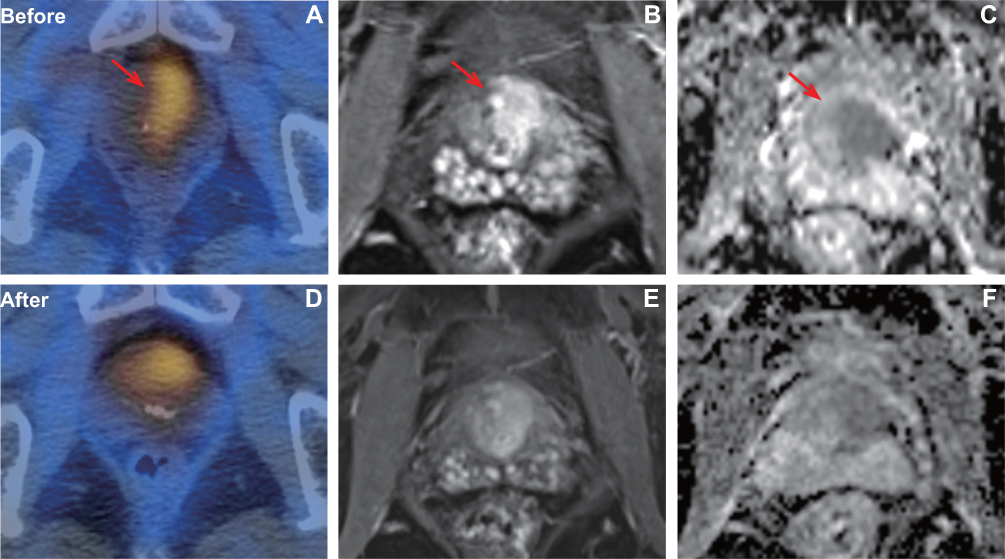 |
Figure 5 A patient with pathology confirmed prostate cancer of Gleason score 5+4 (T3aN0M0, very high risk) who showed poor response after CIRT. PSMA uptake (A) was visualized on the prostate with TBR of 4.87. After CIRT, the PSMA (D) uptake was still visualized on the prostate (TBR, 3.4). Axial T1 weighted MRI showed the tumor before (B) and after (E) CIRT. In baseline ADC map (C), ADCmean was 0.787× 10⁻³ mm2/s. In post CIRT ADC map (F), ADCmean was 0.812 × 10⁻³ mm2/s. |
PSMA-based molecular imaging has rapidly emerged as a potential new standard of care for imaging prostate cancer, with images demonstrating relevant protein expression levels.11 It is reported that PSMA expression is a relevant factor for tumor aggressiveness.12 However, it is still unclear whether a receptor-targeting radiopharmaceutical, instead of a metabolic tracer, would have the same value for treatment response monitoring in prostate cancer.13 Seitz’s preliminary results concluded that the concordance rate was high between biochemical response and 68Ga-PSMA PET/CT response in patients with metastatic prostate cancer undergoing chemotherapy.14 Similar results were confirmed in another study15 using 99mTc-MIP-1404 SPECT/CT, suggesting a possible role of that imaging tool for monitoring treatment in metastatic prostate cancer. However, these clinical studies were all focused on metastatic prostate cancer. There is no data reported in literature for the prediction of radiotherapy response in primary prostate cancer with PSMA ligands imaging. Although PSMA imaging has been used in prostate cancer radiotherapy, they always research whether this novel nuclear imaging modality can be used to direct a local boost to the lesions or to plan salvage radiotherapy.16,17 Therefore, we designed a prospective clinical trial to explore the value of PSMA imaging in the early evaluation of CIRT and got very good results. The results showed that TBR significantly correlated with baseline PSA (p=0.002). Schmidkonz’s study showed that PSMA-SPECT/CT demonstrated a high performance in detecting PSMA-positive lesions in patients of prostate cancer with low (0.5–1ng/mL) and very low (0.2–0.5ng/mL) serum PSA levels. So, PSMA-SPECT/CT is a good indicator of tumor activity even at low PSA levels.18 SPECT/CT The change of TBR significantly decreased in the patients with good response (p=0.003), but not in the patients with poor response (p=0.325). Moreover, ΔTBR showed very high sensitivity (80.0%) and specificity (95.2%) in predicting the response of carbon ion radiotherapy. These indicated that the 99mTc-labeled PSMA-SPECT/CT could serve as an early biomarker for predicting prognosis after CIRT and influence planned clinical management in a high proportion of patients with prostate cancer.
Our previous study showed that the mean ADC value of prostate tumor was significantly increased after CIRT.6 In a similar study, Wolf et al19 also found that particle therapy induced a measurable and continuous increase in the ADC value of prostate cancer during and after therapy. In this study, the change in tumor of the ADC value after CIRT were consistent with these previous studies. The increase of ADC value after CIRT likely indicates the alterations in water diffusivity due to necrosis and apoptotic-induced cell death.
Positron Emission Tomography/Computed Tomography (PET/CT) and DWI have complementary roles in the assessment of prostate cancer.20 Recently, combined PET/MRI imaging systems have been explored in the clinic, and literature describing the initial experiences with PSMA - PET/MRI imaging in prostate cancer is already available.21 However, relatively little early date is available regarding PSMA-PET and MRI for assessment of therapeutic response in prostate cancer. In this study, the TBR was inversely correlated with ADCmean before CIRT, however, there was no correlation between TBR and ADCmean after CIRT. Interestingly, the ΔTBR and ΔADCmean were negatively correlated with each other. Consistent with our data, previous studies in osteosarcoma have shown a significant negative correlation between ΔSUV (standard uptake value) and ΔADCmean after chemotherapy.22 This is partly explainable because the different effectiveness of treatment influenced by radiosensitivity or chemosensitivity between these patients. Effective treatment may substantially increase tumor necrosis and apoptosis. Accordingly, greater changes of both ADC and TBR/SUV values after treatment potentially suggest that the tumors are more sensitive to treatment.
Prostate cancer often has a long natural history, so it can take many years to determine whether a new treatment strategy for prostate result in improved prostate cancer patients’ survival. Currently, PSA is the only prostate cancer biomarker applied clinically, but it does not perform well in the early distinguishing between good and poor outcome treated with radiotherapy. Combined use of 99mTc-labeled PSMA-SPECT/CT and DWI imaging modalities can provide various biological information and thus may overcome the limitations of PSA. The higher predictive power achieved by a combination of DWI and 99mTc-labeled PSMA-SPECT/CT parameters enable early predict the treatment response and then optimize the prescription dose, fraction size or hormone therapy during time. Our study also indicated that PSMA high expressed area is potential biological target volume for radiotherapy dose escalation in the future.
In this study, endocrine therapy combined with CIRT should be taken into account. All of those patients in our study were concurrently treated endocrine therapy with CIRT. So the change of these image findings might contribute to endocrine therapy beyond the CIRT. However, in our clinical practice, Dose-escalated radiotherapy RT with endocrine therapy is a standard definitive treatment of localized prostate cancer. So our results still have clinical implication.
There were several limitations in our study. First, the number of enrolled patients was relatively small and the follow-up duration was short. The short follow up of 38.3 months is not sufficient to identify the true recurrent patients with Phoenix criteria. Primary study10 showed that 6 months post-treatment PSA >0.1 ng/mL in prostate cancer patients treated with concurrent radiotherapy is associated with worse bRFS, DMFS, and PCSM. Therefore, our study use PSA response at 6 months after therapy as our clinical outcome endpoint instead of biochemical relapse free survival or overall survival rate. Meanwhile, by the date of follow-up, 2 of the 5 patients in the poor response group had progressed, 1 patient had biochemical recurrence and another one had bone metastasis. These results indicated that this surrogate endpoint was credible. A future study with larger population and longer follow-up is necessary for validating our preliminary results. Second, we investigated the utility of tumor ADCmean and TBR out of many quantitative imaging parameters (10th percentile ADC, SUV et al). Third, there is no standard method for measuring the ADC value of prostate cancer,23 and we did not compare different methods in current study.
Conclusions
In this clinical situation, both 99mTc-labeled PSMA-SPECT/CT and DWI seems to be useful for predicting therapeutic response after CIRT in prostate cancer. The combined use of ΔTBR and ΔADCmean maybe served to better distinguish the good responders from poor responders. Further prospective studies are warranted to confirm our findings.
Data Sharing Statement
The data that support the findings of this study are available from the corresponding author upon reasonable request.
Acknowledgments
We would like to thank the participating patients. This article has drawn on a program of research funded by the National Key Research and Development Program of China (2017YFC0107600), National Natural Science Foundation of China (81773225), Pudong New area science and technology development foundation (PKJ2016-Y43), Shanghai Municipal Health commission (201940121).
Disclosure
The authors report no conflicts of interest in this work.
References
1. Schulz-Ertner D, Tsujii H. Particle radiation therapy using proton and heavier ion beams. J Clin Oncol. 2007;25:953–964. doi:10.1200/JCO.2006.09.7816
2. Nomiya T, Tsuji H, Kawamura H, et al. A multi-institutional analysis of prospective studies of carbon ion radiotherapy for prostate cancer: a report from the Japan Carbon ion Radiation Oncology Study Group (J-CROS). Radiother Oncol. 2016;121:288–293. doi:10.1016/j.radonc.2016.10.009
3. Habl G, Uhl M, Katayama S, et al. Acute toxicity and quality of life in patients with prostate cancer treated with protons or carbon ions in a prospective randomized Phase II study–the IPI trial. Int J Radiat Oncol Biol Phys. 2016;95:435–443. doi:10.1016/j.ijrobp.2016.02.025
4. Schwarzenboeck SM, Rauscher I, Bluemel C, et al. PSMA ligands for PET imaging of prostate cancer. J Nucl Med. 2017;58:1545–1552. doi:10.2967/jnumed.117.191031
5. Sawicki LM, Kirchner J, Buddensieck C, et al. Prospective comparison of whole-body MRI and 68Ga-PSMA PET/CT for the detection of biochemical recurrence of prostate cancer after radical prostatectomy. Eur J Nucl Med Mol Imaging. 2019;46:1542–1550. doi:10.1007/s00259-019-04308-5
6. Qi WX, Zhang Q, Li P, et al. The predictive role of ADC values in prostate cancer patients treated with carbon-ion radiotherapy: initial clinical experience at Shanghai Proton and Heavy Ion Center (SPHIC). J Cancer Res Clin Oncol. 2016;142:1361–1367. doi:10.1007/s00432-016-2142-3
7. Hicks RM, Simko JP, Westphalen AC, et al. Diagnostic accuracy of 68Ga-PSMA-11 PET/MRI compared with multiparametric MRI in the detection of prostate cancer. Radiology. 2018;289:730–737. doi:10.1148/radiol.2018180788
8. Xu X, Zhang J, Hu S, et al. 99mTc-labeling and evaluation of a HYNIC modified small-molecular inhibitor of prostate-specific membrane antigen. Nucl Med Biol. 2017;48:69–75. doi:10.1016/j.nucmedbio.2017.01.010
9. Goffin KE, Joniau S, Tenke P, et al. Phase 2 Study of 99mTc-trofolastat SPECT/CT to identify and localize prostate cancer in intermediate- and high-risk patients undergoing radical prostatectomy and extended pelvic LN dissection. J Nucl Med. 2017;58:1408–1413. doi:10.2967/jnumed.116.187807
10. Naik M, Reddy CA, Stephans KL, et al. Posttreatment prostate-specific antigen 6 months after radiation with androgen deprivation therapy predicts for distant metastasis-free survival and prostate cancer-specific mortality. Int J Radiat Oncol Biol Phys. 2016;96:617–623. doi:10.1016/j.ijrobp.2016.07.009
11. Perera M, Papa N, Roberts M, et al. Gallium-68 prostate-specific membrane antigen positron emission tomography in advanced prostate cancer-updated diagnostic utility, sensitivity, specificity, and distribution of prostate-specific membrane antigen-avid lesions: a systematic review and meta-analysis. Eur Urol. 2020;77(4):403–417. doi:10.1016/j.eururo.2019.01.049
12. Caromile LA, Dortche K, Rahman MM, et al. PSMA redirects cell survival signaling from the MAPK to the PI3K-AKT pathways to promote the progression of prostate cancer. Sci Signal. 2017;10(470):eaag3326. doi:10.1126/scisignal.aag3326
13. Ceci F, Herrmann K, Hadaschik B, et al. Therapy assessment in prostate cancer using choline and PSMA PET/CT. Eur J Nucl Med Mol Imaging. 2017;44:78–83. doi:10.1007/s00259-017-3723-3
14. Seitz AK, Rauscher I, Haller B, et al. Preliminary results on response assessment using (68)Ga-HBED-CC-PSMA PET/CT in patients with metastatic prostate cancer undergoing docetaxel chemotherapy. Eur J Nucl Med Mol Imaging. 2018;45:602–612. doi:10.1007/s00259-017-3887-x
15. Schmidkonz C, Cordes M, Beck M, et al. Assessment of treatment response by 99mTc-MIP-1404 SPECT/CT: a pilot study in patients with metastatic prostate cancer. Clin Nucl Med. 2018;43:e250–e258. doi:10.1097/RLU.0000000000002162
16. Thomas L, Kantz S, Hung A, et al. 68Ga-PSMA-PET/CT imaging of localized primary prostate cancer patients for intensity modulated radiation therapy treatment planning with integrated boost. Eur J Nucl Med Mol Imaging. 2018;45:1170–1178. doi:10.1007/s00259-018-3954-y
17. Calais J, Czernin J, Cao M, et al. 68Ga-PSMA-11 PET/CT mapping of prostate cancer biochemical recurrence after radical prostatectomy in 270 patients with a PSA level of less than 1.0 ng/mL: impact on salvage radiotherapy planning. J Nucl Med. 2018;59:230–237. doi:10.2967/jnumed.117.201749
18. Schmidkonz C, Goetz TI, Kuwert T, et al. PSMA SPECT/CT with 99mTc-MIP-1404 in biochemical recurrence of prostate cancer: predictive factors and efficacy for the detection of PSMA-positive lesions at low and very-low PSA levels. Ann Nucl Med. 2019;33:891–898. doi:10.1007/s12149-019-01400-6
19. Wolf MB, Edler C, Tichy D, et al. Diffusion-weighted MRI treatment monitoring of primary hypofractionated proton and carbon ion prostate cancer irradiation using raster scan technique. J Magn Reson Imaging. 2017;46:850–860. doi:10.1002/jmri.25635
20. Chen M, Zhang Q, Zhang C, et al. Combination of 68Ga-PSMA PET/CT and multiparameter MRI improves the detection of clinically significant prostate cancer: a lesion by lesion analysis. J Nucl Med. 2019;60:944–949. doi:10.2967/jnumed.118.221010
21. Grubmüller B, Baltzer P, Hartenbach S, et al. PSMA ligand PET/MRI for primary prostate cancer: staging performance and clinical impact. Clin Cancer Res. 2018;24:6300–6307. doi:10.1158/1078-0432.CCR-18-0768
22. Byun BH, Kong CB, Lim I, et al. Combination of 18F-FDG PET/CT and diffusion-weighted MR imaging as a predictor of histologic response to neoadjuvant chemotherapy: preliminary results in osteosarcoma. J Nucl Med. 2013;54:1053–1059. doi:10.2967/jnumed.112.115964
23. Donati OF, Mazaheri Y, Afaq A, et al. Prostate cancer aggressiveness: assessment with whole-lesion histogram analysis of the apparent diffusion coefficient. Radiology. 2014;271:143–152. doi:10.1148/radiol.13130973
 © 2021 The Author(s). This work is published and licensed by Dove Medical Press Limited. The full terms of this license are available at https://www.dovepress.com/terms.php and incorporate the Creative Commons Attribution - Non Commercial (unported, v3.0) License.
By accessing the work you hereby accept the Terms. Non-commercial uses of the work are permitted without any further permission from Dove Medical Press Limited, provided the work is properly attributed. For permission for commercial use of this work, please see paragraphs 4.2 and 5 of our Terms.
© 2021 The Author(s). This work is published and licensed by Dove Medical Press Limited. The full terms of this license are available at https://www.dovepress.com/terms.php and incorporate the Creative Commons Attribution - Non Commercial (unported, v3.0) License.
By accessing the work you hereby accept the Terms. Non-commercial uses of the work are permitted without any further permission from Dove Medical Press Limited, provided the work is properly attributed. For permission for commercial use of this work, please see paragraphs 4.2 and 5 of our Terms.