")
Back to Archived Journals » Hypoxia » Volume 4
Combination effects of sorafenib with PI3K inhibitors under hypoxia in colorectal cancer
Authors Bhatia DR , Thiagarajan P
Received 22 June 2016
Accepted for publication 26 August 2016
Published 8 December 2016 Volume 2016:4 Pages 163—174
DOI https://doi.org/10.2147/HP.S115500
Checked for plagiarism Yes
Review by Single anonymous peer review
Peer reviewer comments 3
Editor who approved publication: Prof. Dr. Dörthe Katschinski
Dimple R Bhatia, Padma Thiagarajan
School of Biosciences and Technology, Vellore Institute of Technology University, Vellore, Tamil Nadu, India
Aim: This study reports the influence of hypoxia on response of colorectal cancer cells to anticancer effects of sorafenib in combination with PI3K inhibitors GDC-0941 and BEZ-235.
Materials and methods: All hypoxic exposures were carried out at 1% O2/5% CO2. Antiproliferation activity was evaluated by 48 hours propidium iodide and 14 days clonogenic assay. Protein levels were evaluated by fluorescence ELISA. Metabolites lactate and glucose were evaluated biochemically.
Results: In the 48-hour proliferation assay, sorafenib acted synergistically with GDC-0941 but not with BEZ-235. In long-term colony-forming assays, both GDC-0941 and BEZ-235 were shown to potentiate the antiproliferative activity of sorafenib. At the molecular level, the synergism is mediated through inhibition of pAKT, pS6, p4EBP1, pERK, cyclin D1, and Bcl-2. No change in hypoxia-inducible factor-1α (HIF-1α) levels was observed in cells treated with the combination of compounds under hypoxia. A significant reduction in glucose uptake and lactate release was observed in cells treated with the combination of compounds under normoxia and hypoxia.
Conclusion: Combinations of sorafenib with PI3K inhibitors BEZ-235 and GDC-0941 are efficacious under hypoxia. Thus, these anticancer combinations have a potential to overcome the hypoxia-mediated resistance mechanisms to antiproliferative agents in cancer therapy.
Keywords: GDC-0941, BEZ-235, anticancer, antiproliferation
Introduction
“Hypoxia”, defined as tumor microenvironment of oxygen levels <20%, is a universal finding in all solid tumors. Cancer cells are unresponsive to conventional therapies under chronic hypoxia. Due to variable oxygen supply, subregions with varying oxygen concentrations build up in tumors resulting in tumor heterogeneity.1,2 The influence of hypoxia in tumor biology is observed in the form of selection of genotypes favoring survival under hypoxia, augmented receptor tyrosine kinase (RTK) signaling, suppression of apoptosis, and alteration in central metabolism that favors the Warburg effect.3,4 Hypoxia also influences the therapeutic outcome and is associated with increased tumor resistance to chemotherapy and radiation treatment.5 An increase in lactate production due to increased levels of GLUTs, MCTs, and CAIX secretion under hypoxia leads to an acidic microenvironment that facilitates metastasis.6,7
Hypoxia-inducible factor-1α (HIF-1α) is one of the most important transcription factors mediating adaptation response to hypoxia and a regulator of gene products during hypoxia.8,9 It is a significant modulator of RTK-mediated signaling cascades, namely, PI3K and Ras–Raf pathways. PI3K pathway is hyperactivated under hypoxia. Low PTEN levels are associated with increased HIF-1α transcriptional activity.10–12 mTORC1 is a positive regulator of HIF-1α promoting its cap-dependent translation through the 4EBP1–eIF4 axis.13 Regulation of mTOR kinase activity under hypoxia is mediated by HIF-1α transcribed gene REDD1. In addition, TSC1/2 is also inhibited in hypoxia through BNIP3, which is transcriptionally induced under hypoxia via the HIF-1α.14
The Ras/Raf/ERK pathway is a major signal transduction pathway regulating HIF-1α.15 Activation of the Ras/Raf pathway is associated with regulation of HIF-1α at transcriptional and translational levels.16 ERK sequesters the NES region of HIF-1α through phosphorylation, thus preventing the NES–CRM1 binding. The resultant accumulation of HIF-1α in the nucleus leads to subsequent increase in its transcriptional activity.17 DUSP6 induced by hypoxia negatively regulates ERK through phosphatase activity.18
RTK signaling is hyperactivated in a hypoxic microenvironment. Drug sensitivity is influenced by hypoxia-mediated tumor alteration.19 Whether sensitivity of RTK signaling pathway inhibitors, namely, sorafenib and PI3K inhibitors, alone or in combination is affected by hypoxia forms the basis of this study.
Sorafenib is an approved oral multikinase inhibitor that targets the Raf/ERK pathway. In addition, it also inhibits several tyrosine kinases (vascular endothelial growth factor [VEGFR]-2, VEGFR-3, platelet-derived growth factor receptor [PDGFR]).20 GDC-0941 is an orally bioavailable class I selective PI3K inhibitor.21 BEZ-235 is an orally bioavailable PI3K/mTOR dual inhibitor with activity against α, β, δ, γ PI3K isoforms and mTOR.22
Colorectal cancer (CRC) was chosen as a model system in this study as these cancers are characterized by a high frequency of RAS and PI3K pathway mutations in addition to overexpression of epidermal growth factor receptor (EGFR). It is the third most commonly diagnosed cancer in males and second in females with an estimate of >1.2 million new cases and 608,700 deaths to have occurred in 2008.23
Materials and methods
Cell lines, antibodies and compounds
CRC cell lines HCT116 and SW480 were obtained from the American Type Culture Collection (ATCC). Cell lines were cultured in ATCC-recommended media supplemented with 10% fetal bovine serum (FBS) at 37°C and 5% CO2. Antibodies directed against pAKT (S473), pS6 (S235/236), p4EBP1 (Thr 37/46), pERK (Y202/204), Bcl-2, β-catenin, HIF-1α, cyclin D1, and actin were obtained from Cell Signaling Technology (Danvers, MA, USA). Dylight549-labeled secondary antibody and Hoechst3342 dye were obtained from Thermo Fischer Scientific (Waltham, MA, USA). Compounds sorafenib, BEZ-235, and GDC-0941 were obtained from AXON chemicals (Reston, VA, USA).
Induction of hypoxia
All hypoxic exposures were carried out at 1% O2/5% CO2 using a hypoxia workstation invivo2 400 model (Ruskinn Technology Ltd, Bridgend, UK).
Cell growth inhibition and drug combination assays
For cell growth effect assay, cells were seeded at a density of 3,000 cells per well of growth medium containing 10% FBS in a 96-well white plate. After 24 hours of incubation in humidified 5% CO2 incubator or hypoxia chamber (1% O2, 5% CO2) at 37°C, cells were treated with compounds alone or in combination for 48 hours. At the end of incubation period, the plates were assayed for cell growth inhibition effect using propidium iodide (PI), and % inhibition was calculated. The quantitative data were expressed as percentage (%) change in comparison to the dimethyl sulfoxide (0.1%) control cells. A nonconstant ratio for drug combination design was used, and normalized isobolograms were constructed using Calcusyn-Biosoft software. Combination effect was classified as synergistic, additive, or antagonistic on the basis of combination index (CI) value. CI <1, CI =1, and CI >1 were indicative of synergistic, additive, and antagonistic effects, respectively.
Clonogenic assay
Clonogenic assay was performed by seeding 500 cells of the CRC cell lines in 2 mL of appropriate medium containing 10% FBS in 6-well tissue culture grade plates. After 24 hours incubation, cells were treated with compounds for 10–14 days by incubating under normoxia or hypoxia till well-formed colonies were visible in the untreated control wells. At the end of incubation period, photomicrographs were recorded and colony-forming units were counted.
Western blot for detection of proteins
Cells were seeded at a density of 1×10⁶ and exposed to 21% O2 (normoxia) or 1% O2 (hypoxia) for 6, 24, and 48 hours. Cells were lysed on ice with cell lytic buffer (Sigma-Aldrich Co., St Louis, MO, USA) supplemented with protease and phosphatase inhibitors for immunoblotting. Blots were probed with for respective proteins at 4°C for 16 hours. Peroxidase-labeled anti-rabbit/anti-mouse antibody (Santa Cruz Biotechnology Inc., Dallas, TX, USA) was used as the secondary antibody. Super west chemiluminescence substrate (Pierce) was used for detection of proteins by chemiluminescence. Images were acquired on Bio-Rad gel doc system (Bio-Rad Laboratories Inc., Hercules, CA, USA) and documented.
ELISA assay for detection of proteins
For protein expression studies, Cellomics high-content imaging platform was used. For detection of each protein, 5,000 cells were seeded in 96-well tissue culture grade black plates with transparent bottom and allowed to adhere for 24 hours. After 24 hours, media was replaced with fresh media, and cells were treated with indicated concentration of the compounds alone or combination of compounds and incubated for indicated time period under normoxia and hypoxia. After incubation, cells were fixed with 3.7% formaldehyde followed by permeabilization with 0.15% Triton X-100, blocked with 10% bovine serum albumin and adding specific primary antibody. Proteins were localized by secondary antibody labeled with Dylight549. Following secondary antibody incubation, the nucleus was stained with Hoechst3342. Immunofluorescence was determined by scanning the plates on Cellomics Array Scan® VTI HCS reader (Thermo-Fisher Scientific). The quantitative data were expressed as percentage (%) change in comparison to the dimethyl sulfoxide (0.1%) control cells. Five hundred cells were counted per well. The scoring outputs used were total cellular intensity/nuclear intensity and the redistribution of fluorescence intensity from the nucleus to the cytoplasm.
l-Lactate and d-glucose assays
For l-lactate assay, cells were seeded at a density of 0.1×10⁶ cells in 10 mL of growth medium supplemented with 10% FBS in 100 mm tissue culture plates. After 16 hours of incubation in humidified 5% CO2 incubator at 37°C, cells were treated with the compounds. The plates were further incubated for 48 hours under normoxia or hypoxia. After treatment, the spent medium was collected for measurement of extracellular lactate and glucose. l-Lactate was estimated in culture supernatants using lactate assay kit from Eton Biosciences, Inc. (San Diego, CA, USA; cat no 1200012002) as per the manufacturer’s instructions. A standard l-lactate assay curve was plotted, and the concentration of l-lactate in samples was estimated from the standard curve using softmax pro software (Molecular Devices LLC, Sunnyvale, CA, USA). d-Glucose was estimated in culture supernatants using commercial glucose oxidase–peroxidase reagent (Sigma-Aldrich Co. cat no G3660). The plates were read at 540 nm using spectramax spectrophotometer. A standard d-glucose assay curve was plotted, and the concentration of d-glucose in samples was estimated from the standard curve using softmax pro software (Molecular Devices LLC). The level of metabolites was calculated as metabolite level per million cells.
Statistical analysis
All results are shown as the mean ± SEM of three independent experiments. The statistical validation was done by Student’s t-test. Differences were considered statistically significant at P<0.05 (n=3).
Results
Induction of HIF-1α is observed in cells exposed to 1% oxygen
HIF-1α as a marker for hypoxia is observed in both HCT116 and SW480 cells exposed to 1% oxygen for the experimental time points of 6, 24, and 48 hours (Figure 1).
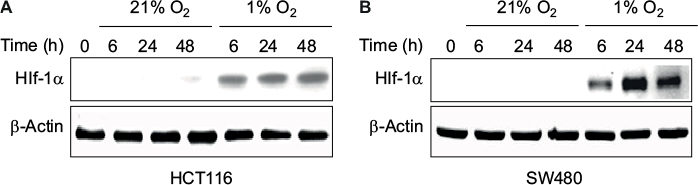 | Figure 1 Levels of HIF-1α at different times of exposure under 21% O2 (normoxia) and 1% O2 (hypoxia) in (A) HCT116 and (B) SW480 cells. Abbreviations: HIF-1α, hypoxia-inducible factor-1α; h, hours. |
Cell growth inhibition activity of sorafenib, GDC-0941, and BEZ-235 alone and in combination is reduced under hypoxia
Cell viability assay was used for evaluation of cell growth inhibition effects. In SW480 and HCT116 cell lines, the antiproliferative activity of a single compound sorafenib, BEZ-235 or GDC-0941 was found to be greatly reduced under hypoxia when compared to the effect of a single molecule under normoxia conditions (Figures 2 and 3). Combination effect of sorafenib with BEZ-235 was synergistic under normoxia but not under hypoxia (Figure 2). Combination of sorafenib with GDC-0941 showed synergistic effect under both normoxia and hypoxia (Figure 3). This indicated that combination of sorafenib and GDC-0941 may be effective under hypoxic tumor microenvironment where single compounds may be ineffective.
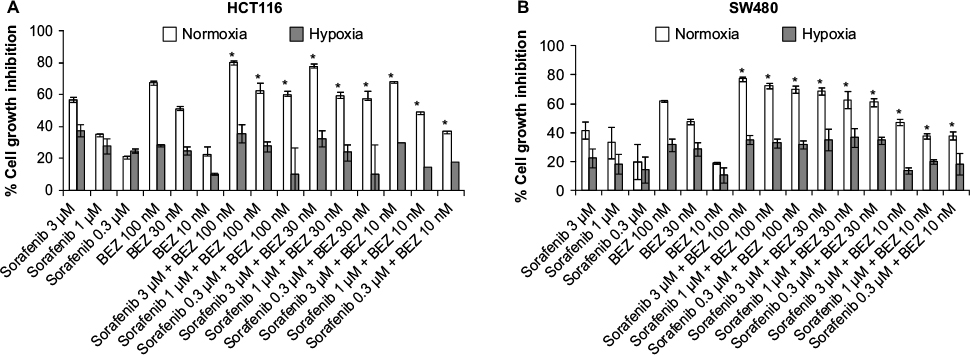 | Figure 2 Effect of combination of sorafenib with BEZ-235 on the growth of CRC cell lines (A) HCT116 and (B) SW480 under normoxia and hypoxia. Notes: Results are shown as the mean ± SEM of three independent experiments. *CI <1. Abbreviations: CRC, colorectal cancer; SEM, standard error of the mean; CI, combination index. |
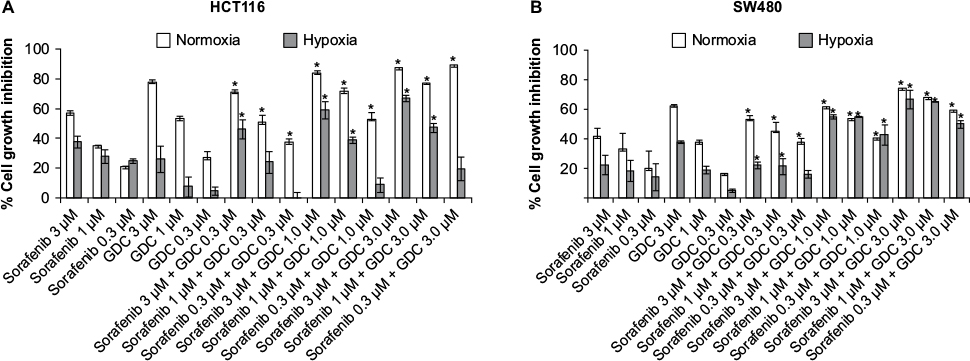 | Figure 3 Effect of combination of sorafenib with GDC-0941 on the growth of CRC cell lines (A) HCT116 and (B) SW480 under normoxia and hypoxia. Notes: Results are shown as the mean ± SEM of three independent experiments. *CI <1. Abbreviations: CRC, colorectal cancer; SEM, standard error of the mean; CI, combination index. |
Effects of combination of sorafenib with BEZ-235 and GDC-0941 under hypoxia is synergistic in long-term clonogenic assay
In long-term clonogenic assays, the anticlonogenic effect was enhanced in combination samples as compared to single molecule alone (Figure 4). Furthermore, sorafenib and BEZ-235 combination was as effective as sorafenib and GDC-0941 combination. Hence, the long-term effect of combination of sorafenib with BEZ-235/GDC-0941 is equally efficacious under normoxia and hypoxia. Another interesting observation was that the density of colonies was lower under hypoxic conditions when compared to density of colonies observed under normoxia. This may be due to the reduced cell proliferation under hypoxia.
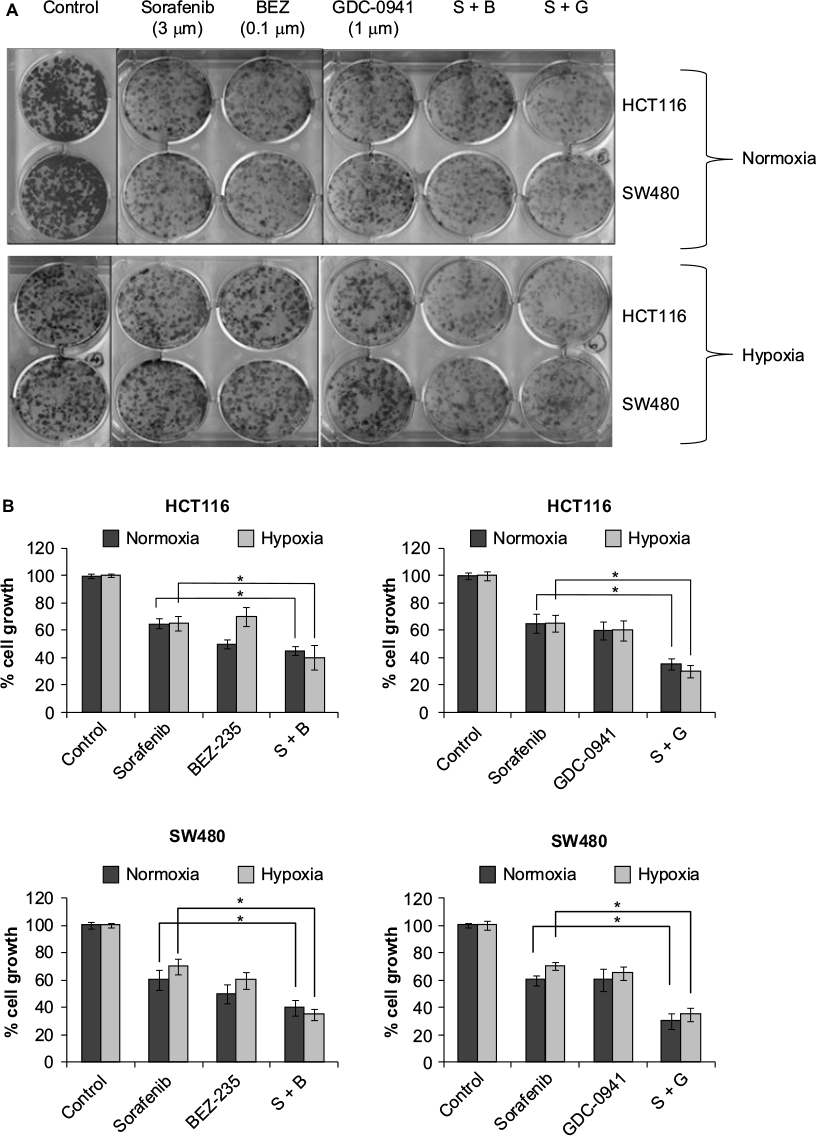 | Figure 4 Effect of combination of sorafenib and BEZ-235/GDC-0941 in a 14-day colony forming assay in CRC cell lines SW480 and HCT116 under normoxia and hypoxia (A) and (B) quantification of colony-forming units. Abbreviations: CRC, colorectal cancer; SEM, standard error of the mean; S-sorafenib; B, Bez-235; G, GDC-0941. |
PI3K/mTOR and Raf/ERK signaling proteins are inhibited under hypoxia
pERK, pAKT, pS6, and p4EBP1 were analyzed after exposure of cells to sorafenib (3 µM), GDC-0941 (1 µM), and BEZ-235 (0.1 µM) alone or in combination for 6 hours under normoxia and hypoxia. In sorafenib and BEZ-235 combination samples, a greater inhibition of pERK, pAKT, pS6, and p4EBP1 was observed under normoxia as compared to hypoxia growth conditions (Figure 5A and B). In sorafenib and GDC-0941 combination samples, a higher inhibition of pERK, pAKT, and p4EBP1 was observed under both hypoxia and normoxia. pS6 protein inhibition was similar under both normoxia and hypoxia in HCT116 cells, whereas a higher inhibition of pS6 was observed under hypoxia than under normoxia in SW480 cells (Figure 6A and B).
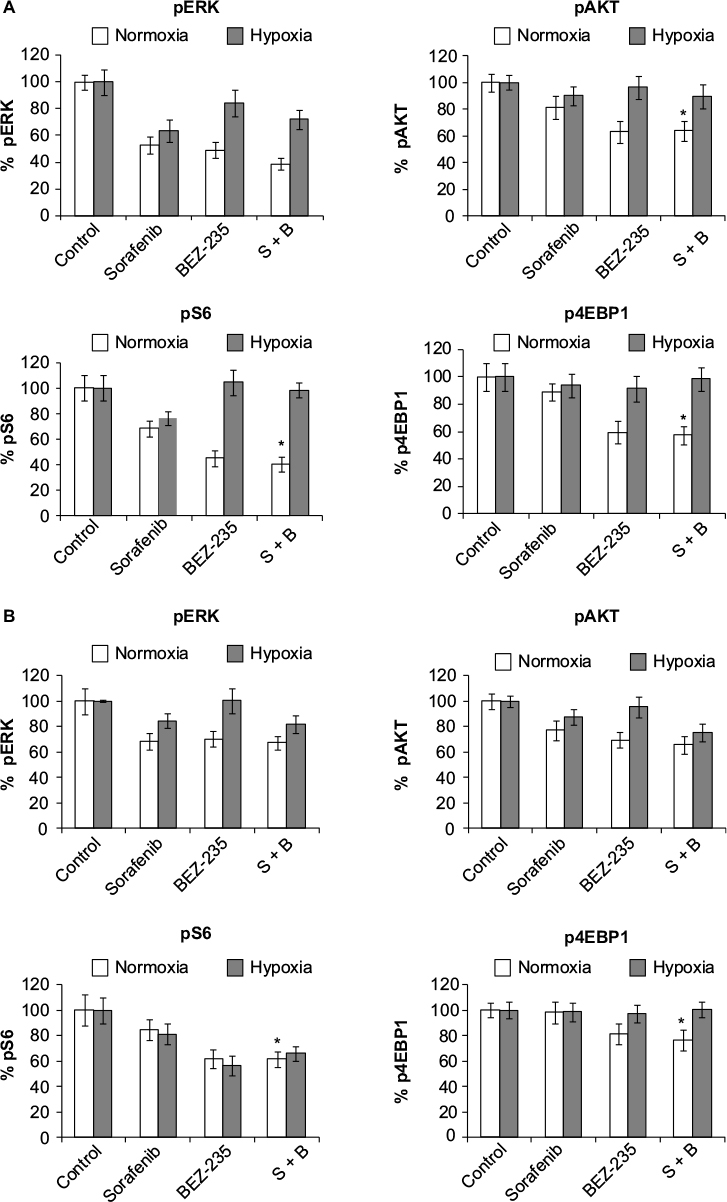 | Figure 5 Effect of combination of sorafenib with BEZ-235 on PI3K and Raf/Erk signaling proteins in CRC cell lines (A) HCT116 and (B) SW480 under normoxia and hypoxia. Notes: Results are shown as the mean ± SEM of three independent experiments. * P<0.05. Abbreviations: CRC, colorectal cancer; SEM, standard error of the mean; S-sorafenib; B, Bez-235. |
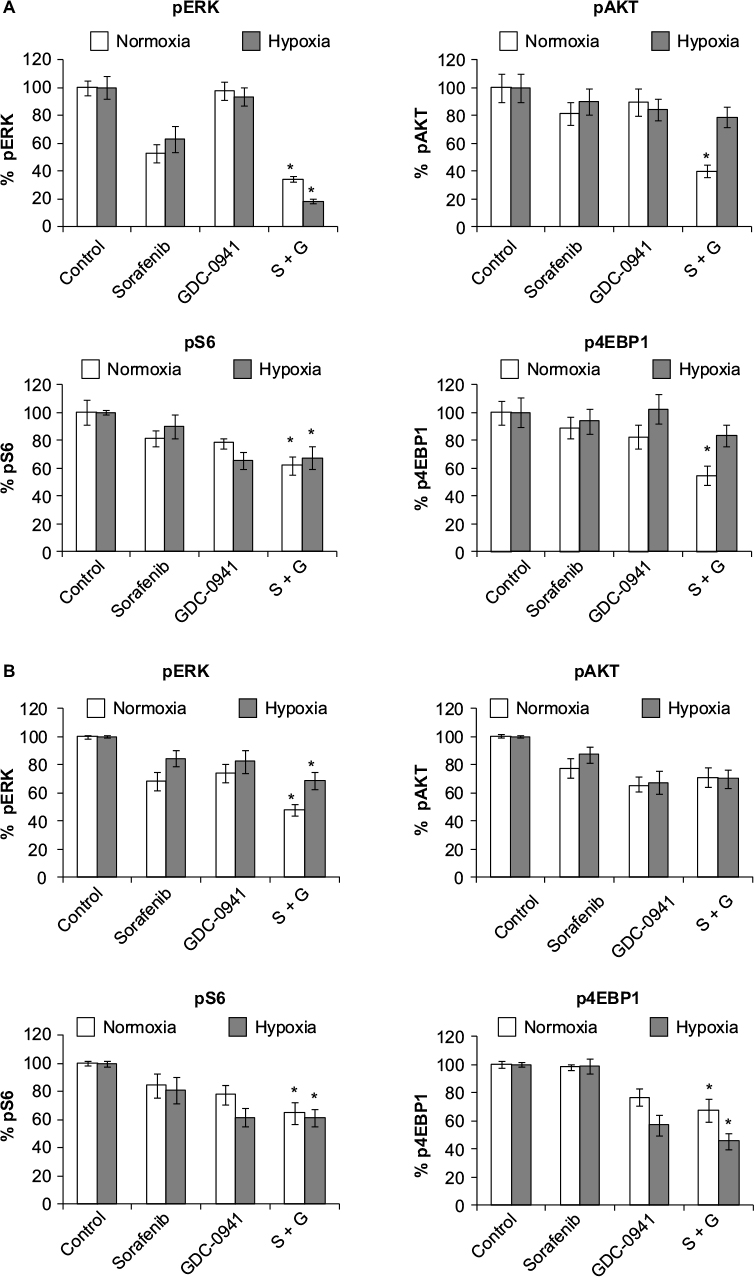 | Figure 6 Effect of combination of sorafenib with GDC-0941 on PI3K and Raf/Erk signaling proteins in CRC cell lines (A) HCT116 and (B) SW480 under normoxia and hypoxia. Notes: Results are shown as the mean ± SEM of three independent experiments. *P<0.05. Abbreviations: CRC, colorectal cancer; SEM, standard error of the mean; S-sorafenib; G, GDC-0941. |
β-Catenin, Bcl-2, and cyclin D1 proteins are inhibited under hypoxia
β-Catenin was studied as a marker protein for Wnt–β-catenin pathway. Cyclin D1 was used as a proliferation marker protein. Bcl-2 was used as a marker for apoptosis. β-Catenin and cyclin D1 proteins were analyzed after 24 hours of treatment. Bcl-2 protein was analyzed after 48 hours of treatment with sorafenib (3 µM), GDC-0941 (1 µM), and BEZ-235 (0.1 µM) alone or in combination. In sorafenib and BEZ-235 combination samples, β-catenin was significantly inhibited under normoxia when compared to hypoxia. Bcl-2 is equally inhibited under normal and hypoxic conditions in HCT116 cells, whereas a higher inhibition of Bcl-2 was observed in SW480 cells under hypoxia as compared to normoxia. The proliferation marker cyclin D1 is highly inhibited (>90%) under normoxia, whereas no significant inhibition (30%) of cyclin D1 was observed under hypoxia in both cell lines. This observation correlated with the ineffectiveness of sorafenib in combination with BEZ-235 in cell growth inhibition assays under hypoxic conditions in short-term exposure experiments (Figure 7A and B).
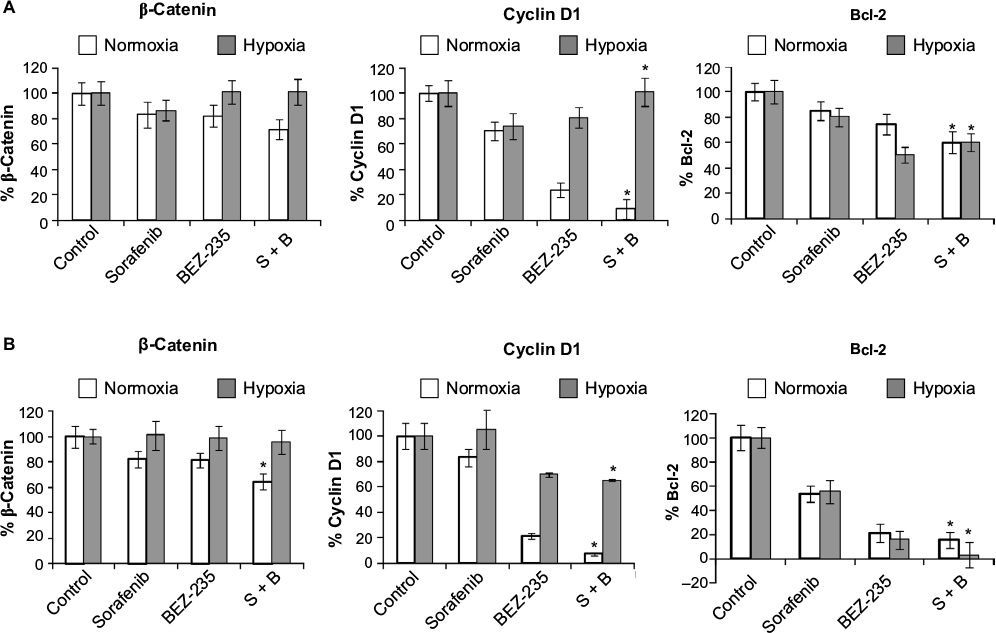 | Figure 7 Effect of combination of sorafenib with BEZ-235 on β-catenin, cyclin D1, and Bcl-2 proteins in CRC cell lines (A) HCT116 and (B) SW480 under normoxia and hypoxia. Notes: Results are shown as the mean ± SEM of three independent experiments. *P<0.05. Abbreviations: CRC, colorectal cancer; SEM, standard error of the mean; S, sorafenib; B, BEZ-235. |
In sorafenib and GDC-0941 combination, β-catenin was significantly inhibited under normoxia compared to hypoxia. Inhibition of the antiapoptotic marker protein Bcl-2 was higher under normal as compared to that observed under hypoxic conditions. The proliferation marker cyclin D1 was equally inhibited under normoxia and hypoxia in HCT116 (40%) and SW480 (>90%) cells. The inhibition of mTOR proteins (pS6 and p4EBP1) along with cyclin D1 explains the effectiveness of sorafenib and GDC-0941 combinations in cell growth inhibition assays under hypoxic conditions in short-term exposure assay (Figure 8A and B).
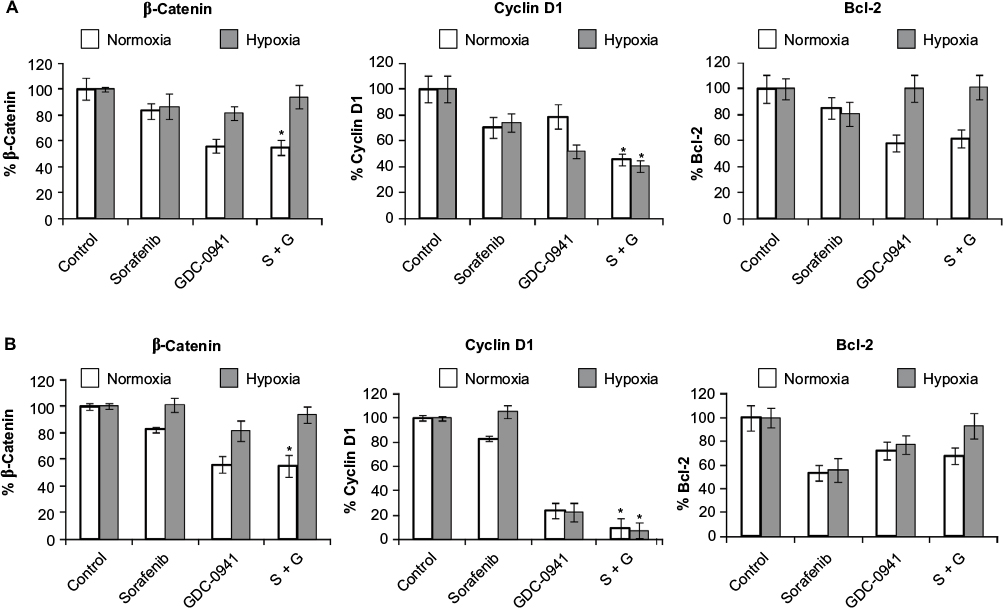 | Figure 8 Effect of combination of sorafenib with GDC-0941 on β-catenin, cyclin D1, and Bcl-2 proteins in CRC cell lines (A) HCT116 and (B) SW480 under normoxia and hypoxia. Notes: Results are shown as the mean ± SEM of three independent experiments. *P<0.05. Abbreviations: CRC, colorectal cancer; SEM, standard error of the mean; S, sorafenib; G, GDC-0941. |
No inhibition of HIF-1α levels is observed with drug combinations under hypoxia
HIF-1α protein was analyzed after 48 hours of treatment with sorafenib (3 µM), GDC-0941 (1 µM), and BEZ-235 (0.1 µM) alone or in combination. No significant change in HIF-1α level was observed in cells treated with combination under hypoxic conditions in comparison to cells treated with single compounds (Figures 9 and 10).
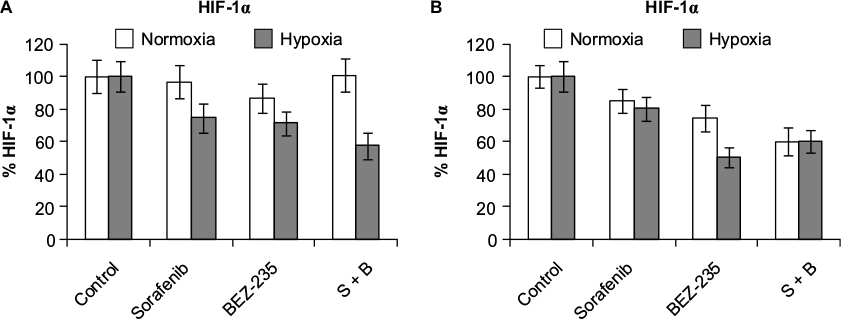 | Figure 9 Effect of combination of sorafenib with BEZ-235 on HIF-1α protein expression in CRC cell lines (A) HCT116 and (B) SW480 under normoxia and hypoxia. Note: Results are shown as the mean ± SEM of three independent experiments. Abbreviations: HIF-1α, hypoxia-inducible factor-1α; CRC, colorectal cancer; SEM, standard error of the mean; S, sorafenib; B, BEZ-235. |
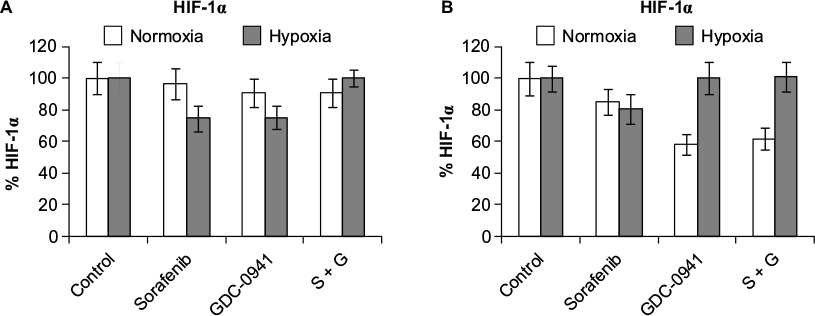 | Figure 10 Effect of combination of sorafenib with GDC-0941 on HIF-1α protein expression in CRC cell lines (A) HCT116 and (B) SW480 under normoxia and hypoxia. Note: Results are shown as the mean ± SEM of three independent experiments. Abbreviations: HIF-1α, hypoxia-inducible factor-1α; CRC, colorectal cancer; SEM, standard error of the mean; S, sorafenib; G, GDC-0941. |
Combination of sorafenib with BEZ-235 and GDC-0941 inhibits extracellular lactate and reduces glucose uptake equally under normoxia and hypoxia
For studying the effects of combination on metabolic parameters under hypoxia and normoxia, HCT116 and SW480 cells were treated with sorafenib (3 µM), GDC-0941 (1 µM), and BEZ-235 (0.1 µM) alone or in combination for 48 hours. In comparison to a single compound, a decrease in levels of extracellular lactate and glucose consumption in combination samples were observed (Figures 11 and 12). Simultaneous inhibition of the PI3K/mTOR and Ras/Raf/ERK pathways synergistically modulate the metabolic parameters in CRC cell lines.
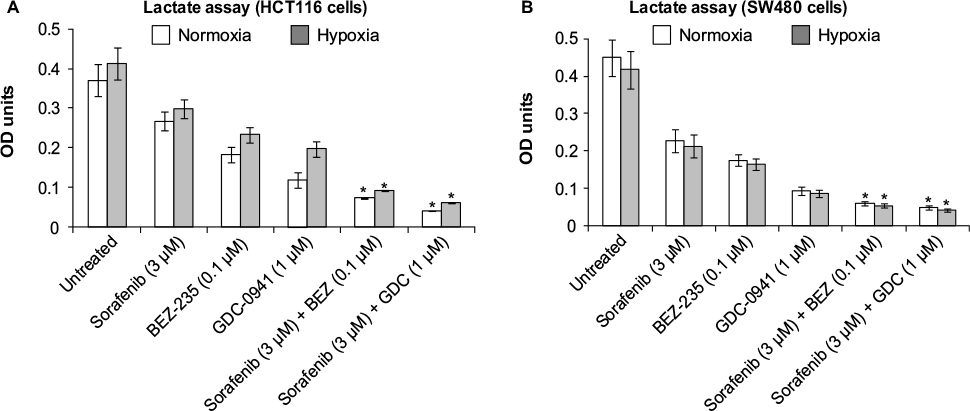 | Figure 11 Effect of combination of sorafenib and BEZ-235/GDC-0941 on extracellular lactate levels in CRC cell lines (A) HCT116 and (B) SW480 under normoxia and hypoxia. Notes: Results are shown as the mean ± SEM of three independent experiments. *P<0.05. Optical density (OD) at 490 nm. Abbreviations: CRC, colorectal cancer; SEM, standard error of the mean. |
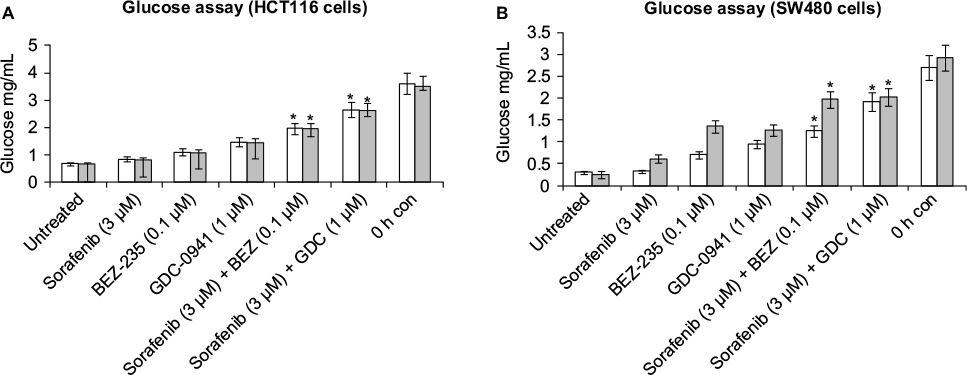 | Figure 12 Effect of combination of sorafenib and BEZ-235/GDC-0941 on extracellular glucose levels in CRC cell lines (A) HCT116 and (B) SW480 under normoxia and hypoxia. Notes: Results are shown as the mean ± SEM of three independent experiments. *P<0.05. Abbreviations: CRC, colorectal cancer; SEM, standard error of the mean; h, hours; con, control. |
Discussion
Hypoxia is a negative prognosis factor in cancer. Conventional cancer therapies may be unresponsive under chronic hypoxia as it renders these agents impermeable to tumors. Also, most anticancer agents are known to act on proliferating cells. Chronic hypoxia reduces the rate of cellular proliferation and leads to emergence of a quiescent tumor cell population, which is less susceptible to anticancer agents that target actively dividing cells in close proximity to the blood vessels.24
Translation of HIF-1α, a marker for hypoxia, is augmented by activation of the PI3K/mTOR and Ras/Raf signaling pathways. As both PI3K and Ras/Raf pathways are hyperactivated under hypoxia, one might hypothesize that sorafenib, GDC-0941, and BEZ-235 would be more potent under hypoxic conditions. However, it was observed that these compounds show reduced potency in 48 hours cell growth inhibition assay when compared to their sensitivity under normoxia. It was also observed that cells under hypoxia have a reduced proliferation rate when compared to normoxia as observed in the long-term colony-forming assay. A reduced proliferation rate of cells under hypoxia may be a possible reason for the decreased potency of single compounds sorafenib, BEZ-235, and GDC-0941 observed under hypoxia.19,25
The short-term 48-hour drug combination assays under hypoxia indicated that sorafenib and BEZ-235 combinations are ineffective, whereas sorafenib and GDC-0941 combinations are synergistic. This indicated that PI3K inhibitors can overcome some of the drawbacks associated with PI3K/mTOR dual inhibitors: one of them being hyperactivation of RTK signaling through activation of PI3K kinase activity.26 Another reason could be a complex interaction between HIF-1α and mTOR dependent on oxygen availability that renders mTOR inhibitor everolimus ineffective under severe hypoxic conditions as described by Knaup et al.27 mTOR activation by growth factors leads to phosphorylation of p70S6K and 4E-BP1 involved in cellular translation. Phosphorylation of 4E-BP1 leads to dissociation and activation of eIF4E, which mediates classic cap-dependent translation. Phosphorylation of p70S6K leads to activation of rpS6, which is involved in translation of 5′TOP-dependent messenger RNAs. Because HIF-1α belongs to the 5′TOP messenger RNA family, HIF-1α protein in normoxia or hypoxia could be regulated through activated mTOR signaling. Under hypoxia, HIF-1α subunits accumulate and mTOR is potently inactivated, leading to a reduction in cellular translation. A rapid hypophosphorylation of p70S6K and rpS6 in response to HIF-1α accumulation can regulate its translation under hypoxia through a negative feedback loop.
However, in the long-term clonogenic assay, the combination of both sorafenib with GDC-0941 and BEZ-235 was efficacious indicating that long-term exposure to combined drug pressure can overcome resistance to mTOR inhibition due to feedback regulation by HIF-1α under hypoxia.
At the molecular level, a higher inhibition of proteins (pERK, pAKT, pS6, p4EBP1, β-catenin, and cyclin D1) was observed under normoxia as compared to hypoxia growth conditions in cells treated with sorafenib, BEZ-235, and the combination of sorafenib with BEZ-235. In sorafenib and GDC-0941 combinations, inhibition of proteins (pERK, pAKT, pS6, p4EBP1, cyclin D1) was observed under both normoxia and hypoxia. The inhibition of primary target proteins along with proliferation marker protein cyclin D1 explains the synergistic effect of sorafenib with GDC-0941 under both normoxia and hypoxia, although the potency of single compounds is greatly reduced as explained earlier. The data further confirm that PI3K inhibitors may be more efficacious than PI3K/mTOR inhibitors in combination with sorafenib under hypoxia.
In sorafenib combination with BEZ-235 samples, it was observed that Bcl-2, an antiapoptotic protein, was inhibited to a greater extent under hypoxia when compared to normoxia, but this inhibition was insufficient to alter cellular proliferation in short-term 48-hour assay. Extent of Bcl-2 inhibition in sorafenib combination with GDC-0941 was comparable under hypoxia and normoxia, indicating that these proteins may not be significant in influencing the outcome of combinations under hypoxia. However, this observation contradicts the expected observation that AKT inhibition through upstream PI3K inhibition or ERK inhibition through upstream RAF inhibition may tilt the cellular balance toward reduced proliferation by inhibition of antiapoptotic proteins Bcl-2.28,29 The combination of sorafenib with BEZ-235 or GDC-0941 does not alter the expression of hypoxia-expressed protein HIF-1α in comparison to single compounds.
Oncogenesis mediated through growth factor signaling is linked to alterations in cellular glucose metabolism. The PI3K pathway regulates the use and uptake of glucose through increased expression and membrane localization of the glucose transporter GLUT1; it stimulates phosphofructokinase (PFK) activity and the association of hexokinases 1 (HK1) and 2 (HK2) with the mitochondria. Activation of mTOR, and its regulation via AMPK maintains glucose homeostasis.30 KRAS drives metabolic reprogramming in tumor cells by increasing aerobic glycolysis through increased expression of glycolytic enzymes, such as HK1, HK2, GLUT1, PFK1, and LDHA.31 Several reports suggest that both nutrient uptake changes and metabolic alterations are under direct control of RAS oncogenes.30,32
A decrease in the extracellular lactate levels and glucose consumption correlated with the cell growth inhibition observed in drug combination assays. Decrease in cellular glucose uptake and extracellular lactate release under both hypoxia and normoxia indicated that exposure of cells to sorafenib in combination with BEZ-235 or GDC-0941 would alter the cellular metabolism in cancer cells to a state similar to that of normal cells. It can thus be hypothesized that this metabolic effect would not only alter the proliferation rate of cancer cells but also help to restore the aberrant oncogenic signals that promote cancer.
Conclusion
This study throws upon some light on the differential effects of combination of sorafenib with PI3K/mTOR dual inhibitor BEZ-235 or PI3K inhibitor GDC-0941 under tumor-mimicking hypoxic growth conditions. Combination outcome under short-term hypoxic incubation shows differential effect for PI3K and PI3K/mTOR dual inhibitors. Long-term exposure to sorafenib in combination with BEZ-235 is required to sensitize the hypoxic cells to apoptosis and cell growth inhibition, whereas sorafenib in combination with GDC-0941 is effective under both short- and long-term exposures. Delineation of molecular mechanisms indicate that under hypoxia as well as normoxia, synergistic effects that are observed with the combination of compounds are mainly due to inhibition of effector proteins of the target pathways of these compounds, namely, PI3K/AKT and Raf/ERK. The observed efficacy of combination of sorafenib with PI3K inhibitors indicates that these combinations can overcome the hypoxia-mediated resistance mechanism and will be efficacious in a hypoxic tumor microenvironment.
Disclosure
The authors report no conflicts of interest in this work.
References
Harris AL. Hypoxia–a key regulatory factor in tumour growth. Nat Rev Cancer. 2002;2(1):38–47. | ||
Pries AR, Cornelissen AJ, Sloot AA, et al. Structural adaptation and heterogeneity of normal and tumor microvascular networks. PLoS Comput Biol. 2009;5(5):e1000394. | ||
Vaupel P, Mayer A. Hypoxia in cancer: significance and impact on clinical outcome. Cancer Metastasis Rev. 2007;26(2):225–239. | ||
Wilson WR, Hay MP. Targeting hypoxia in cancer therapy. Nat Rev Cancer. 2011;11(6):393–410. | ||
Shannon AM, Bouchier-Hayes DJ, Condron CM, Toomey D. Tumour hypoxia, chemotherapeutic resistance and hypoxia-related therapies. Cancer Treat Rev. 2003;29(4):297–307. | ||
Subarsky P, Hill RP. The hypoxic tumour microenvironment and metastatic progression. Clin Exp Metastasis. 2003;20(3):237–250. | ||
Mayer A, Vaupel P. Hypoxia, lactate accumulation, and acidosis: siblings or accomplices driving tumor progression and resistance to therapy? Adv Exp Med Biol. 2013;789:203–209. | ||
Semenza GL. Hypoxia, clonal selection, and the role of HIF-1 in tumor progression. Crit Rev Biochem Mol Biol. 2000;35(2):71–103. | ||
Brahimi-Horn MC, Chiche J, Pouysségur J. Hypoxia signalling controls metabolic demand. Curr Opin Cell Biol. 2007;19(2):223–229. | ||
Zundel W, Schindler C, Haas-Kogan D, et al. Loss of PTEN facilitates HIF-1-mediated gene expression. Genes Dev. 2000;14(4):391–396. | ||
Harada H, Itasaka S, Kizaka-Kondoh S, et al. The Akt/mTOR pathway assures the synthesis of HIF-1 protein in a glucose- and reoxygenation-dependent manner in irradiated tumors. J Biol Chem. 2008;284(8):5332–5342. | ||
Kilic-Eren M, Boylu T, Tabor V. Targeting PI3K/Akt represses Hypoxia inducible factor-1α activation and sensitizes Rhabdomyosarcoma and Ewing’s sarcoma cells for apoptosis. Cancer Cell Int. 2013;13:36–45. | ||
Düvel K, Yecies JL, Menon S, et al. Activation of a metabolic gene regulatory network downstream of mTOR complex 1. Mol Cell. 2010;39(2):171–183. | ||
Li J, Clifford Y, Liaw D, et al. PTEN, a putative protein tyrosine phosphatase gene mutated in human brain, breast, and prostate cancer. Science. 1997;275(5308):1943–1947. | ||
Dhillon AS, Hagan S, Rath O, Kolch W. MAP kinase signalling pathways in cancer. Oncogene. 2007;26(22):3279–3290. | ||
Lim J, Lee E, You H, et al. Ras-dependent induction of HIF-1α via the Raf/MEK/ERK pathway: a novel mechanism of Ras-mediated tumor promotion. Oncogene. 2004;23(58):9427–9431. | ||
Mylonis I, Chachami G, Samiotaki M, et al. Identification of MAPK phosphorylation sites and their role in the localization and activity of hypoxia inducible factor-1alpha. J Biol Chem. 2006;281(44):33095–33106. | ||
Bermudez OP, Jouandin J, Rottier C, et al. Posttranscriptional regulation of the DUSP6/MKP-3 phosphatase by MEK/ERK signaling and hypoxia. J Cell Physiol. 2011;226(1):276–284. | ||
Strese S, Fryknäs M, Larsson R, Gullbo J. Effects of hypoxia on human cancer cell line chemosensitivity. BMC Cancer. 2013;13:331–341. | ||
Wilhelm SM, Adnane A, Newell P, Villanueva A, Llovet JM, Lynch M. Preclinical overview of sorafenib, a multikinase inhibitor that targets both Raf and VEGF and PDGF receptor tyrosine kinase signaling. Mol Cancer Ther. 2008;7(10):3129–3140. | ||
Folkes AJ, Ahmadi K, Alderton WK, et al. The identification of 2-(1H-indazol-4-yl)-6-(4-methanesulfonyl-piperazin-1-ylmethyl)-4-morpholin-4-yl-thieno [3,2-d]pyrimidine (GDC-0941) as a potent, selective, orally bioavailable inhibitor of class I PI3 kinase for the treatment of cancer. J Med Chem. 2008;51(18):5522–5532. | ||
Maira SM, Stauffer F, Brueggen J, et al. Identification and characterization of NVP-BEZ235, a new orally available dual phosphatidylinositol 3-kinase/mammalian target of rapamycin inhibitor with potent in vivo antitumor activity. Mol Cancer Ther. 2008;7(7):1851–1863. | ||
Jemal A, Siegel R, Xu J, Ward E. Cancer statistics. CA Cancer J Clin. 2010;60(5):277–300. | ||
Cosse JP, Michiels C. Tumour hypoxia affects the responsiveness of cancer cells to chemotherapy and promotes cancer progression. Anticancer Agents Med Chem. 2008;8(7):790–797. | ||
Mitchison TJ. The proliferation rate paradox in antimitotic chemotherapy. Mol Biol Cell. 2012;23(1):1–6. | ||
Will M, Qin A, Toy W, et al. Rapid induction of apoptosis by PI3K inhibitors is dependent upon their transient inhibition of RAS–ERK signaling. Cancer Discov. 2014;4(3):334–347. | ||
Knaup KX, Jozefowski K, Schmidt K, et al. Mutual regulation of hypoxia-inducible factor and mammalian target of rapamycin as a function of oxygen availability. Mol Cancer Res. 2009;7(1):88–98. | ||
Coloff JL, Macintyre AN, Nichols AG, et al. Akt-dependent glucose metabolism promotes Mcl-1 synthesis to maintain cell survival and resistance to Bcl-2 inhibition. Cancer Res. 2011;71(15):5204–5213. | ||
Corcoran RB, Cheng KA, Hata AN, et al. Synthetic lethal interaction of combined BCL-XL and MEK inhibition promotes tumor regressions in KRAS mutant cancer models. Cancer Cell. 2013;23(1):121–128. | ||
Vander Heiden MG, Cantley LC, Thompson CB. Understanding the Warburg effect: the metabolic requirements of cell proliferation. Science. 2009;324(5930):1029–1033. | ||
Ying H, Kimmelman AC, Lyssiotis CA, et al. Oncogenic Kras maintains pancreatic tumors through regulation of anabolic glucose metabolism. Cell. 2012;149(3):656–670. | ||
Dang CV. Links between metabolism and cancer. Genes Dev. 2012;26(9):877–890. |
 © 2016 The Author(s). This work is published and licensed by Dove Medical Press Limited. The full terms of this license are available at https://www.dovepress.com/terms.php and incorporate the Creative Commons Attribution - Non Commercial (unported, v3.0) License.
By accessing the work you hereby accept the Terms. Non-commercial uses of the work are permitted without any further permission from Dove Medical Press Limited, provided the work is properly attributed. For permission for commercial use of this work, please see paragraphs 4.2 and 5 of our Terms.
© 2016 The Author(s). This work is published and licensed by Dove Medical Press Limited. The full terms of this license are available at https://www.dovepress.com/terms.php and incorporate the Creative Commons Attribution - Non Commercial (unported, v3.0) License.
By accessing the work you hereby accept the Terms. Non-commercial uses of the work are permitted without any further permission from Dove Medical Press Limited, provided the work is properly attributed. For permission for commercial use of this work, please see paragraphs 4.2 and 5 of our Terms.