")
Back to Journals » Clinical Interventions in Aging » Volume 12
Cognitive impairment associated with locomotive syndrome in community-dwelling elderly women in Japan
Authors Nakamura M , Tazaki F, Nomura K, Takano T, Hashimoto M, Hashizume H , Kamei I
Received 24 May 2017
Accepted for publication 16 August 2017
Published 12 September 2017 Volume 2017:12 Pages 1451—1457
DOI https://doi.org/10.2147/CIA.S142538
Checked for plagiarism Yes
Review by Single anonymous peer review
Peer reviewer comments 2
Editor who approved publication: Dr Richard Walker
Misa Nakamura,1 Fumie Tazaki,1 Kazuki Nomura,1 Taeko Takano,1 Masashi Hashimoto,1 Hiroshi Hashizume,2 Ichiro Kamei1
1Department of Rehabilitation, Osaka Kawasaki Rehabilitation University, Kaizuka, Osaka, Japan; 2Department of Orthopaedic Surgery, Wakayama Medical University, Wakayama, Japan
Abstract: In our worldwide aging society, elderly people should maintain cognitive and physical function to help avoid health problems. Dementia is a major brain disease among elderly people, and is caused by cognitive impairment. The locomotive syndrome (LS) refers to a condition in which people require healthcare services because of problems associated with locomotion. The purpose of this study was to determine the association between cognitive impairment and LS. Study participants were 142 healthy elderly female volunteers living in a rural area in Japan. Cognitive function was assessed using the Mini-Mental State Examination (MMSE). A score of ≤26 points on the MMSE was used to indicate categorically defined poor cognitive performance (cognitive impairment). The LS was defined by a score ≥16 points, and non-LS as <16 points, on the 25-question Geriatric Locomotive Function Scale (GLFS-25). Twenty-one participants (14.8%) had an MMSE score ≤26, and 19.0% were found to have LS. Compared with the MMSE >26 group, the ≤26 group was significantly older, had a higher percentage of body fat, and a higher GLFS-25 score. Those with LS were significantly older, had a higher body mass index, a higher percentage of body fat, and a lower MMSE score. Participants in the LS group had higher odds of cognitive impairment than those without LS [odds ratio (OR) =3.08] by logistic regression analysis adjusted for age. Furthermore, participants with GLFS-25 scores ≥6 had higher odds of cognitive impairment than those with a GLFS-25 score <6 by logistic regression analysis adjusted for both age (OR =4.44), and age and percent body fat (OR =4.12). These findings suggest that a strong relationship exists between the early stage of decreased motor function and cognitive impairment.
Keywords: cognitive impairment, locomotive syndrome, Mini-Mental State Examination, 25-question Geriatric Locomotive Function Scale
Introduction
Patients with dementia and musculoskeletal disease often require nursing care in Japan.1 Dementia is a progressive disorder of the brain. The damage to brain cells as a consequence of dementia results in a loss of cognitive ability, including the ability to think, reason, and function. This leads to a reduction in quality of life (QOL), for example, by affecting daily activities, including the ability to take care of oneself. As the signs and symptoms of dementia worsen, the disorder also affects the lives and emotional wellbeing of families and caregivers.2 Current global estimates suggest that more than 46.8 million people are affected by dementia.3 Among Japanese people who are over 65 years old, 2.6 million people are affected by dementia, with a prevalence rate of approximately 8.4%.4
Motor function decreases with age and also leads to a decrease in activities of daily living and QOL. The physical activity level of elderly people living in the community and their health-related QOL are closely related.5,6 The frailty criteria proposed by Fried et al are most frequently used in clinical practice, and comprise three or more of five conditions: slowness, weakness, shrinking, inactivity, and exhaustion.7 Frailty is a state of increased vulnerability to adverse outcomes, including disability, owing to poor resolution of homoeostasis after a stressor event.8 A close association between frailty and dementia has been demonstrated.9
A concept referred to as locomotive syndrome (LS) was proposed by the Japanese Orthopaedic Association to help identify middle-aged and older adults who may be at high risk of requiring healthcare services. This risk increases as a person’s movement function deteriorates due to locomotive impairment. Some causes of LS are reduced muscle strength and balance associated with aging and conditions due to osteoporosis, osteoarthritis, and sarcopenia.10 At present, concepts of LS, sarcopenia, and frailty have many things in common, but the distinction among them is ambiguous. The concept of LS includes social significance in which people’s understanding of locomotion leads to attention toward motor disorders. The proportion of the Japanese population with LS (47 million) is estimated to be more than twice that with metabolic syndrome (20 million).11,12 We evaluated LS status using the 25-question Geriatric Locomotive Function Scale (GLFS-25 or Locomo-25) score. The GLFS-25 is a self-completed questionnaire that consists of 25 items, including four questions on pain during the last month, 16 questions on activities of daily activity during the last month, three questions on social functions, and two questions on mental health status during the last month.13 These 25 items are scored from 0 (no impairment) to 4 (severe impairment), and the total score ranges from 0 to 100 points. Higher scores indicate worse locomotive function, and the cut-off score for LS is 16 points. The validity of the GLFS-25 was confirmed by demonstrating a significant correlation with the European Quality of Life Scale-5 Dimensions questionnaire.13 Many reports have suggested that the GLFS-25 score strongly correlates with several measures of physical performance, including the walking speed test, handgrip strength test, unipedal stance test, and the timed up and go test.14–18 The age-associated reduction in muscle mass in sarcopenia is also associated with cognitive dysfunction.19–21 Momoki et al have reported that LS is associated with sarcopenia,22 which is also related to cognitive decline and dementia.23
A depressive state is frequently observed in patients with mild cognitive impairment (MCI) and dementia.24–26 Recently, we reported that comparative analysis between LS and non-LS subjects revealed significant differences in the degree of depression with age.27,28
Medications and social policies are urgently needed to reduce and prevent cognitive impairment and LS in older adults living in the community. No studies have investigated the relationship between cognitive function and LS. Therefore, the purpose of this study was to determine the association between LS and cognitive status, with the goal of providing information that will help prevent LS and dementia in community-dwelling elderly people. If the relationship between LS and cognitive impairment becomes clear, mutual prevention of LS and cognitive decline will be expected to prevent onset of LS and dementia in community-dwelling individuals.
Participants
This study was conducted in a local area (Kaizuka City, Osaka Prefecture, Japan) between August 2016 and March 2017. The study inclusion criteria were: 1) Japanese women, aged ≥60 years, and 2) living independently in their own home. All participants initially underwent measurement of blood pressure and body composition, followed by evaluation of cognitive function and LS status at a public hall where a “Lecture meeting and checkup for health,” supported by the local government in Kaizuka, Osaka, was held. A total of 142 participants (mean age 74.26±5.86 years; range 60–90 years) were considered for the present analysis. All participants provided written informed consent to be part of the entire research. This study was conducted in accordance with the Declaration of Helsinki and was approved by the Ethics Committee of Osaka Kawasaki Rehabilitation University (Reference No OKRU28-A014).
Measurement of variables
Systolic and diastolic blood pressure was measured with a Mercury tabletop blood pressure monitor (Sankei Co., Chiba, Japan).
The total body weight, percent body fat, and skeletal muscle mass index (SMI) were obtained from the electronic medical records of InBody270 (InBody, Tokyo Japan), which estimates body composition using frequencies (20 and 1,000 kHz). Participants were instructed to grasp the handles of the analyzer in which electrodes are embedded and to stand on electrodes that contact the bottoms of their feet while wearing normal indoor clothing without socks and shoes. The body mass index (BMI) was calculated as weight in kilograms divided by height in meters squared.
Evaluation of cognitive function
Cognitive function was assessed using the Mini-Mental State Examination (MMSE), which assesses global cognition including orientation, registration, attention, calculation, language, and recall.29 MMSE scores range from 0 to 30, with higher scores indicating better cognitive function. A pre-specified score of ≤26 on MMSE was used to indicate categorically defined poor performance.30
Assessment of LS status
The LS status was evaluated using the 25-question GLFS-25 or Locomo-25 score. The GLFS-25 is a self-administered questionnaire that comprises four questions about pain during the last month, 16 questions about activities of daily living during the last month, three questions about social function during the last month, and two questions about mental health status during the last month.13 All 25 questions are scored from 0 (no impairment) to 4 (severe impairment), and the total score ranges from 0 to 100. Higher scores indicate worse locomotive function, and a pre-specified score of ≥16 was considered indicative of LS.13
Statistical analysis
Participants were categorized into a cognitive impairment group (MMSE score ≤26) or a non-impairment group (MMSE score >26), and into an LS group (GLFS-25 score ≥16) or a non-LS group (GLFS-25 score <16). Independent variables were compared between the cognitive MMSE >26 and MMSE ≤26 groups, and between the LS and non-LS groups. For numerical variables (age, BMI, percent body fat, SMI, GLFS-25 score, and MMSE score), the normality of distribution and homogeneity of variance were tested prior to comparison across groups. The Student’s t-test was used when assumptions of normal distribution and homogeneity of variance were fulfilled in both groups; Welch’s t-test was used when the assumption of normal distribution was met, but the assumption of homogeneity of variance was not; and the Wilcoxon signed-rank test was used when the data were not normally distributed. The odds ratios (ORs) of measurements or LS status for an MMSE score ≤26 were calculated using univariate and multiple logistic regression analysis. Age, percent body fat, GLFS score, and LS were used as independent variables, and MMSE ≤26 as a dependent variable. Logistic regression model 1 was adjusted for age, and model 2 was adjusted for age and percent body fat. The GLFS-25 threshold score for discriminating the MMSE >26 group and the MMSE ≤26 group was evaluated using receiver operating curve (ROC) analysis. The ORs of MMSE ≤26 for the GLFS-25 threshold score were calculated using multiple logistic regression analysis. Age and percent body fat were used as independent variables, and MMSE ≤26 as a dependent variable. Logistic regression model 1 was adjusted for age, and model 2 was adjusted for age and percent body fat. All p-values and 95% confidence intervals (CI) of two-sided analysis are presented. Statistical analysis was conducted using JMP 11 (SAS Institute, Cary, NC). All statistical tests were two-tailed, and a significance level of 0.05 was used.
Results
Characteristics of the study participants
Age, blood pressure, height, total body weight, BMI, percent body fat, SMI, MMSE score, and GLFS-25 score are shown in Table 1. Twenty-one participants (14.8%) had an MMSE score ≤26, and 27 participants (19.0%) had a GLFS-25 score ≥16. These proportions increased in older participants (Table 2).
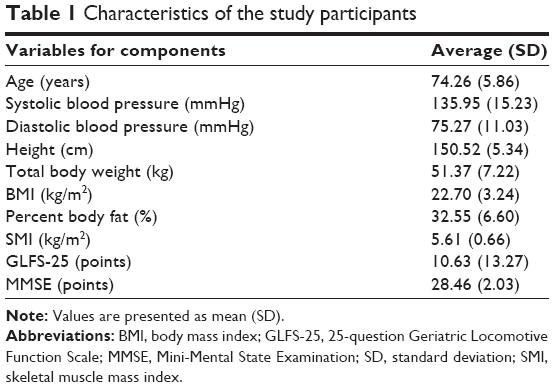 | Table 1 Characteristics of the study participants |
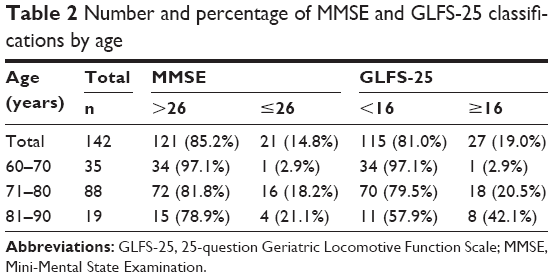 | Table 2 Number and percentage of MMSE and GLFS-25 classifications by age |
Comparison of characteristics between the MMSE >26 and ≤26 groups
The cognitive impairment group (MMSE ≤26) was older, had a higher BMI, a higher percent body fat, a lower SMI, and a higher GLFS-25 score than the >26 group. Significant differences were observed between the two groups in age, percent body fat, and GLFS-25 score (Table 3).
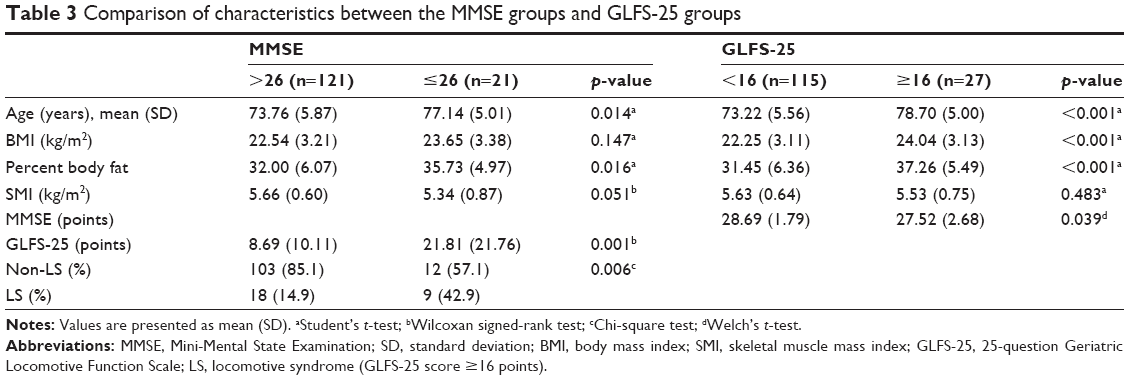 | Table 3 Comparison of characteristics between the MMSE groups and GLFS-25 groups |
Comparison of characteristics between GLFS-25 <16 and ≥16 groups
The LS group (GLFS-25 ≥16) was older, had a higher BMI, a higher percent body fat, a lower SMI, and a lower MMSE score than the <16 group. Significant differences between the two groups in age, BMI, percent body fat, and MMSE score were observed (Table 3). Furthermore, the chi-square test showed a relationship between cognitive impairment and LS status (p<0.01; Table 3).
ORs of characteristics for MMSE ≤26
Table 4 shows univariate and multiple logistic regression analysis results for ORs of each measurement, including age, percent body fat, and GLFS-25 scores, which showed significant differences between an MMSE score >26 and ≤26, as shown in Table 3. Univariate logistic regression analysis showed that age (OR=1.10, 95% CI=1.02–1.20; p<0.05), percent body fat (OR=1.10, 95% CI=1.02–1.21; p<0.05), GLFS-25 score (OR=1.06, 95% CI=1.03–1.09; p<0.001), and LS status (OR=4.29, 95% CI=1.55–11.69; p<0.01) were significantly associated with low cognition. Multiple logistic regression model 1, which was adjusted for age, showed that percent body fat (OR=1.09, 95% CI=1.01–1.19; p<0.05), GLFS-25 score (OR=1.05, 95% CI=1.02–1.09; p<0.001), and LS status (OR=3.08, 95% CI=1.03–9.09; p<0.05) were significantly associated with low cognition. Model 2, which was adjusted for age and percent body fat, showed that the GLFS-25 score (OR=1.04, 95% CI=1.01–1.08; p<0.005) was significantly associated with low cognition, whereas LS status was not (Table 4).
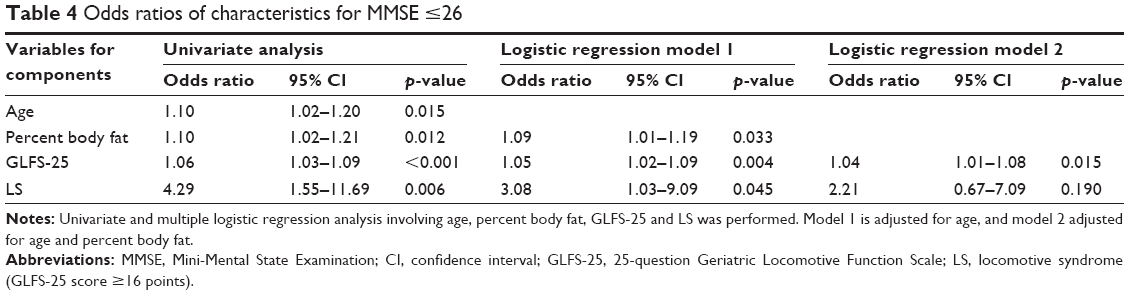 | Table 4 Odds ratios of characteristics for MMSE ≤26 |
Threshold score of GLFS-25 for MMSE ≤26 and ORs of GLFS-25 threshold for MMSE ≤26
The ROC analysis of GLFS-25 scores showed a threshold score of 6 for discriminating the MMSE >26 group and the MMSE≤26 group (AUC=0.72, sensitivity=85.7%, and specificity=50.4%; Table 5).
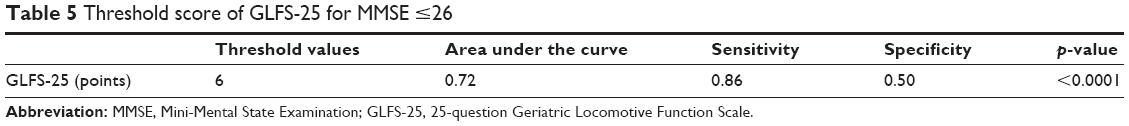 | Table 5 Threshold score of GLFS-25 for MMSE ≤26 |
Logistic regression model 1 adjusted for age showed that participants with a GLFS-25 score ≥6 had an OR of 4.44 odds for MMSE ≤26 (95% CI=1.28–20.87; p<0.05), and model 2 adjusted for age and percent body fat showed that participants with a GLFS-25 score ≥6 had OR of 4.12 odds for MMSE ≤26 (95% CI=1.17–19.46; p<0.05; Table 6).
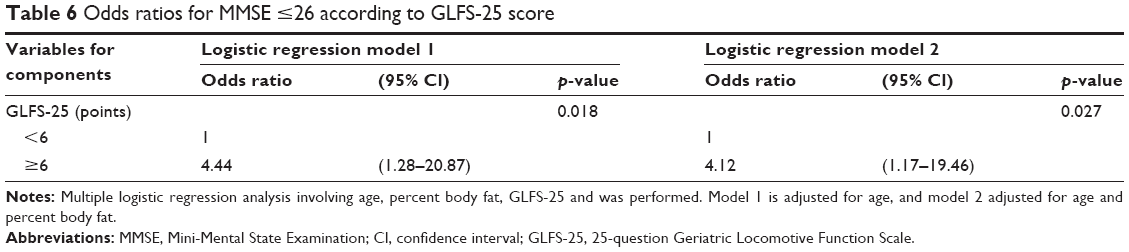 | Table 6 Odds ratios for MMSE ≤26 according to GLFS-25 score |
Discussion
Our results showed that the cognitive impairment group had a lower SMI, a higher BMI, and a higher percent body fat than the >26 group. This observation is consistent with previous reports showing that central obesity is associated with cognitive decline and that patients with Alzheimer’s disease had lower lean tissue mass and a higher percent fat mass.31,32 Similarly, the LS group also had a lower SMI, a higher BMI, and a higher percent body fat than the non-LS group. This result is consistent with our previous reports.28,33 These results suggested that both cognitive impairment and LS are correlated with body composition parameters.
Ikemoto et al have reported that no significant differences are present between non-LS and LS with regard to cognitive status.27 However, we found significant differences between LS status regarding the MMSE score. This difference may be due to the gender difference of the subjects; the Ikemoto et al report did not describe the details of the subjects. On the other hand, we observed a significant difference in the GLFS-25 score among the MMSE groups, and the LS group had significantly higher odds of having cognitive impairment than the group without LS in multiple regression model 1, which is adjusted for age. Previous studies have reported that cognitive decline and dementia are associated with motor dysfunction or low physical activity, including slower gait speed in the elderly.34,35 Furthermore, many reports have shown that an exercise intervention improves cognitive function in older people.36 Thus, the process of cognitive deterioration, which is caused by a decrease in motor function as defined by LS at first, occurs in many elderly people. Then, a vicious cycle may ensue in which cognitive decline leads to impairment in motor function due to low physical activity; furthermore, an impairment in motor function causes further cognitive impairment. Slow walking speed, a component of frailty, is also significantly associated with MCI37 and future development of MCI.38 Subjective cognitive impairment, in combination with slow gait speed, has been defined as motoric cognitive risk syndrome,39 which is a risk factor for future development of dementia.40 This concept strongly supports our present results.
Cerebellar injury leads to impairment in various cognitive functions.41 Recently, the cerebellum has been reported to not only be involved in motor function but also in processing of sensorimotor, cognitive, and affective information.42,43 Furthermore, a relationship between dementia, including Alzheimer’s disease, and cerebellar atrophy was recently reported.44 Therefore, the cerebellum is involved not only in motor functions but also in higher functions. Schmahmann and Sherman proposed a concept of disease called “cerebellar cognitive affective syndrome,” which is characterized by impairment of executive functions, difficulties with spatial cognition, personality changes, and language deficits.45 On the other hand, significant ORs of the GLFS-25 threshold score for cognitive impairment were detected in both models 1 and 2. The Japan Orthopedic Surgery Society proposes that GLFS-25 identifies an initial decline in motor function at 7 points or more, and that GLFS-25 identifies a progressive decline in motor function with a score of more than 16 points.46 These findings suggest that a strong relationship exists between the early stage of decreased motor function and cognitive impairment. In other words, when an intervention is undertaken in the early stage of motor function deterioration, the possibility of preventing deterioration of cognitive function exists. A longitudinal study is needed to clarify this idea.
Limitations and future research
This study has several limitations. First, the sample size of 142 was small; this number represents approximately 1.0% of all women aged 60–90 years in Kaizuka City. Further research in larger-sized studies is needed. Second, because the participants in this study were all Japanese women, care should be taken in generalizing the results to men or other ethnic groups. Third, data from a cross-sectional study are insufficient to determine whether a causal relationship exists between cognitive status and LS. Conducting longitudinal studies to clarify the causal relationships among these factors is, therefore, crucial. Fourth, because we have no information on participants’ lower back pain, knee pain, or physical inactivity, which are confounding factors for LS, or for nutritional balance, family relationships, economic situation, or education history, which are confounding factors for cognitive impairment, we cannot conclude how these factors may have affected the results.
Conclusion
The LS group had higher odds of having cognitive impairment than the group without LS. These findings suggest a close relationship between LS and cognitive impairment.
Acknowledgments
The authors thank Hidemi Akita, Nobukazu Nakano, Yukiko Fujitani, and Yuko Ueno of the Kaizuka City Office, Social Education Division as well as Wataru Tsujino, Kazuki Nishiwaki, Hironori Kojima, Koichiro Miyamae, Junko Nishide, Kazuya Kida, and many students at Osaka Kawasaki Rehabilitation University for their assistance in scheduling participants for examinations and measurements.
This research was supported by the discretionary expense of the president of Osaka Kawasaki Rehabilitation University in 2016.
Author contributions
All authors contributed toward data analysis, drafting and revising the paper and agree to be accountable for all aspects of the work.
Disclosure
The authors report no conflicts of interest in this work.
References
Ministry of Health, Labour and Welfare. National life basic survey. Available from: http://www.mhlw.go.jp/toukei/list/20-21kekka.html. Accessed July 25, 2017. | ||
Moyle W, Fetherstonhaugh D, Greben M, Beattie E; AusQoL group. Influencers on quality of life as reported by people living with dementia in long-term care: a descriptive exploratory approach. BMC Geriatr. 2015;15:50. | ||
World Alzheimer Report 2015: The global impact of dementia. Available from: https://www.alz.co.uk/research/WorldAlzheimerReport2015.pdf. Accessed May 5, 2017. | ||
Ministry of Health, Labor and Welfare. Everyone’s mental health. Available from: http://www.mhlw.go.jp/kokoro/speciality/detail_recog.html. Accessed May 5, 2017. | ||
Dunn AL, Dishman, RK. Exercise and the neurobiology of depression. Exerc Sport Sci Rev. 1991;19:41–98. | ||
Halaweh H, Willen C, Grimby-Ekman A, Svantesson U. Physical activity and health-related quality of life among community dwelling elderly. J Clin Med Res. 2015;7(11):845–852. | ||
Fried LP, Tangen CM, Walston J, et al; Cardiovascular Health Study Collaborative Research Group. Frailty in older adults: evidence for a phenotype. J Gerontol A Biol Sci Med Sci. 2001;56(3):M146–M156. | ||
Clegg A, Young J, Iliffe S, Rikkert MO, Rockwood K. Frailty in elderly people. Lancet. 2013;381(9868):752–762. | ||
Robertson DA, Savva GM, Kenny RA. Frailty and cognitive impairment–a review of the evidence and causal mechanisms. Ageing Res Rev. 2013;12(4):840–851. | ||
Nakamura K. A “super-aged” society and the “locomotive syndrome”. J Orthop Sci. 2008;13(1):1–2. | ||
Ministry of Health, Labour and Welfare. Measures for national health promotion, Ref-70. Available from: http://www.mhlw.go.jp/english/wp/wp-hw2/part2/p3_0024.pdf. Accessed September 22, 2016. | ||
Yoshimura N, Muraki S, Oka H, et al. Prevalence of knee osteoarthritis, lumbar spondylosis, and osteoporosis in Japanese men and women: the research on osteoarthritis/osteoporosis against disability study. J Bone Miner Metab. 2009;27(5):620–628. | ||
Seichi A, Hoshino Y, Doi T, Akai M, Tobimatsu Y, Iwaya T. Development of a screening tool for risk of locomotive syndrome in the elderly: the 25-question Geriatric Locomotive Function Scale. J Orthop Sci. 2012;17(2):163–172. | ||
Nakamura M, Hashizume H, Oka H, et al. Physical performance measures associated with locomotive syndrome in middle-aged and older Japanese women. J Geriatr Phys Ther. 2015;38(4):202–207. | ||
Muramoto A, Imagama S, Ito Z, Hirano K, Ishiguro N, Hasegawa Y. Physical performance tests are useful for evaluating and monitoring the severity of locomotive syndrome. J Orthop Sci. 2012;17(6):782–788. | ||
Seichi A, Hoshino Y, Doi T, et al. Determination of the optimal cutoff time to use when screening elderly people for locomotive syndrome using the one-leg standing test (with eyes open). J Orthop Sci. 2014;19(4):620–626. | ||
Fukumori N, Yamamoto Y, Takegami M, et al. Association between hand-grip strength and depressive symptoms: Locomotive Syndrome and Health Outcomes in Aizu Cohort Study (LOHAS). Age Ageing. 2015;44(4):592–598. | ||
Yoshimura N, Oka H, Muraki S, et al. Reference values for hand grip strength, muscle mass, walking time, and one-leg standing time as indices for locomotive syndrome and associated disability: the second survey of the ROAD study. J Orthop Sci. 2011;16(6):768–777. | ||
Nourhashémi F, Andrieu S, Gillette-Guyonnet S, et al. Is there a relationship between fat-free soft tissue mass and low cognitive function? Results from a study of 7,105 women. J Am Geriatr Soc. 2002;50(11):1796–1801. | ||
Doi T, Shimada H, Makizako H, et al. Cognitive function and gait speed under normal and dual-task walking among older adults with mild cognitive impairment. BMC Neurol. 2014;14:67. | ||
Burns JM, Johnson DK, Watts A, Swerdlow RH, Brooks WM. Reduced lean mass in early Alzheimer disease and its association with brain atrophy. Arch Neurol. 2010;67(4):428–433. | ||
Momoki C, Habu D, Ogura J, et al. Relationships between sarcopenia and household status and locomotive syndrome in a community-dwelling elderly women in Japan. Geriatr Gerontol Int. 2017;17(1):54–60. | ||
Chang KV, Hsu TH, Wu WT, Huang KC, Han DS. Association between sarcopenia and cognitive impairment: a systematic review and meta-analysis. J Am Med Dir Assoc. 2016;17(12):1164.e7–1164.e15. | ||
Lyketsos CG, Lopez O, Jones B, Fitzpatrick AL, Breitner J, DeKosky S. Prevalence of neuropsychiatric symptoms in dementia and mild cognitive impairment: results from the cardiovascular health study. JAMA. 2002;288(12):1475–1483. | ||
Park B, Park J, Jun JK. Cognitive impairment, depression, comorbidity of the two and associated factors among the early sixties in a rural Korean community. PLoS One. 2013;8(11):e79460. | ||
Giri M, Chen T, Yu W, Lü Y. Prevalence and correlates of cognitive impairment and depression among elderly people in the world’s fastest growing city, Chongqing, People’s Republic of China. Clin Interv Aging. 2016;11:1091–1098. | ||
Ikemoto T, Inoue M, Nakata M, et al. Locomotive syndrome is associated not only with physical capacity but also degree of depression. J Orthop Sci. 2016;21(3):361–365. | ||
Nakamura M, Hashizume H, Nomura S, Kono R, Utsunomiya H. The relationship between locomotive syndrome and depression in community-dwelling elderly people. Curr Gerontol Geriatr Res. 2017;2017:4104802. | ||
Folstein MF, Folstein SE, McHugh PR. “Mini-mental state”. A practical method for grading the cognitive state of patients for the clinician. J Psychiatr Res. 1975;12(3):189–198. | ||
Zhou S, Zhu J, Zhang N, et al. The influence of education on Chinese version of Montreal cognitive assessment in detecting amnesic mild cognitive impairment among older people in a Beijing rural community. ScientificWorldJournal. 2014;2014:689456. | ||
Whitmer RA, Gustafson DR, Barrett-Connor E, Haan MN, Gunderson EP, Yaffe K. Central obesity and increased risk of dementia more than three decades later. Neurology. 2008;71(14):1057–1064. | ||
Buffa R, Mereu E, Putzu P, Mereu RM, Marini E. Lower lean mass and higher percent fat mass in patients with Alzheimer’s disease. Exp Gerontol. 2014;58:30–33. | ||
Nakamura M, Kobashi Y, Hashizume H, et al. Locomotive syndrome is associated with body composition and cardiometabolic disorders in elderly Japanese women. BMC Geriatr. 2016;16(1):166. | ||
Kearney FC, Harwood RH, Gladman JR, Lincoln N, Masud T. The relationship between executive function and falls and gait abnormalities in older adults: a systematic review. Dement Geriatr Cogn Disord. 2013;36(1–2):20–35. | ||
Demnitz N, Esser P, Dawes H, et al. A systematic review and meta-analysis of cross-sectional studies examining the relationship between mobility and cognition in healthy older adults. Gait Posture. 2016;50:164–174. | ||
Piedra LM, Andrade FC, Hernandez R, Boughton SW, Trejo L, Sarkisian CA. The influence of exercise on cognitive function in older Hispanic/Latino adults: results from the “¡Caminemos!” study. Gerontologist. Epub 2017 Mar 15. | ||
Hausdorff JM, Buchman AS. What links gait speed and MCI with dementia? A fresh look at the association between motor and cognitive function. J Gerontol A Biol Sci Med Sci. 2013;68(4):409–411. | ||
Buracchio T, Dodge HH, Howieson D, Wasserman D, Kaye J. The trajectory of gait speed preceding mild cognitive impairment. Arch Neurol. 2010;67(8):980–986. | ||
Verghese J, Wang C, Lipton RB, Holtzer R. Motoric cognitive risk syndrome and the risk of dementia. J Gerontol A Biol Sci Med Sci. 2013;68(4):412–418. | ||
Verghese J, Annweiler C, Ayers E, et al. Motoric cognitive risk syndrome: multicountry prevalence and dementia risk. Neurology. 2014;83(8):718–726. | ||
Tedesco AM, Chiricozzi FR, Clausi S, Lupo M, Molinari M, Leggio MG. The cerebellar cognitive profile. Brain. 2011;134(Pt 12):3672–3686. | ||
Timmann D, Drepper J, Frings M, et al. The human cerebellum contributes to motor, emotional and cognitive associative learning. A review. Cortex. 2010;46(7):845–857. | ||
Stoodley CJ, Schmahmann JD. Evidence for topographic organization in the cerebellum of motor control versus cognitive and affective processing. Cortex. 2010;46(7):831–844. | ||
Guo CC, Tan R, Hodges JR, Hu X, Sami S, Hornberger M. Network-selective vulnerability of the human cerebellum to Alzheimer’s disease and frontotemporal dementia. Brain. 2016;139(Pt 5):1527–1538. | ||
Schmahmann JD, Sherman JC. The cerebellar cognitive affective syndrome. Brain. 1998;121(Pt 4):561–579. | ||
The Japanese Orthopaedic Association. Locomo degree determination method. Available from: https://locomo-joa.jp/check/judge/pdf/locomo-testjudge.pdf. Accessed August 1, 2017. |
 © 2017 The Author(s). This work is published and licensed by Dove Medical Press Limited. The full terms of this license are available at https://www.dovepress.com/terms.php and incorporate the Creative Commons Attribution - Non Commercial (unported, v3.0) License.
By accessing the work you hereby accept the Terms. Non-commercial uses of the work are permitted without any further permission from Dove Medical Press Limited, provided the work is properly attributed. For permission for commercial use of this work, please see paragraphs 4.2 and 5 of our Terms.
© 2017 The Author(s). This work is published and licensed by Dove Medical Press Limited. The full terms of this license are available at https://www.dovepress.com/terms.php and incorporate the Creative Commons Attribution - Non Commercial (unported, v3.0) License.
By accessing the work you hereby accept the Terms. Non-commercial uses of the work are permitted without any further permission from Dove Medical Press Limited, provided the work is properly attributed. For permission for commercial use of this work, please see paragraphs 4.2 and 5 of our Terms.