")
Back to Journals » International Journal of Nanomedicine » Volume 13
Codelivery of doxorubicin and elacridar to target both liver cancer cells and stem cells by polylactide-co-glycolide/d-alpha-tocopherol polyethylene glycol 1000 succinate nanoparticles
Authors Chen D, Pan X, Xie F, Lu Y , Zou H, Yin C, Zhang Y, Gao J
Received 30 July 2018
Accepted for publication 23 September 2018
Published 25 October 2018 Volume 2018:13 Pages 6855—6870
DOI https://doi.org/10.2147/IJN.S181928
Checked for plagiarism Yes
Review by Single anonymous peer review
Peer reviewer comments 2
Editor who approved publication: Dr Linlin Sun
Dazhong Chen,1–3,* Xiaoli Pan,4,* Fangyuan Xie,5,* Ying Lu,2 Hao Zou,2 Chuan Yin,6 Yu Zhang,7 Jie Gao1,2
1Department of Gastrointestinal Surgery, The Second Affiliated Hospital of Wenzhou Medical University, Wenzhou 325027, China; 2Department of Pharmaceutical Sciences, Second Military Medical University, Shanghai 200433, China; 3Department of Planning, Kunming General Hospital of Chengdu Military Command, Yunnan 650032, China; 4Division of Gastroenterology, Union Hospital, Tongji Medical College, Huazhong University of Science and Technology, Wuhan 430022, China; 5Department of Pharmacy, Shanghai Eastern Hepatobiliary Surgery Hospital, Shanghai 200438, China; 6Department of Gastroenterology, Changzheng Hospital, Second Military Medical University, Shanghai 200003, China; 7Department of Oncology, Xiangyang Central Hospital, Affiliated Hospital of Hubei University of Arts and Science, Hubei 441000, China
*These authors contributed equally to this work
Purpose: Liver cancer is the third leading cause of cancer-related deaths worldwide. Liver cancer stem cells (LCSCs) are a subpopulation of cancer cells that are responsible for the initiation, progression, drug resistance, recurrence, and metastasis of liver cancer. Recent studies have suggested that the eradication of both LCSCs and liver cancer cells is necessary because the conversion of cancer stem cells (CSCs) to cancer cells occasionally occurs. As ATP-binding cassette (ABC) transporters are overexpressed in both CSCs and cancer cells, combined therapies using ABC transporter inhibitors and chemotherapy drugs could show superior therapeutic efficacy in liver cancer. In this study, we developed poly(lactide-co-glycolide)/d-alpha-tocopherol polyethylene glycol 1000 succinate nanoparticles to accomplish the simultaneous delivery of an optimized ratio of doxorubicin (DOX) and elacridar (ELC) to target both LCSCs and liver cancer cells.
Methods: Median-effect analysis was used for screening of DOX and ELC for synergy in liver cancer cells (HepG2 cells) and LCSCs (HepG2 tumor sphere [HepG2-TS]). Then, nanoparticles loaded with DOX and ELC at the optimized ratio (NDEs) were prepared by nanoprecipitation method. The cytotoxicity and colony and tumor sphere formation ability of nanoparticles were investigated in vitro, and the tissue distribution and antitumor activity of nanoparticles were evaluated in vivo.
Results: We demonstrated that a DOX/ELC molar ratio of 1:1 was synergistic in HepG2 cells and HepG2-TS. NDEs were shown to exhibit significantly increased cytotoxic effects against both HepG2 and HepG2-TS compared with DOX-loaded nanoparticles (NDs) or ELC-loaded nanoparticles (NEs) in vitro. In vivo studies demonstrated that the nanoparticles exhibited better tumor targeting, with NDE showing the strongest antitumor activity with lower systemic toxicity.
Conclusion: These results suggested that NDE represented a promising combination therapy against liver cancer by targeting both liver cancer cells and CSCs.
Keywords: combined therapy, cancer stem cells, liver cancer, doxorubicin, elacridar, nanoparticles
Introduction
Liver cancer is the fifth most common cancer and the third leading cause of cancer-related deaths worldwide.1,2 Liver cancer stem cells (LCSCs) are a subpopulation of cancer cells that are responsible for the initiation, progression, drug resistance, recurrence, and metastasis of liver cancer.3–5 LCSCs can be successfully enriched based on the use of various marker proteins such as CD133 and CD90.6 However, these targets are not highly specific or sensitive for the identification of LCSCs.7 In addition, the LCSCs isolated based on these markers exhibit low viability. Tumor sphere formation is thought to be a promising approach for the isolation of various types of cancer stem cells (CSCs).8 We previously successfully obtained tumor spheres enriched with LCSCs using the sphere formation approach.9–12 Moreover, these tumor spheres from HepG2 liver cancer cells were confirmed to possess the characteristics of LCSCs and were used as a model of LCSCs to validate the in vitro and in vivo anti-CSC activities of salinomycin-loaded liposomes or nanomicelles.9–12
Current studies have indicated that the eradication of both CSCs and bulk non-CSCs is necessary because conversion of non-CSCs to CSCs occasionally occurs.13–15 Therefore, the combined therapy that targets both CSCs and non-CSCs has been carried out to increase the therapeutic efficacy of cancer.16 We have developed the combined therapy with salinomycin and doxorubicin (DOX) via nanoliposomes to target both CSCs and non-CSCs, achieving superior therapeutic efficacy toward liver cancer compared with single therapy to CSCs or non-CSCs.10
ATP-binding cassette (ABC) transporters are ubiquitous membrane-bound proteins that can transport substrates into or out of cells.17 ABC transporters include P-glycoproteins (P-gps; MDR1 and ABCB1), the ABCG2 protein, an ABC half-transporter, and multidrug resistance (MDR)-associated proteins (in the ABCC subfamily).17,18 ABC transporters transport a number of endogenous substrates across the plasma membrane and across intracellular membranes.17 By pumping various drugs out of cells at the expense of ATP, ABC transporters are responsible for MDR and the low bioavailability of drugs.18 The MDR of CSCs is thought to be attributable to the overexpression of ABC transporters,19 which also causes LCSCs to show characteristics of MDR, thereby greatly reducing the intracellular accumulation of chemotherapeutic drugs and resulting in poor therapeutic effects.19–23 Furthermore, ABC transporters are not only expressed in CSCs and MDR cancer cells but also expressed abundantly in common cancer cells, thus conferring properties of drug resistance to common cancer cells.24,25 Therefore, inhibition of ABC transporters is helpful for eliminating both CSCs and non-CSCs.
ABC transporter inhibitors (ATIs) are small molecules that inhibit ABC transporters and have been reported to reverse the MDR of CSCs.19 Elacridar (ELC) is a third-generation P-gp inhibitor and acridone imidazole amide derivative that inhibits two ABC transporters (ie, ABCB1 and ABCG2).26–29 Some studies have reported that ELC significantly inhibits the activity of ABC transporters and improves the therapeutic efficacy of chemotherapeutic drugs.30–32 DOX is a widely used drug in the treatment of advanced liver cancer.33 Thus, we hypothesized that the combined therapy with ELC and DOX may exhibit superior therapeutic efficacy in liver cancer.
Currently, combination strategies are widely applied in cancer therapy and are a standard method for cancer treatment.34,35 Notably, combinations of anticancer drugs can interact synergistically, additively, or antagonistically.34 Thus, the optimized ratio of ELC and chemotherapeutic drugs should be screened to achieve the optimal therapeutic effect of the combined therapy. However, optimized ratios of drug combinations may not be realized in vivo due to differences in the pharmacokinetics, tissue distributions, and cell membrane penetration abilities of drugs.34
Nanomedicine is the medical application of nanotechnology.36,37 During drug formulation, nanomedicine can be used to enhance the solubility, bioavailability, permeability, and stability of the formulated drug.4,33,38 Moreover, nanomedicine can deliver various drugs to the tumor site at the same time and synchronize the treatment in time and space. In addition, the in vivo pharmacokinetics and distribution of nanomedicine depend on the drug delivery system and are not related to the properties of the drug itself.34 Currently, a series of nanoparticle-based synergistic combination chemotherapy using DOX and other drugs have been reported.39,40 Thus, in this study, we used poly(lactide-co-glycolide) (PLGA)/d-alpha-tocopherol polyethylene glycol 1000 succinate (TPGS) nanoparticles to achieve a synergistic combination of DOX and ATIs. PLGA is a US Food and Drug Administration (FDA)-approved and widely investigated biodegradable polymer used in biomedical applications.41 The advantages of PLGA nanoparticles include controlled and sustained release, high-drug loading, and superior stability.42 TPGS is a water-soluble derivative of natural vitamin E. TPGS has been widely used as a surfactant, emulsifier, solubilizer, and stabilizer in the preparation of nanoparticles and other drug delivery systems.43 Several studies have shown that TPGS is also a potent inhibitor of ABC transporters and can overcome MDR in a variety of tumors.43–46 Therefore, the inclusion of TPGS in PLGA nanoparticles can increase the drug encapsulation efficiency of the nanoparticles, reduce particle size, inhibit the activity of ABC transporters, and enhance the therapeutic effects of drugs.47–49
In this study, to achieve the synergistic action of DOX and ELC in therapy of liver cancer, we optimized the ratio of DOX and ELC by median-effect analysis for drug combinations. Then, DOX and ELC with the optimized ratio were loaded into PLGA/TPGS nanoparticles. The cytotoxicity and tumor sphere formation ability of nanoparticles were investigated in vitro, and the tissue distribution and antitumor activity of nanoparticles were investigated in vivo. Our results showed that the combined therapy with DOX and ELC by nanoparticles achieved superior therapeutic efficacy toward both LCSCs and liver cancer cells.
Materials and methods
Materials, cell culture, and mice
DOX was purchased from Dalian Meilun Biotech Co., Ltd. (Dalian, China; purity, ≥98%). ELC was purchased from Nanjing Chemlin Chemical Industry Co., Ltd. (Nanjing, China; purity, 98%). PLGA (acid terminated, lactide:glycolide, 50:50; molecular weight: 24,000–38,000 Da), TPGS, dimethyl sulfoxide (DMSO), EGF, basic fibroblast growth factor (bFGF), and insulin–transferrin–selenium (ITS) were obtained from Sigma-Aldrich Co. (St Louis, MO, USA). DMEM with high glucose, DMEM-F12, penicillin-streptomycin, and PBS were provided by Thermo Scientific Hyclone (IL, USA). FBS, B27, StemPro Accutase Cell Dissociation Reagent, and trypsin–EDTA solution were provided by Thermo Fisher Scientific (Waltham, MA, USA). The Cell Counting Kit 8 (CCK-8) was obtained from Dojindo Laboratories (Kumamoto, Japan). DiR was purchased from Biotium (CA, USA). DAPI and polylysine were purchased from Beyotime Biotechnology (Shanghai, China). Crystal violet and all organic reagents were purchased from Sinopharm (Shanghai, China).
HepG2 human liver cancer cells were purchased from American Type Culture Collection (Manassas, VA, USA) and maintained in a humidified atmosphere of 5% CO2 at 37°C. The cells were cultured in DMEM supplemented with 10% FBS, 100 U/mL penicillin, and 100 μg/mL streptomycin. To obtain HepG2 tumor spheres (HepG2-TSs), HepG2 cells were plated at 1×10⁴ cells/mL in DMEM-F12 supplemented with 1× B27, 20 ng/mL bFGF, 20 ng/mL EGF, and 1× ITS. The medium was added to 3 mL fresh medium for 3 days. After about 7 days, HepG2-TS formed. Tumor spheres were enzymatically dissociated once a week by incubating in StemPro Accutase Cell Dissociation Reagent Thermo Fisher Scientific (Waltham, MA, USA) for 10 minutes at 37°C and plated at 1×10⁴ cells/mL. Before the experiment, all cells were passed through a 100-μm sieve (Becton Dickinson; Franklin Lakes, NJ, USA). From this, we demonstrated that HepG2-TS possessed the characteristics of LCSCs.9–12
All animal procedures were approved by the Committee on Animals of the Second Military Medical University. All animal procedures were performed in accordance with the guidelines of the Committee on Animal of the Second Military Medical University. All nude mice (male, 18–20 g, 6–8 weeks of age) were purchased from Shanghai Experimental Animal Center of Chinese Academic of Sciences (Shanghai, China). Before use in experiments, the mice were allowed to acclimate for 3 days.
Median-effect analysis of drug combinations
The cytotoxic effects of DOX and ELC against HepG2 cells and HepG2-TS were measured by CCK-8 assays. Briefly, the cells were seeded in 96-well plates at a density of 5×10³ cells/well and incubated overnight at 37°C to allow for cell attachment. The cells were then incubated for 48 hours with a series of varying concentrations of DOX, ELC, or DOX+ELC. For studies on the combined effects of DOX and ELC, fixed molar ratios of DOX and ELC (4:1, 2:1, 1:1, 1:2, and 1:4) were used. Subsequently, 10 μL CCK-8 solution was added to each well to evaluate cytotoxicity. After incubation for about 2 hours, the absorbance of each well was measured at 450 nm using a Multiskan MK3 Microplate Reader (Thermo Fisher Scientific). The following formula was used to calculate the cell viability: ([AE−AB]/[AC−AB]) × 100%. AE, AC, and AB were defined as the absorbance of experimental samples, untreated samples, and blank controls, respectively. The optimal synergistic molar ratio of DOX and ELC was calculated using CompuSyn software (Biosoft, Cambridge, UK), a software program developed using the median-effect principle described by Chou and Talalay.50 The combination index (CI) represents the effect of combination drugs, and CI<1, CI=1, and CI>1 express synergistic, additive, and antagonistic effects, respectively.
Preparation of nanoparticles
The nanoprecipitation method was employed to generate nanoparticles as described previously.51 Briefly, DOX⋅HCl (2 mg) was dissolved in 4 mL dimethylformamide (DMF) containing 3 μL triethylamine for 12 hours at room temperature, and 90 mg PLGA/TPGS mixture (with 20% TPGS percentage) and ELC were dissolved in 4 mL DMF. Then, the two solutions were mixed and injected into 0.03% (w/v) TPGS aqueous solution under stirring to form a homogenous emulsion. The extra organic solvent was removed by dialysis with a dialysis bag (MWCO, 3500) overnight. Then, the resulting nanoparticles were centrifuged and washed to remove the free drugs and excess TPGS. The nanoparticles were resuspended and frozen-dry for 48 hours to generate nanoparticle powders. DiR-loaded nanoparticles (NDiRs) were developed by incorporating DiR into the nanoparticles as ELC. The following terms were used: blank nanoparticles (NBs), DOX-loaded nanoparticles (NDs), ELC-loaded nanoparticles (NEs), nanoparticles loaded with DOX and ELC at the optimized ratio (NDEs), and NDiRs.
Western blotting
Western blot analysis of ABCG2 and P-gp was performed as described previously.52 Briefly, extracted protein (40 μg) was separated by sodium dodecyl sulfate polyacrylamide gel electrophoresis on 10% gradient gels and transferred to polyvinylidene fluoride membranes. Blots were incubated with primary rabbit anti-human ABCG2 or P-gp monoclonal antibodies (1:1,000, Abcam, Cambridge, UK), followed by incubation with secondary antibodies (1:5,000, horseradish peroxidase-labeled goat anti-rabbit IgG; Abcam). The bands were detected with an enhanced chemiluminescence kit (GE Healthcare; Chicago, IL, USA) and visualized with a ChemiDoc XRS system (Bio-Rad Laboratories Inc., Hercules, CA, USA).
In vitro cellular uptake
The cellular uptake of nanoparticles in HepG2 cells or HepG2-TS was determined by confocal laser scanning microscopy (CLSM; TCS-SP5; Leica Microsystems, Wetzlar, Germany). DOX was used as a fluorescence probe. Briefly, HepG2 cells or HepG2-TS were seeded on glass bottom dishes treated with free DOX or ND, which had an equivalent concentration of DOX (0.1 μM) for 2 hours at 37°C. After incubation, the cells were washed with PBS for three times and fixed with 4% paraformaldehyde for 10 minutes. Then, the cells were stained with 1 mg/mL DAPI for 10 minutes and washed three times. Finally, the immunofluorescence of cells was observed by CLSM.
Cytotoxicity assays
The cytotoxic effects of nanoparticles against HepG2 cells and HepG2-TS were measured using CCK-8 assays. Briefly, the cells were seeded at a density of 5×10³ cells/well in 96-well plates and incubated overnight. Then, the medium was replaced with fresh medium containing varying concentrations of DOX, ELC, DOX+ELC, NB, ND, NE, ND+NE, or NDE and incubated for 48 hours. Next, 10 μL CCK-8 solution was added to each well to evaluate cytotoxicity. After incubation for about 2 hours, the absorbance of each well was measured at 450 nm using a Multiskan MK3 Microplate Reader (Thermo Fisher Scientific). The following formula was used to calculate the cell viability: ([AE−AB]/[AC−AB]) × 100%. AE, AC, and AB were defined as the absorbance of experimental samples, untreated samples, and blank controls, respectively.
Colony formation assays
HepG2 cells were seeded at a density of 1×10⁵ cells/well in 12-well plates and incubated overnight. Then, the cells were incubated with DOX, ELC, DOX+ELC, NBs, ND, NE, ND+NE, or NDE (the final concentrations of both DOX and ELC were 0.01 μM). After incubation for 24 hours, the cells were trypsinized and seeded in six-well plates at a density of 800 cells/well and then grown in a culture medium for 8–10 days at 37°C. Finally, colonies were stained with 1% crystal violet for 20 minutes at room temperature, and the number of colonies was counted under a microscope.
Tumor sphere formation assays
HepG2 cells were trypsinized and seeded at a density of 500 cells/well in Corning ultra-low adherent 96-well plates (Tewksbury, MA, USA) and incubated overnight. The components of cell medium included DMEM/F12, B27 (1×), ITS (1×), EGF (20 ng/mL), and bFGF (20 ng/mL). The cells were then incubated with DOX, ELC, DOX+ELC, NB, ND, NE, ND+NE, or NDE (the final concentrations of both DOX and ELC were 0.15 μM). After 7 days, the number of tumor spheres was counted under a microscope.
Tissue distribution study in vivo
Analysis of the tissue distribution of nanoparticles was performed as described below. DiR was used as a fluorescence probe in vivo. Briefly, BALB/c nude mice (male, 4–6 weeks, about 20 g) were inoculated subcutaneously into the right back with 2×10⁶ HepG2 cells. When tumor volume reached about 300 mm3, the mice bearing the tumors were randomly assigned to three groups: saline, free DiR, and NDiR. Then, saline, free DiR, and NDiR were injected intravenously as a single dose (10 μg DiR per mouse) via the tail vein. The mice were anesthetized by isoflurane, and in vivo fluorescence images were observed and recorded at excitation/emission wavelengths of 745/820 nm using a Maestro in vivo imaging system (Maestro, MA, USA) at predetermined time points (2, 4, 6, 8, 12, and 24 hours). After 24 hours, the mice were euthanized, and the excised organs and tumors were imaged. Quantitative analysis of DiR accumulation in the organs and tumors was expressed by the total radiant efficiency ([p/s]/[μW/cm2]).
Pharmacokinetic studies
Fifteen Sprague Dawley (SD) rats (male, 200±20 g) were randomly assigned to three groups (five per group). The rats were intravenously administered with DOX+ELC, ND+NE, and NDE, equivalent to 5 and 5.18 mg/kg of DOX and ELC, respectively. Blood samples were collected from the fossa orbitalis vein into heparinized centrifuge tubes at different time points and immediately centrifuged at 12,000 rpm for 15 minutes to collect the plasma fraction. All plasma samples were pretreated as follows: 100 μL of plasma was mixed with 100 μL of daunorubicin (10 μg/mL) and 200 μL of methanol. After vortexing for 1 minute, the sample was centrifuged at 12,000 rpm for 5 minutes, and 100 μL of the supernatant was separated for liquid chromatography – mass spectrometry analysis. Plasma concentrations of DOX and ELC were determined using an Agilent Technologies 1200 series LC/MS system (Agilent Technologies, Santa Clara, CA, USA) equipped with a Symmetry C18 column (3.0×100 mm, 3.5 μm; Milford, MA, USA). The mobile phase was composed of A/B with gradient conditions of 70:30 (v/v) at 1.5–5.0 minutes, gradually changing to 30:70 (v/v) at 5.0–5.5 minutes and 30:70 (v/v) at 5.5–9.0 minutes, where A was 0.1% (v/v) formic acid in water, B was acetonitrile, and flow rate was 0.8 mL/min. Quantification was performed using selected ion monitoring-positive mode with DOX ion m/z 544.2 [M+H]+, ELC ion m/z 564.3 [M+H]+, and daunorubicin m/z 528.2 [M+H]+. The optimal mass parameters were as follows: Fragmentor, 100 eV; drying gas flow rate, 10 L/min; nebulizer pressure, 45 psig; and drying gas temperature, 350°C. Pharmacokinetics parameters were calculated using the BAPP software.
In vivo antitumor assays of nanoparticles in mice
The therapeutic effects of the nanoparticles in vivo were evaluated in mice bearing subcutaneous tumors derived from liver cancer cells. Briefly, the BALB/c nude mice (male, 4–6 weeks, about 20 g) were inoculated subcutaneously on the right back with 1.5×10⁶ HepG2 cells. When the tumor volume reached about 80 mm3, nude mice bearing tumors were randomly assigned to nine groups (n=6 mice per group). Then, mice were injected intravenously with DOX, ELC, DOX+ELC, NB, ND, NE, ND+NE, and NDE every 3 days for four times, and the doses of DOX and ELC were 5 and 5.18 mg/kg, respectively, to maintain a synergistic ratio. After the fourth treatment, mice were observed for another 2 weeks. Tumors were measured using a caliper every 3 days, and the tumor volume was calculated using the following formula: (width2× length)/2. The body weights of the mice were monitored every 3 days.
Statistical analyses
Data in this study were analyzed using SPSS 13.0 software (SPSS Inc., Chicago, IL, USA). Student’s unpaired t-tests and one-way ANOVA with Dunnett’s or Newman Keul’s posttests were used. Differences with P-values less than 0.05 indicated significance.
Results
ABCG2 and P-gp overexpression in HepG2-TS
Western blot analysis revealed that HepG2-TS abundantly expressed ABCG2 and P-gp (Figure 1). The expression levels of ABCG2 and P-gp were higher in HepG2-TS than in HepG2 cells.
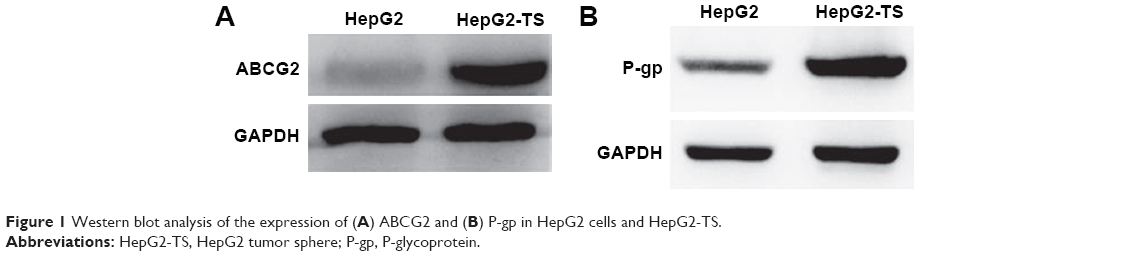 | Figure 1 Western blot analysis of the expression of (A) ABCG2 and (B) P-gp in HepG2 cells and HepG2-TS. |
In vitro screening of DOX and ELC for synergy and antagonism
To screen the synergistic ratio of DOX and ELC, the median-effect analysis described by Chou and Talaly50 was used. First, the cytotoxicity of DOX and ELC was determined in HepG2 cells and HepG2-TS. DOX and ELC showed concentration-dependent cytotoxicity toward HepG2 cells and HepG2-TS (Figure 2). The half maximal inhibitory concentrations (IC50) of DOX and ELC were calculated and compared between HepG2 cells and HepG2-TS. The IC50 values of DOX were 0.230±0.022 and 0.477±0.0514 μM in HepG2 cells and HepG2-TS, respectively, and the IC50 values of ELC were 9.266±2.609 and 13.740±4.271 μM in HepG2 cells and HepG2-TS, respectively. The IC50 values of DOX and ELC were significantly increased in HepG2-TS compared with those in HepG2 cells (P<0.05). These data indicated that HepG2 cells were more sensitive to DOX and ELC than HepG2-TS.
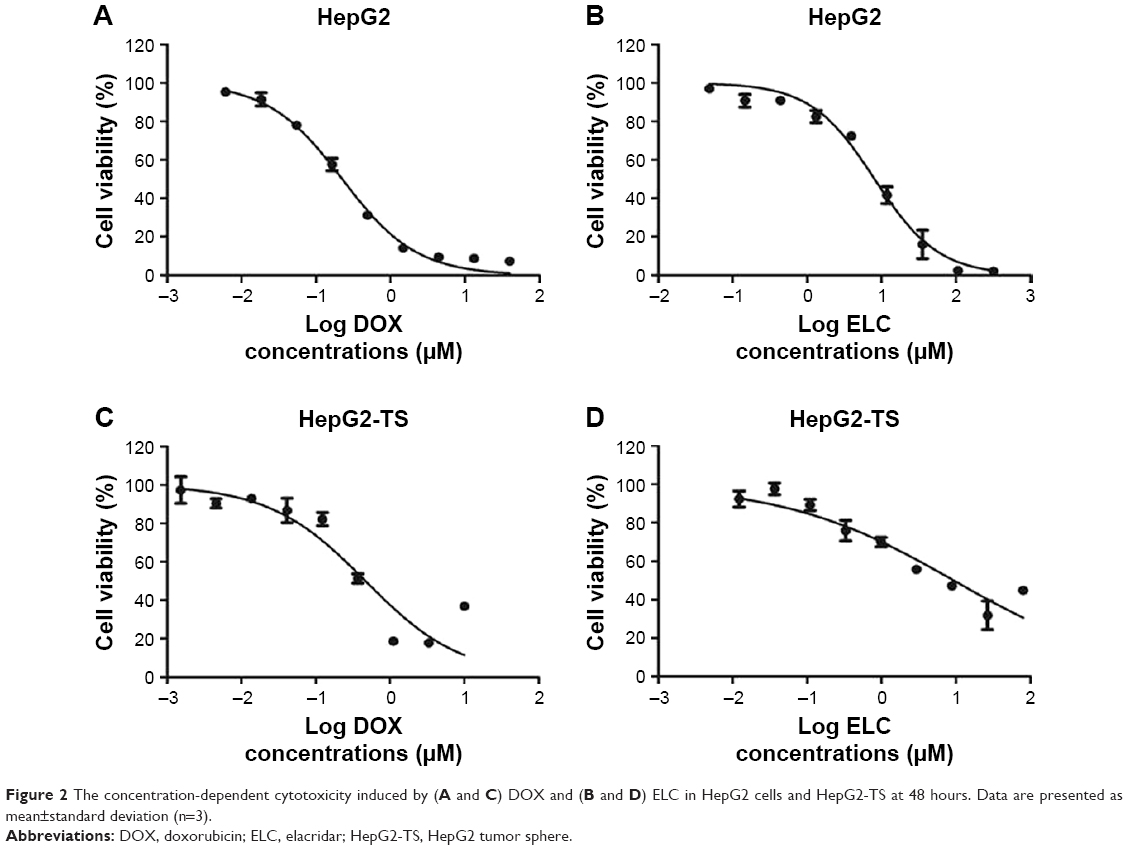 | Figure 2 The concentration-dependent cytotoxicity induced by (A and C) DOX and (B and D) ELC in HepG2 cells and HepG2-TS at 48 hours. Data are presented as mean±standard deviation (n=3). |
Subsequently, various ratios and concentrations of DOX and ELC were incubated with HepG2 cells and HepG2-TS to evaluate cytotoxicity and determine the optimal synergistic ratio (Figure 3). Synergistic interactions were observed in vitro at certain drug/drug molar ratios, whereas other ratios resulted in an additive or antagonistic effect. Synergy reflected by CI<1 was observed at most of the molar ratios and high drug concentrations (high fraction affected), whereas low drug concentrations (low fraction affected) expressed antagonistic effects in HepG2 cells and HepG2-TS. Notably, the CI values of the DOX/ELC molar ratio of 1:1 were lower than 1 at most drug concentrations in HepG2 cells and were lower than those of other DOX/ELC molar ratios at every drug concentration in HepG2-TS. Thus, the DOX/ELC molar ratio of 1:1 was considered the optimal synergistic ratio and was chosen for co-encapsulation of the two drugs in the nanoparticles.
 | Figure 3 In vitro cellular uptake of nanoparticles. |
Characterization of PLGA/TPGS nanoparticles
NDE had a small size of 47.78 nm with a relatively narrow PDI of 0.169, and the encapsulation efficiencies were 56.58% for DOX and 51.66% for ELC. The drug release profile was evaluated in NDE at pH 7.4. The release rates of DOX and ELC were basically maintained at the 1:1 ratio. After 7 days, about 55% of DOX and 44% of ELC were released.
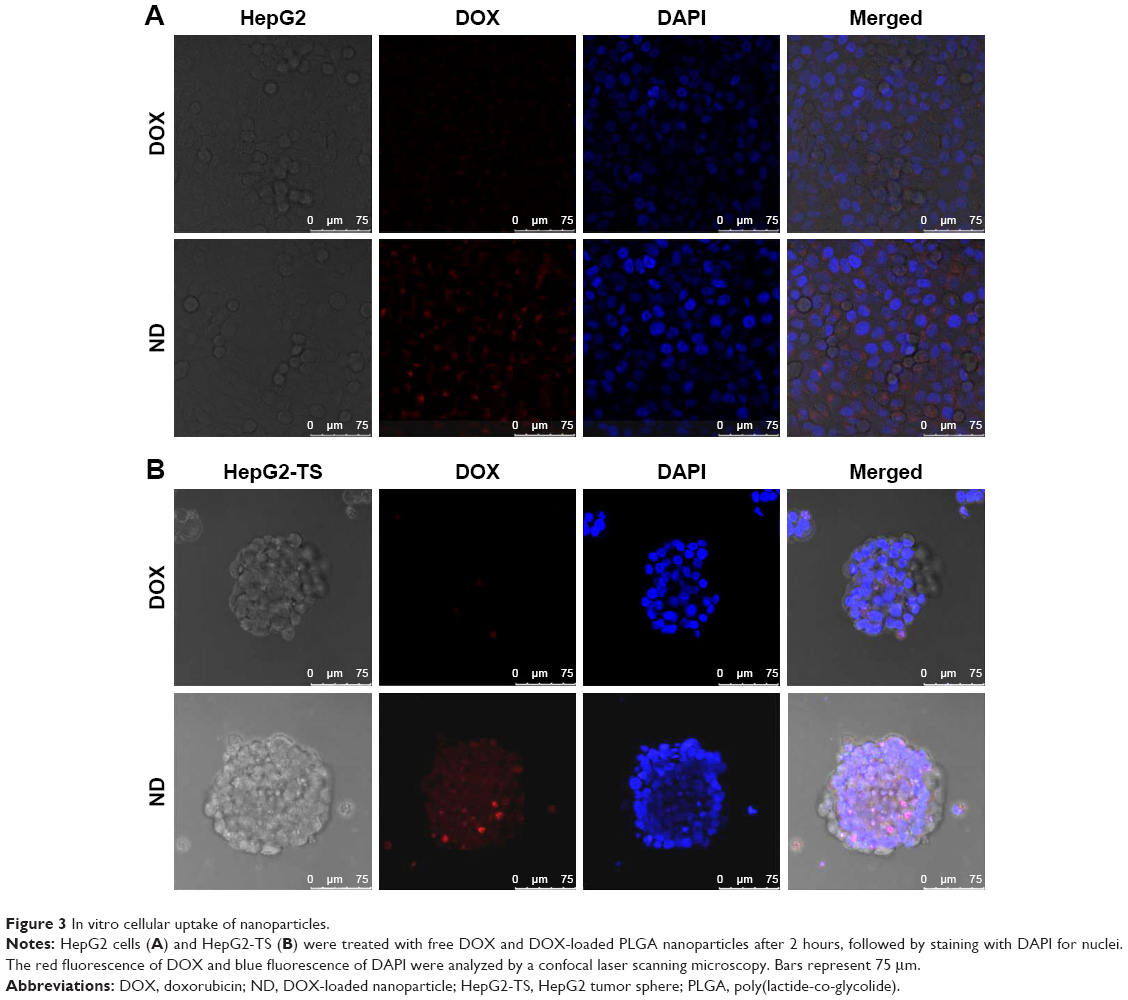
In vitro cellular uptake of nanoparticles
To evaluate the cellular uptake of drug-loaded nanoparticles in HepG2 cells and HepG2-TS, ND was prepared to confirm the cellular uptake profile of the nanoparticles. As shown in Figure 4, the images were obtained from the red fluorescence of DOX and the blue fluorescence of DAPI staining the nuclei. In both HepG2 cells and HepG2-TS, ND showed significantly increased fluorescence intensity than free DOX, indicating that nanoparticles could enhance the internalization of DOX in liver cancer cells. Moreover, the red fluorescence intensity of ND in HepG2-TS was stronger than that in HepG2 cells, suggesting that nanoparticles could improve the osmosis in HepG2-TS.
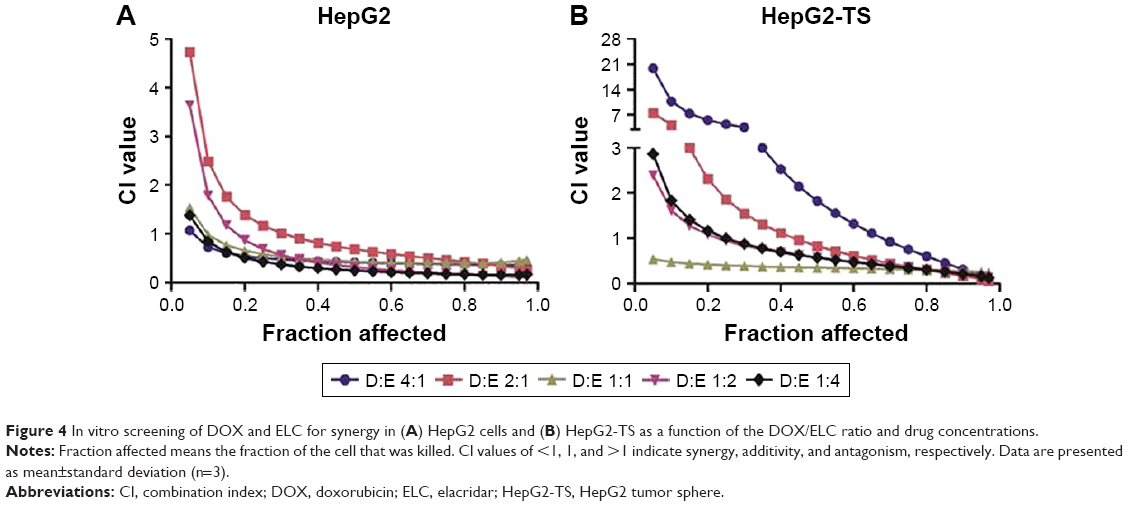 | Figure 4 In vitro screening of DOX and ELC for synergy in (A) HepG2 cells and (B) HepG2-TS as a function of the DOX/ELC ratio and drug concentrations. |
In vitro cytotoxicity of nanoparticles
First, the cytotoxicity of NB was evaluated in HepG2 cells and HepG2-TS. As shown in Figure 5A and B, NB had low toxicity toward the cells at a wide range of copolymer concentrations (~500 μM), as reflected by the fact that the cell viability still exceeded 85%, even at the highest polymer concentration. Then, the in vitro cytotoxicity of drug-loaded nanoparticles and free drugs was evaluated in HepG2 cells and HepG2-TS (Figure 5C–F). All drugs showed concentration-dependent cytotoxicity. In HepG2 cells, the IC50 of DOX+ELC was significantly lower than that of DOX (P<0.01) and the IC50 of NDE was significantly lower than that of ND (P<0.01), suggesting that the combination therapy was superior to the monotherapy. The IC50 of NDE was significantly lower than that of ND+NE (P<0.05), indicating that codelivery of nanoparticles showed enhanced cytotoxicity against HepG2 cells compared with the two nanoparticles alone. Similarly, in HepG2-TS, the IC50 of ND was significantly lower than that of DOX (P<0.01), and the IC50 values of ND+NE and NDE were significantly lower than that of DOX+ELC (P<0.001), suggesting that drug-loaded nanoparticles enhanced the cytotoxicity of free drugs. The IC50 values of ND+NE and NDE were significantly lower than that of ND (P<0.001).
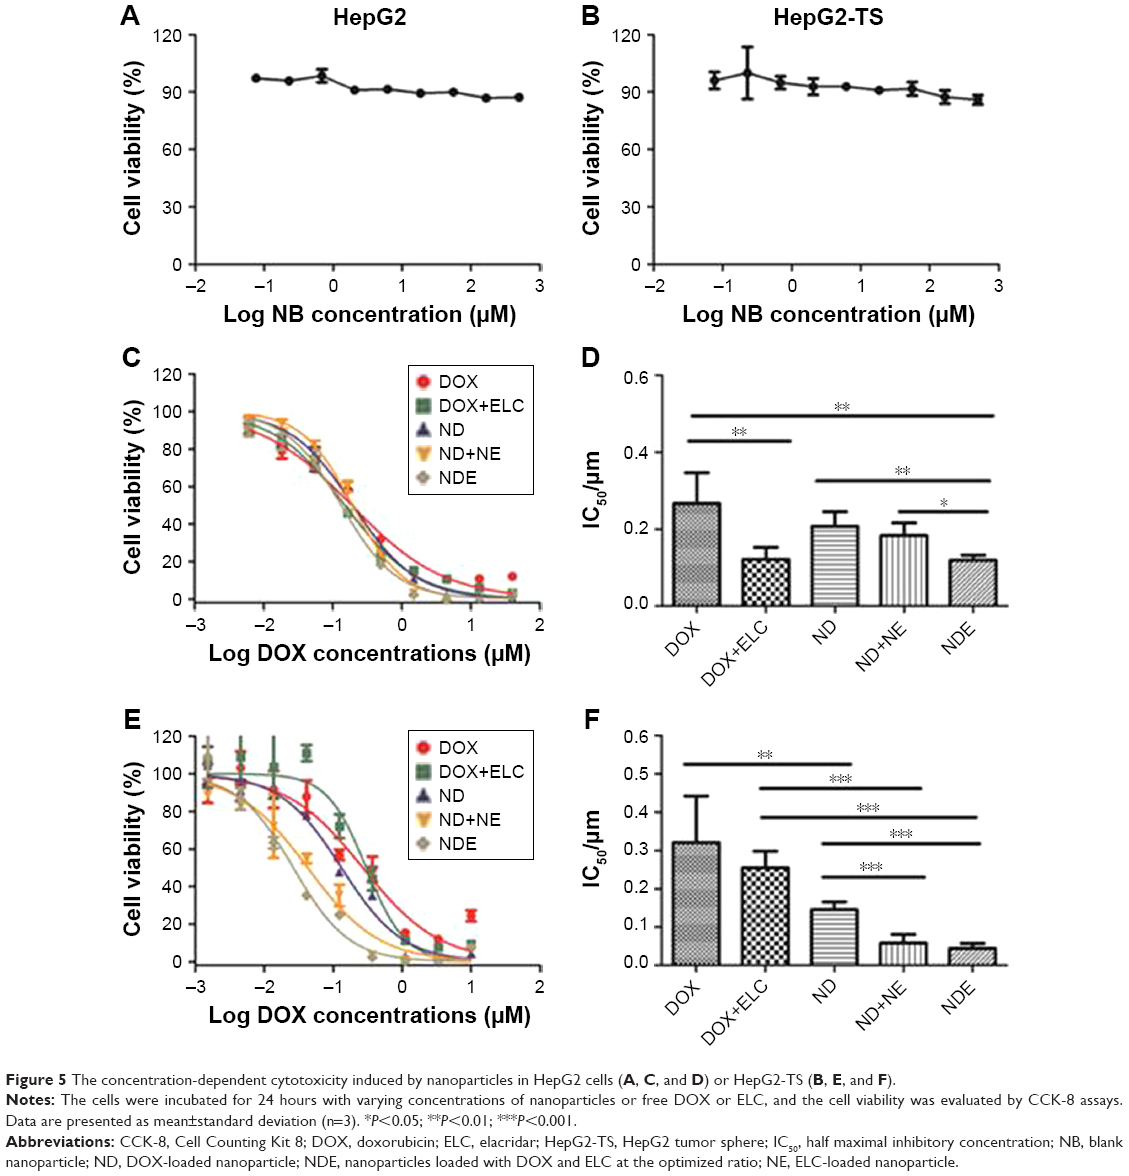 | Figure 5 The concentration-dependent cytotoxicity induced by nanoparticles in HepG2 cells (A, C, and D) or HepG2-TS (B, E, and F). |
Effects of nanoparticles on colony formation in vitro
Colonies were visualized by crystal violet staining. HepG2 cells were treated with free drugs or nanoparticles for 24 hours and grown in fresh culture medium for 8–10 days. The number of colonies formed was then counted under a microscope (Figure 6). Both DOX and ELC reduced the formation of colonies compared with the control (P<0.01 and P<0.05, respectively). Compared with DOX or ELC, the formation of colonies was significantly reduced by DOX+ELC (P<0.001 and P<0.001, respectively), indicating that combination therapy was superior to monotherapy. Similar results were obtained in nanoparticles; the number of colonies was significantly decreased by ND and NE compared with that by NB (P<0.001 and P<0.001, respectively). In addition, NDE significantly decreased colonies compared with ND (P<0.001), NE (P<0.001), and ND+NE (P<0.001), suggesting that the nanoparticle-mediated combined therapy was superior to the nanoparticle-mediated monotherapy and that codelivery of nanoparticles greatly reduced colony formation.
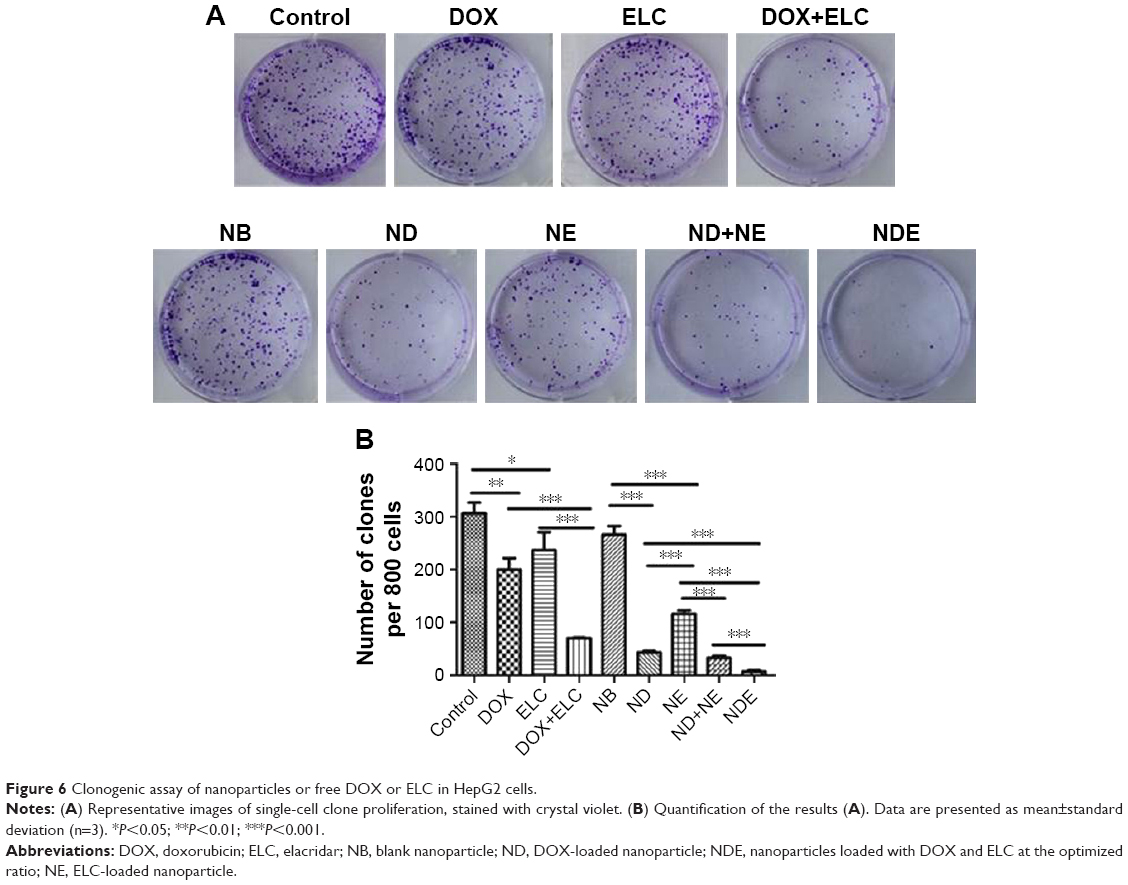 | Figure 6 Clonogenic assay of nanoparticles or free DOX or ELC in HepG2 cells. |
Effects of nanoparticles on the proportion of CSCs in vitro
Because tumor sphere formation is correlated with the proportion of CSCs, we used tumor sphere formation to evaluate the effects of nanoparticles on the proportion of CSCs in vitro. As shown in Figure 7, DOX and ELC treatments decreased tumor sphere formation compared with that in the control (P<0.001 and P<0.001, respectively). Compared with DOX or ELC, DOX+ELC significantly reduced the formation of tumor spheres (P<0.001 and P<0.001, respectively), indicating that combination therapy was superior to monotherapy. Simultaneously, NDE and ND+NE significantly reduced the formation of tumor spheres compared with ND (P<0.001) or NE alone (P<0.001), whereas there were no differences in tumor sphere formation between NDE and ND+NE, suggesting that the nanoparticle-mediated combined therapy was superior to the nanoparticle-mediated monotherapy.
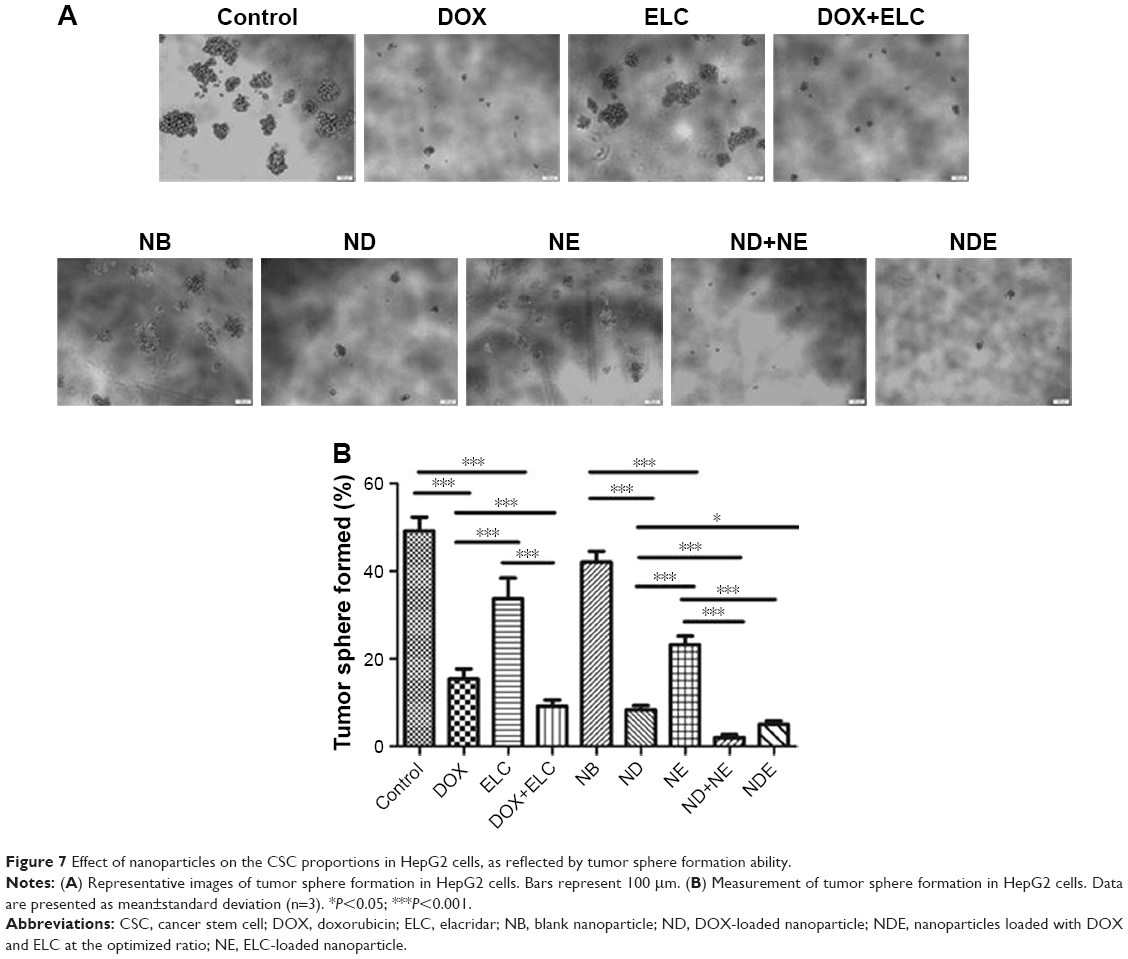 | Figure 7 Effect of nanoparticles on the CSC proportions in HepG2 cells, as reflected by tumor sphere formation ability. |
Tumor distribution in vivo
To evaluate the tissue distribution of nanoparticles in mice bearing subcutaneous tumors, the mice were treated with saline, free DiR, and NDiR via the tail vein. Real-time images are shown in Figure 8A. Obvious DiR signals of NDiR were observed in tumors within 2 hours and gradually increased. At 12 hours, the fluorescence of NDiR peaked and then gradually decreased. No obvious DiR signals were observed for free DiR. To further investigate the tissue distribution of nanoparticles, the tumors and major organs were excised and collected after 24 hours. As shown in Figure 8B and C, free DiR mainly accumulated in the liver and spleen, and NDiR accumulated in the heart, liver, spleen, lung, kidney, and tumor, with most accumulation observed in the liver and tumor. These results further confirmed that NDiR were more effectively accumulated in tumors.
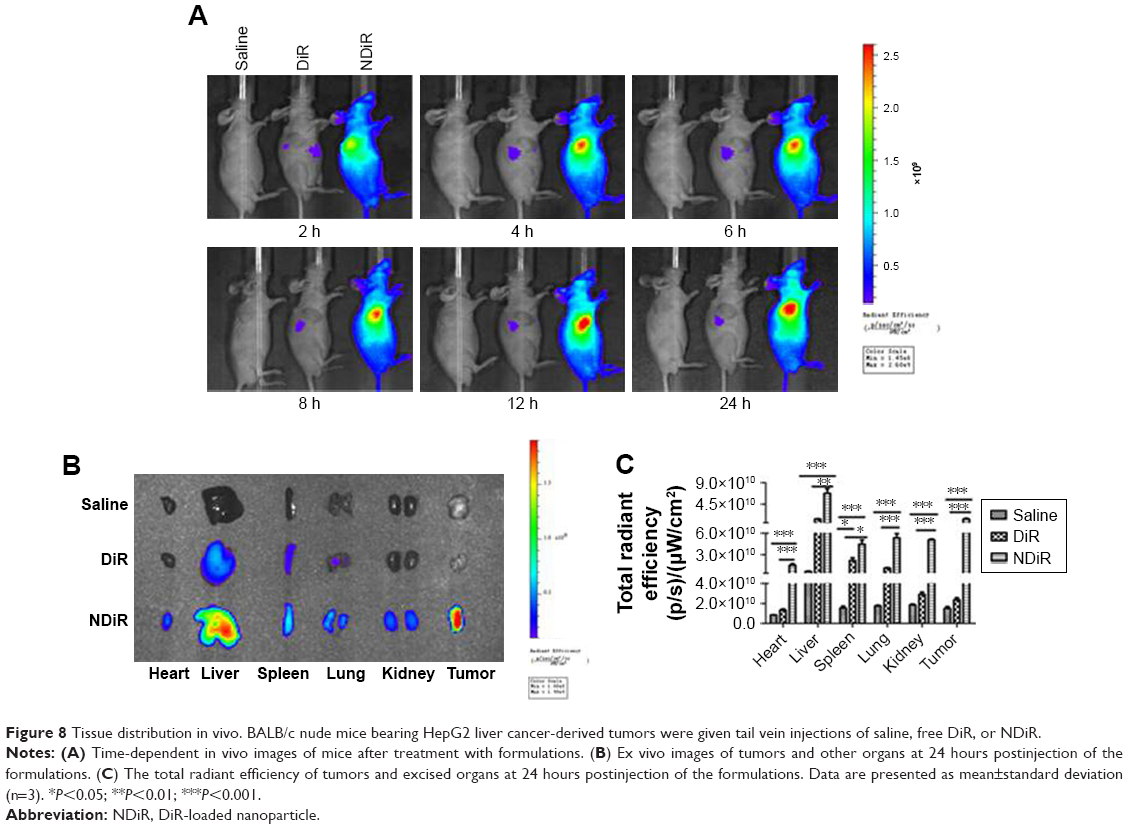 | Figure 8 Tissue distribution in vivo. BALB/c nude mice bearing HepG2 liver cancer-derived tumors were given tail vein injections of saline, free DiR, or NDiR. |
Pharmacokinetic studies
Data were analyzed by BAPP, and a noncompartment model was applied to fit. As shown in Figure 9, the blood concentration of DOX and ELC was drawn over time in three prescriptions. As shown in Tables 1 and 2, compared with free drugs, NDs and NEs could prolong the half-life, reduce the clearance rate, and increase the area under the curve (AUC), which showed that nanoparticles could prolong the circulation time and increase the concentrations of DOX and ELC in vivo.
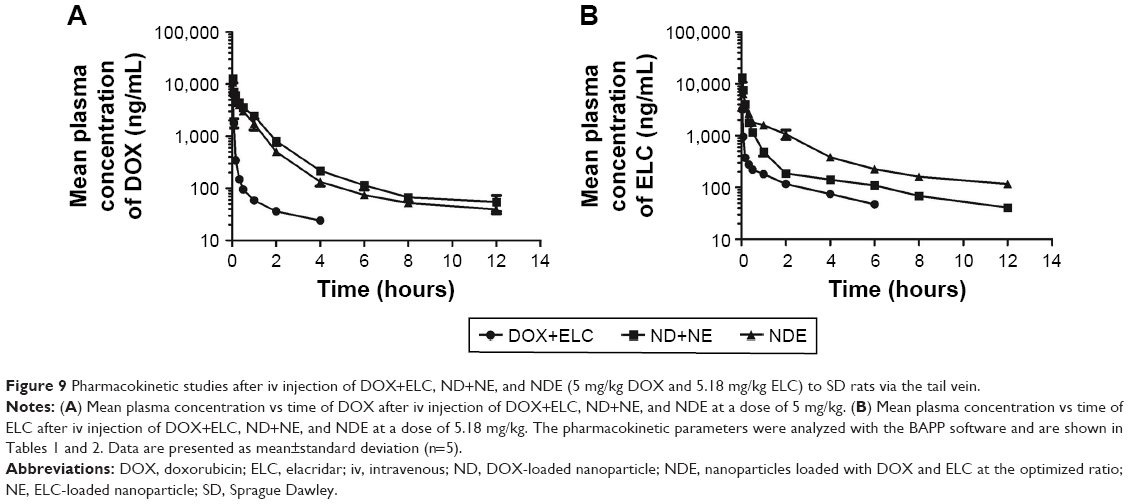 | Figure 9 Pharmacokinetic studies after iv injection of DOX+ELC, ND+NE, and NDE (5 mg/kg DOX and 5.18 mg/kg ELC) to SD rats via the tail vein. |
 | Table 1 Pharmacokinetic parameters of DOX after iv injection of DOX+ELC, ND+NE, and NDE at a dose of 5 mg/kg |
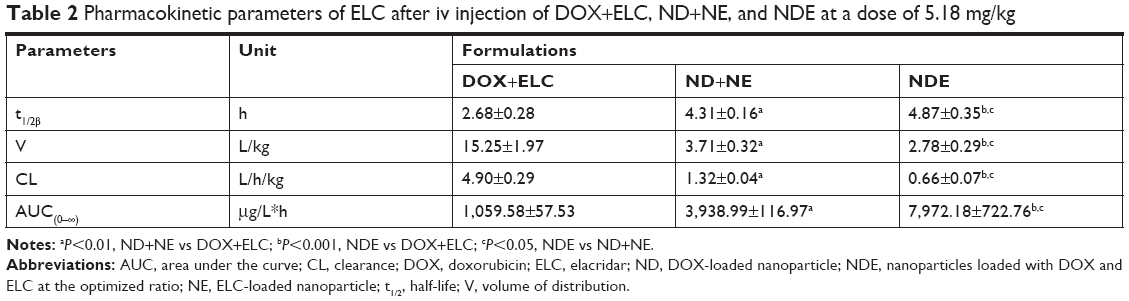 | Table 2 Pharmacokinetic parameters of ELC after iv injection of DOX+ELC, ND+NE, and NDE at a dose of 5.18 mg/kg |
Inhibition of subcutaneous tumor growth by nanoparticles in vivo
As shown in Figure 10, the antitumor efficacy of free drugs and nanoparticles was evaluated in nude mice bearing subcutaneous HepG2 tumors. First, at the end of the experiment, the tumor volumes of ELC, NE, and NB groups were similar to those in the control group treated with saline (P>0.05), and the tumor volume in the NDE group was significantly lower than those in the other drug groups (P<0.01; Figure 10A and B). Next, the excised tumors were weighed, and the tumor inhibitory rate was calculated at the end of the experiment (Figure 10C–E). Analysis of tumor morphology showed that the tumor sizes in the ELC, NE, and NB groups were as large as those in the saline-treated group, and the tumor sizes in the NDE group were smaller than those in the other drug treatment groups. The mean tumor weights in the NDE-treated group were significantly lower than those in the DOX+ELC group (P<0.01) and ND+NE group (P<0.01). The tumor inhibitory rate in the NDE group was higher than that in the other drug treatment groups (89.99% for NDEs). These results indicated that NDE showed better antitumor effects and that the nanoparticle-mediated combined therapy was superior to the nanoparticle-mediated monotherapy. However, there were no differences in antitumor effects between DOX+ELC and ND+NE groups.
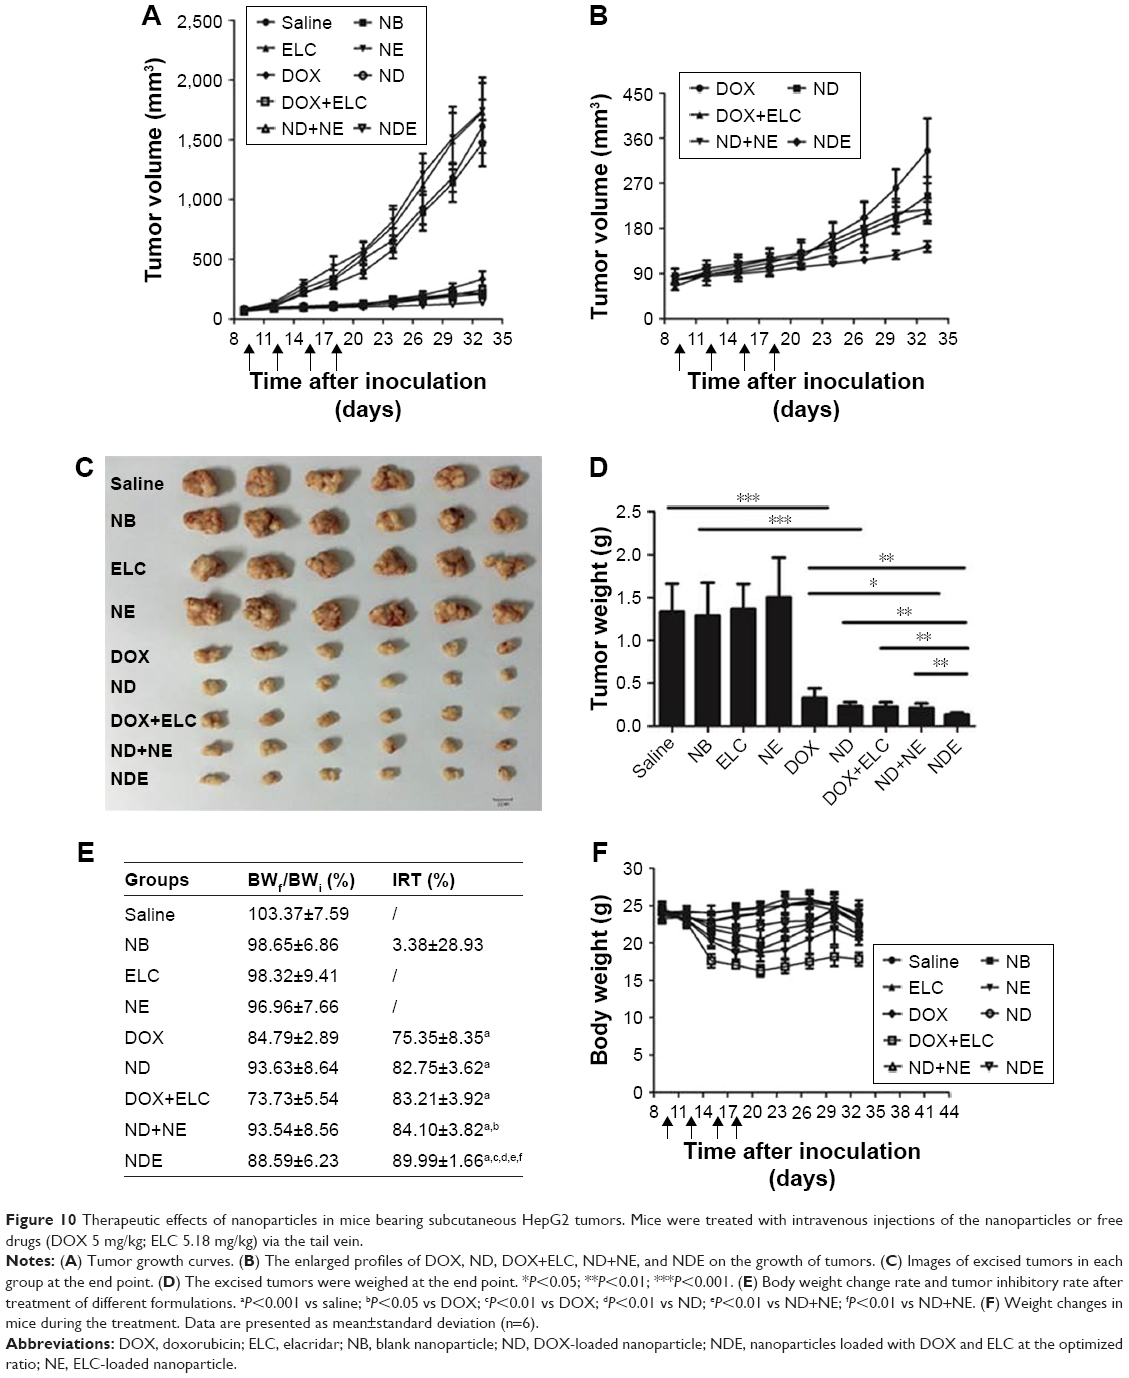 | Figure 10 Therapeutic effects of nanoparticles in mice bearing subcutaneous HepG2 tumors. Mice were treated with intravenous injections of the nanoparticles or free drugs (DOX 5 mg/kg; ELC 5.18 mg/kg) via the tail vein. |
To assess the systemic toxicity of all treatments in nude mice bearing tumors, body weights of mice were measured every 3 days in the experiment. As shown in Figure 10E and F, the body weights of mice treated with drug-loaded nanoparticles did not cause any significant decreases compared with those in the control group. However, the change rate in body weights of mice in the DOX+ELC group was lower than 80%, indicating that DOX+ELC caused systemic toxicity in mice.
Discussion
Recent studies have suggested that the eradication of both LCSCs and liver cancer cells is necessary because the conversion of CSCs to cancer cells occasionally occurs.13–16 Due to the overexpression of ABC transporters in both LCSCs and liver cancer cells, combinations of ATIs and chemotherapy drugs could increase the therapeutic efficacy of liver cancer. Therefore, we developed NDE (PLGA/TPGS nanoparticles for codelivery of DOX and ELC) to target both LCSCs and liver cancer cells and showed that these nanoparticles exhibited superior therapeutic efficacy against liver cancer.
The biosafety of nanoparticles is a major problem. Nanomaterials are composed of either inorganic or organic materials; inorganic materials cannot be degraded, whereas organic materials can be degraded and exhibit good biosafety. In this study, the prepared nanomaterials were highly biocompatible. PLGA is an FDA-approved material, and TPGS, a derivative of vitamin E, is also a pharmaceutical excipient approved by the FDA.41,43 Furthermore, both DOX and ELC are FDA-approved drugs, and we also evaluated the systemic toxicity of drugs by assessing changes in body weight during treatment. The results showed that the body weight change rate in mice in the DOX+ELC group was lower than 80%, indicating that DOX+ELC was not well tolerated in mice; in contrast, ND, ND+NE, and NDE were well tolerated in mice, indicating that drug-loaded nanoparticles may be a safe intervention in liver cancer therapy. Therefore, our nanoparticles exhibited good biological safety and clinical application prospects.
In our study, we choose DOX and ELC for the combined therapy to achieve enhanced therapeutic effects. DOX is the first-line drug for various cancers, and the development of liposomes, reduced toxicity of DOX, and improved efficacy of drugs, such as Doxil, Caelyx, and Myocet, have been achieved.53–55 ELC, a third-generation P-gp inhibitor, can inhibit ABC transporters (ABCB1 and ABCG2), which is the main reason for MDR in CSCs.26–29 This compound has been used to inhibit ABC transporters and enhance the therapeutic effects of chemotherapeutic drugs.30–32 Although there are many clinical or experimental cases of chemotherapeutic drugs combined with ATIs, most are combinations of free drugs. Indeed, in this study, we used PLGA/TPGS nanoparticles to achieve a combination of chemotherapeutic drugs and ATIs for the first time. We used TPGS and PLGA to prepare the nanoparticles, yielding the following advantages. First, the preparation process was simple and avoided the steps of synthesizing PLGA and TPGS copolymers. Because of the hydrophobicity of PLGA, PEG or TPGS modification is needed to improve hydrophilicity to form an amphiphilic copolymer, whereas the preparation of our nanoparticles could avoid this process. Second, TPGS is not only an emulsifier but also a potent inhibitor of ABC transporters, allowing MDR to be overcome. In addition, TPGS could be used as an antitumor drug to induce apoptosis or combined with other antitumor drugs to achieve synergistic effects.56,57
Combined therapies that target both CSCs and non-CSCs are considered a promising approach to eradicate cancer due to the occasional conversion of non-CSCs to CSCs.13–16 For example, we have developed a combined therapy with salinomycin and chloroquine via nanoliposomes to target both CSCs and non-CSCs, achieving superior therapeutic efficacy toward liver cancer compared with single therapy in CSCs or non-CSCs.11 The mechanisms leading to MDR are frequently caused by transmembrane xenobiotic transport molecules belonging to the superfamily of ABC transporters. Indeed, because of the overexpression of ABC transporters in CSCs, the combination of ATIs and chemotherapeutic drugs can overcome the MDR of CSCs. Furthermore, both CSCs and non-CSCs overexpress ABC transporters; therefore, the combination of ATIs and chemotherapeutic drugs can eliminate both CSCs and non-CSCs. Currently, most of the strategies for targeting CSCs and non-CSCs are combined with anti-CSC and anti-non-CSC drugs. To the best of our knowledge, this is the first study combining ATIs and chemotherapeutic drugs to achieve combined killing effects in CSCs and non-CSCs. Moreover, the combination of ATIs and chemotherapeutic drugs can also kill MDR cancer cells. Therefore, our combined strategy could simultaneously kill CSCs, MDR cancer cells, and common cancer cells, thus supporting the potential for good combined effects.
Because the combination of anticancer drugs could interact synergistically, additively, or antagonistically, implementation of the combined strategy is a challenge. In many previous combined strategies, these effects of drugs were not considered, and drugs could therefore interact antagonistically, thereby reducing the combined effects. In this study, we first optimized the drug ratio of DOX and ELC to achieve synergistic antitumor effects by the median-effect method. However, drug uptake at tumor sites is inconsistent, and it is difficult to achieve the optimal synergistic ratio, leading to the failure of combination therapy. Therefore, we prepared PLGA/TPGS nanoparticles for codelivery of DOX and ELC to reach the tumor site with an optimized synergistic ratio. Our findings showed that NDE enhanced the cytotoxicity of free DOX and ELC in both liver cancer cells and LCSCs in vitro and exhibited better tumor targeting and the best antitumor activity among all treated groups.
Conclusion
In this study, we performed cell-based experiments in vitro and pharmacodynamic experiments in vivo to evaluate the effects of NDE with the optimized synergistic ratio. Our results showed that NDE and ND+NE enhanced the cytotoxicity of free DOX and ELC in both liver cancer cells and LCSCs in vitro, with NDE showing the best antitumor activity among all treated groups. In conclusion, this combination therapy of PLGA/TPGS nanoparticles for codelivery of DOX and ELC was found to have a great potential for targeting liver cancer and improving therapeutic efficacy.
Acknowledgment
This work was supported by the National Natural Science Foundation of China (grant number 81573376, 81500444, 81771964, and 81472829).
Disclosure
The authors report no conflicts of interest in this work.
References
Li M, Zhang W, Wang B, Gao Y, Song Z, Zheng QC. Ligand-based targeted therapy: a novel strategy for hepatocellular carcinoma. Int J Nanomedicine. 2016;11:5645–5669. | ||
Chacko S, Samanta S. Hepatocellular carcinoma: A life-threatening disease. Biomed Pharmacother. 2016;84:1679–1688. | ||
Reya T, Morrison SJ, Clarke MF, Weissman IL. Stem cells, cancer, and cancer stem cells. Nature. 2001;414(6859):105–111. | ||
Shen S, Xia JX, Wang J. Nanomedicine-mediated cancer stem cell therapy. Biomaterials. 2016;74:1–18. | ||
Kassem NM. Review article: cancer stem cells: from identification to eradication. J Egypt Natl Canc Inst. 2008;20(3):209–215. | ||
Yamashita T, Wang XW. Cancer stem cells in the development of liver cancer. J Clin Invest. 2013;123(5):1911–1918. | ||
Wu Y, Wu PY. CD133 as a marker for cancer stem cells: progresses and concerns. Stem Cells Dev. 2009;18(8):1127–1134. | ||
Tirino V, Desiderio V, Paino F, et al. Cancer stem cells in solid tumors: an overview and new approaches for their isolation and characterization. Faseb J. 2013;27(1):13–24. | ||
Wang M, Xie F, Wen X, et al. Therapeutic PEG-ceramide nanomicelles synergize with salinomycin to target both liver cancer cells and cancer stem cells. Nanomedicine. 2017;12(9):1025–1042. | ||
Gong Z, Chen D, Xie F, et al. Codelivery of salinomycin and doxorubicin using nanoliposomes for targeting both liver cancer cells and cancer stem cells. Nanomedicine. 2016;11(19):2565–2579. | ||
Xie F, Zhang S, Liu J, et al. Codelivery of salinomycin and chloroquine by liposomes enables synergistic antitumor activity in vitro. Nanomedicine. 2016;11(14):1831–1846. | ||
Mao X, Liu J, Gong Z, et al. iRGD-conjugated DSPE-PEG2000 nanomicelles for targeted delivery of salinomycin for treatment of both liver cancer cells and cancer stem cells. Nanomedicine. 2015;10(17):2677–2695. | ||
Chaffer CL, Brueckmann I, Scheel C, et al. Normal and neoplastic nonstem cells can spontaneously convert to a stem-like state. Proc Natl Acad Sci U S A. 2011;108(19):7950–7955. | ||
Iliopoulos D, Hirsch HA, Wang G, Struhl K. Inducible formation of breast cancer stem cells and their dynamic equilibrium with non-stem cancer cells via IL6 secretion. Proc Natl Acad Sci U S A. 2011;108(4):1397–1402. | ||
Gupta PB, Fillmore CM, Jiang G, et al. Stochastic state transitions give rise to phenotypic equilibrium in populations of cancer cells. Cell. 2011;146(4):633–644. | ||
Gao J, Li W, Guo Y, Feng SS. Nanomedicine strategies for sustained, controlled and targeted treatment of cancer stem cells. Nanomedicine. 2016;11(24):3261–3282. | ||
Vasiliou V, Vasiliou K, Nebert DW. Human ATP-binding cassette (ABC) transporter family. Hum Genomics. 2009;3(3):281–290. | ||
Glavinas H, Krajcsi P, Cserepes J, Sarkadi B. The role of ABC transporters in drug resistance, metabolism and toxicity. Curr Drug Deliv. 2004;1(1):27–42. | ||
Dean M, Fojo T, Bates S. Tumour stem cells and drug resistance. Nat Rev Cancer. 2005;5(4):275–284. | ||
Gupta PB, Onder TT, Jiang G, et al. Identification of selective inhibitors of cancer stem cells by high-throughput screening. Cell. 2009;138(4):645–659. | ||
Cojoc M, Mäbert K, Muders MH, Dubrovska A. A role for cancer stem cells in therapy resistance: cellular and molecular mechanisms. Semin Cancer Biol. 2015;31:16–27. | ||
Sukowati CH, Rosso N, Crocè LS, Tiribelli C. Hepatic cancer stem cells and drug resistance: Relevance in targeted therapies for hepatocellular carcinoma. World J Hepatol. 2010;2(3):114–126. | ||
Alisi A, Cho WC, Locatelli F, Fruci D. Multidrug resistance and cancer stem cells in neuroblastoma and hepatoblastoma. Int J Mol Sci. 2013;14(12):24706–24725. | ||
Wu CP, Calcagno AM, Ambudkar SV. Reversal of ABC drug transporter-mediated multidrug resistance in cancer cells: evaluation of current strategies. Curr Mol Pharmacol. 2008;1(2):93–105. | ||
Glavinas H, Krajcsi P, Cserepes J, Sarkadi B. The role of ABC transporters in drug resistance, metabolism and toxicity. Curr Drug Deliv. 2004;1(1):27–42. | ||
Sparreboom A, Planting AS, Jewell RC, et al. Clinical pharmacokinetics of doxorubicin in combination with GF120918, a potent inhibitor of MDR1 P-glycoprotein. Anticancer Drugs. 1999;10(8):719–728. | ||
Hubensack M, Müller C, Höcherl P, et al. Effect of the ABCB1 modulators elacridar and tariquidar on the distribution of paclitaxel in nude mice. J Cancer Res Clin Oncol. 2008;134(5):597–607. | ||
Karla PK, Earla R, Boddu SH, Johnston TP, Pal D, Mitra A. Molecular expression and functional evidence of a drug efflux pump (BCRP) in human corneal epithelial cells. Curr Eye Res. 2009;34(1):1–9. | ||
Nieto Montesinos R, Béduneau A, Lamprecht A, Pellequer Y. Liposomes Coloaded with Elacridar and Tariquidar To Modulate the P-Glycoprotein at the Blood-Brain Barrier. Mol Pharm. 2015;12(11):3829–3838. | ||
Wong HL, Bendayan R, Rauth AM, Wu XY. Simultaneous delivery of doxorubicin and GG918 (Elacridar) by new polymer-lipid hybrid nanoparticles (PLN) for enhanced treatment of multidrug-resistant breast cancer. J Control Release. 2006;116(3):275–284. | ||
Singh MS, Lamprecht A. Cargoing P-gp inhibitors via nanoparticle sensitizes tumor cells against doxorubicin. Int J Pharm. 2015;478(2):745–752. | ||
Planting AS, Sonneveld P, van der Gaast A, et al. A phase I and pharmacologic study of the MDR converter GF120918 in combination with doxorubicin in patients with advanced solid tumors. Cancer Chemother Pharmacol. 2005;55(1):91–99. | ||
Zhao Y, Alakhova DY, Kabanov AV. Can nanomedicines kill cancer stem cells? Adv Drug Deliv Rev. 2013;65(13–14):1763–1783. | ||
Chen D, Xie F, Sun D, Yin C, Gao J, Zhong Y. Nanomedicine-Mediated Combination Drug Therapy in Tumor. Open Pharmaceutical Sciences Journal. 2017;4(1):1–10. | ||
Xie FY, Xu WH, Yin C, Zhang GQ, Zhong YQ, Gao J. Nanomedicine strategies for sustained, controlled, and targeted treatment of cancer stem cells of the digestive system. World J Gastrointest Oncol. 2016;8(10):735–744. | ||
Gao J, Feng SS, Guo Y. Nanomedicine for treatment of cancer stem cells. Nanomedicine. 2014;9(2):181–184. | ||
Gao J, Feng SS, Guo Y. Nanomedicine against multidrug resistance in cancer treatment. Nanomedicine. 2012;7(4):465–468. | ||
Bregoli L, Movia D, Gavigan-Imedio JD, Lysaght J, Reynolds J, Prina-Mello A. Nanomedicine applied to translational oncology: A future perspective on cancer treatment. Nanomedicine. 2016;12(1):81–103. | ||
Zhao Z, Lou S, Hu Y, Zhu J, Zhang C. A Nano-in-Nano Polymer-Dendrimer Nanoparticle-Based Nanosystem for Controlled Multidrug Delivery. Mol Pharm. 2017;14(8):2697–2710. | ||
Vogus DR, Evans MA, Pusuluri A, et al. A hyaluronic acid conjugate engineered to synergistically and sequentially deliver gemcitabine and doxorubicin to treat triple negative breast cancer. J Control Release. 2017;267:191–202. | ||
Gao J, Kou G, Chen H, et al. Treatment of hepatocellular carcinoma in mice with PE38KDEL type I mutant-loaded poly(lactic-co-glycolic acid) nanoparticles conjugated with humanized SM5-1 F(ab’) fragments. Mol Cancer Ther. 2008;7(10):3399–3407. | ||
Chen H, Gao J, Lu Y, et al. Preparation and characterization of PE38KDEL-loaded anti-HER2 nanoparticles for targeted cancer therapy. J Control Release. 2008;128(3):209–216. | ||
Guo Y, Luo J, Tan S, Otieno BO, Zhang Z. The applications of Vitamin E TPGS in drug delivery. Eur J Pharm Sci. 2013;49(2):175–186. | ||
Zhou J, Zhao WY, Ma X, et al. The anticancer efficacy of paclitaxel liposomes modified with mitochondrial targeting conjugate in resistant lung cancer. Biomaterials. 2013;34(14):3626–3638. | ||
Yao HJ, Ju RJ, Wang XX, et al. The antitumor efficacy of functional paclitaxel nanomicelles in treating resistant breast cancers by oral delivery. Biomaterials. 2011;32(12):3285–3302. | ||
Wang AT, Liang DS, Liu YJ, Qi XR. Roles of ligand and TPGS of micelles in regulating internalization, penetration and accumulation against sensitive or resistant tumor and therapy for multidrug resistant tumors. Biomaterials. 2015;53:160–172. | ||
Ghosh S, Kar N, Bera T. Oleanolic acid loaded poly lactic co-glycolic acid-vitamin E TPGS nanoparticles for the treatment of Leishmania donovani infected visceral leishmaniasis. Int J Biol Macromol. 2016;93(Pt A):961–970. | ||
Wang YY, Zhang DD, Kong YY, et al. CS/PAA@TPGS/PLGA nanoparticles with intracellular pH-sensitive sequential release for delivering drug to the nucleus of MDR cells. Colloids Surf B Biointerfaces. 2016;145:716–727. | ||
Zhu X, Zeng X, Zhang X, et al. The effects of quercetin-loaded PLGA-TPGS nanoparticles on ultraviolet B-induced skin damages in vivo. Nanomedicine. 2016;12(3):623–632. | ||
Chou TC, Talaly P. A simple generalized equation for the analysis of multiple inhibitions of Michaelis-Menten kinetic systems. J Biol Chem. 1977;252(18):6438–6442. | ||
Zhu H, Chen H, Zeng X, et al. Co-delivery of chemotherapeutic drugs with vitamin E TPGS by porous PLGA nanoparticles for enhanced chemotherapy against multi-drug resistance. Biomaterials. 2014;35(7):2391–2400. | ||
Su X, Song H, Niu F, et al. Co-delivery of doxorubicin and PEGylated C16-ceramide by nanoliposomes for enhanced therapy against multidrug resistance. Nanomedicine. 2015;10(13):2033–2050. | ||
Barenholz Y. Doxil® – the first FDA-approved nano-drug: lessons learned. J Control Release. 2012;160(2):117–134. | ||
Wibroe PP, Ahmadvand D, Oghabian MA, Yaghmur A, Moghimi SM, Moeinmoghimi S. An integrated assessment of morphology, size, and complement activation of the PEGylated liposomal doxorubicin products Doxil®, Caelyx®, DOXOrubicin, and SinaDoxosome. J Control Release. 2016;221:1–8. | ||
Leonard RC, Williams S, Tulpule A, Levine AM, Oliveros S. Improving the therapeutic index of anthracycline chemotherapy: focus on liposomal doxorubicin (Myocet). Breast. 2009;18(4):218–224. | ||
Youk HJ, Lee E, Choi MK, et al. Enhanced anticancer efficacy of alpha-tocopheryl succinate by conjugation with polyethylene glycol. J Control Release. 2005;107(1):43–52. | ||
Constantinou C, Papas A, Constantinou AI. Vitamin E and cancer: An insight into the anticancer activities of vitamin E isomers and analogs. Int J Cancer. 2008;123(4):739–752. |
 © 2018 The Author(s). This work is published and licensed by Dove Medical Press Limited. The full terms of this license are available at https://www.dovepress.com/terms.php and incorporate the Creative Commons Attribution - Non Commercial (unported, v3.0) License.
By accessing the work you hereby accept the Terms. Non-commercial uses of the work are permitted without any further permission from Dove Medical Press Limited, provided the work is properly attributed. For permission for commercial use of this work, please see paragraphs 4.2 and 5 of our Terms.
© 2018 The Author(s). This work is published and licensed by Dove Medical Press Limited. The full terms of this license are available at https://www.dovepress.com/terms.php and incorporate the Creative Commons Attribution - Non Commercial (unported, v3.0) License.
By accessing the work you hereby accept the Terms. Non-commercial uses of the work are permitted without any further permission from Dove Medical Press Limited, provided the work is properly attributed. For permission for commercial use of this work, please see paragraphs 4.2 and 5 of our Terms.