")
Back to Journals » OncoTargets and Therapy » Volume 13
Co-Expression of Stem Cell and Epithelial Mesenchymal Transition Markers in Circulating Tumor Cells of Bladder Cancer Patients
Authors Zhang R, Xia J, Wang Y, Cao M, Jin D, Xue W, Huang Y, Chen H
Received 28 April 2020
Accepted for publication 28 August 2020
Published 22 October 2020 Volume 2020:13 Pages 10739—10748
DOI https://doi.org/10.2147/OTT.S259240
Checked for plagiarism Yes
Review by Single anonymous peer review
Peer reviewer comments 3
Editor who approved publication: Dr William C. Cho
Ruiyun Zhang,1,* Jun Xia,2,* Yiqiu Wang,1,* Ming Cao,1 Di Jin,1 Wei Xue,1 Yiran Huang,1 Haige Chen1
1Department of Urology, Renji Hospital, School of Medicine, Shanghai Jiao Tong University, Shanghai, People’s Republic of China; 2Department of Pathology, Renji Hospital, School of Medicine, Shanghai Jiao Tong University, Shanghai, People’s Republic of China
*These authors contributed equally to this work
Correspondence: Ming Cao; Haige Chen
Department of Urology, Renji Hospital, School of Medicine, Shanghai Jiao Tong University, Shanghai, People’s Republic of China
Email [email protected]; [email protected]
Objective: Cancer cells with stemness and epithelial-to-mesenchymal transition (EMT) features display enhanced malignant and metastatic potential. This study aimed to introduce a new methodology developed in order to investigate the co-expression of a stemness (OCT4) and EMT markers on single circulating tumor cells (CTCs) of patients with localized urinary bladder cancer and their potential prognostic prediction value.
Methods and Materials: Between April 2015 and July 2015, blood samples of 51 consecutive patients diagnosed with high risk bladder cancer (cT1-3N0M0) were prospectively investigated for CTCs. Peripheral blood (5 mL) was drawn before primary transurethral resection. Detection of CTCs was performed using the CanPatrolTM system. Nucleic acid probes were used to identify CTCs, and expression levels of epithelial and mesenchymal genes in CTCs were examined by situ hybridization assay.
Results: All patients received radical cystectomy with pelvic lymph nodes dissection. CTCs were detected in 44 of 51 (86.3%) patients, respectively. The overall mean number of CTCs was 6.1 (range: 0∼ 29; median: 4). A total of 311 CTCs were detected in PB. High OCT4 expression (OCT4high) was detected more frequently in Epi−Mes+ cells (p=0.001). Patients with pathological confirmed muscle-invasive bladder cancer (MIBC) had higher Epi−Mes+ CTCs positive rates (p=0.001) and OCT4high CTCs positive rates (p=0.019) than pathological confirmed non muscle-invasive bladder cancer (NMIBC). Regarding co-expression of these markers, Epi−Mes+/OCT4high CTCs were more frequently evident in the MIBC setting (30.4% vs 3.6% of patients, p = 0.016).
Conclusion: A differential expression pattern for these markers was observed both in NMIBC and MIBC disease. A subgroup of CTCs showed a CTCs expressing high OCT4, along with Mes were more frequently detected in patients with MIBC, suggesting that these cells may prevail during tumor muscle invasion and disease progression.
Keywords: circulating tumor cells, epithelial-to-mesenchymal transition, OCT4, muscle-invasive bladder cancer
Introduction
Bladder cancer (BC) is one of the most common urinary malignancies, ranking 4th among expected new cancer cases in men in the United States in 2016, with 16,390 deaths estimated in both sexes.1 BC consists of two major clinicopathological phenotypes: muscle-invasive bladder cancer (MIBC) and non-muscle-invasive bladder cancer (NMIBC). MIBC frequently metastasizes and is associated with an unfavorable prognosis.2 To improve the outcome of patients with BC, it is important to investigate molecular pathways that are critical to the development of the disease, and to identify novel targets for therapy.
The circulating tumor cells (CTCs) originate from the primary tumor and migrate, adhere to, and propagate to adjacent structures via the lymphatic and circulatory systems, establishing new colonies at distant sites, which may ultimately lead to an overt metastatic disease.3 CTCs have been identified in peripheral blood (PB) of patients with bladder cancer and their presence has been associated with poor disease outcome.4,5 Therefore, further characterization of CTCs at the single cell level will provide a powerful and noninvasive approach for the detection of early disease, assessing prognosis and therapeutic response in bladder cancers, and targeting metastatic precursor cells.6–8
A current hypothesis related to carcinogenesis suggests that tumor growth is sustained by the cancer stem cells (CSCs), a specific population of tumor cells with ability to self-renew and metastasis.9 Increasing evidence suggests that MIBC comprises a small population of cancer stem cells (CSCs), which may contribute to form new tumors in the bladder or other organs and to therapeutic resistance.10–12 OCT4 is generally considered as one of the CSC markers. OCT4 transcription factors play an important role in maintaining the pluripotent state of embryonic stem cells and may prevent expression of genes activated during differentiation.13 It is confirmed that in BC, OCT4A stem cells are strongly related to the clinicopathological aspects of urothelial cancer malignancy.14 Thus, we wondered that this “stemness phenotype” could be related to initiation and metastases formation of BC.
Transitions between epithelial and mesenchymal states have crucial roles in embryonic development. There is growing evidence suggesting that both tumor growth and metastatic dissemination take place through epithelial-to-mesenchymal transition (EMT), a process by which tumor cells lose their epithelial characteristics and acquire a mesenchymal phenotype.15 Overexpression and activation of EMT genes including Snail, Slug, Twist, ZEB1/2, and vimentin are suggestive of basal MIBC subtype generally responsive to chemotherapy.16 Alternatively, cancer stem cells (CSCs) may arise from differentiated cancer cells through EMT and an embryonic trans-differentiation process.17 The presence of both stemness and EMT characteristics on individual CTCs could potentially be a determining factor of metastasis.
In the present study, we used a new method, the CanPatrolTM system, to evaluate the protein expression pattern of a putative stemness (OCT4) and the EMT (EpCAM, CK8/18/19, Twist and Vimentin) markers on CTCs of bladder cancer patients. We aimed to investigate the co-expression of these markers at the single CTC level and to explore the correlation of distinct CTC subpopulations with clinicopathological parameters in bladder carcinomas, with the hope that such correlation might provide insights into the prognostic factors for survival in bladder carcinogenesis.
Methods and Materials
Patients and Blood Samples
From April 2015 to July 2015, 51 patients primarily diagnosed with high risk bladder cancer (cT1-3N0M0) were recruited by Renji Hospital after an agreement from the Research Board. Patients received their blood draw before first transurethral resection (TUR). Five milliliters of peripheral blood samples (anticoagulated with EDTA) were collected after discarding the initial 2 mL to avoid potential skin cell contamination from the venipuncture site; the samples were stored at 4°C for further analysis. Relevant patient demographic data, tumor characteristics and pathological findings were included in the analysis.
Cell Cultures
All cell lines were available from the Shanghai Institutes for Biological Sciences, Chinese Academy of Sciences. The SVHUC2 (Human Urothelial cell lines), and T24 and J82 (Human Urothelial Carcinoma cell lines) cells were cultured in high glucose GlutaMAX™ Dulbecco’s Modified Eagle Medium (DMEM) (GIBCO-BRL Co, MD, USA), supplemented with 10% fetal bovine serum (FBS) (GIBCO-BRL) and 1% penicillin/streptomycin (GIBCO-BRL) MCF-7 cell culture medium was additionally supplemented with 0.28% insulin. SKBR-3 cells were cultured in high glucose GlutaMAX™ McCoys5A medium (GIBCO-BRL) complemented with 10% FBS and 1% penicillin/streptomycin. Cells were maintained in a humidified atmosphere of 5% CO2 – 95% oxygen at 37°C. Subcultivation of all cell lines was performed using 0.25% trypsin and 5 mM ethylenediaminetetraacetic acid (EDTA) (GIBCO-BRL).
CTCs Isolation by CanPatrolTM CTC Enrichment Technique
The sample preservative tubes were centrifuged to collect the cell pellets. The supernatant was discarded, and the cell pellets were suspended by adding 5 mL PBS. Blood samples (collected within 4 h) were filtrated by a calibrated membrane with 8-μm diameter pores (Millipore, Billerica, USA). In order to meet the need to filtrate, we applied a filtration system consist of a filtration tube containing the membrane (SurExam, Guangzhou, China), a manifold vacuum plate with valve settings (SurExam, Guangzhou, China), an E-Z 96 vacuum manifold (Omega, Norcross, USA), and a vacuum pump (Auto Science, Tianjin, China). Then the pump valve was switched on to reach at least 0.08MPa and the manifold vacuum plate valve was then switched on to fulfill filtration. The circulating tumor cells were retained on the filter, and the blood cells went through the pores based on the fact that CTCs are larger than blood cells. Red blood cell lysis buffer (154 mM NH4Cl, 10 mM KHCO3 and 0.1 mM EDTA) was used to remove possible residual erythrocytes. And the CTCs were fixed by the 2% formaldehyde retained on it.
Tri-Color RNA in situ Hybridization (ISH) Assay
Based on branched deoxyribonucleic acid (bDNA) signal amplification technology, we used the RNA-FISH method to detect the target sequence. Among which, we used sequences of (EpCAM, CK8/18/19, vimentin, twist) which have been published by Yu et al to help us distinguish epithelial, mesenchymal and hybrid CTCs. On the membrane of the 24-well plate, cells were treated with protease before hybridization with indicated capture probe specific for EpCAM, CK8/18/19, vimentin, twist, and CD45 (negative control, leukocytes stained for CD45 expression). After incubation at 42°C for 2 h, cells were washed with buffer to remove the unbound probes. Then, cells were incubated with preamplifier solution [30% horse serum, 1.5% sodium dodecyl sulfate, 3mM Tris-HCl (pH 8.0) and 0.5 fmol of preamplifier]; at 42°C for 2 h for the purpose of signal amplification. The membranes were washed with 1000 μL of wash buffer (0.1 × SSC), and then incubated with 100 μL of amplifier solution [30% horse serum, 1.5% sodium dodecyl sulfate, 3mM Tris-HCl (pH 8.0) and 1 fmol of amplifier]. Fluorescently labeled probes, which had been conjugated with fluorescent dyes Alexa Fluor 594 (for the epithelial biomarkers EpCAM and CK8/18/19), Alexa Fluor 488 (for the mesenchymal biomarkers vimentin and twist), Alexa Fluor 750 (for CD45), Alexa Fluor 647 (for OCT4), were added and incubated at 42°C for 2 min. After staining with DAPI, cells were analyzed with a fluorescence microscope (Olympus BX53, Tokyo, Japan).
Statistical Analysis
Analyses were conducted using SPSS® version 21 (IBM Corp., NY, USA). Categorical variables were reported as counts (N) and percentages, and continuous variables as mean and standard deviation. Receiver operating characteristic (ROC) curve analysis with maximal Youden index values was applied to identify best cut-off values for CTCs count. Categorical variables were examined using Pearson’s chi-squared and Fisher’s exact tests between groups. A p-value <0.05 was considered as statistically significant.
Results
CTCs Detection of Patients with BC
We identified 35 male and 16 female patients with a mean age of 62.9 years. 44 (86.2%) of 51 patients were detected of CTCs in their peripheral blood. A total of 311 CTCs were detected in patients’ PB at a mean number of 6.1 (range: 0~29; median: 4). The clinical and pathological characteristics of patients are shown in Table 1. The best cut-off was 3.5 for CTC count according to maximization of the Youden index (CTC count: sensitivity=83.3% and specificity=69.2%), area under the curve (AUC) values of 0.79 (95% CI: 0.66, 0.92; p<0.001) for CTC count (Figure 1).
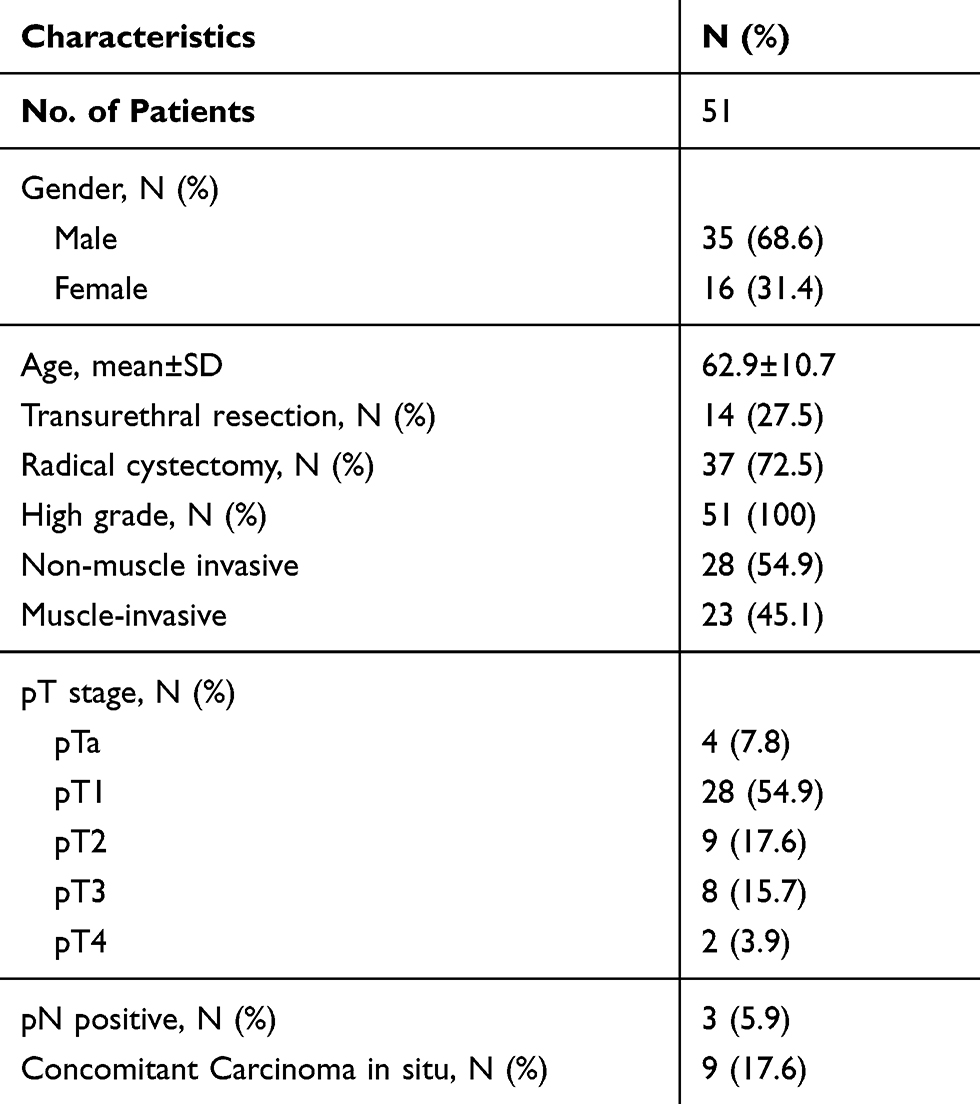 |
Table 1 Patient and Tumor Characteristics |
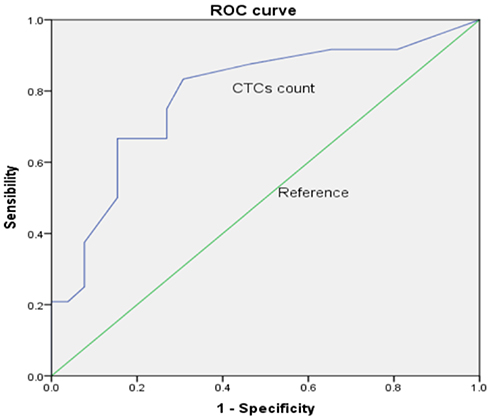 |
Figure 1 ROC curves for total CTCs count. The best cut-off was 3.5 for CTC count according to the maximization of Youden index from the ROC curve analysis (AUC=0.787, p<0.001). |
EMT and OCT4 Expression in CTCs
Regarding the expression of epithelial and mesenchymal gene at the CTC level, three different EMT expression status (E+ CTCs, M+ CTCs and E+M+ CTCs) were detected. CTCs expressing epithelial gene (E+ CTCs) were observed in 227 (73.0%) of total CTCs while 236 (75.9%) detectable CTCs expressed mesenchymal gene (M+ CTCs). Particularly, nearly half of CTCs (48.9%, 152 of 311) expressed both epithelial and mesenchymal gene (E+M+ CTCs) (Table 2). Two different phenotypes could be distinguished according to the expression of OCT4 at the single CTC level. Low/negative OCT4 expression (OCT4low/neg) CTCs were detected in 233 (74.9%) of total CTCs, whereas in 78 (25.1%) high OCT4 expression (OCT4high) CTCs were identified (Table 2).
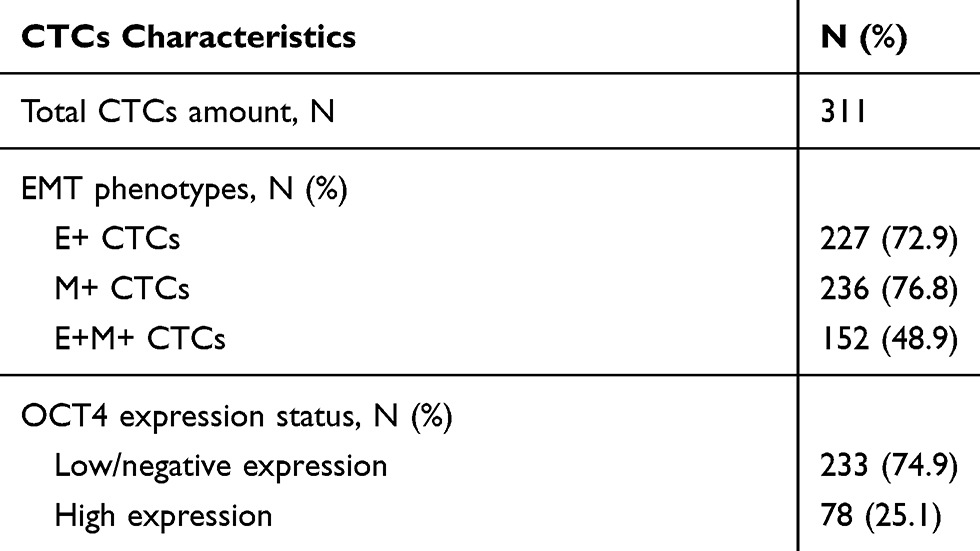 |
Table 2 CTCs Characteristics |
In the CTC level, we evaluate OCT4 expression in four different EMT expression status and three different EMT phenotypes (Table 3). OCT4low/neg and OCT4high were observed in 170 and 57 of E+ CTCs, respectively, whereas 63 and 21 of E- CTCs (P=1.000). However, in M+ CTCs, OCT4low/neg and OCT4high were detected in 167 and 69, while 66 and 9 in M- CTCs (P=0.02). Comparing three different EMT phenotypes, OCT4low/neg and OCT4high were identified in 104 and 48 of E+M+ CTCs, 66 and 9 of E+M- CTCs, 63 and 21 of E-M+ CTCs (P=0.001).
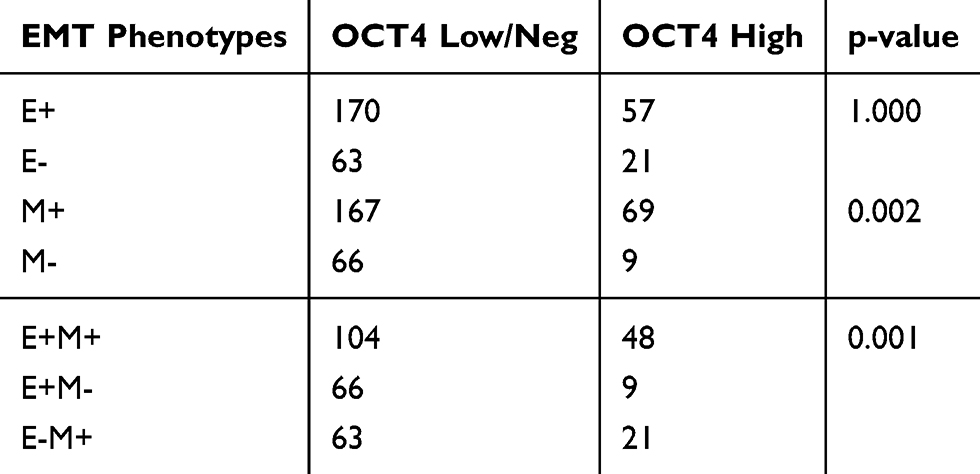 |
Table 3 Different Levels of OCT4 Expression in Three CTCs EMT Phenotypes |
Expression of EMT Markers and OCT4 in Cell Lines
Twist is a transcription factor with pivotal role in EMT induction, both in normal and cancer cells.18 As shown in Figure 2, T24 expressed more EMT markers (vimentin and twist), whereas J28 and SVHUC2 expressed weakly and negatively, respectively. OCT4 is generally considered as a universal marker of pluripotent stem cells.13 The result of OCT4 expression in three cell lines is shown in Figure 3. It demonstrates that T24 expressed more OCT4 while J28 and SVHUC2 were weak expression and negative expression, respectively.
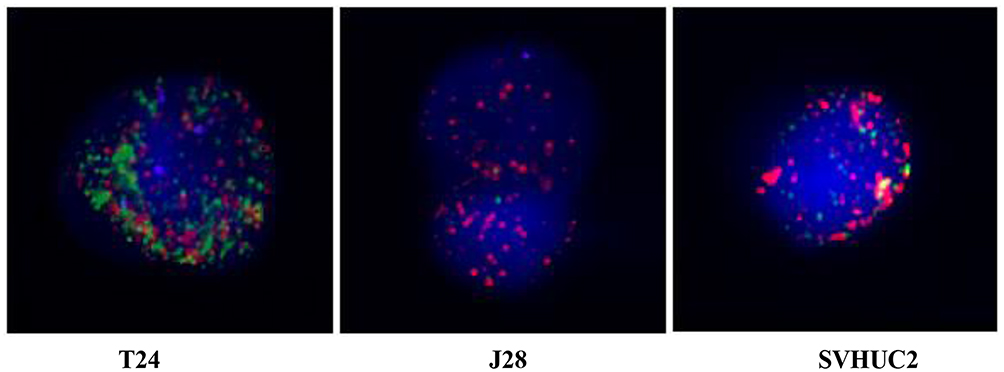 |
Figure 2 Expression of EMT markers in T24, J82 and SVHUC2 cell lines. Fluorescently labeled probes were performed for EpCAM and CK8/18/19 (red), vimentin and twist (green). Cell nuclei were stained with DAPI (blue). |
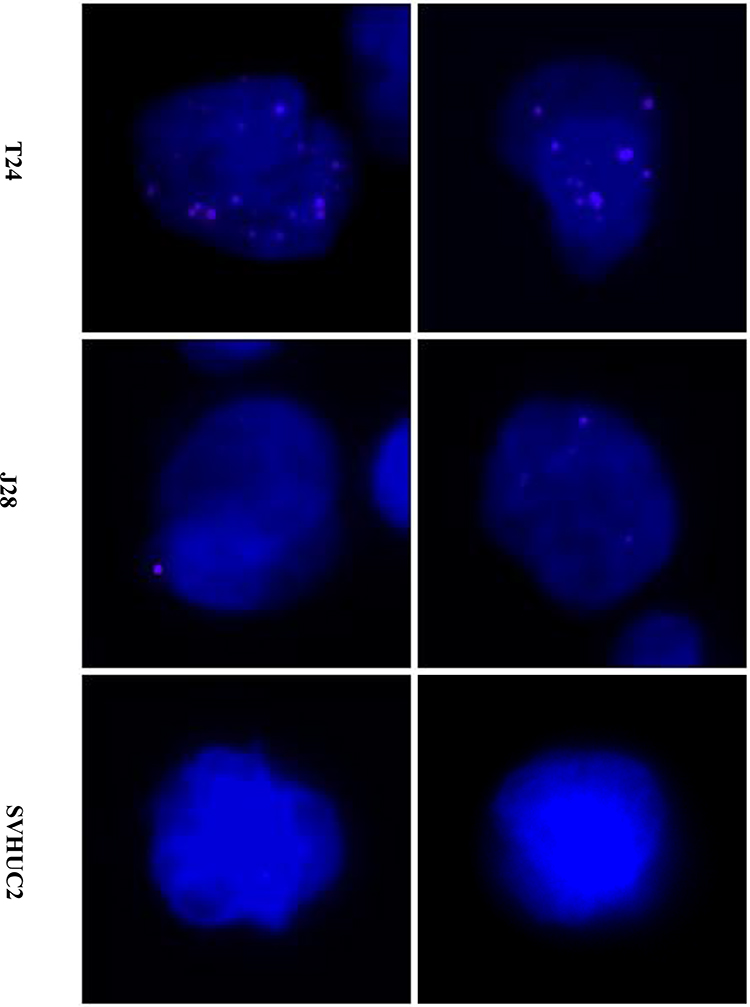 |
Figure 3 Expression of OCT4 in T24, J82 and SVHUC2 cell lines. Fluorescently labeled probes were performed for OCT4 (purple). Cell nuclei were stained with DAPI (blue). |
Expression of EMT Markers and OCT4 in CTCs of Patients with BC
CTCs were detected both in NMIBC and MIBC. In the NMIBC group, 22 out of 28 (78.5%) patients were CTC+, with a total of 130 CTCs identified. However, in the MIBC group, the percentage and CTC number were 95.6% (22 out of 23 patients, P=0.112) and 181, respectively. Epithelial gene was expressed in 22 out of 28 (78.5%) patients with NMIBC and 22 out of 23 (95.6%) patients with MIBC (P=0.112) while mesenchymal gene was expressed in 20 out of 28 (71.4%) patients with NMIBC and 20 out of 23 (86.9%) patients with MIBC (P=0.305). In the CTC level, epithelial gene and mesenchymal gene were expressed in 106 (81.5%) and 95 (73.1%) in the NMIBC group, respectively. However, these two genes were expressed in 121 (66.8%, P=0.004) and 141 (77.9%, P=0.327) in the MIBC group. Moreover, E+M+, E+M- and E-M+ phenotypes were confirmed in 19 (67.9%), 16 (57.1%) and 9 (32.1%) of 28 patients with NMIBC, respectively. Whereas these three phenotypes were observed in 19 (82.6%, P=0.229), 16 (69.6%, P=0.361) and 18 (78.3%, P=0.001) of 23 patients with MIBC. E+M+, E+M- and E-M+ CTCs were identified in 71 (54.6%), 35 (26.9%) and 24 (28.5%) of total CTCs in the NMIBC group while in 81 (44.8%), 40 (22.1%) and 60 (33.1%) in the MIBC group (P=0.016), respectively. Regarding OCT4 expression, OCT4low/neg CTCs and OCT4high CTCs were detected in 13 (46.4%) and 9 (32.1%) of 28 patients with NMIBC while in 7 (30.4%, P=0.244) and 15 (65.2%, P=0.019) of 23 patients with MIBC. Furthermore, in NMIBC group, 104 (80.0%) OCT4low/neg CTCs and 26 (20.0%) OCT4high CTCs were observed while 129 (71.3%) OCT4low/neg CTCs and 52 (28.7%) OCT4high CTCs were detected in MIBC group (P=0.08) (Table 4).
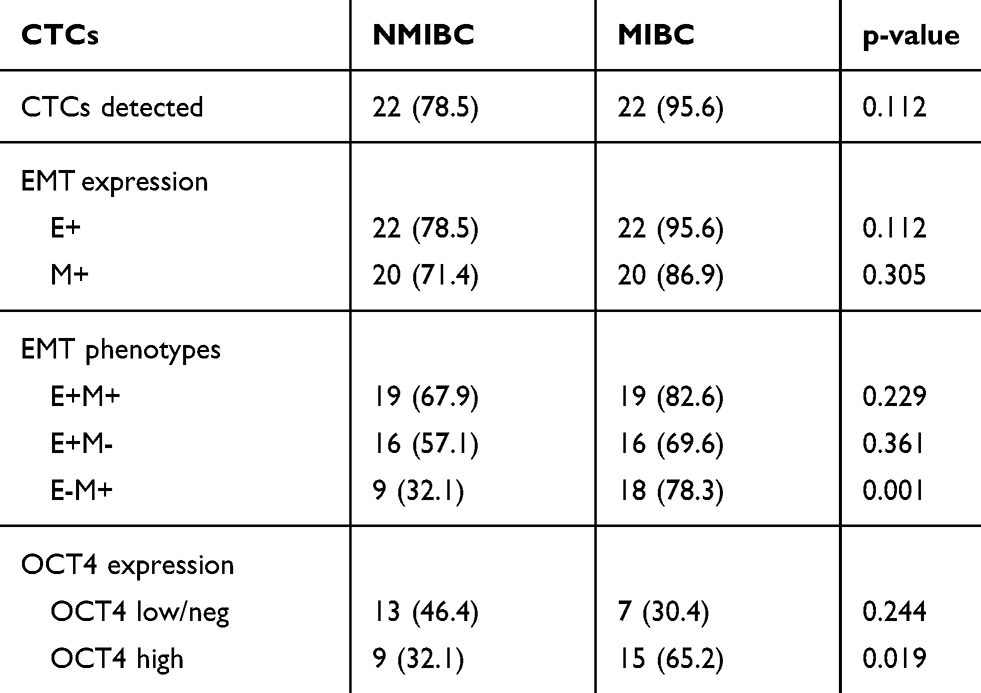 |
Table 4 Incidence of CTCs EMT and OCT4 Phenotypes Between NMIBC and MIBC Patients |
Evaluation of epithelial or mesenchymal gene and stemness markers (OCT4) co-expression on single CTCs showed that in NMIBC group, 20 (71.4%) patients harvested E-OCT4 low/neg CTCs while 8 (28.6%) patients were E+ OCT4high CTCs. Whereas in MIBC group, 9 (39.1%) and 14 (60.9%) patients had detectable E-OCT4 low/neg CTCs and E+ OCT4high CTCs, respectively (P=0.020). In the CTC level, the phenotypes E-OCT4 low/neg and E+ OCT4high were confirmed in 106 and 24 of total CTCs in NMIBC group while in 148 and 33 in MIBC group. Furthermore, comparing the incidence of M- OCT4 low/neg and M+ OCT4high CTCs, a significant difference (P=0.009) existed in NMIBC group and MIBC group (Table 5).
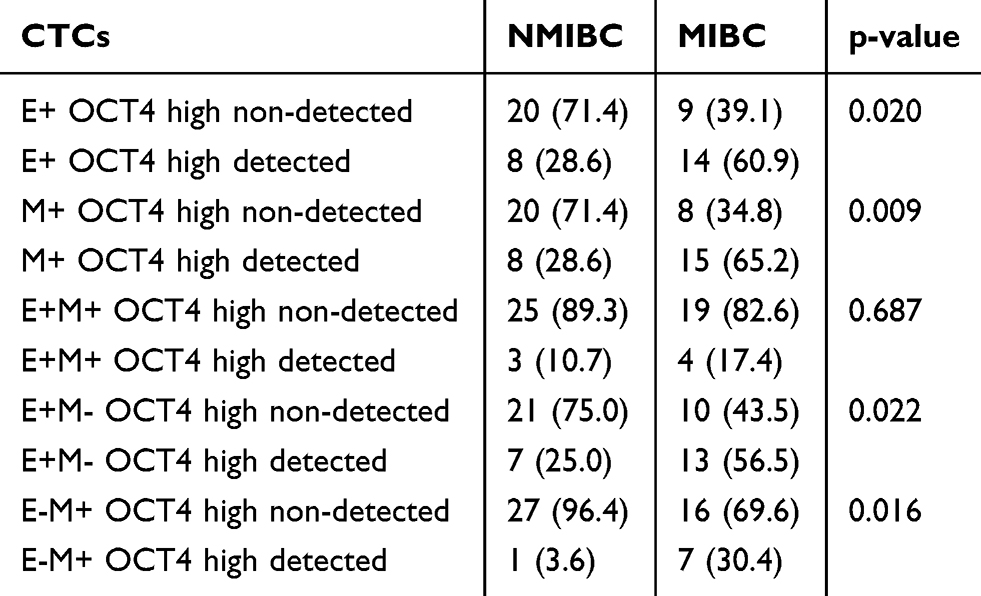 |
Table 5 EMT Phenotypes Based on OCT4 Expression |
Moreover, six different phenotypes could be distinguished according to the co-expression of EMT and stemness (OCT4) markers (Table 5). In NMIBC group, E+M+ OCT4low/neg CTCs and E+M+ OCT4high CTCs were detected in 25 (89.3%) and 3 (10.7%) out of 28 patients while in MIBC group, these two phenotypes were observed in 19 (82.6%) and 4 (17.4%) out of 23 patients (P=0.687). Moreover, in the CTC level, E+M+ OCT4low/neg and E+M+ OCT4high phenotypes were expressed in 31 and 4 of total CTCs in NMIBC group while in 35 and 5 of total CTCs in MIBC group. The frequency of the four other phenotypes (E+M- OCT4low/neg, E+M- OCT4high, E-M+ OCT4low/neg, E-M+ OCT4high) among patients and CTCs is also shown in Table 5.
Prognostic Significance of CTCs Phenotypes
Figure 4 presents graphs of PFS in each of the group, Log rank tests showed the progression-free survival rate was significantly associated with CTC count (Figure 4A, p=0.013), but not with OCT4 expression (Figure 4B, p=0.3049). In addition, PFS was relatively better in the M-OCT4- and E>M groups, compared with the M+OCT4+ and E<M group (Figure 4C and p=0.0483, Figure 4E and p=0.0182, respectively). However, no significant differences in PFS were observed between the M+OCT4+ and M+OCT4- group or between the E+OCT4- and E+OCT4+ group.
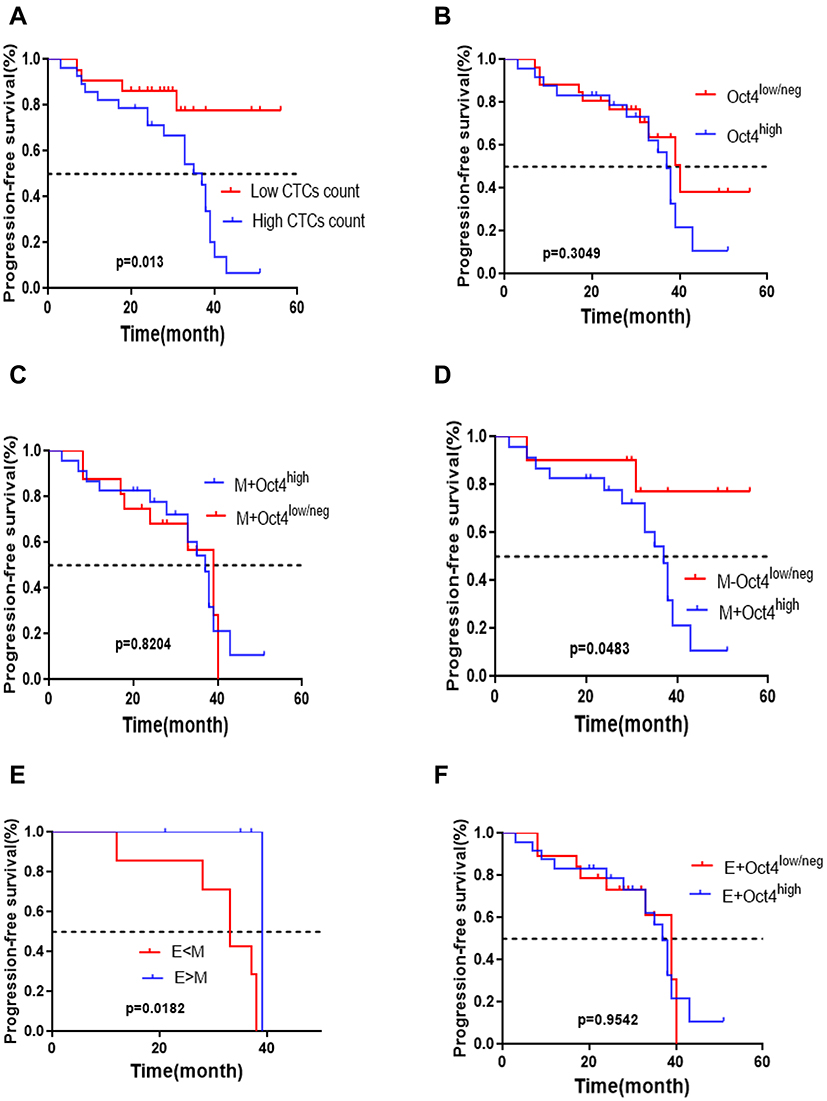 |
Figure 4 Kaplan-meier curves for the association of OCT4 and EMT phenotypes with prognosis. (A) Low CTCs count versus High CTCs count; (B) OCT4low/neg versus OCT4high; (C) M+OCT4high versus M+OCT4low/neg; (D) M-OCT4low/neg versus M+OCT4high; (E) E<M versus M>E; (F) E+OCT4low/neg versus E+OCT4high. |
Discussion
The presence of circulating tumor cells (CTCs) in the peripheral blood was first reported by Ashworth in 1869.19 CTCs are considered to be the active source of metastatic spread, they are detached from primary tumors and then invade into the blood or lymphatic circulating. Therefore, CTCs have emerged as a significant tool for risk stratification and treatment monitoring. However, only a few of these cells are able to establish metastatic deposit in another organ far from the primary tumor. Actually, although the presence of CTCs in patients with bladder cancer is associated with poor prognosis,20 many patients do not relapse even when detected in their blood. Therefore, further phenotypic characterization of CTCs at the single cell level would be of utmost importance, it might provide additional information for their metastatic potential and prognostic prediction.
The metastatic cascade is a complex, high inefficient, but deadly process. Therefore, cancer cells need to be highly equipped in order to disseminate from the primary tumors and enter into the circulation. CSCs are characterized by self-renewal, heterogeneity, resistance to apoptosis and conventional therapies. Moreover, EMT has been linked to cancer progression and acquisition of stem cell-like properties.21 Thus, CTCs co-expressing stem cell and EMT markers could be actively involved in tumor progression. EMT genes including Snail, Slug, Twist, ZEB1/2, and vimentin have been extensively studied,16,25 Many embryonic stem cell markers like OCT4, SOX2, NANOG, KLF4, have been shown as potential CSC marker. Regarding the novel cancer stem cell concept, the expression of such genes is potentially correlated with tumorigenesis and can affect some aspects of tumor behavior, such as tumor recurrence or resistance to therapies. Here we choose OCT4 as CSC marker in this study, because it has been highly expressed in bladder cancer. Previous research suggested a strong correlation between the expression of OCT-4 and tumor state of the tissues,22 some research suggested a strong correlation between the expression of OCT-4 and tumor state of the tissues. Both EpCAM and CK are commonly used biomarkers for CTCs from epithelial-derived neoplasms.23 Vimentin and Twist are ubiquitously expressed in mesenchymal cells.24,25 Previous studies26,27 have well established a quantifiable, dual-colorimetric RNA-in situ hybridization (ISH) assay to analyze EMT in CTCs from different types of tumor cells. Based on those above, we developed a new methodology to investigate the expression pattern of OCT4 and Mes on CTCs of patients with urinary bladder cancer and to evaluate their co-expression at the single CTC level.
The expression of OCT4 has been associated with drug resistance and tumor recurrence in bladder cancer.28 Moreover, differential OCT4 expression levels have been demonstrated and a positive correlation has been suggested between OCT4high and urothelial cancer malignancy.14 Therefore, in the present immunofluorescence assay, a quantitative analysis of OCT4 expression levels by the use of the CanPatrolTM system.
With the provided quantification method, the evaluation of OCT4 expression in two urothelial carcinoma cell lines (T24 and J82) and a urothelial cell line (SVHUC2) confirmed the presence of OCT4high, OCT4low and OCT4neg, respectively.
In our study, although OCT4-expression CTCs were detected in most CTC-positive patients, the pattern of OCT4 expression differed among CTCs in clinical settings. Moreover, OCT4high CTCs were more frequently observed in patients with MIBC (P=0.019) while OCT4low/neg CTCs were detected more in NMIBC patients (P=0.244). Previous studies have reported that MIBC has a high metastatic potential and an unfavorable prognosis.2 Therefore, this observation suggests that OCT4high CTCs predominate during disease progression and leads to the hypothesis that CTCs bearing stemness characteristics may have an important role in the metastatic process and be associated with poor prognosis.
EMT has been proposed as a key event during cancer progression and metastasis development. Moreover, it becomes potentially destructive and enables the transit of cancer cells from primary tumor site through the systemic circulation to distal sites when inappropriately activated. In the present study, we further analyzed epithelial gene, mesenchymal gene and different EMT phenotypes expression level. The data showing that epithelial gene, mesenchymal gene and three different EMT phenotypes including E+M+, E+M- and E-M+ were both detected in NMIBC and MIBC. Moreover, epithelial gene expressed more in CTCs of NMIBC than MIBC (P=0.004) while patients with MIBC had higher E-M+ CTCs positive rates (p=0.001) than patients with NMIBC. Here, we did not identify the exact difference in oncological prognosis between the E+OCT4 low/neg and E+ OCT4high group or between M+OCT4 low/neg and M+ OCT4high group, the survival curves of them were similar respectively. Also, the OCT4 low/neg group did not differ significantly from the OCT4high group. However, we analyzed differences between M+ OCT4high group and M- OCT4 low/neg. In agreement with previous studies,30–33 all findings suggest that EMT, together with expression of OCT4, would provide predictive capability of underlying invasion and progression.
Using the present assay, six different CTC phenotypes were identified according to the simultaneous evaluation of both markers. High OCT4 expression was detected more frequently in E-M+ CTCs (p=0.004). A differential distribution of phenotypes was evident comparing the NMIBC and MIBC. E-M+ OCT4high CTCs were more prominent among patients with MIBC (P=0.016), whereas E+M- OCT4low/neg CTCs predominated in patients with NMIBC.
The higher prevalence of OCT4 and EMT markers in muscle invasive bladder cancer patients suggests that they could possibly distinguish a subpopulation of CTCs with aggressive biological properties. Therefore, phenotypic characterization of CTCs according to the expression of OCT4 and EMT merits further evaluation in a larger cohort of patients, in order to investigate the clinical significance of the above findings. In addition, epithelial-mesenchymal-mixed CTCs comprised 48.9% of all CTCs, which indicated the importance of EMT transition in the formation and progression of CTCs. Compared to mesenchymal CTCs, which is a predictor of distant metastasis or local recurrence, mixed CTCs might have the potential to be an indicator of initiative progression, all above need to be further verified in future research.
Conclusions
Our study provides a new methodology for the evaluation of OCT4 and EMT markers co-expression on single CTCs of patients with bladder cancer. Using this assay, distinct CTC phenotypes, according to OCT4 expression levels and EMT phenotypes, were designated in patients with muscle-invasive and non-muscle-invasive bladder cancer. The higher incidence of CTCs bearing putative stem cell and EMT traits in metastatic disease, suggests that these characteristics may prevail on CTCs during disease progression. A correlation between stemness and EMT features was further confirmed on single CTCs.
Research Involving Human Participants and/or Animals
This manuscript submitted for publication is based on clinical studies published in journals which mandate that all studies are conducted after approval by appropriate ethics committee and have therefore been performed in accordance with the ethical standards laid down in the 1964 Declaration of Helsinki and its later amendments.
Informed Consent
All participants of this study have signed informed consent before enrollment.
Acknowledgments
This work was supported by the National Natural Science Foundation of China (81672514, 81902562), Shanghai Natural Science Foundation (16ZR1420300, 18410720400, 19431907400), Renji Hospital Research Funding Projects (RJZZ18-020, PYIII-17-017, PY2018-IIC-02), Shanghai Jiao Tong University School of Medicine Research Funding Projects (TM201708) and Foundation of Shanghai Hospital Development Center (SHDC12015125). The abstract of this paper was presented at the EAU Congress 2019 as a poster presentation with interim findings. The poster’s abstract was published in “Poster Abstracts” in European Urology Supplements https://doi.org/10.1016/S1569-9056(19)30465-8.
Author Contributions
All authors made a significant contribution to the work reported, whether that is in the conception, study design, execution, acquisition of data, analysis and interpretation, or in all these areas; took part in drafting, revising or critically reviewing the article; gave final approval of the version to be published; have agreed on the journal to which the article has been submitted; and agree to be accountable for all aspects of the work.
Disclosure
The authors report no conflicts of interest in this work.
References
1. FSiegel RL, Miller KD, Jemal A. Cancer statistics, 2016. CA Cancer J Clin. 2016;66:7–30.
2. Wu XR. Urothelial tumorigenesis: a tale of divergent pathways. Nat Rev Cancer. 2005;5:713–725. doi:10.1038/nrc1697
3. Mocellin S, Keilholz U, Rossi CR, Nitti D. Circulating tumor cells: the ‘leukemic phase’ of solid cancers. Trends Mol Med. 2006;12:130–139. doi:10.1016/j.molmed.2006.01.006
4. Leotsakos I, Dimopoulos P, Gkioka E, et al. Detection of circulating tumor cells in bladder cancer using multiplex PCR assays. Anticancer Res. 2014;34:7415–7424.
5. Nezos A, Pissimisis N, Lembessis P, et al. Detection of circulating tumor cells in bladder cancer patients. Cancer Treat Rev. 2009;35:272–279. doi:10.1016/j.ctrv.2008.11.003
6. Maheswaran S, Haber DA. Circulating tumor cells: a window into cancer biology and metastasis. Curr Opin Genet Dev. 2010;20:96–99. doi:10.1016/j.gde.2009.12.002
7. Alva A, Friedlander T, Clark M, et al. Circulating tumor cells as potential biomarkers in bladder cancer. J Urol. 2015;194:790–798. doi:10.1016/j.juro.2015.02.2951
8. Paterlini-Brechot P, Benali NL. Circulating tumor cells (CTC) detection: clinical impact and future directions. Cancer Lett. 2007;253:180–204. doi:10.1016/j.canlet.2006.12.014
9. Visvader JE. Cells of origin in cancer. Nature. 2011;469:314–322. doi:10.1038/nature09781
10. Ohishi T, Koga F, Migita T. Bladder cancer stem-like cells: their origin and therapeutic perspectives. Int J Mol Sci. 1720;16.
11. Chan KS, Espinosa I, Chao M, et al. Identification, molecular characterization, clinical prognosis, and therapeutic targeting of human bladder tumor-initiating cells. Proc Natl Acad Sci. 2009;106:14016–14021. doi:10.1073/pnas.0906549106
12. Dancik GM, Owens CR, Iczkowski KA, Theodorescu D. A cell of origin gene signature indicates human bladder cancer has distinct cellular progenitors. Stem Cells. 2014;32:974–982. doi:10.1002/stem.1625
13. Lee J, Kim HK, Rho JY, Han YM, Kim J. The human OCT-4 isoforms differ in their ability to confer self-renewal. J Biol Chem. 2006;281:33554–33565. doi:10.1074/jbc.M603937200
14. Jóźwicki W, Brożyna A, Siekiera J. Expression of OCT4A: the first step to the next stage of urothelial bladder cancer progression. Int J Mol Sci. 2014;15:16069–16082. doi:10.3390/ijms150916069
15. Polyak K, Weinberg RA. Transitions between epithelial and mesenchymal states: acquisition of malignant and stem cell traits. Nat Rev Cancer. 2009;9:265–273. doi:10.1038/nrc2620
16. Kiselyov A, Bunimovich-Mendrazitsky S, Startsev V. Key signaling pathways in the muscle-invasive bladder carcinoma: clinical markers for disease modeling and optimized treatment. Int J Cancer. 2016;138:2562–2569. doi:10.1002/ijc.29918
17. Liberko M, Kolostova K, Bobek V. Essentials of circulating tumor cells for clinical research and practice. Crit Rev Oncol Hematol. 2013;88:338–356. doi:10.1016/j.critrevonc.2013.05.002
18. Kang Y, Massague J. Epithelial-mesenchymal transitions: twist in development and metastasis 1. Cell. 2004;118:277–279. doi:10.1016/j.cell.2004.07.011
19. Ashworth T. A case of cancer in which cells similar to those in the tumors were seen in the blood after death. Aust Med J. 1869;14:146.
20. Rink M, Chun FK, Dahlem R, et al. Prognostic role and HER2 expression of circulating tumor cells in peripheral blood of patients prior to radical cystectomy: a prospective study. Eur Urol. 2012;61:810–817. doi:10.1016/j.eururo.2012.01.017
21. Hollier BG, Evans K, Mani SA. The epithelial-to-mesenchymal transition and cancer stem cells: a coalition against cancer therapies. J Mammary Gland Biol Neoplasia. 2009;14:29–43. doi:10.1007/s10911-009-9110-3
22. Atlasi Y, Mowla SJ, Ziaee SAM, et al. OCT-4, an embryonic stem cell marker, is highly expressed in bladder cancer. Int J Cancer. 2007;120:1598–1602. doi:10.1002/ijc.22508
23. Giuliano M, Giordano A, Jackson S, et al. Circulating tumor cells as prognostic and predictive markers in metastatic breast cancer patients receiving first-line systemic treatment. Breast Cancer Res. 2011;13(3):R67. doi:10.1186/bcr2907
24. Larsson A, Wilhelmsson U, Pekna M, et al. Increased cell proliferation and neurogenesis in the hippocampal dentate gyrus of old GFAP(-/-)Vim(-/-) mice. Neurochem Res. 2004;29(11):2069–2073. doi:10.1007/s11064-004-6880-2
25. Yu W, Kamara H, Svoboda KK. The role of twist during palate development. Dev Dyn. 2008;237(10):2716–2725. doi:10.1002/dvdy.21627
26. Yu M, Bardia A, Wittner BS, et al. Circulating breast tumor cells exhibit dynamic changes in epithelial and mesenchymal composition. Science. 2013;339(6119):580–584. doi:10.1126/science.1228522
27. Liu Y-K, Hu B-S, Li L, et al. Improved strategy to detect the epithelial-mesenchymal transition process in circulating tumor cells in hepatocellular carcinoma patients. Hepatol Int. 2016;10:640–646. doi:10.1007/s12072-016-9732-7
28. Lu CS, Shieh GS, Wang CT, et al. Chemotherapeutics-induced Oct4 expression contributes to drug resistance and tumor recurrence in bladder cancer. Oncotarget. 2017;8(19):30844–30858.
29. Singh R, Ansari JA, Maurya N, et al. Epithelial-To-Mesenchymal Transition and Its Correlation With Clinicopathologic Features in Patients With Urothelial Carcinoma of the Bladder. Clin Genitourin Cancer. 2017;15(2):e187–e197.
30. Chaffer CL, Brennan JP, Slavin JL, Blick T, Thompson EW, Williams ED. Mesenchymal-to-epithelial transition facilitates bladder cancer metastasis: role of fibroblast growth factor receptor-2. Cancer Res. 2006;66:11271–11278. doi:10.1158/0008-5472.CAN-06-2044
31. Baumgart E, Cohen MS, Silva Neto B, et al. Identification and prognostic significance of an epithelial-mesenchymal transition expression profile in human bladder tumors. Clin Cancer Res. 2007;13:1685–1694. doi:10.1158/1078-0432.CCR-06-2330
32. McConkey DJ, Choi W, Marquis L, et al. Role of epithelial-to-mesenchymal transition (EMT) in drug sensitivity and metastasis in bladder cancer. Cancer Metastasis Rev. 2009;28:335–344. doi:10.1007/s10555-009-9194-7
33. Kenney PA, Wszolek MF, Rieger-Christ KM, et al. Novel ZEB1 expression in bladder tumorigenesis. BJU Int. 2011;107:656–663. doi:10.1111/j.1464-410X.2010.09489.x
 © 2020 The Author(s). This work is published and licensed by Dove Medical Press Limited. The full terms of this license are available at https://www.dovepress.com/terms.php and incorporate the Creative Commons Attribution - Non Commercial (unported, v3.0) License.
By accessing the work you hereby accept the Terms. Non-commercial uses of the work are permitted without any further permission from Dove Medical Press Limited, provided the work is properly attributed. For permission for commercial use of this work, please see paragraphs 4.2 and 5 of our Terms.
© 2020 The Author(s). This work is published and licensed by Dove Medical Press Limited. The full terms of this license are available at https://www.dovepress.com/terms.php and incorporate the Creative Commons Attribution - Non Commercial (unported, v3.0) License.
By accessing the work you hereby accept the Terms. Non-commercial uses of the work are permitted without any further permission from Dove Medical Press Limited, provided the work is properly attributed. For permission for commercial use of this work, please see paragraphs 4.2 and 5 of our Terms.