")
Back to Journals » OncoTargets and Therapy » Volume 13
Co-Expression Network Analysis Identified LTF in Association with Metastasis Risk and Prognosis in Clear Cell Renal Cell Carcinoma
Authors Ni L, Yuan C, Zhang C, Xiang Y, Wu J, Wang X , Wu X
Received 23 February 2020
Accepted for publication 25 May 2020
Published 17 July 2020 Volume 2020:13 Pages 6975—6986
DOI https://doi.org/10.2147/OTT.S251000
Checked for plagiarism Yes
Review by Single anonymous peer review
Peer reviewer comments 2
Editor who approved publication: Dr Federico Perche
Lihua Ni,1,* Cheng Yuan,2,* Changjiang Zhang,3,4,* Yuandi Xiang,5 Juan Wu,6 Xiaolong Wang,7 Xiaoyan Wu1
1Department of Nephrology, Zhongnan Hospital of Wuhan University, Wuhan 430071, People’s Republic of China; 2Department of Gynecological Oncology, Zhongnan Hospital of Wuhan University, Wuhan 430071, People’s Republic of China; 3Department of Cardiology, Renmin Hospital of Wuhan University, Wuhan, Hubei 430060, People’s Republic of China; 4Department of Cardiology, The Central Hospital of Enshi Autonomous Prefecture, Enshi, People’s Republic of China; 5Department of Otorhinolaryngology, Wuhan First Hospital, Wuhan, Hubei, People’s Republic of China; 6Department of Dermatology, Wuhan First Hospital, Wuhan, Hubei, People’s Republic of China; 7Department of Urology, Research Lab/LIFE-Zentrum, University of Munich (LMU), München, Germany
*These authors contributed equally to this work
Correspondence: Xiaoyan Wu
Department of Nephrology, Zhongnan Hospital of Wuhan University, Wuhan 430071, People’s Republic of China
Tel +86 159-7293-5798
Fax +86 27-6781-3408
Email [email protected]
Objective: Clear cell renal cell carcinoma (ccRCC) is the most common renal cancer in adults. The 5-year survival rate of patients with advanced ccRCC is less than 30%. Lack of potential biomarkers for treatment and prognosis is a limitation for early diagnosis and treatment of ccRCC.
Methods: We collected microarray profiles of 39 ccRCC and matched normal samples to identify differential expression genes (DEGs). Then, a weighted gene co-expression network analysis (WGCNA) was constructed to identify gene modules associated with the metastasis in ccRCC. The Cancer Genome Atlas (TCGA) database and the Human Protein Atlas (HPA, https://www.proteinatlas.org/) database were used for verification set. Finally, we used biological experiments to preliminary investigate the impact of LTF on the tumor biological behavior of ccRCC, including proliferation, migration, invasion, and apoptosis.
Results: A total of 15 genetic modules were identified, and the light-green module is considered the most relevant to tumor metastasis. (P = 0.02, R2 = − 0.4). Protein–protein interaction (PPI) network was performed to identify the hub nodes in the light-green module. Finally, combining the results of PPI, WGCNA and DEGs, lactotransferrin (LTF) gene was regarded as “real” hub genes for cancer metastasis risk. LTF was subsequently validated using the TCGA database. Immunohistochemistry confirmed that the expression of LTF in ccRCC tumor tissue was significantly lower than that in normal tissue based on the HPA database. Intriguingly, patients with low expression of LTF had lower survival rates (HR = 0.66, 95% CI: 0.49– 0.89, P = 0.0067), the expression level of the sample was negatively correlated with tumor stage (P = 0.0385), and patients with low expression of LTF gene were more likely to have distant metastasis (P = 0.038). Overexpression of LTF inhibited the proliferation, migration, invasion and promoted apoptosis of human ccRCC cells in vitro.
Conclusion: LTF might be a novel prognostic biomarker for ccRCC.
Keywords: clear cell renal cell carcinoma, LTF, metastasis
Introduction
As one of the most common malignant tumors of the urinary system, renal cell carcinoma (RCC) accounts for about 5% of adult malignancies.1 Clear cell RCC (ccRCC) has the highest mortality rate, accounting for 70% to 85% of RCC incidence rate.2,3 Due to the lacking of early diagnostic indicators and strong resistance to chemoradiotherapy, the prognosis of ccRCC patients is still poor.4 Especially for the metastatic patients, 5-year survival was less 20%.5,6 Therefore, novel biomarkers related to metastasis need to be found to provide decisions for early diagnosis and treatment.
In recent years, microarray and high-throughput sequencing technology have been widely applied.7,8 However, most researches focus on the screening of differentially expressed genes (DEGs), ignoring the high degree of correlation between genes.9 Based on the relationship between genes, a co-expression network was constructed by the weighted gene co-expression network analysis (WGCNA). Then significant gene modules and hub genes associated with the clinical traits were identified. Therefore, it is possible that we can identify such biomarkers that can predict the metastasis and progression of ccRCC.
Materials and Methods
Data Collection
Gene expression matrix and ccRCC patients’ clinical data were downloaded from Gene Expression Omnibus (GEO) database. Dataset from GSE105288 was used to construct expression network and identify hub genes. The microarray platform was Illumina HumanMethylation450 BeadChip (HumanMethylation450_15017482), and included 35 samples of ccRCC and 9 samples of non-tumor tissues. Then, our results were further validated by RNA sequencing data downloaded from the Cancer Genome Atlas (TCGA) database. The flow chart for the study selection for this integrated analysis is shown in Supplementary Figure 1.
Data Preprocessing
According to the distance among different samples in Pearson correlation matrix, the quality of microarray was evaluated by sample clustering. The height cut of 90 was chosen, and 3 samples (GSM2825244, GSM2825254 and GSM2825274) were detected as outliers (Supplementary Figure 2).
Differentially Expressed Genes Screening
The “limma” package was used to screen the DEGs between the tumor and nontumor tissues of ccRCC. The false discovery rate (FDA) <0.05 and |log2 fold change (FC)| > 1 were considered to be statistically different.
Co-Expression Network Construction
Those genes with expression variance was greater than the quartile of all variances were used to construct co-expression network. The pearson’s correlation matrices were calculated. Then, a weighted adjacency matrix was constructed. Next, the adjacency was transformed into topological overlap matrix (TOM).10 Average linkage hierarchical clustering was conducted according to the TOM-based dissimilarity measure with a minimum size of 30 for the resulted dendrogram.11
Identification of Clinical Significant Modules
Two important parameters were used to identify clinical significant modules. Gene significance (GS) was defined as the log10 transformation of the P value, and module significance (MS) was defined as the average GS for all the genes in a module. Of all the modules selected, the module with the largest absolute MS was generally considered to be a module related to clinical characteristics. Finally, select modules that were highly relevant to certain clinical features for further analysis.
Identification of Hub Genes
Hub genes consist of highly interconnected stacks within modules and have proven to have important functions.12 In this study, hub genes were defined as genes with high module membership (MM) (cor. Weighted >0.8).13 We defined hub genes as genes with high MM (cor. Weighted >0.8). Then, the protein–protein interaction (PPI) network was also constructed based on the STRING database (https://string-db.org/). In the PPI network, genes with Top 10 Hubba nodes ranked by Maximal Clique Centrality (MCC) also defined as hub genes. The common hub genes in both co-expression network and PPI network were regarded as “real” hub genes for further analyses.
Validation Set Database
When the hub gene is determined, TCGA expression data and clinical data were used as validation set. Based on TCGA data, GEPIA (http://gepia.cancer-pku.cn/) can visually analyze the expression level and clinical relevance. The Human Protein Atlas (HPA, https://www.proteinatlas.org/) provided the location and qualitative data of protein in ccRCC.
Cell Culture and Lentiviral Vector Construction
Normal human kidney derived HK-2, and human RCC cell lines 786-O, ACHN, 769-P and Caki-1 were purchased from the Cell Bank of Type Culture Collection (CBTCC, Chinese academy of science, Shanghai, China) and Cell Bank of Wuhan University. The above cell lines were grown in RPMI 1640 medium (Gibco, Carlsbad, CA, USA) containing 10% fetal bovine serum (FBS) (Gibco, Carlsbad, CA, USA) and 1% penicillin/streptomycin solution (Gibco, Carlsbad, CA, USA) in a humidified condition with 5% CO2 at 37 °C. All cell lines were expanded in monolayers in dishes or flasks. At 75–80% confluence, the culture medium was exchanged to serum-free solution for 24 h before their further experiments. Lentivirus containing pLVX-Puro (Vector) and pLVX- lactotransferrin (LTF)-Puro obtained from Genechem (GeneChen, China) was established for overexpression of LTF.
Flow Cytometry Analysis
The cell apoptosis was measured by an Annexin V-fluorescein isothiocyanate (FITC)/Propidium Iodide (PI) apoptosis kit. Firstly, the cells were collected after 48 hours’ transfection. Next, the transfected cells were staining with 5 µL Annexin V-FITC and 5 µL PI in the dark for 30 minutes. And then, 400 µL binding buffer was added into cell suspension. Finally, we calculated the amounts of the early and late apoptosis rate through a flow cytometer (Beckman Counter, Inc) in one hour after the reaction.
Cell Proliferation Assay
Cell Counting Kit-8 (CCK-8, Japan) was purchased to detect the cell proliferation in different time according to the protocols. The transfected cells were plated in 96-well plates at 104 cells per well with 100 µL of culture medium in humidified condition at 37 °C. Then, 10 µL CCK-8 solutions were added into each well and further incubated in humidified condition at 37 °C for 1 h. Finally, the cells were measured at the absorbance of 450 nm according to the indicated time point. Each experiment repeated at least three times.
Cell Migration and Invasion Assay
The cell migration and invasion experiments were performed to detect the cell adhesive and invasive ability. As for the cell migration experiment by wound healing assay, the cells were sowed in 6-well plates (106/well) with serum-free culture medium. The scratches were made through a 200 µL plastic pipette tip. Forty-eight hours later, the migrated cells would be washed with phosphate buffer solution (PBS), fixed with 4% paraformaldehyde. The migration distance would be calculated under the light microscope.
As for the invasion assay by the 8-um chamber. Firstly, the chamber was pretreated with matrigel (BD Biosciences, USA). And then, the 6 ×10⁴ cells were sowed into the upper chamber without serum, while the culture medium with 10% FBS was added into the lower chamber. Twenty-four hours later, the migrated cells on the subface would be washed with PBS, fixed with 4% paraformaldehyde and stained with crystal violet solutions. The invasion ability would be determined by calculated the migrated cells on the subface through the light microscope.
Quantitative Real-Time PCR Assay (qRT-PCR)
Total RNA from cell lines were isolated by a trizol agent and reverse transcribed to synthesize complementary DNA (cDNA) by the RevertAid First Strand cDNA Synthesis Kit. We performed the qRT-PCR with SYBR Green Mix in the RT-PCR detection system (Bio-Rad, USA) based on the manufacture’s protocols. The relative mRNA expression of LTF was measured by 2−∆∆Ct methods and the GAPDH was served as an internal control. The primers involved in our study are as follows:
LTF forward:5ʹ- AGTCTACGGGACCGAAAGACA −3ʹ
LTF reverse: 5ʹ- CAGACCTTGCAGTTCGTTCAG −3ʹ
GAPDH forward: 5ʹ- GGACCTGACCTGCCGTCTAG −3ʹ
GAPDH reverse: 5ʹ- GTAGCCCAGGATGCCCTTGA −3ʹ
Statistical Analysis
All statistical analysis was conducted with SPSS 21.0 and the results in our study were expressed as mean ± SD. The significance of the changes between the two group was determined by Student’s t-test, and the data were considered significant when P < 0.05.
Results
DEGs Screening
Under the threshold of FDA < 0.05 and |log2 FC| > 1, a total of 453 DEGs (165 up-regulated and 288 down-regulated in ccRCC) were selected from 41 samples. The DEGs and clustering dendrogram of tumor samples, as well the clinical traits were shown in Figure 1.
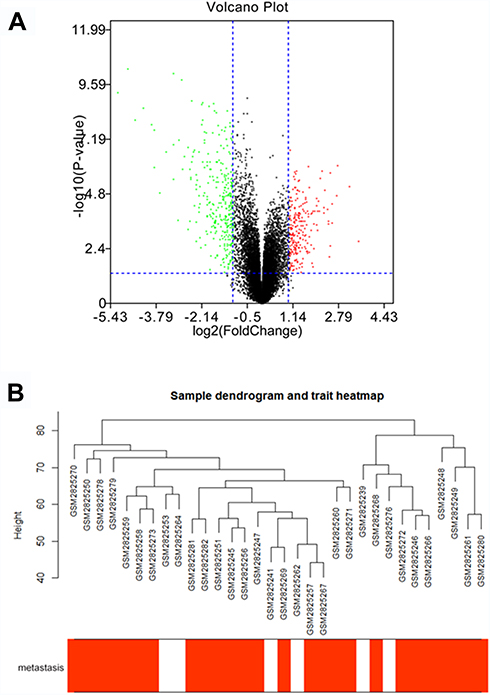 |
Figure 1 The differentially expressed genes (DEGs) and clustering dendrogram of tumor samples, as well the clinical traits. (A) The volcano plot for all DEGs based on GSE105288. (B) The clustering was based on DEGs between ccRCC and normal. The red color represents positive tumor metastasis. |
Co-Expression Network Construction and Key Modules Identification
Using “WGCNA” package in R, the genes those expression variance were greater than the quartile of all variances were grouped into modules. Here, the power of β = 6 (scale free R2 = 0.87) was selected as the soft-thresholding to ensure a scale-free network (Figure 2). Fifteen modules are considered to be significantly correlated (Figure 3A). And only the correlation between the light-green module and metastasis risk was high (P = 0.02, R2 = –0.4) (Figure 3B). Thus, the light-green module with metastasis risk was identified as the clinical significant module.
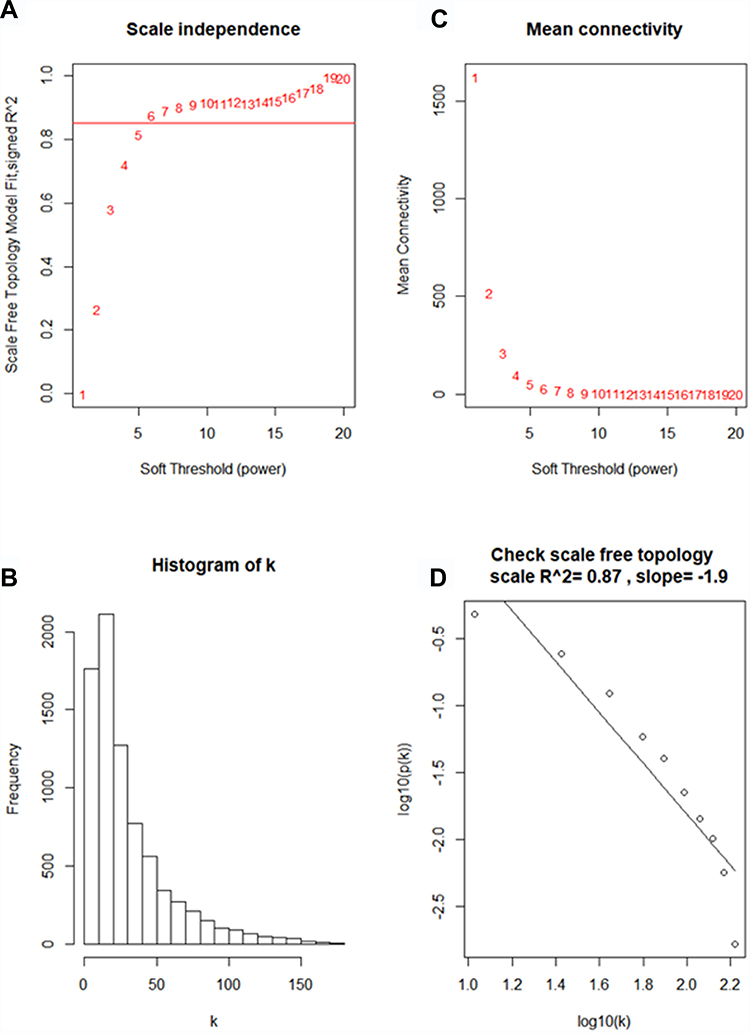 |
Figure 2 Determine soft-thresholding power in WGCNA. (A) The scale-free fit index for various soft-thresholding powers (β). (B) The mean connectivity for various soft-thresholding powers. (C) Histogram of connectivity distribution (β = 6). (D) Checking the scale free topology (β = 6). |
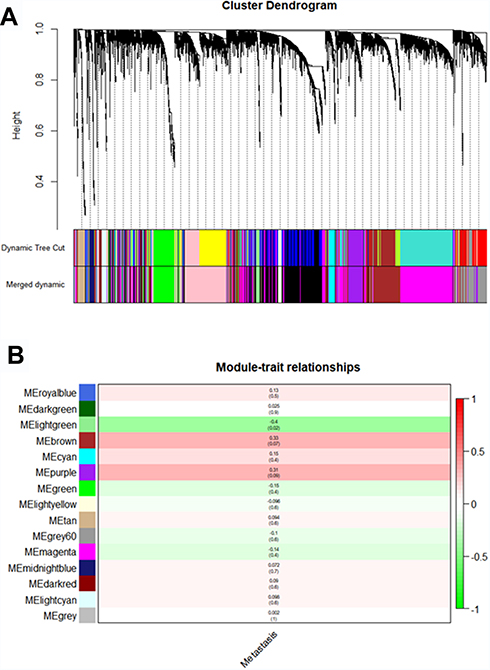 |
Figure 3 Identifying modules associated with the clinical traits of ccRCC. (A) Dendrogram of all DEGs clustered based on a dissimilarity measure (1-TOM). (B) Heatmap of the correlation between module eigengenes and clinical traits of ccRCC. |
Identification of Hub Genes for Metastasis Risk in the Light Green Module
Eighty-eight genes from the light green module were enriched for Gene Ontology (GO) and pathway analysis. The results of GO of the light green module were focused on cytoplasmic vesicle lumen and vesicle lumen in CC (Supplementary Figure 3A), organic acid binding in MF (Supplementary Figure 3B) and neutrophil degranulation, neutrophil activation involved in immune response, neutrophil activation and neutrophil mediated immunity in BP (Supplementary Figure 3C). KEGG pathways of the light green module were significantly enriched in Lysosome and Staphylococcus aureus infection related pathways (Supplementary Figure 3D).
The highly linked hub genes in the module act as a key function in biological processes.14 Therefore, in the light green module, 27 genes with high connectivity (weighted correlation coefficient > 0.8) were selected as the candidate hub genes for the metastasis risk of the module (Table 1). Furthermore, we also constructed a network of PPI (Figure 4A), and top 10 Hubba nodes were identified based on Maximal Clique Centrality (MCC) though CytoHubba plug-in (Figure 4B).
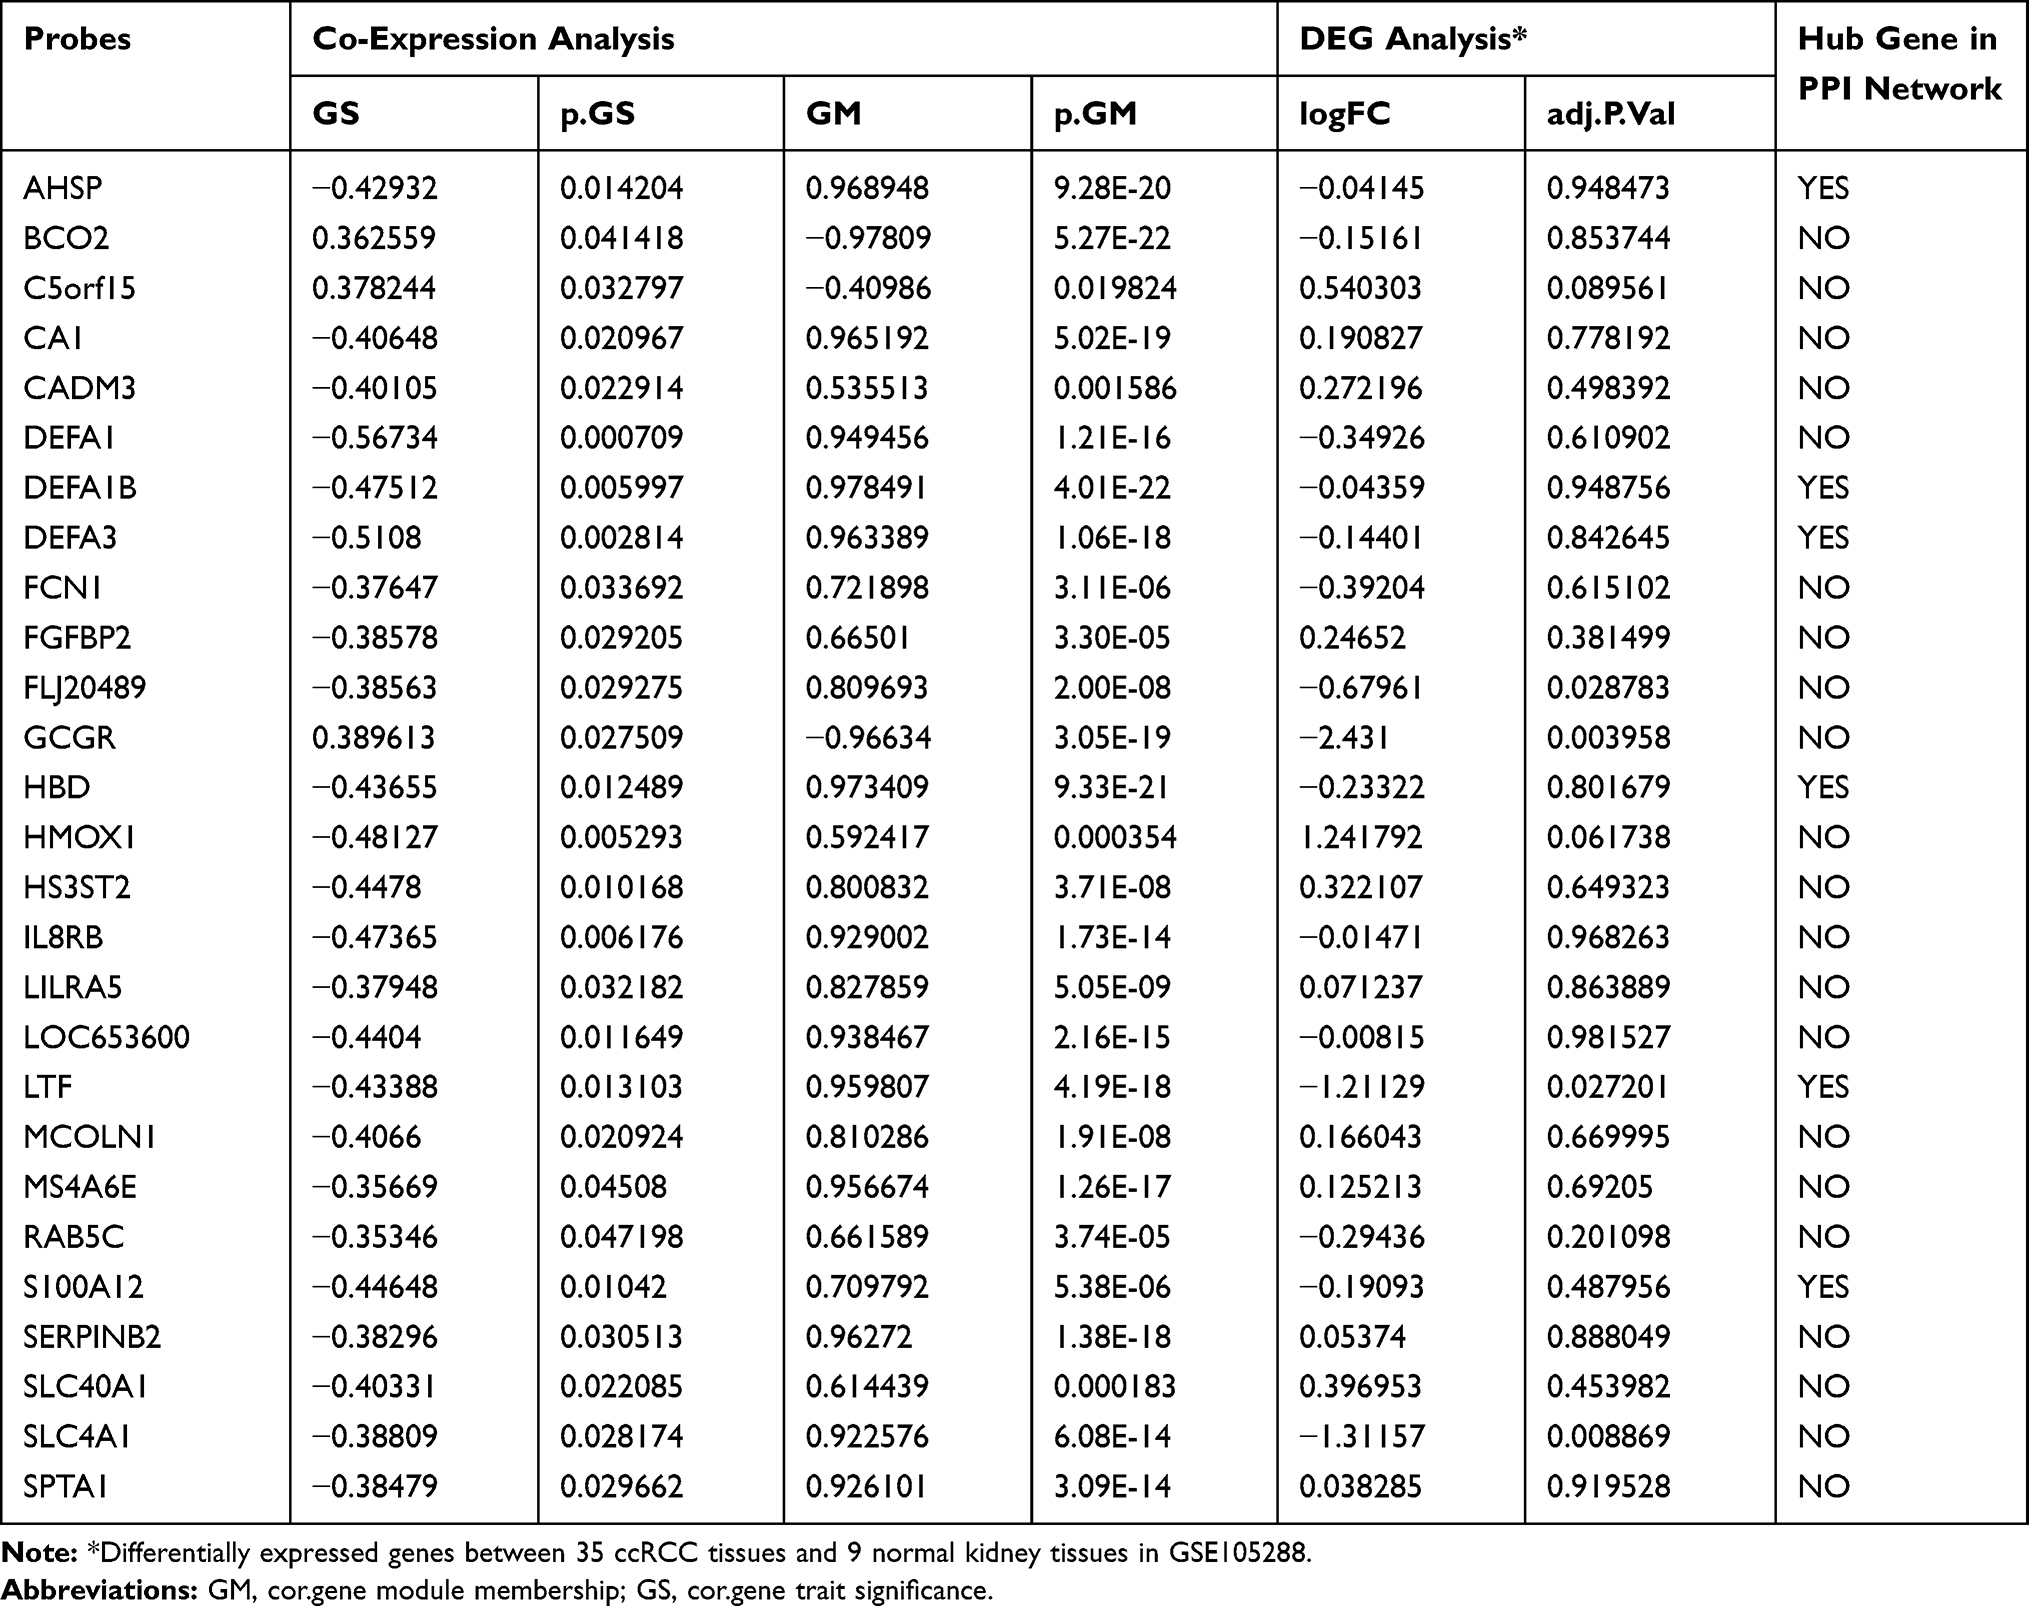 |
Table 1 Hub Genes in the Module Related with Metastasis Risk |
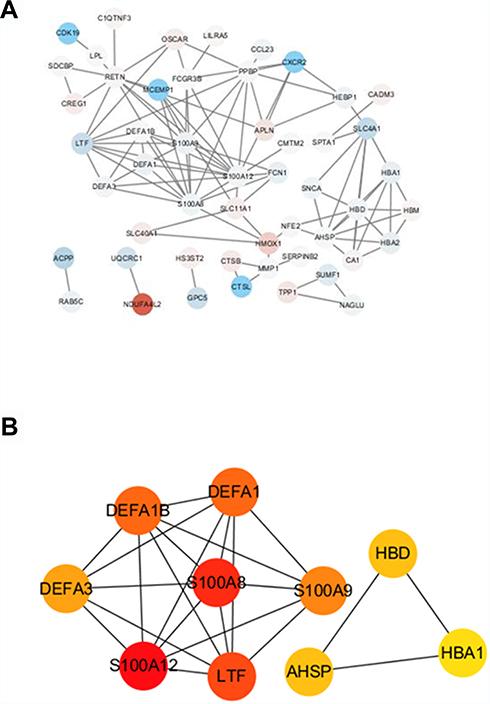 |
Figure 4 The hub genes in the PPI network of genes in the light green module. (A) PPI network of genes in the light green module. The red color represents upregulated genes and blue color represents downregulated genes. (B) The hub genes in the PPI network. |
Then, combining the results of PPI, WGCNA and DEGs, LTF gene was regarded as “real” hub genes for metastasis risk was identified. Specifically, in our research, “real” hub gene was the intersection of multiple gene subgroups. (1) We used WNCNA to obtain hub module related to metastasis. The key parameter was the soft-thresholding (β = 6, scale free R2 = 0.87). (2) Then PPI network (weighted correlation coefficient > 0.8) filtered to Top 10 Hubba nodes by MCC algorithm of CytoHubba plug-in. (3) Under the threshold of FDA < 0.05 and |log2 FC| > 1, a total of 453 DEGs (165 up-regulated and 288 down-regulated in ccRCC) were selected from 41 samples. Finally, after finding the intersection of top 10 hubba nodes and DEGs, we identified LTF gene as “real” hub gene for metastatic risk.
Hub Gene Validation
The expression of LTF in ccRCC tumor tissue was significantly lower than that in normal tissue, which was verified by TCGA RNA-sequencing data (Figure 5A) and immunohistochemistry results from HPA database (Figure 5B). Similarly, the expression of LTF was significantly decreased in ccRCC cell lines (786-O, ACHN, 769-P and Caki-1) compared with the normal human kidney cell line (HK-2) (Figure 5C). We also found a poorer survival rate in the samples with low expression levels of LTF (HR = 0.66, 95% CI: 0.49–0.89, P = 0.0067; Figure 6A). In addition, the LTF expression level of the sample was negatively correlated with tumor stage (P = 0.0385, Figure 6B), and patients with low expression of LTF gene were more likely to have distant metastasis (P = 0.038, Figure 6C).
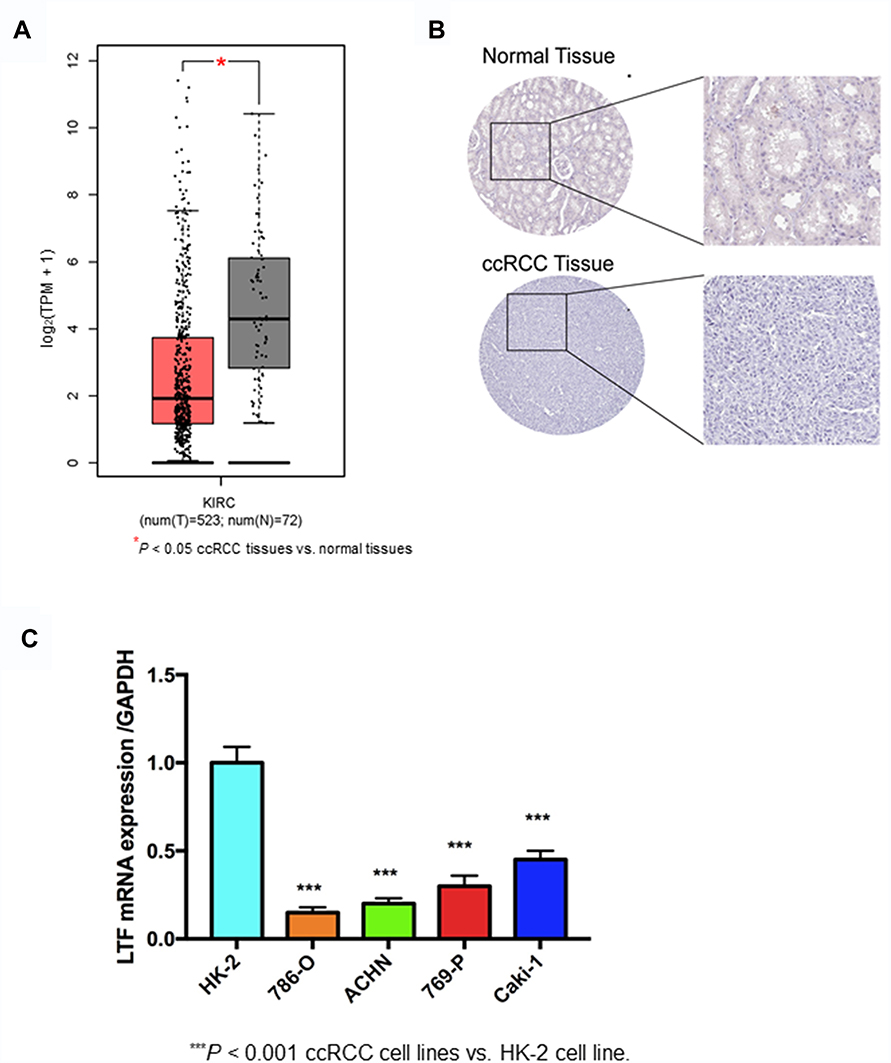 |
Figure 5 Validation of hub gene. (A) Differential expression of LTF gene in ccRCC tissues and normal tissues based on GEPIA (http://gepia.cancer-pku.cn/). *P < 0.05 (B) Immunohistochemistry confirmed the differential expression of LFT in ccRCC tissues and normal tissues based on the Human Protein Atlas (HPA, https://www.proteinatlas.org/). (C) Quantitative RT-PCR analysis of LTF expression in human normal kidney cell line (HK-2) and ccRCC cell lines (786-O, ACHN, 769-P, Caki-1). Data are presented as the mean ± SD. ***P < 0.001 ccRCC cell lines vs HK-2 cell line. |
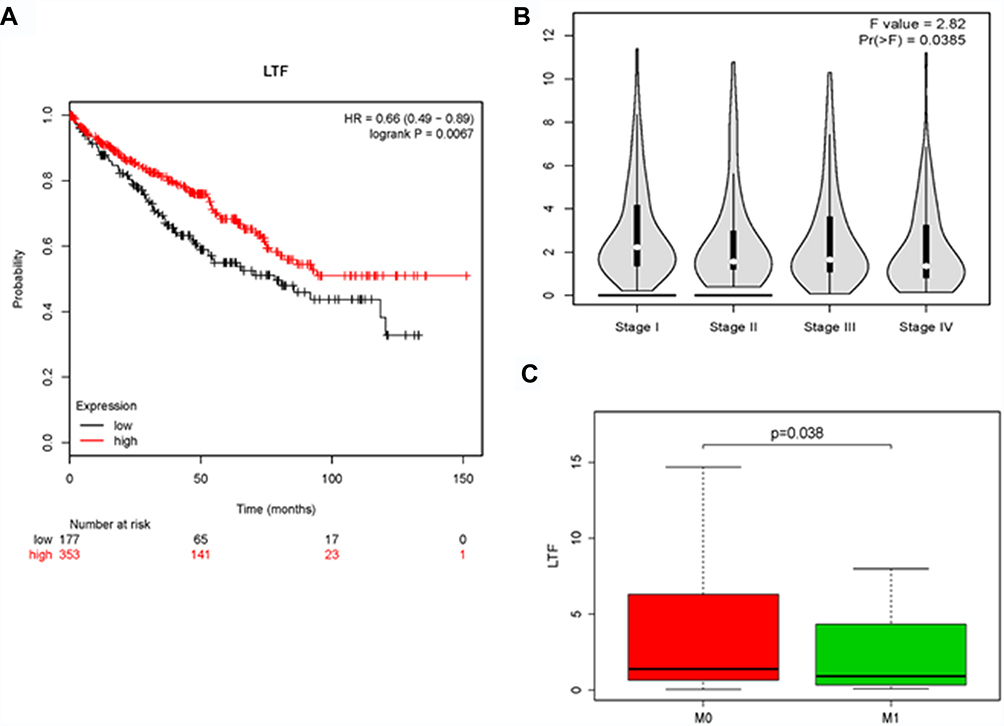 |
Figure 6 The effect of LTF on the clinical features of ccRCC. (A) Kaplan-Meier plot of overall survival for LTF expression. (B) The correlation of LTF expression with the tumor stages of ccRCC based on the TCGA data in the GEPIA database. (C) The correlation of LTF expression with the tumor metastasis of ccRCC based on the TCGA data. |
LTF Prevented Proliferation and Promoted Apoptosis in vitro
The low expression of LTF in ccRCC patients manifests as an antagonistic medical behavior, and we doubt whether LTF can play a tumor-suppressive role in tumors. Therefore, we further explored the role of LTF on cell proliferation and apoptosis. 786-O and ACHN were selected for in vitro RCC cell models. The above two cell lines were transfected with lentivirus to induce stable overexpression of LTF, and verified by qRT-PCR (Figure 7A). In addition, CCK-8 and flow cytometry were used to detect cell proliferation and apoptosis. The results of CCK-8 revealed that overexpression of LTF markedly decreased the proliferation of 786-O and ACHN cells in 72 h (Figure 7B and C). Moreover, the flow cytometry analysis demonstrated that apoptotic cells were dramatically up-regulated in LTF overexpressed group (Figure 7D-G).
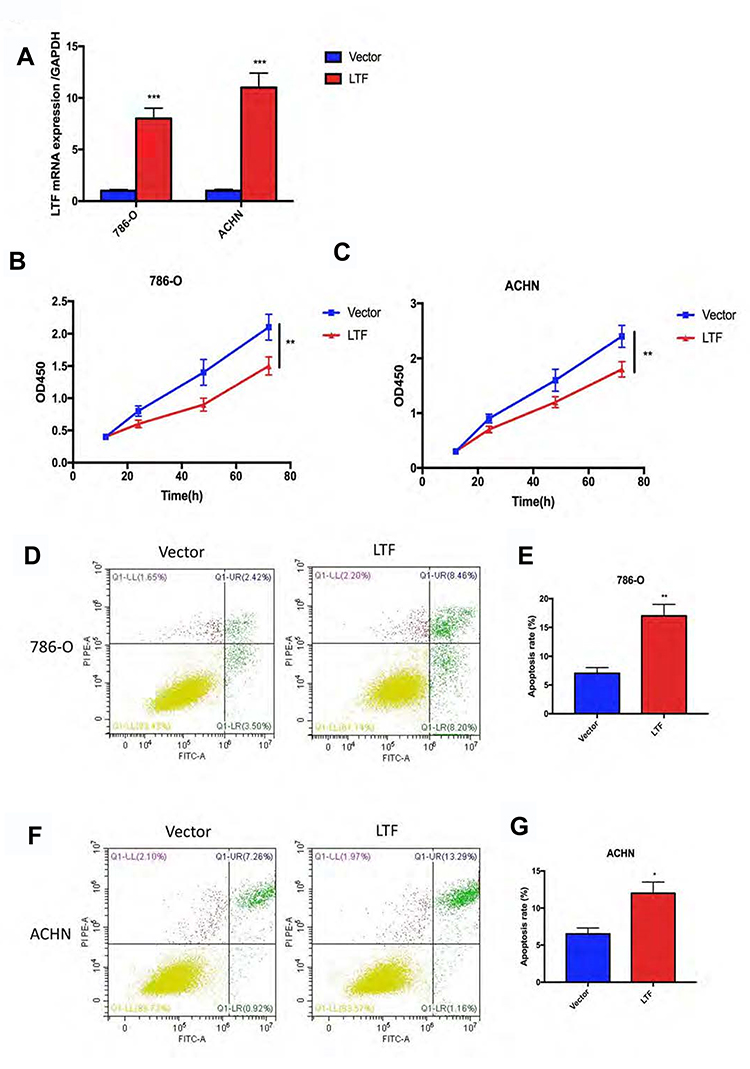 |
Figure 7 LTF prevented proliferation and promoted apoptosis in vitro. (A) LTF overexpression efficiency was estimated by RT-PCR in 786-O and ACHN cell lines. ***P < 0.001 (B and C) CCK8 assay showed LTF up-regulation suppressed cell proliferation in 786-O and ACHN cell lines.**P < 0.01 (D-G) The apoptosis of 786-O and ACHN cells improved after LTF overexpression. *P < 0.05, **P < 0.01. |
Overexpressed LTF Prevented Cell Migration and Invasion
As shown in Figure 8A-D, the migration capacity of 786-O and ACHN cells was inhibited in LTF-upregulated group compared with that in the control group by wound healing assay; In addition, the invasive capacity was repressed in LTF-upregulated group compared with that in the control group by the transwell assay (Figure 8E-H). These data indicated that LTF could suppress the capacity of migration and invasion in ccRCC cell lines.
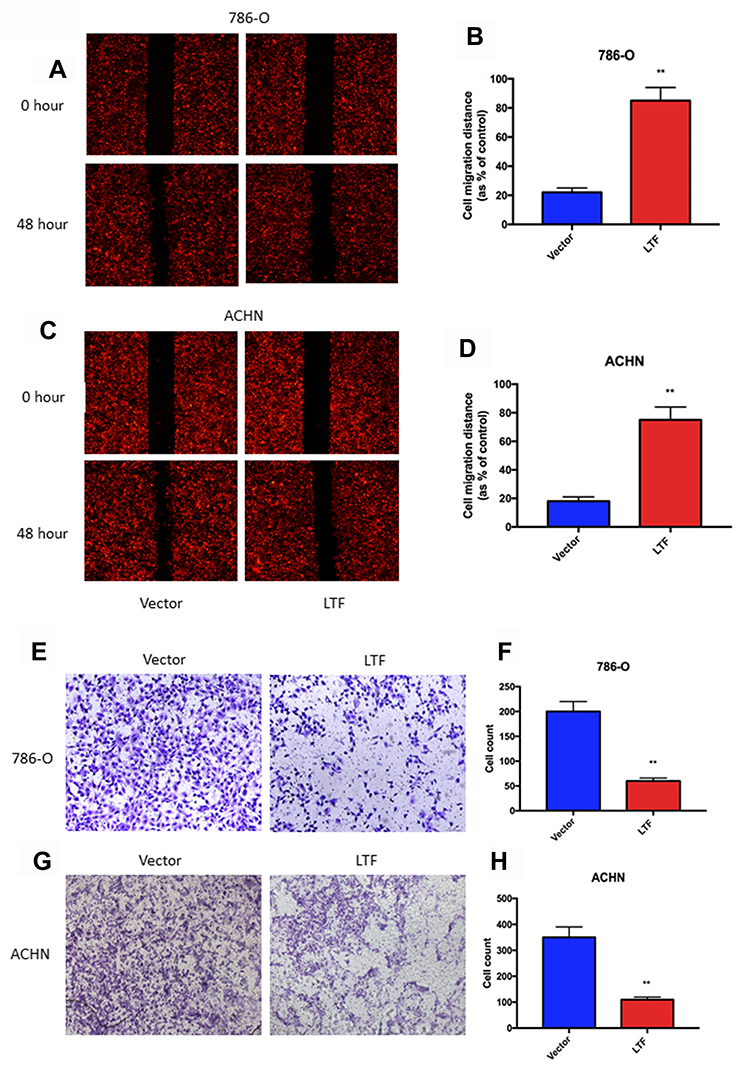 |
Figure 8 LTF overexpression prevented cell migration and invasion. (A-D) Wound-healing assay presented up-regulation of LTF reduced migratory ability in 786-O and ACHN cell lines.**P < 0.01 (E-H) High-expression of LTF in 786-O and ACHN cells suppressed cell invasion discovered by transwell assay. **P < 0.01. |
Discussion
As we all know, ccRCC is not sensitive to radiotherapy and chemotherapy, and the recurrence rate and 5-year survival rate after radical nephrectomy are 40% and 20%, respectively. Thus, novel research on the mechanisms of the tumorigenesis and metastasis of ccRCC to identify druggable and predictable biomarkers is urgent.
In the present study, we found that the LTF was strongly correlated with metastasis risk in ccRCC, and distinguished the localized and non-localized ccRCC. Then the expression of LTF is dramatic reduced and positively related with the overall survival of ccRCC patients. We further validated its effects in ccRCC cell lines. Firstly, we found that the LTF levels were decreased in ccRCC cell lines. Then, the lentivirus with overexpressed LTF was transfected into ccRCC cell lines to test the results of bioinformatic analysis. Functionally, LTF could inhibit the cellular capacity of proliferation, migration and invasion, and promoted apoptosis. All these results suggested that LTF might be served as a potential biomarker for the diagnosis and therapy in ccRCC.
What is LTF and what does it do? LTF, an 80-kDa basic glycoprotein, is a member of the transferrin family of iron binding protein, which widely expressed in milk, trachea, saliva, nasal secretions, tears, semen, pancreatic juice and neutrophils particles.15 It plays multiple roles in mammals, such as anti-inflammation, anti-bacterial, anti-fungus, anti-tumorigenesis and iron transportation. LTF could initiate immunological cascade to increase cytokines release (such as IL-18 and IFN- γ) and cell activity (such as natural killer cell and cytotoxic T lymphocyte). Previously, several studies16,21 reported that LTF suppressed the growth and metastasis of human carcinoma cell, such as thyroid tumors, gastric carcinoma, breast carcinoma, prostatic carcinomas, parotid gland, colorectal carcinomas, gallbladder carcinomas, endometrial carcinomas. Besides, it has been proved that LTF significantly inhibited the VEGF-mediated response in terms of the microvessel spatial extension, overall vascularity and incidence of crossover in adult rats. However, the studies of LTF in ccRCC were very few. Kevin et al,22 suggested that LTF mediated the anemia often seen in association with RCC. Giuseppe et al,23 found lower LTF intensity-distribution score in ccRCC than non-ccRCC tissues. As we know, LTF has a high affinity for iron, which has been considered an essential nutrient for cells that are dividing quickly such as tumor cells, participating in various metabolic cellular processed such as oxidative phosphorylation and RNA and DNA synthesis. Therefore, neoplastic RCC could take use of LTF in order to have a greater availability of iron for their turnover. Although biological functions of LTF had attracted more and more attention, how did it involved in antioncogenesis was still largely unclear.
In the current study, low expression of LTF gene increases the risk of metastasis in ccRCC. Previous studies have reported that LTF regulated the risk of metastasis of soft tissue sarcoma,16 oral squamous cell carcinoma17 and nasopharyngeal carcinoma (NPC).19,24 LTF was considered as a candidate tumor susceptibility suppressor gene located at 3p21.31–21.2 that could negatively regulate the development and metastasis of NPC25 by inducing cell cycle G1/S arrest, and modulating the mitogen-activated protein kinase (MAPK) and Akt signaling pathways.19,25 However, there is not enough evidence and research to explain the relationship between LTF and the risk of metastasis in ccRCC, which still need further study.
In summary, we have demonstrated that LTF is an antioncogene in ccRCC, impairing the ability of cells to proliferate, migrate and invade. Loss of LTF was closely related to the malignant features of ccRCC, which further proved that LTF could be a prognostic biomarker in ccRCC.
Disclosure
The authors report no conflicts of interest in this work.
References
1. Siegel R, Ma J, Zou Z, Jemal A. Cancer statistics, 2014. CA Cancer J Clin. 2014;64(1):9–29. doi:10.3322/caac.21208
2. Siegel RL, Miller KD, Jemal A. Cancer statistics, 2017. CA Cancer J Clin. 2017;67(1):7–30. doi:10.3322/caac.21387
3. Cairns P. Renal cell carcinoma. Cancer Biomarkers. 2010;9(16):461–473. doi:10.3233/CBM-2011-0176
4. Motzer RJ, Escudier B, McDermott DF, et al. Nivolumab versus everolimus in advanced renal-cell carcinoma. N Engl J Med. 2015;373(19):1803–1813. doi:10.1056/NEJMoa1510665
5. Mekhail TM, Abou-Jawde RM, Boumerhi G, et al. Validation and extension of the memorial sloan-kettering prognostic factors model for survival in patients with previously untreated metastatic renal cell carcinoma. J clin oncol. 2005;23(4):832–841. doi:10.1200/JCO.2005.05.179
6. Rini BI, Campbell SC, Escudier B. Renal cell carcinoma. Lancet. 2009;373(9669):1119–1132. doi:10.1016/S0140-6736(09)60229-4
7. Dahinden C, Ingold B, Wild P, et al. Mining tissue microarray data to uncover combinations of biomarker expression patterns that improve intermediate staging and grading of clear cell renal cell cancer. Clin Cancer Res. 2010;16(1):88–98. doi:10.1158/1078-0432.CCR-09-0260
8. Gerlinger M, Horswell S, Larkin J, et al. Genomic architecture and evolution of clear cell renal cell carcinomas defined by multiregion sequencing. Nat Genet. 2014;46(3):225–233. doi:10.1038/ng.2891
9. Tavazoie S, Hughes JD, Campbell MJ, Cho RJ, Church GM. Systematic determination of genetic network architecture. Nat Genet. 1999;22(3):281–285. doi:10.1038/10343
10. Yip AM, Horvath S. Gene network interconnectedness and the generalized topological overlap measure. BMC Bioinformatics. 2007;8:22. doi:10.1186/1471-2105-8-22
11. Ravasz E, Somera AL, Mongru DA, Oltvai ZN, Barabasi AL. Hierarchical organization of modularity in metabolic networks. Science. 2002;297(5586):1551–1555. doi:10.1126/science.1073374
12. Albert R. Scale-free networks in cell biology. J Cell Sci. 2005;118(Pt 21):4947–4957. doi:10.1242/jcs.02714
13. Presson AP, Sobel EM, Papp JC, et al. Integrated weighted gene co-expression network analysis with an application to chronic fatigue syndrome. BMC Syst Biol. 2008;2:95. doi:10.1186/1752-0509-2-95
14. Powell PK, Wolf I, Jin R, Lasker JM. Metabolism of arachidonic acid to 20-hydroxy-5,8,11, 14-eicosatetraenoic acid by P450 enzymes in human liver: involvement of CYP4F2 and CYP4A11. J Pharmacol Exp Ther. 1998;285(3):1327–1336.
15. Bournazou I, Mackenzie KJ, Duffin R, Rossi AG, Gregory CD. Inhibition of eosinophil migration by lactoferrin. Immunol Cell Biol. 2010;88(2):220–223. doi:10.1038/icb.2009.86
16. Conti A, Fredolini C, Tamburro D, et al. Identification of novel candidate circulating biomarkers for malignant soft tissue sarcomas: correlation with metastatic progression. Proteomics. 2016;16(4):689–697. doi:10.1002/pmic.201500164
17. Zhang J, Ling T, Wu H, Wang K. Re-expression of Lactotransferrin, a candidate tumor suppressor inactivated by promoter hypermethylation, impairs the malignance of oral squamous cell carcinoma cells. J Oral Pathol Med. 2015;44(8):578–584. doi:10.1111/jop.12279
18. Deng M, Ye Q, Qin Z, et al. miR-214 promotes tumorigenesis by targeting lactotransferrin in nasopharyngeal carcinoma. Tumour Biol. 2013;34(3):1793–1800. doi:10.1007/s13277-013-0718-y
19. Deng M, Zhang W, Tang H, et al. Lactotransferrin acts as a tumor suppressor in nasopharyngeal carcinoma by repressing AKT through multiple mechanisms. Oncogene. 2013;32(36):4273–4283. doi:10.1038/onc.2012.434
20. Vecchi M, Confalonieri S, Nuciforo P, et al. Breast cancer metastases are molecularly distinct from their primary tumors. Oncogene. 2008;27(15):2148–2158. doi:10.1038/sj.onc.1210858
21. Ye Q, Zheng Y, Fan S, et al. Lactoferrin deficiency promotes colitis-associated colorectal dysplasia in mice. PLoS One. 2014;9(7):e103298. doi:10.1371/journal.pone.0103298
22. Loughlin KR, Gittes RF, Partridge D, Stelos P. The relationship of lactoferrin to the anemia of renal cell carcinoma. Cancer. 1987;59(3):566–571. doi:10.1002/1097-0142(19870201)59:3<566::AID-CNCR2820590335>3.0.CO;2-W
23. Giuffre G, Barresi V, Skliros C, Barresi G, Tuccari G. Immunoexpression of lactoferrin in human sporadic renal cell carcinomas. Oncol Rep. 2007;17(5):1021–1026.
24. Zhang W, Fan S, Zou G, et al. Lactotransferrin could be a novel independent molecular prognosticator of nasopharyngeal carcinoma. Tumour Biol. 2015;36(2):675–683. doi:10.1007/s13277-014-2650-1
25. Zhou Y, Zeng Z, Zhang W, et al. Lactotransferrin: a candidate tumor suppressor-deficient expression in human nasopharyngeal carcinoma and inhibition of NPC cell proliferation by modulating the mitogen-activated protein kinase pathway. Int j cancer. 2008;123(9):2065–2072. doi:10.1002/ijc.23727
 © 2020 The Author(s). This work is published and licensed by Dove Medical Press Limited. The full terms of this license are available at https://www.dovepress.com/terms.php and incorporate the Creative Commons Attribution - Non Commercial (unported, v3.0) License.
By accessing the work you hereby accept the Terms. Non-commercial uses of the work are permitted without any further permission from Dove Medical Press Limited, provided the work is properly attributed. For permission for commercial use of this work, please see paragraphs 4.2 and 5 of our Terms.
© 2020 The Author(s). This work is published and licensed by Dove Medical Press Limited. The full terms of this license are available at https://www.dovepress.com/terms.php and incorporate the Creative Commons Attribution - Non Commercial (unported, v3.0) License.
By accessing the work you hereby accept the Terms. Non-commercial uses of the work are permitted without any further permission from Dove Medical Press Limited, provided the work is properly attributed. For permission for commercial use of this work, please see paragraphs 4.2 and 5 of our Terms.