")
Back to Journals » OncoTargets and Therapy » Volume 11
Co-expression network analysis identified CDH11 in association with progression and prognosis in gastric cancer
Authors Chen PF, Wang F, Nie JY, Feng JR, Liu J, Zhou R, Wang HL, Zhao Q
Received 6 June 2018
Accepted for publication 10 August 2018
Published 2 October 2018 Volume 2018:11 Pages 6425—6436
DOI https://doi.org/10.2147/OTT.S176511
Checked for plagiarism Yes
Review by Single anonymous peer review
Peer reviewer comments 3
Editor who approved publication: Prof. Dr. Takuya Aoki
Peng-Fei Chen,1–3,* Fan Wang,1,2,* Jia-Yan Nie,1,2,* Jue-Rong Feng,1,2 Jing Liu,1,2 Rui Zhou,1,2 Hong-Ling Wang,1,2 Qiu Zhao1,2
1Department of Gastroenterology, Zhongnan Hospital of Wuhan University, Wuhan, China; 2Hubei Clinical Center & Key Laboratory of Intestinal & Colorectal Diseases, Wuhan, China; 3Department of Gastroenterology, The Central Hospital of Enshi Autonomous Prefecture, Enshi, China
*These authors contributed equally to this work
Background and aims: Gastric cancer (GC) is one of the most common cancers worldwide, and its pathogenesis is related to a complex network of gene interactions. The aims of our study were to find hub genes associated with the progression and prognosis of GC and illustrate the underlying mechanisms.
Methods: Weighted gene co-expression network analysis (WGCNA) was conducted using the microarray dataset and clinical data of GC patients from Gene Expression Omnibus (GEO) database to identify significant gene modules and hub genes associated with TNM stage in GC. Functional enrichment analysis and protein–protein interaction network analysis were performed using the significant module genes. We regarded the common hub genes in the co-expression network and protein–protein interaction (PPI) network as “real” hub genes for further analysis. Hub gene was validated in another independent dataset and The Cancer Genome Atlas (TCGA) dataset.
Results: In the significant purple module (R2=0.35), a total of 12 network hub genes were identified, among which six were also hub nodes in the PPI network of the module genes. Functional annotation revealed that the genes in the purple module focused on the biological processes of system development, biological adhesion, extracellular structure organization and metabolic process. In terms of validation, CDH11 had a higher correlation with the TNM stage than other hub genes and was strongly correlated with biological adhesion based on GO functional enrichment analysis. Data obtained from the Gene Expression Profiling Interactive Analysis (GEPIA) showed that CDH11 expression had a strong positive correlation with GC stages (P<0.0001). In the testing set and Oncomine dataset, CDH11 was highly expressed in GC tissues (P<0.0001). Survival analysis indicated that samples with a high CDH11 expression showed a poor prognosis. Cox regression analysis demonstrated an independent predictor of CDH11 expression in GC prognosis (HR=1.482, 95% CI: 1.015–2.164). Furthermore, gene set enrichment analysis (GSEA) demonstrated that multiple tumor-related pathways, especially focal adhesion, were enriched in CDH11 highly expressed samples.
Conclusion: CDH11 was identified and validated in association with progression and prognosis in GC, probably by regulating biological adhesion and focal adhesion-related pathways.
Keywords: gastric cancer, weighted gene co-expression network, hub gene, prognosis
Introduction
Gastric cancer (GC) is the fourth most common cancer and the second leading cause of cancer death worldwide, with an estimated 950,000 cases and 720,000 deaths per year.1 Multiple factors contribute to the pathogenesis of GC, such as smoking, diet, family history and infection of Helicobacter pylori.2 Despite great improvements in chemo, radio and surgical treatments, the 5-year overall survival rate remains poor.3 Approximately 60% of GC patients are in an advanced stage and metastasis at initial diagnosis, resulting in a poor prognosis.4 Moreover, several genes are identified in association with the development and progression of GC, but the mechanism remains unclear.5
In recent years, with the development of high-throughput gene-detecting technology, many studies adopted microarrays to identify genes associated with GC progression.6,7 However, most studies ignored the high interconnection between genes are probably correlated in function although genes have similar expression patterns and only focused on the screening of differentially expressed genes.8 Identification of GC prognostic biomarkers might be clinically important. A systems biology algorithm of weighted gene co-expression network analysis (WGCNA) has been used to evaluate the association between genes sets and clinical traits by constructing a scale-free gene co-expression network.9–11 Thus, we applied the WGCNA algorithm to identify network-centric genes associated with the progression and prognosis of GC.
Materials and methods
Data collection
Microarray datasets were downloaded from the Gene Expression Omnibus (GEO) database (http://www.ncbi.nlm.nih.gov/geo/) and performed on Affymetrix Human Genome U133 Plus 2.0 Array platform (GPL570). Dataset GSE3494212 was used as a training set to construct co-expression networks and identify hub genes in this study. This dataset included 56 samples of primary GC with different Lauren type and TNM stages. Two samples with no clinical data (GSM858086 and GSM858122) were removed from the subsequent analyses. Another dataset of GSE1391113 was used as a testing set to verify our results. This dataset included 31 adjacent normal tissues and 38 GC tissues. Meanwhile, RNA-sequencing data of 367 GC samples and relevant clinical data were downloaded from database of The Cancer Genome Atlas (TCGA) (http://genome–cancer.ucsc.edu/) to further validate our results. The detailed clinical data of training set and testing set are shown in Table S1.
Data preprocessing
Raw microarray data were calculated by robust multiarray average (RMA) background correction and log2 transformed and normalized by quantile normalization. Then, median-polish probesets was used in the “affy” R package to summarize. At last, we annotated probes by the Affymetrix annotation files. Microarray quality was evaluated by sample clustering association with Pearson’s correlation matrices between different samples. Then, we chose a height of 0.2 as the cutoff criteria to identify potential microarray outliers. We filtered probes by their variances, and probes with variances ranked in top 10,000 were used for WGCNA.14
Co-expression network construction
WGCNA package in R was used to construct co-expression network for the filtered genes in GSE34942.8,15 First, Pearson’s correlation matrices were calculated between pairwise genes. Then, a weighted adjacency matrix was performed by a power function am=|cmn|® (cmn=Pearson’s correlation between gene m and gene n; amn=adjacency between gene m and gene n). The soft threshold power β could emphasize penalize weak correlations and strong correlations between genes.16,17 Next, the adjacencies were transformed into topological overlap matrix (TOM).18 Then, in order to classify genes with similar expression profiles into modules, average linkage hierarchical clustering was performed by the TOM-based dissimilarity with a minimum module size of 30 for the genes dendrogram.11 At last, the dissimilarity of module eigengenes (MES) was calculated for module dendrogram and some modules were merged.
Identification of clinical significant modules and functional annotation
Two approaches were applied to identify association of modules with clinical traits. Gene significance (GS) was defined as correlation between the genes and clinical data, and the average GS for all the genes in a module was defined as module significance (MS). Additionally, the major component analysis for each gene module was defined as MES and the expression patterns of genes could be generalized into a single characteristic expression profile within a given module. After calculating the association with GS and MES, the module with the mostly absolute MS among all the selected modules was defined as the one related to clinical trait. To further analyze the potential function of module genes, DAVID (http://david.abcc.ncifcrf.gov/) database was used along with gene GO functional enrichment analysis. False discovery rate (FDR) <0.01 was set as the cutoff criteria.
Identification of hub genes
Hub genes comprise highly interconnected nodes within a module and have been shown to be functionally significant.19 In this study, we chose a significant module, and hub genes were considered with highly module membership (MM) measured by Pearson’s correlation (correlation. weighted >0.8)20,21 Also, hub genes in the module showed the highest correlation with the clinical trait. Furthermore, the significant module was constructed using the protein–protein interaction (PPI) network with a combined score of ≥0.4, which was regarded as a positive interaction between genes based on the STRING database (http://www.string-db.org/).22 A connectivity degree of ≥10 was also defined as a hub gene. We regarded the common hub genes in the co-expression network and PPI network as “real” hub genes for further analysis.
Hub gene validation
Gene Expression Profiling Interactive Analysis (GEPIA) database (http://gepia.cancer-pku.cn) was used to validate the correlation between the expression levels of hub genes and the stages. We also used the testing set of GSE13911 and Oncomine database (http://www.oncomine.org) to check the expression values of the hub gene in normal gastric tissues and GC tissues. Then, the Human Protein Atlas (http://www.proteinatlas.org) was used for immunohistochemistry validation. In addition, Kaplan–Meier plotter (http://www.kmplot.com) was used to estimate the prognosis including 1,065 GC patients. The GC patients were divided into two groups according to the expression of a particular gene (high vs low expression). The testing set of RNA-sequencing data including 367 GC samples was also applied for survival analyses. The survival curve was generated by log-rank estimator, and the association between hub gene and survival was calculated using the Cox proportional hazards regression model. Difference with statistical significance was defined as P<0.05.
Gene set enrichment analysis (GSEA)
In all, 367 GC samples from RNA-sequencing data were divided into two groups according to the median values of the expression of hub genes (high vs low expression). GSEA was performed using the two groups to identify potential function of the hub gene23 and chose the annotated gene sets of c2.cp.kegg.v5.2.symbols.gmt as the reference gene sets. Differences at nominal P<0.05, FDR <0.05 and enrichment score (ES) >0.6 were defined as the cutoff criteria.
Results
Data preprocessing
After data preprocessing, the 54 GC samples in the training set GSE34942 were obtained. According to the outlier detection, no samples were removed in the training set (Figure S1). Under the threshold of variance, we selected probes with the variances ranked in top 10,000 for subsequent analysis.
Weighted co-expression network construction and identification of key modules
In all, 54 GC samples with complete clinical data were used for co-expression analysis. We used WGCNA package on R to put probes with variances ranked in top 10,000 into modules by average linkage clustering (Figure 1A). In this study, we selected the power of β=9 (scale-free R2=0.89) as the soft thresholding to ensure a scale-free network (Figure 1B and C). A total of 11 modules were identified (Figure 2A). The relevance between module and clinical traits was tested using two methods. First, we found the highest MES between the purple module and TNM stage (Figure 2B). Afterward, the purple module also had the highest MS in relation to the TNM stage (Figure 2C). Thus, we identified that the purple module was the most relevant to the TNM stage in the training set.
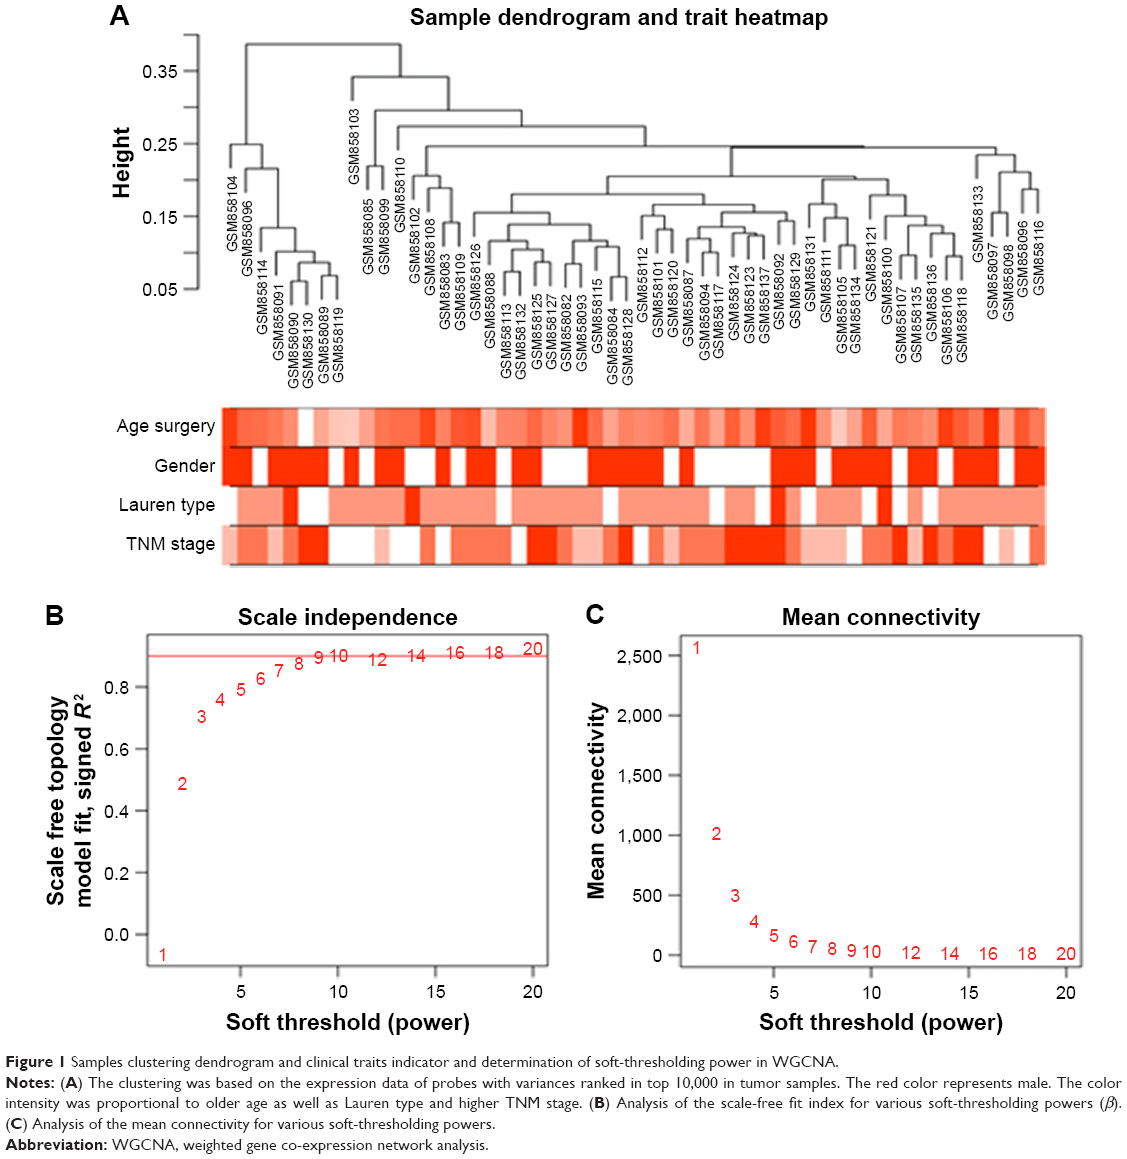 | Figure 1 Samples clustering dendrogram and clinical traits indicator and determination of soft-thresholding power in WGCNA. |
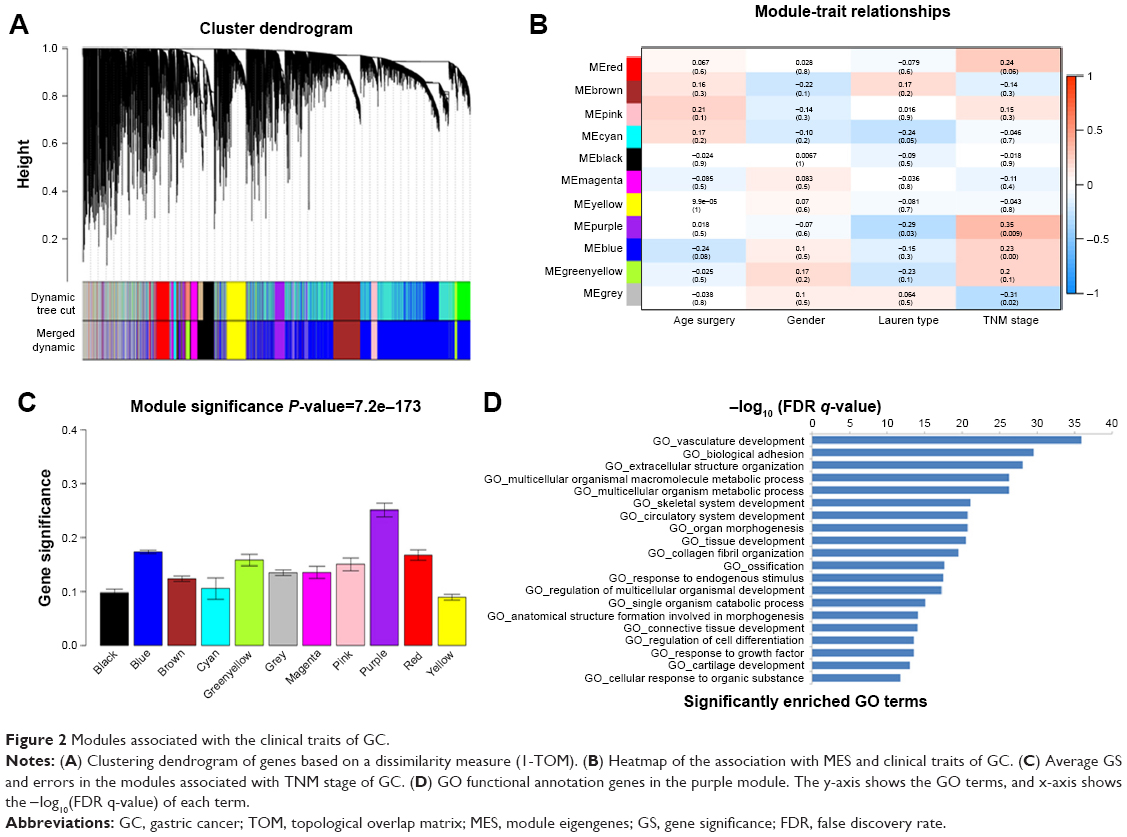 | Figure 2 Modules associated with the clinical traits of GC. |
To get a primary understanding of the biological relevance of purple module, 185 genes of purple module were enriched by using DAVID database for GO functional enrichment analysis. Top 20 biological processes enriched in GO terms (Figure 2D). The genes in the purple module mainly enriched in “vasculature development”, “biological adhesion”, “extracellular structure organization”, “multicellular organismal macromolecule metabolic process”, “multicellular organism metabolic process” and “skeletal system development”.
Identification of hub genes for TNM stage in the purple module
Highly interconnected hub genes within a module have been shown to have important roles in the biological processes.24 Therefore, 12 genes associated with the high connectivity in the purple module (correlate.weighted >0.8) were identified as hub genes (Table 1). Based on the STRING database, a PPI network for all genes in the purple module was constructed using Cytoscape (Figure S2). We identified genes with a connectivity degree of ≥10 as hub genes in the PPI network. Finally, CDH11, MMP2, LUM, FNB1, VCAN and COL8A1 in both co-expression network and PPI network were defined as “real” hub genes (Table 1).
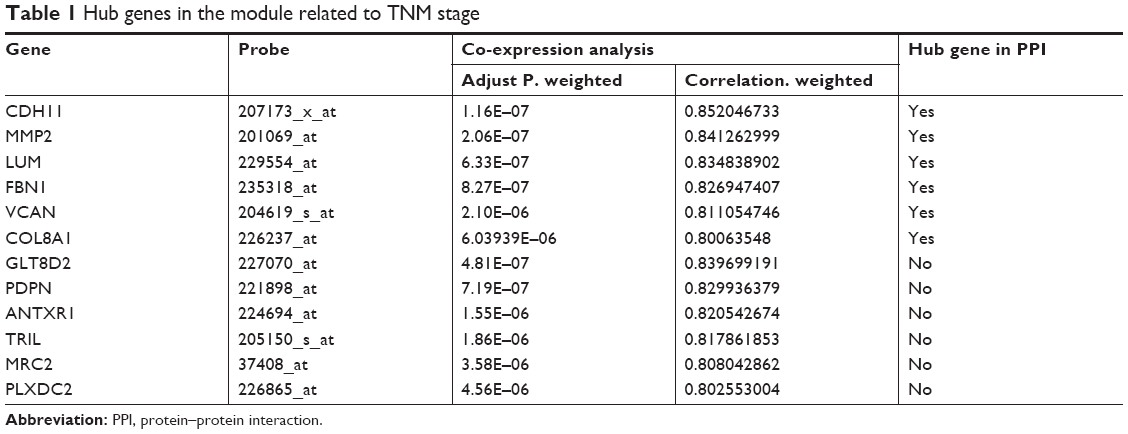 | Table 1 Hub genes in the module related to TNM stage |
Hub gene validation
In the training set, GSE34942 was used for linear regression analyses to validate hub genes. CDH11 was found to have a higher correlation with the TNM stage (R2=0.852) and was strongly correlated with biological adhesion based on GO functional enrichment analysis. Furthermore, expression of CDH11 in the diffuse-type GC was higher than that in the intestinal-type GC (Figure 3C). Thus, CDH11 was taken as the candidate gene for further validation. Based on the GEPIA dataset, we validated that CDH11 expression had a strong positive correlation with GC stages (P<0.0001; Figure 3A). In the testing set GSE13911 and Oncomine dataset, CDH11 was more highly expressed in GC tissues than in normal tissues (P<0.0001; Figure 3B and D). Then, immunohistochemistry staining validated from the Human Protein Atlas database revealed that CDH11 protein was significantly higher in GC tissues compared with normal gastric tissues (Figure 3E). As the tumor progression always affected the tumor prognosis, we performed a further validation of CDH11. Based on the testing set of RNA-sequencing data, a higher expression of CDH11 in GC patients showed a significantly poorer overall survival time (HR: 1.448, 95% CI: 1.009–2.007, P=0.042; Figure 3F). More convincingly, Cox proportional hazards regression model performed using the RNA-sequencing data demonstrated that CDH11 expression was an independent predictor for overall survival time of GC (HR=1.482, 95% CI: 1.015–2.164, P=0.045; Table 2). In addition, survival analysis was conducted using the Kaplan–Meier plotter online tool, and a higher expression of CDH11 in GC patients also showed a poorer prognosis (Figure 3G).
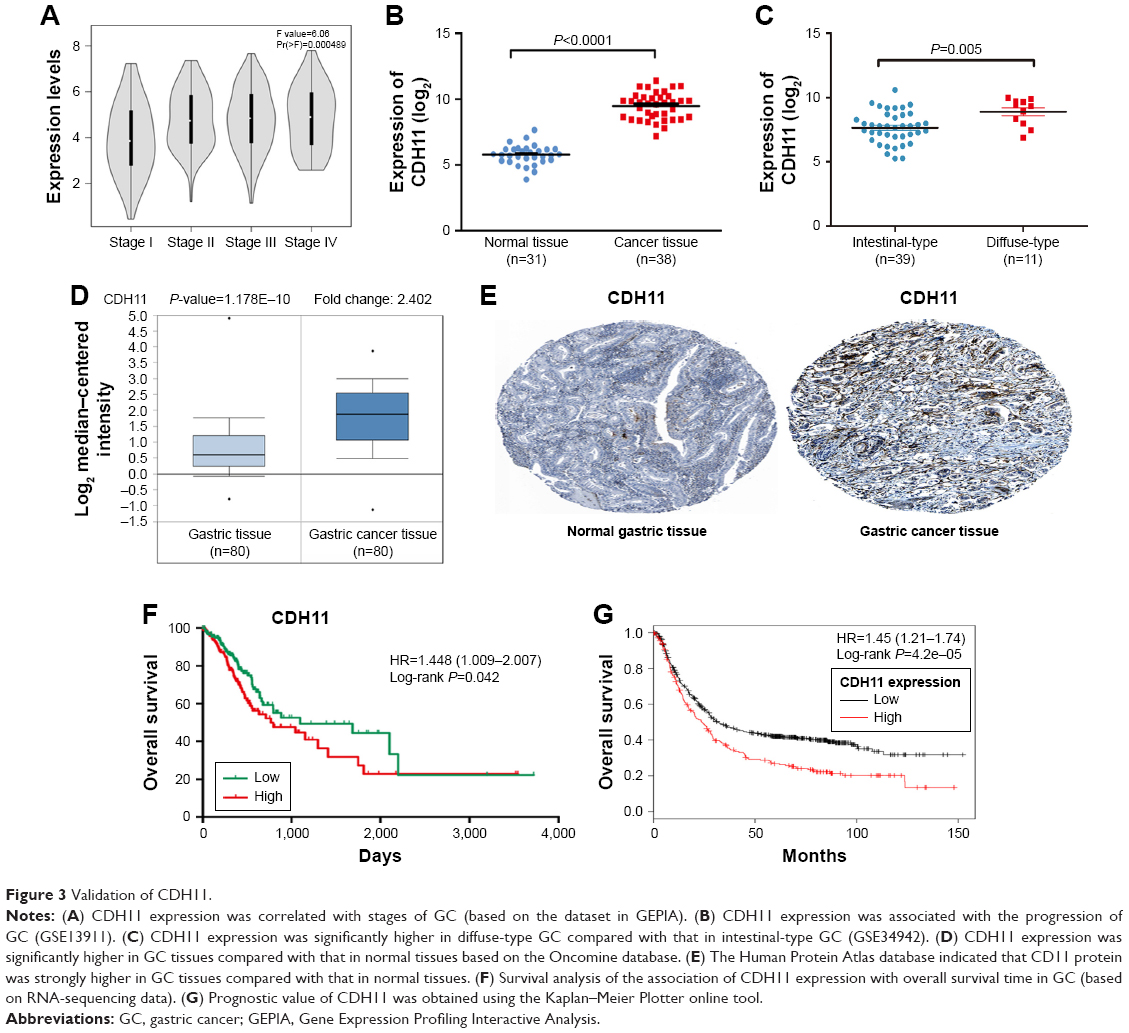 | Figure 3 Validation of CDH11. |
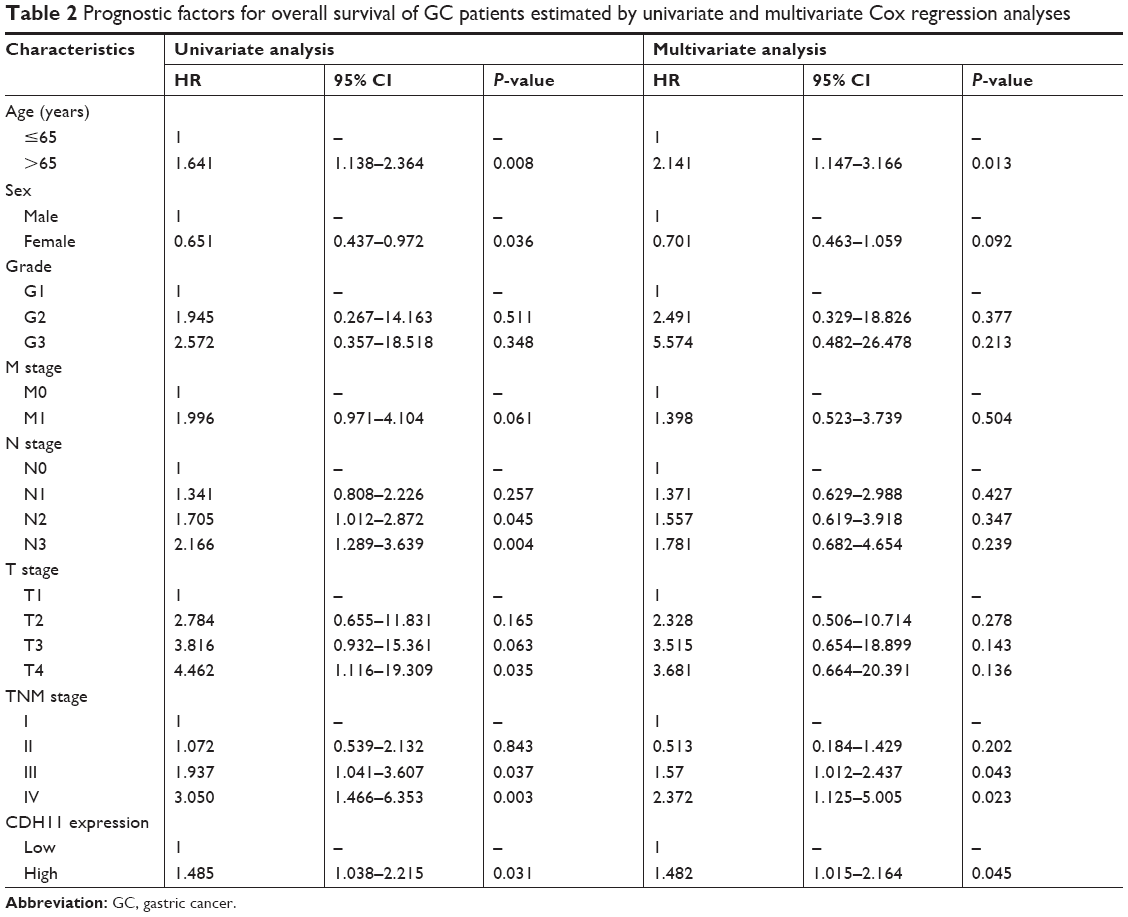 | Table 2 Prognostic factors for overall survival of GC patients estimated by univariate and multivariate Cox regression analyses |
Gene set enrichment analysis
To characterize the potential mechanisms of CDH11 in association with GC, GSEA was applied to obtain biological process enriched in CDH11 with highly expressed samples. Then, 20 functional gene sets were enriched, and six representative pathways were “regulation of actin cytoskeleton”, “focal adhesion”, “pathways in cancer”, “TGF-β signaling pathway”, “ECM receptor interaction” and “MAPK signaling pathway” (Figure 4 and Table S2).
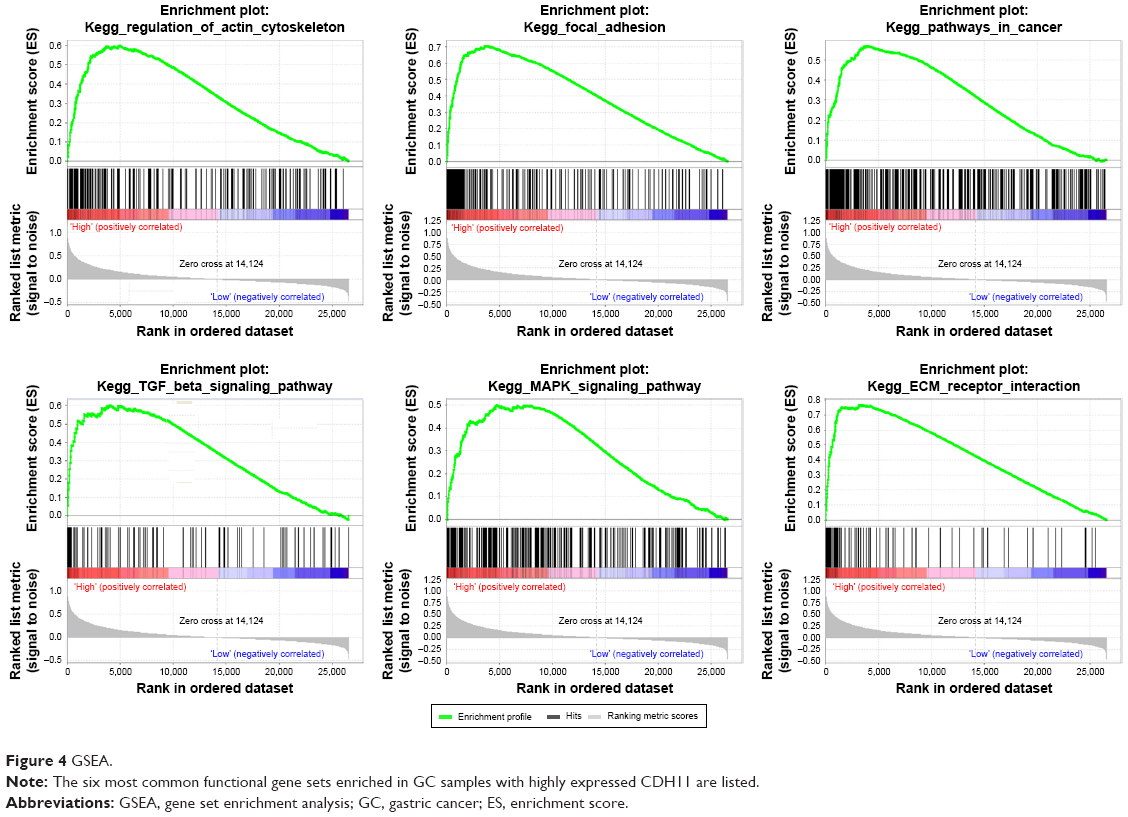 | Figure 4 GSEA. |
Discussion
CDH11 (also known as OB cadherin) is a member of the cadherin superfamily, a group of transmembrane proteins that principally mediated homophilic cell-to-cell adhesion.25,26 Mature cadherin proteins are composed of a large N-terminal extracellular domain, a single membrane-spanning domain and a small highly conserved C-terminal cytoplasmic domain.27 In addition, Kalluri and Weinberg28 reported that cell adhesion molecules were associated with epithelial to mesenchymal transition (EMT), which suggests that CDH11 plays a critical role in cancer progression. Furthermore, CDH11 expression was linked with many pathologic processes, such as inflammation and fibrosis, which played an important role in the progression from chronic inflammation to cancer.23,29 In addition, CDH11 has been implicated in prostate, breast and colorectal cancer metastases.30–32
In this study, we identified and validated gene co-expression modules related to the progression of GC by WGCNA. In all, 12 hub genes were identified that were significantly correlated with the TNM stage of GC patients. The GO functional annotation of module genes that were enriched in system development, biological adhesion, extracellular structure organization and metabolic process. CDH11 was mostly highly correlated with TNM stage and strongly correlated with biological adhesion, and expression of CDH11 in diffuse-type GC was higher than that in intestinal-type GC. Qiu et al33 found that patients with diffuse-type GC progress faster and have 5-year survival rate poorer than those with intestinal-type GC. Thus, we speculated that CDH11 might affect the TNM stage and prognosis of GC patients.
However, very few studies have identified the role of CDH11 in GC.34 In our study, CDH11 was positively correlated with GC stages based on the GEPIA dataset. Additionally, in the testing set GSE13911 and Oncomine dataset, we also found a significantly overexpression of CDH11 in GC tissues. We also used the Human Protein Atlas database to find that the CDH11 protein was significantly higher in GC tissues. Several investigators demonstrated that CD11 was a mesenchymal cadherin in association with more undifferentiated and aggressive cancers, such as pancreatic cancer, prostate cancer, breast cancer and colorectal cancer.27–30 As a result, the overexpression of CDH11 might be related to malignant nature of GC. As we know, TNM staging system has been used for prognostic prediction. Thus, genes related to TNM stage were supposed to be associated with the prognosis. Moreover, the prognostic value of CDH11 had been identified in prostate cancer, breast cancer, colorectal cancer, glioblastoma and osteosarcoma.28–30,35,36 However, no evidence revealing the role of overexpression of CDH11 related to the prognosis of GC. In our study, we performed survival analysis to validate the role of CDH11 in GC prognosis, and the highly expressed CDH11 was related to a shorter overall survival time. Furthermore, Cox regression analysis was performed on the RNA-sequencing data and demonstrated that CDH11 expression was an independent predictor for the prognosis of GC. Thus, the expression of CDH11 might be positively correlated with the progression and prognosis in GC.
As for the functional annotation, CDH11 was strongly correlated with biological adhesion, and we conducted GSEA analysis to reveal that CDH11 with highly expressed samples was enriched in regulation of focal adhesion, which was closely related to cancer development.37,38 Focal adhesion consists of cell-extracellular components, actin cytoskeleton and integrin.39 It was reported that focal adhesion was significantly associated with multiple biological processes, such as cell proliferation, cell differentiation and cell survival.40 Tomkiewicz et al41 reported a novel cell-migratory program that the AhR through the activation of Src activates FAK and promotes integrin clustering and the activation of the AhR increases the interaction of FAK with the metastatic marker, HEF1/NEDD9/CAS-L and the expression of several integrins. McAndrews et al42 elucidated that CDH11 promoted breast, ovarian and prostate cancer cell growth, survival and invasion by targeting cell adhesion molecules and blockade of CDH11 on stromal cells inhibited adhesion. According to our results, we could speculate that the overexpressed CDH11 might lead to cancer cell growth, migration and invasion of GC by regulating focal adhesion pathway. In addition, the expression of CDH11 may be positively associated with the degree of malignancy and prognosis of GC.
Some limitations of our study should be mentioned. First, this was a retrospective design study rather than a prospective cohort study. In addition, a large number of samples are required to validate our finding.
Conclusion
Our study adopted systems biology-based WGCNA method to identify and validate network hub genes in association with the GC clinical traits. Finally, CDH11 was identified and validated in association with progression and prognosis in GC, probably, by regulating biological adhesion and focal adhesion-related pathways.
Acknowledgment
This study was supported by the Natural Science Foundation of Hubei Province (Q.Z., No. 2016CFA101).
Disclosure
The authors report no conflicts of interest in this work.
References
van Cutsem E, Sagaert X, Topal B, Haustermans K, Prenen H. Gastric cancer. Lancet. 2016;388(10060):2654–2664. | ||
Sjödahl K, Lu Y, Nilsen TI, et al. Smoking and alcohol drinking in relation to risk of gastric cancer: a population-based, prospective cohort study. Int J Cancer. 2007;120(1):128–132. | ||
Peng PL, Zhou XY, Yi GD, Chen PF, Wang F, Dong WG. Identification of a novel gene pairs signature in the prognosis of gastric cancer. Cancer Med. 2018;7(2):344–350. | ||
Seyfried F, von Rahden BH, Miras AD, et al. Incidence, time course and independent risk factors for metachronous peritoneal carcinomatosis of gastric origin – a longitudinal experience from a prospectively collected database of 1108 patients. BMC Cancer. 2015;15:73. | ||
Bass AJ. Cancer Genome Atlas Research Network. Comprehensive molecular characterization of gastric adenocarcinoma. Nature. 2014;513(7517):202–209. | ||
Myllykangas S, Junnila S, Kokkola A, et al. Integrated gene copy number and expression microarray analysis of gastric cancer highlights potential target genes. Int J Cancer. 2008;123(4):817–825. | ||
Lee HJ, Nam KT, Park HS, et al. Gene expression profiling of metaplastic lineages identifies CDH17 as a prognostic marker in early stage gastric cancer. Gastroenterology. 2010;139(1):213–225. | ||
Tavazoie S, Hughes JD, Campbell MJ, Cho RJ, Church GM. Systematic determination of genetic network architecture. Nat Genet. 1999;22(3):281–285. | ||
Langfelder P, Horvath S. WGCNA: an R package for weighted correlation network analysis. BMC Bioinformatics. 2008;9:559. | ||
Wang F, Chang Y, Li J, Wang H, et al. Strong correlation between ASPM gene expression and HCV cirrhosis progression identified by co-expression analysis. Dig Liver Dis. 2017;49(1):70–76. | ||
Zhou Z, Liu S, Zhang M, et al. Overexpression of Topoisomerase 2-Alpha Confers a Poor Prognosis in Pancreatic Adenocarcinoma Identified by Co-Expression Analysis. Dig Dis Sci. 2017;62(10):2790–2800. | ||
Lei Z, Tan IB, das K, et al. Identification of molecular subtypes of gastric cancer with different responses to PI3-kinase inhibitors and 5-fluorouracil. Gastroenterology. 2013;145(3):554–565. | ||
D’Errico M, de Rinaldis E, Blasi MF, et al. Genome-wide expression profile of sporadic gastric cancers with microsatellite instability. Eur J Cancer. 2009;45(3):461–469. | ||
Li S, Liu X, Liu T, et al. Identification of Biomarkers Correlated with the TNM Staging and Overall Survival of Patients with Bladder Cancer. Front Physiol. 2017;8:947. | ||
Mason MJ, Fan G, Plath K, Zhou Q, Horvath S. Signed weighted gene co-expression network analysis of transcriptional regulation in murine embryonic stem cells. BMC Genomics. 2009;10:327. | ||
Zhang B, Horvath S. A General Framework for Weighted Gene Co-Expression Network Analysis. Stat Appl Genet Mol Biol. 2005;4(1):17. | ||
Chen P, Wang F, Feng J, et al. Co-expression network analysis identified six hub genes in association with metastasis risk and prognosis in hepatocellular carcinoma. Oncotarget. 2017;8(30):48948–48958. | ||
Yip AM, Horvath S. Gene network interconnectedness and the generalized topological overlap measure. BMC Bioinformatics. 2007;8:22. | ||
Albert R. Scale-free networks in cell biology. J Cell Sci. 2005;118(Pt 21):4947–4957. | ||
Horvath S, Dong J. Geometric interpretation of gene coexpression network analysis. PLoS Comput Biol. 2008;4(8):e1000117. | ||
Presson AP, Sobel EM, Papp JC, et al. Integrated weighted gene co-expression network analysis with an application to chronic fatigue syndrome. BMC Syst Biol. 2008;2:95. | ||
Franceschini A, Lin J, von Mering C, Jensen LJ. SVD-phy: improved prediction of protein functional associations through singular value decomposition of phylogenetic profiles. Bioinformatics. 2016;32(7):1085–1087. | ||
Croken MM, Qiu W, White MW, Kim K. Gene Set Enrichment Analysis (GSEA) of Toxoplasma gondii expression datasets links cell cycle progression and the bradyzoite developmental program. BMC Genomics. 2014;15:515. | ||
Liu Y, Zhu X, Zhu J, et al. Identification of differential expression of genes in hepatocellular carcinoma by suppression subtractive hybridization combined cDNA microarray. Oncol Rep. 2007;18(4):943–951. | ||
Lee DM, Kiener HP, Agarwal SK, et al. Cadherin-11 in synovial lining formation and pathology in arthritis. Science. 2007;315(5814):1006–1010. | ||
Wu M, Pedroza M, Lafyatis R, et al. Identification of cadherin 11 as a mediator of dermal fibrosis and possible role in systemic sclerosis. Arthritis Rheumatol. 2014;66(4):1010–1021. | ||
Takeichi M. Cadherins: a molecular family important in selective cell-cell adhesion. Annu Rev Biochem. 1990;59:237–252. | ||
Kalluri R, Weinberg RA. The basics of epithelial-mesenchymal transition. J Clin Invest. 2009;119(6):1420–1428. | ||
Birtolo C, Pham H, Morvaridi S, et al. Cadherin-11 Is a Cell Surface Marker Up-Regulated in Activated Pancreatic Stellate Cells and Is Involved in Pancreatic Cancer Cell Migration. Am J Pathol. 2017;187(1):146–155. | ||
Satcher RL, Pan T, Bilen MA, et al. Cadherin-11 endocytosis through binding to clathrin promotes cadherin-11-mediated migration in prostate cancer cells. J Cell Sci. 2015;128(24):4629–4641. | ||
Pohlodek K, Tan YY, Singer CF, Gschwantler-Kaulich D. Cadherin-11 expression is upregulated in invasive human breast cancer. Oncol Lett. 2016;12(6):4393–4398. | ||
Torres S, Bartolomé RA, Mendes M, et al. Proteome profiling of cancer-associated fibroblasts identifies novel proinflammatory signatures and prognostic markers for colorectal cancer. Clin Cancer Res. 2013;19(21):6006–6019. | ||
Qiu MZ, Cai MY, Zhang DS, et al. Clinicopathological characteristics and prognostic analysis of Lauren classification in gastric adenocarcinoma in China. J Transl Med. 2013;11:58. | ||
Sandoval-Bórquez A, Polakovicova I, Carrasco-Véliz N, et al. MicroRNA-335-5p is a potential suppressor of metastasis and invasion in gastric cancer. Clin Epigenetics. 2017;9:114. | ||
Kaur H, Phillips-Mason PJ, Burden-Gulley SM, et al. Cadherin-11, a marker of the mesenchymal phenotype, regulates glioblastoma cell migration and survival in vivo. Mol Cancer Res. 2012;10(3):293–304. | ||
Nakajima G, Patino-Garcia A, Bruheim S, et al. CDH11 expression is associated with survival in patients with osteosarcoma. Cancer Genomics Proteomics. 2008;5(1):37–42. | ||
Zacharopoulou N, Tsapara A, Kallergi G, et al. The epigenetic factor KDM2B regulates cell adhesion, small rho GTPases, actin cytoskeleton and migration in prostate cancer cells. Biochim Biophys Acta. 2018;1865(4):587–597. | ||
Gonçalves V, Pereira JFS, Jordan P. Signaling Pathways Driving Aberrant Splicing in Cancer Cells. Genes. 2017;9(1):pii: E9. | ||
Critchley DR. Focal adhesions – the cytoskeletal connection. Curr Opin Cell Biol. 2000;12(1):133–139. | ||
Burridge K. Focal adhesions: a personal perspective on a half century of progress. Febs J. 2017;284(20):3355–3361. | ||
Tomkiewicz C, Herry L, Bui LC, et al. The aryl hydrocarbon receptor regulates focal adhesion sites through a non-genomic FAK/Src pathway. Oncogene. 2013;32(14):1811–1820. | ||
McAndrews KM, Yi J, Mcgrail DJ, Dawson MR. Enhanced Adhesion of Stromal Cells to Invasive Cancer Cells Regulated by Cadherin 11. ACS Chem Biol. 2015;10(8):1932–1938. |
Supplementary materials
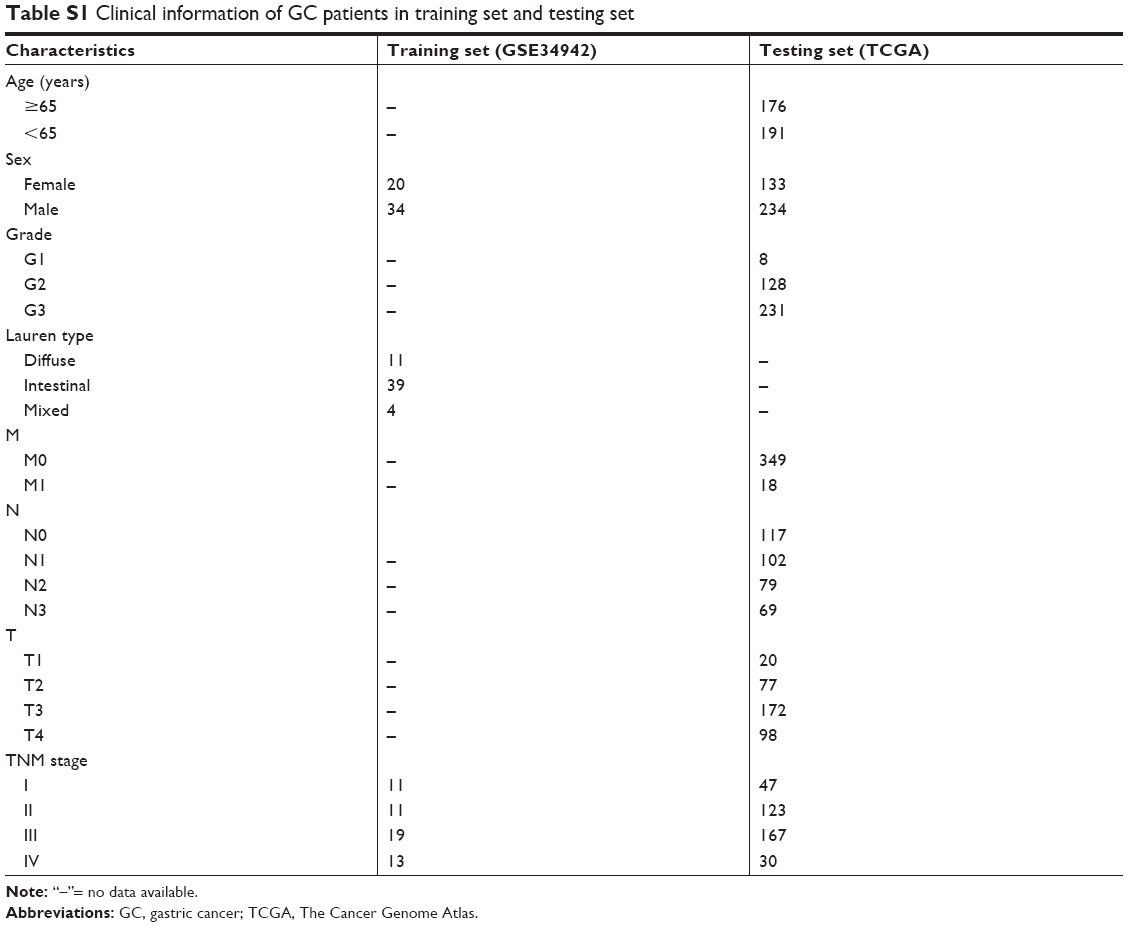 | Table S1 Clinical information of GC patients in training set and testing set |
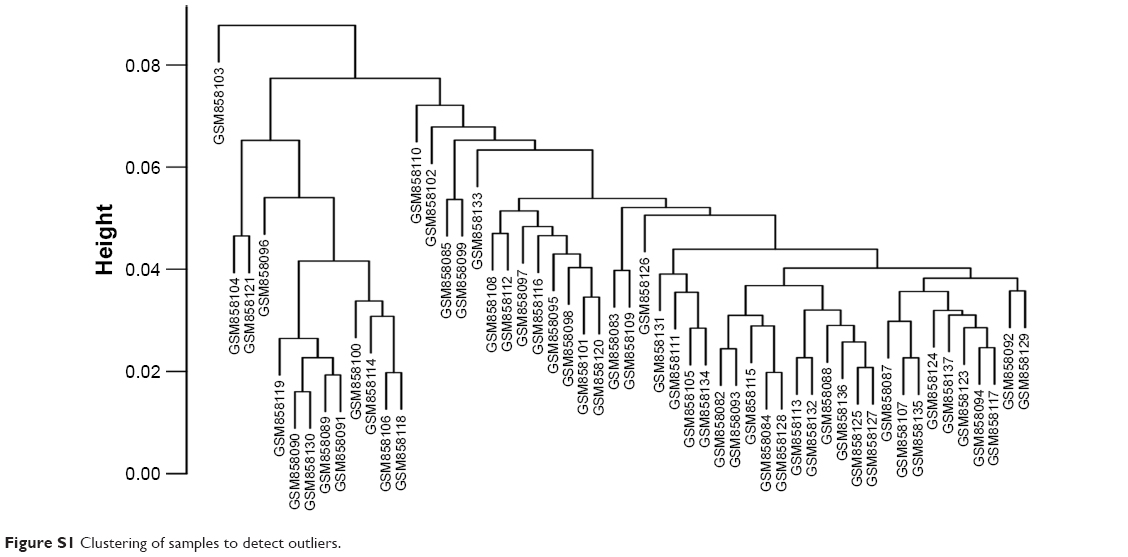 | Figure S1 Clustering of samples to detect outliers. |
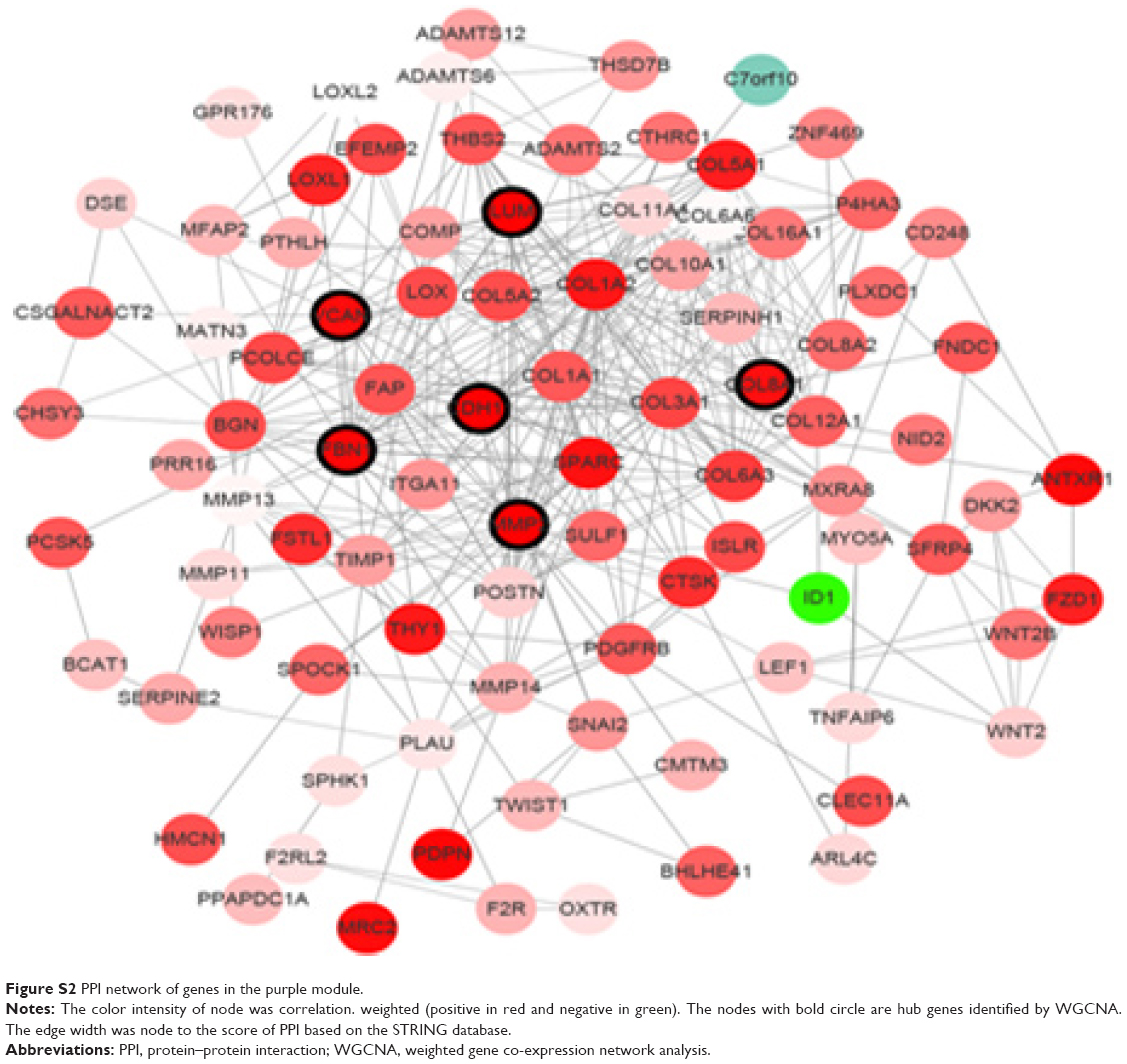 | Figure S2 PPI network of genes in the purple module. |
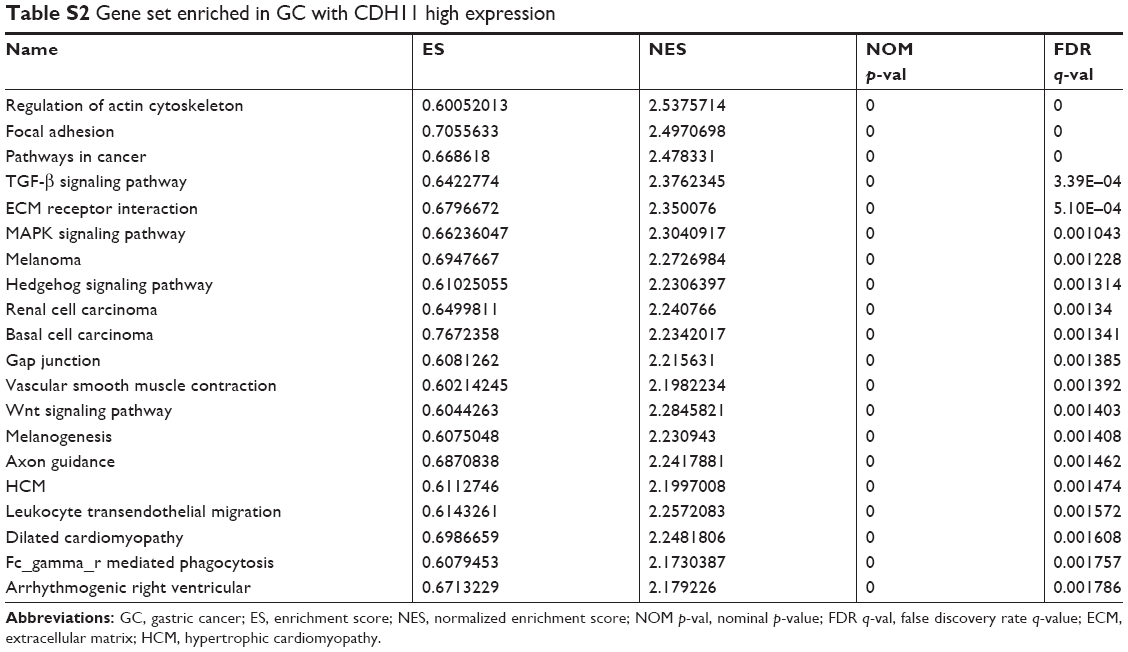 | Table S2 Gene set enriched in GC with CDH11 high expression |
 © 2018 The Author(s). This work is published and licensed by Dove Medical Press Limited. The full terms of this license are available at https://www.dovepress.com/terms.php and incorporate the Creative Commons Attribution - Non Commercial (unported, v3.0) License.
By accessing the work you hereby accept the Terms. Non-commercial uses of the work are permitted without any further permission from Dove Medical Press Limited, provided the work is properly attributed. For permission for commercial use of this work, please see paragraphs 4.2 and 5 of our Terms.
© 2018 The Author(s). This work is published and licensed by Dove Medical Press Limited. The full terms of this license are available at https://www.dovepress.com/terms.php and incorporate the Creative Commons Attribution - Non Commercial (unported, v3.0) License.
By accessing the work you hereby accept the Terms. Non-commercial uses of the work are permitted without any further permission from Dove Medical Press Limited, provided the work is properly attributed. For permission for commercial use of this work, please see paragraphs 4.2 and 5 of our Terms.