")
Back to Journals » Journal of Inflammation Research » Volume 14
Clock Gene Nr1d1 Alleviates Retinal Inflammation Through Repression of Hmga2 in Microglia
Authors Wang Z, Huang Y, Chu F, Ji S, Liao K, Cui Z, Chen J, Tang S
Received 28 June 2021
Accepted for publication 30 October 2021
Published 11 November 2021 Volume 2021:14 Pages 5901—5918
DOI https://doi.org/10.2147/JIR.S326091
Checked for plagiarism Yes
Review by Single anonymous peer review
Peer reviewer comments 4
Editor who approved publication: Professor Ning Quan
Zhijie Wang,1,2 Yinhua Huang,1,2 Feixue Chu,3 Shangli Ji,2 Kai Liao,1,2 Zekai Cui,2 Jiansu Chen,1,2,4,5 Shibo Tang1,2,6
1Aier School of Ophthalmology, Central South University, Changsha, People’s Republic of China; 2Aier Eye Institute, Aier Eye Hospital Group, Changsha, People’s Republic of China; 3Department of Ophthalmology, Hangzhou Xihu Zhijiang Eye Hospital, Hangzhou, People’s Republic of China; 4Key Laboratory for Regenerative Medicine, Jinan University, Guangzhou, People’s Republic of China; 5Institute of Ophthalmology, Jinan University, Guangzhou, People’s Republic of China; 6CAS Center for Excellence in Brain Science and Intelligence Technology, Chinese Academy of Sciences, Shanghai, People’s Republic of China
Correspondence: Shibo Tang; Jiansu Chen Email [email protected]; [email protected]
Purpose: Retinal inflammation is involved in the pathogenesis of several retinal diseases. As one of the core clock genes, Nr1d1 has been reported to suppress inflammation in many diseases. We investigated whether pharmacological activation of Nr1d1 can inhibit retinal inflammation and delineated the mechanisms of Nr1d1 in alleviating microglia activation.
Methods: Lipopolysaccharide (LPS) induced mice models were used to examine the effects of SR9009 (agonist of NR1D1) treatment on inflammatory phenotypes in vivo. Anti-inflammatory effects of Nr1d1 and associated mechanisms were investigated in the BV2 microglia cell line, and in primary retinal microglia in vitro.
Results: SR9009 treatment alleviated LPS-induced inflammatory cell infiltration, elevated cytokine levels and morphological changes of the microglia in mice models. In LPS-stimulated BV2 cells and primary retinal microglia, SR9009 suppressed cytokine expressions by inhibiting the NF-κB signaling pathway. Moreover, SR9009 treatment increased the levels of the M2 phenotype marker (CD206) and the proportions of ramified microglia. Suppression of Nr1d1 with siRNA reversed the inhibitory effects of SR9009 on cytokine production in BV2 cells. RNA-seq analysis showed that genes that were upregulated following Nr1d1 knockdown were enriched in inflammatory-associated biological processes. Subsequently, ChIP-seq of NR1D1 in BV2 was performed, and the results were integrated with RNA-seq results using the Binding and Expression Target Analysis (BETA) tool. Luciferase assays, electrophoretic mobility shift assay (EMSA), qPCR and Western blotting assays revealed that NR1D1 binds the promoter of Hmga2 to suppress its transcription. Notably, overexpressed Hmga2 in activated microglia could partly abolish the anti-inflammatory effects of Nr1d1.
Conclusion: The clock gene Nr1d1 protects against retinal inflammation and microglia activation in part by suppressing Hmga2 transcription.
Keywords: clock genes, Rev-erbα, Nr1d1, retinal inflammation, Hmga2
Introduction
Retinal inflammation is a prevalent pathological condition in several retinal diseases, including uveitis, age-related macular degeneration, and diabetic retinopathy.1,2 Prolonged retinal inflammation is associated with tissue damage and structural destruction, accompanied by angiogenesis and fibrosis, which consequently cause visual disability or blindness. Currently, corticosteroids are the main therapeutic options for retinal inflammation, however, their long-term use has been associated with systemic and ocular side effects such as glaucoma and cataracts.3,4 Thus, efficient and safe treatment approaches are urgently needed to manage retinal inflammation.
Microglia, the main immune cells of the retina, play an important role in immunological defenses of the retina. Microglia are highly sensitive, therefore, any alterations in retinal microenvironments as a result of extrinsic and intrinsic factors can lead to their activation.5 Activated microglia are a hallmark for various retinal disorders, particularly retinal inflammation-associated diseases.6–8 Therefore, inhibition of microglial activation may be a potential therapeutic strategy for alleviating the progression of retinal diseases.
The circadian clock is an endogenous rhythm of physiology and functions that adapts to surrounding environmental changes in the 24 h system. At the cellular level, the cell-autonomous circadian clock consists of transcription-translation feedback loops that are a family of clock genes.9 NR1D1 (also known as REV-ERBα), as a core circadian clock gene, suppresses the transcriptional activation of a broad spectrum of target genes by competitively binding ROR/ REV-ERBΑ-response elements (RORE).10 Nr1d1 mediate various cellular physiologies, such as metabolism, autophagy, cell proliferation, and inflammation.11–14
HMGA2, a member of high mobility group A family, is involved in many processes, such as regulation of gene expression, embryogenesis as well as differentiation, neoplastic transformation and apoptosis.15 Moreover, HMGA2 is a driver of inflammation in conditions such as acute liver injury, intracerebral hemorrhage and cardiac dysfunction.16–18 However, its role in retinal inflammation and whether Nr1d1 can regulate it should be investigated further.
Microglia contain an intrinsic circadian molecular clock with rhythmic expression patterns of clock genes, such as Per1, Per2, Bmal1, and Nr1d1.19,20 In addition, LPS-treated microglia exhibited rhythmic oscillations in inflammatory gene expressions.20 Nr1d1, as a core clock component, participates in microglial activation and neuroinflammation.21,22 However, the underlying mechanisms of Nr1d1 in inhibition of microglia activation and regulation of retinal inflammation have not been clearly established. In this study, we investigated the potential role of the core clock gene, Nr1d1, in regulation of retinal inflammation. We further investigated the underlying mechanisms of Nr1d1 in alleviating in vitro microglial activation.
Methods
Animal Studies
BALB/c mice (6–8 weeks of age) were purchased from Hunan SJA Laboratory Animal Co., Ltd. (Changsha, China). The mice had free access to food and water and were maintained under a 12 h light/12 h dark cycle with light on at 6:00 am and off at 6:00 pm. All animal experiments and procedures were reviewed and approved by the Animal Ethics Board of Aier Eye Hospital Group (AIER2020IRB08). Experimental procedures and animal care were conducted under the ARVO Statement for the Use of Animals in Ophthalmic and Vision Research.
Mice were randomized into three groups: Control, LPS, and SR9009+LPS groups. Mice in the SR9009+LPS group were pretreated with intraperitoneal injections of SR9009 (50 mg/kg; twice per day at ZT4 and ZT16) for 5 days while mice in the LPS group were injected with the vehicle (80% PBS, 15% cremophor EL, 5% DMSO). Retinal inflammation in mice was induced by administration of an anesthetizer (pentobarbital sodium), followed by a single intravitreal injection of 1 μL LPS (125 ng/μL) using a 30G syringe (Hamilton, Reno, Nevada) under a microscope. Negative control mice were intravitreally injected with 1 μL PBS (vehicle) following the same procedure. Apart from retinal inflammation, intravitreal LPS injection can also cause anterior uveitis. It is challenging to evaluate retinal inflammation via non-invasive methods. Therefore, successful creation of animal models was confirmed by the presence of iris hyperemia, exudates in the anterior chamber and hypopyon. Mice were sacrificed and their eyes were enucleated 24 h post-injection with LPS for further analysis.
Cell Culture and Treatment
Primary retinal microglial cultures were performed as previously described, with some modifications.23,24 Briefly, eyes from postnatal (8–10 days) C57BL/J mice were enucleated after mice had been sacrificed via decapitation. Retinas were microscopically separated and subjected to trypsin digestion for 15 min at 37°C. After filtration through 70 μm, cells were resuspended in F12/DMEM medium with 20% FBS, 1% penicillin-streptomycin, 10 ng/mL recombinant macrophage colony-stimulating factor (Novoprotein, Shanghai, China) and seeded into T75 culture flasks. After 14 days of culture, microglia were subjected to mild trypsinization (0.0625%) for 30 min at 37°C to remove macroglia.25 Then 0.25% trypsin was used to digest microglia for 10 min at 37°C. Microglial purity was determined by staining with IBA1, F4/80, and CD11b, the microglia-specific markers.23
The BV2 microglial cell line and the HEK293T cell line were purchased from the National Infrastructure of Cell Line Resource (China). Both cell lines were cultured in DMEM with 10% FBS and 1% penicillin-streptomycin in a humidified incubator at 37°C and 5% CO2 atmosphere. In assessment of cytokine levels, BV2 cells and the primary retinal microglia were pretreated with SR9009 at indicated concentrations or vehicle (0.1% DMSO) for 4 h and further stimulated by 100 ng/mL LPS. Cells or culture media were harvested at 30 min, 8 h, or 24 h after LPS stimulation for analyses.
The CCK8 Assay
BV2 cells were seeded into 96-well plates at a density of 5000 cells per well and treated for 24 h with different SR9009 concentrations. Then, 10 μL of the CCK8 reagent (MCE, USA) was added into each well and incubated for 2 h. Absorbance was measured at 450 nm using a microplate reader (Biotek, Winooski, VT, USA).
Immunofluorescence Staining
IBA1, CD11b, and F4/80 immunofluorescence staining were performed to determine the purity of primary retinal microglia while CD206 staining was used to evaluate M2 polarization of the microglia. Briefly, primary retinal microglia were fixed in 4% paraformaldehyde for 15 min, permeabilized with 1% TritonX-100 for 15 min, and blocked with 3% BSA for 30 min at room temperature. Cells were incubated in the presence of specific primary antibodies: anti-IBA1 (1:500, Wako 019-19741), anti-CD11b (1:100, DSHB), anti-F4/80 (1:200, eBioscience 11-4801-81), and anti-CD206 (1:50, RD Systems AF2535) at 4°C overnight. Cells were further incubated with secondary goat anti-rabbit Alexa Fluor 594 antibody (A-11012, Invitrogen, USA), donkey anti-rat Alexa Fluor 488 antibody (A48269, Invitrogen, USA), and donkey anti-goat FITC (ab6881, Abcam, USA) for 1 h at room temperature. Then, they were counterstained with DAPI for nuclei visualization. Alexa Fluor 488 conjugated Phalloidin (1:100, Cytoskeleton PHDG1) was used to demonstrate morphological changes in the microglia, according to the instruction manual.
For immunofluorescence staining of retinal tissues, retinal slices were stained with the NR1D1 antibody (1:200, Abcam ab174309), glial fibrillary acidic protein (GFAP) antibody (1:500, Invitrogen 13-0300), and glutamine synthetase (GS) antibody (1:200, Abcam ab64613) at 4°C overnight, followed by incubation with the secondary goat anti-rabbit Alexa Fluor 488 antibody (A-11008, Invitrogen, USA), goat anti-mouse Alexa Fluor 594 antibody (A-11005, Invitrogen, USA), and donkey anti-rat Alexa Fluor 488 antibody (A48269, Invitrogen, USA) for 1 h at room temperature. Immunofluorescence was imaged by an LSM800 confocal microscope (Zeiss, Germany) or fluorescence microscope (Olympus, Japan).
Immunostaining of Whole Mount Retina
Whole mount retina immunofluorescence was performed as described before.26 Briefly, enucleated eyes were fixed in 4% PFA for 2 h at room temperature. After dissection of the retina, 5% BSA+0.3% Triton X-100 were used for blocking for 2 h at room temperature. Then, retinal tissues were incubated in IBA1 antibody (1:500, Wako 019-19741) overnight at 4°C, followed by incubation with the secondary goat anti-rabbit Alexa Fluor 594 antibody (A-11012, Invitrogen, USA). After flat mounting, retinal immunofluorescence was imaged using an LSM800 confocal microscope (Zeiss, Germany).
Enzyme-Linked Immunosorbent Assay (ELISA) and Nitric Oxide (NO) Assay
Levels of IL-1B, IL-6, TNFA and CCL2 in supernatants from primary retinal microglia cultures were quantified using commercial ELISA kits (Absin, Shanghai, China & NEOBIOSCIENCE, China) according to manufacturer’s instructions. The NO concentrations in the culture media were determined using the Nitric Oxide Assay Kit (Beyotime, China), based on Griess reaction.
RNAi Interference
The BV2 cells were seeded in a 6-well plate at a density of 6 × 10⁵ cells/well and transfected with siRNA (RiboBio, Guangzhou, China) via Lipofectamine RNAiMAX (Invitrogen, Carlsbad, CA, USA) and Opti-MEM medium (Gibco, Gaithersburg, MD, USA). After 48 h of transfection, cells were harvested for either qPCR assay or RNA-seq analysis.
Histopathological Evaluation
Enucleated eyes stored in the Eye Fixation buffer (Servicebio company, Wuhan, China) for 24 h were embedded in paraffin, after which the 4 μm-thick paraffin-embedded sections were deparaffinized, rehydrated, and stained with hematoxylin and eosin (H&E). Sections were imaged using a light microscope (Olympus, Japan) or a slide scanner (Pannoramic 250/MIDI, 3D HISTECH Ltd, Hungary). The number of infiltrated immune cells were used to assess the severity of inflammation. To minimize bias, slides from center and paracenter of each eye were randomly selected for counting infiltrated cells. For the vitreous, all infiltrated immune cells in the vitreous were counted. For the ciliary body, one field around a ciliary body at a magnification of 10X was used for counting infiltrated immune cells.
Generation of Overexpression Cell Line with Lentivirus
According to standard molecular biology procedures, full-length mouse Hmga2 (NM_001347170.1) with a FLAG-tag at the N terminal was cloned into PCDH-CMV-MCS-EF1-RFP-T2A-Puro vector. And full-length mouse Nr1d1 (NM_145434.4) was cloned into PCDH-EF1-3xFlag-MCS-T2A-Puro vector. Lentivirus was produced in HEK293T cells through cotransfections of the transfer vector and 2 packaging plasmids (psPAX2 and pMD2.G) using a PEI 40K reagent (MaoKang Biotechnology, Shanghai, China). The medium with the virus was collected at 48 h post-transfection and filtered through a 0.45 μm sterile filter. The BV2 cells were infected with harvested recombinant lentiviruses and maintained in a fresh medium with 10 μM/mL polybrene for 24 h. Lentiviral-transduced BV2 cells were selected in 3 μg/mL puromycin for 2-weeks.
Real-Time Quantitative PCR (qRT-PCR)
Total RNA from cells or retina tissues were extracted using the TRIzol reagent (Invitrogen, Carlsbad, CA, USA) according to the manufacturer’s instructions. cDNA synthesis from total RNA was performed using the HiScript II Q Select RT SuperMix for qPCR (Vazyme, China). Real-time qPCR assays were performed using the ChamQ Universal SYBR qPCR Master Mix (Vazyme, China) on a Roche 96 system (Roche, USA). Expression levels of all genes were normalized to GAPDH via the 2−ΔΔCt method. Primer sequences used in this experiment are shown in Table 1.
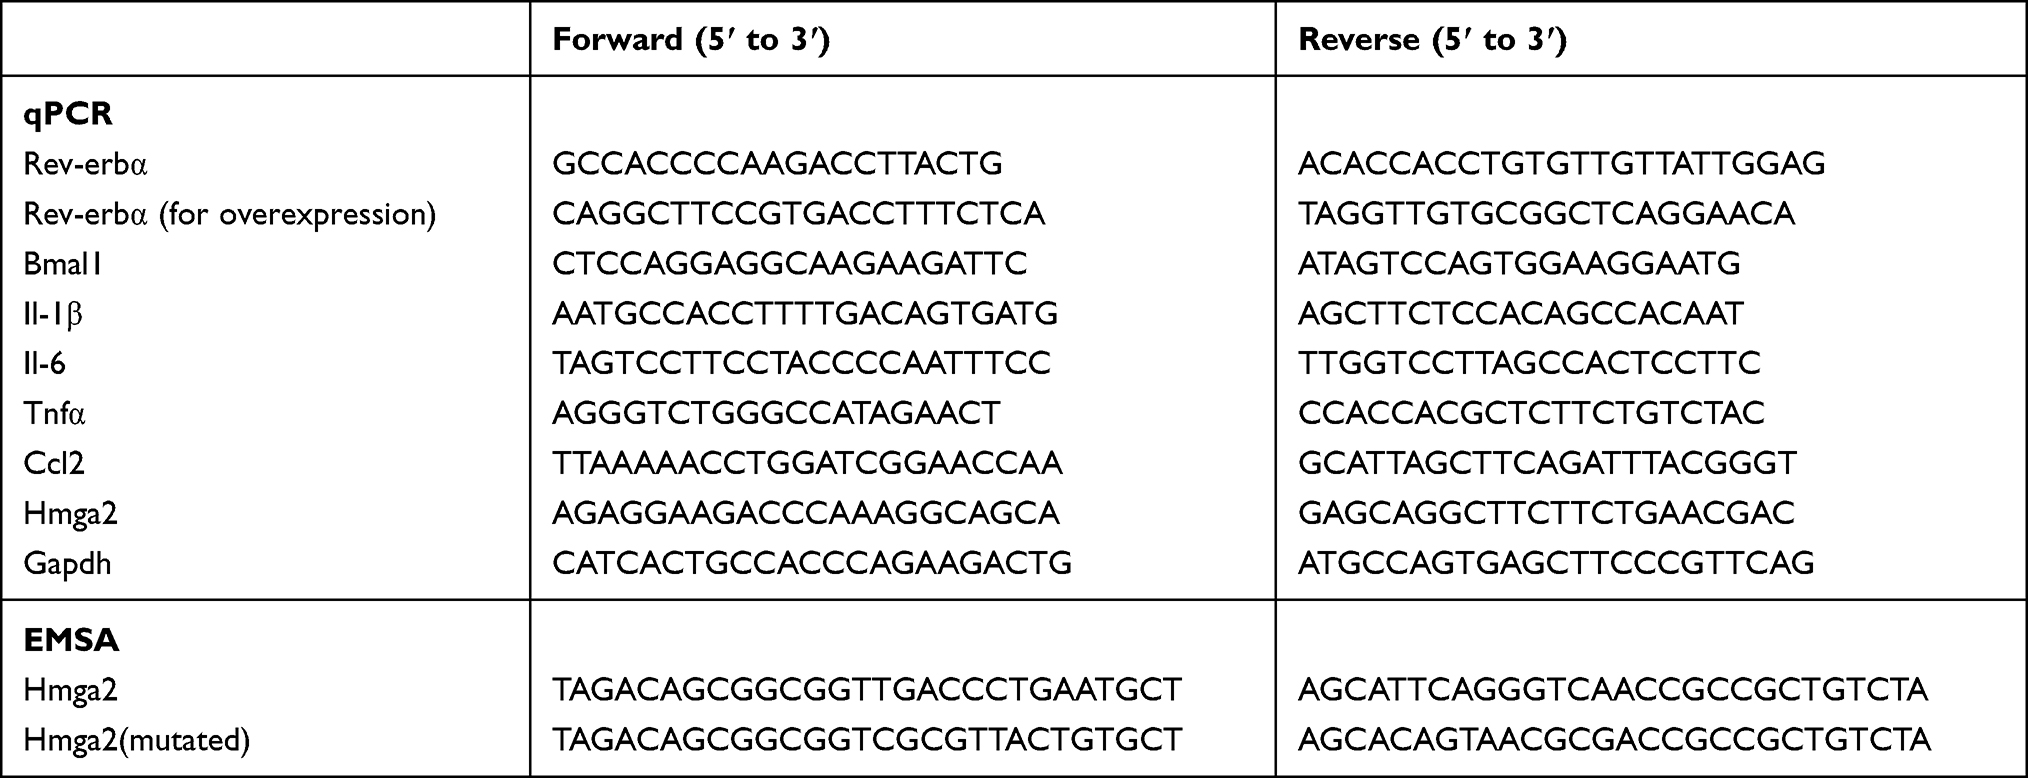 |
Table 1 The Primers or Oligonucleotides in This Study |
RNA-Seq and Data Analysis
Total RNA was extracted from siNr1d1 and NC BV2 cells using TRIzol and quantified by Qubit3.0 (Thermo). Unique identifier (UID) RNA-seq was applied in Novaseq 6000 sequencer (Illumina) by Seqhealth Co., LTD (Wuhan, China) as previously described.27 Low-quality reads and adaptors were trimmed off the raw reads using Trimmomatic (version 0.39) for analysis.28 Clean reads were further filtered using an in-house script to eliminate errors and biases due to either PCR amplification or sequencing. Filtered reads were mapped to the mm10 genome using Hisat2,29 whereas gene expression levels were quantified as read counts using FeatureCounts.30 Differentially expressed genes (DEGs) between siNC and siNr1d1 groups were analyzed using the edgeR package with adjusted p < 0.05 and fold-change >1.5.31 GO and KEGG enrichment analyses for annotated genes were achieved using the Clusterprofiler package in R.32 Results of enrichment analysis were visualized via the GOplot in R.33
ChIP-Seq and Data Analysis
ChIP assay and high throughput sequencing were performed by Seqhealth Technology Co., LTD (Wuhan, China). The BV2 cells were crosslinked in 1% formaldehyde for 10 min and terminated by glycine. After washing with PBS, cells were collected and treated with the cell lysis buffer. The nuclei that were obtained through centrifugation were treated with a nucleus lysis buffer and sonicated to fragment chromatin DNA. For immunoprecipitation, the 10% lysis sonicated chromatin was set as “Input”, 80% was applied in immunoprecipitation reactions with NR1D1 antibody (CST 13418) named “IP” while the remaining 10% was incubated with rabbit anti-IgG antibody (CST) as the negative control named “IgG”. DNA fragments of Input and IP were extracted and purified by the phenol extraction method. High-throughput sequencing libraries were generated using the VAHTS Universal DNA Library Prep Kit for Illumina V3 (Catalog NO. ND607, Vazyme). Library products (200–500 bp) were enriched, quantified, and sequenced on a Novaseq 6000 sequencer (Illumina) with PE150 model.
For data analysis, raw data were filtered using Trimmomatic (version 0.39) to remove low-quality reads and trim reads that were contaminated with adaptor sequences.28 Clean reads were mapped to the mouse genome mm10 by STAR.34 To identify significant Nr1d1 binding peaks, the MACS2 software was used for peak calling with default thresholds.35 Motif enrichment analysis was performed by HOMER (http://homer.ucsd.edu/homer/). Peaks were annotated using the ChIPseeker R package.36 We used the Binding and Expression Target Analysis (BETA) tool to integrate ChIP-seq with differential gene expression data to predict target promoters that were affected by Nr1d1 in BV2 cell lines.37
Western Blotting
Nuclear and cytoplasmic proteins were extracted from BV2 cells using the Nuclear and Cytoplasmic Protein Extraction Kit (Beyotime, China) while total proteins were extracted from BV2 cells using the RIPA lysis buffer (Beyotime, China) with proteinase and phosphatase inhibitors. Protein concentrations were determined by the BCA Protein Quantification Kit (Vazyme, China). Equal protein amounts from each sample were separated into 10% SDS-PAGE gels and transferred onto nitrocellulose membranes. Membranes were blocked with 5% fat-free milk for 1 h and incubated with primary antibodies against p65 (1:1000, CST 8242), phospho-p65 (1:1000, CST 3033), phospho-IKKα/β (1:1000, CST 2697), IKKβ (1:1000, CST 8943), HMGA2 (1:1000, proteintech, 20795-1-AP), Histone-H3 (1:1000, proteintech 17168-1-AP), phosphor-ERK1/2 (1:1000, BioLegend 647801), ERK1/2 (1:1000, CST 4695), phospho-p38 (1:1000, CST 9211), p38 (1:1000, CST 9212), FLAG (1:1000, proteintech 20543-1-AP) and α-Tubulin (1:10000, Abcam ab7291) overnight at 4°C. Membranes were further incubated with either anti-mouse IRDye 800CW (1:10000, LI-COR Bioscience, USA) or anti-rabbit horseradish peroxidase-conjugated (Arigo, arg65351) secondary antibodies for 1 h at room temperature. Chemical signals were visualized using the BeyoECL Star reagent (Beyotime, China). Bands were imaged through the Odyssey Fc Imaging System (LI‐COR Biosciences, USA) and analyzed with the Image Studio software (LI‐COR Biosciences, USA).
Dual-Luciferase Assay
Briefly, HEK293T cells were seeded in a 96-well plate (7.5 × 10⁴ cells/well) and transfected with 100 ng of the Hmga2 promoter pGL4.10 reporter plasmid, 10 ng of pGL4.74 plasmid, and 100 ng of Nr1d1 expression vector using a Lipofectamine 3000 reagent (Invitrogen, Carlsbad, CA, USA). After 8 h of transfection, cells were treated with SR9009 (10 uM) or vehicle (0.1% DMSO) for 24 h. Luciferase activities were measured by the Dual-Glo luciferase Assay System (E2920, Promega, CA, USA) on luminescence mode of the Microplate Reader (Biotek, Winooski, VT, USA).
Electrophoretic Mobility Shift Assay (EMSA)
The HEK293T cells were transfected with the Nr1d1 expression vector. After 48 h of transfection, nuclear proteins were extracted from HEK293T cells using a Nuclear and Cytoplasmic Protein Extraction Kit (Beyotime, China). Biotin-labeled, unlabeled and mutated oligonucleotides were synthesized by General Biosystems (Chuzhou, China). The EMSA was performed using an EMSA kit (Beyotime, China) according to the manufacturer’s instructions. The Epstein-Barr Nuclear Antigen (ENBA) control system was introduced to provide negative and positive controls using the LightShift EMSA optimization and control kit (ThermoFisher, USA). Briefly, the biotin-labeled probe was incubated with the nuclear protein in a binding buffer at room temperature for 20 min. For the competition assay, unlabeled probes or mutated probes were added to the binging reaction. Then, protein-DNA complexes were separated in 4% polyacrylamide gels and transferred to a Nylon membrane (Beyotime, China). Bands were imaged using the Odyssey Fc imaging System (LI-COR Biosciences, USA). Probe sequences are shown in Table 1.
Statistical Analysis
Statistical analyses were performed using the Graphpad Prism software. Statistical differences between and among groups were evaluated by the Student’s t-test and one-way ANOVA followed Dunnetts’ post hoc test, respectively. p ≤ 0.05 was considered statistically significant. Data are presented as mean ± SEM.
Data Availability
Raw data for UID RNA-seq and ChIP-seq were deposited (PRJCA005490) in the Genome Sequence Archive of China National Center for Bioinformation and are accessible with the accession number: CRA004370.38
Results
Impaired Expressions of Nr1d1 in LPS-Induced Retinal Inflammation
Since Nr1d1 mediates many cell functions, we first evaluated the dynamic expression levels and localizations of the circadian clock gene, Nr1d1, in mice retina. Expression levels of Nr1d1 from retinas of BALB/c mice collected from Zeitgeber time (ZT) 0 to ZT20 with 4 h intervals were quantified by RT-qPCR. There were variations in Nr1d1 expression levels across the day with relative two peak values around ZT4 and ZT16 (Figure 1A). Fluorescein-stained NR1D1 in the retina revealed the presence of NR1D1 proteins in all retinal layers (Figure 1B). To further investigate whether retinal inflammation influences the expressions of clock genes, we developed retinal inflammation mice models via intravitreal injections of LPS. As a result, expression levels of Nr1d1 increased whereas those of Bmal1 decreased in the retina of retinal inflammatory mice models (Figure 1C). These findings suggest a wide distribution of the clock gene, Nr1d1, in the retina and its gene expression oscillates across the day. However, its expression levels increased with increasing retinal inflammation.
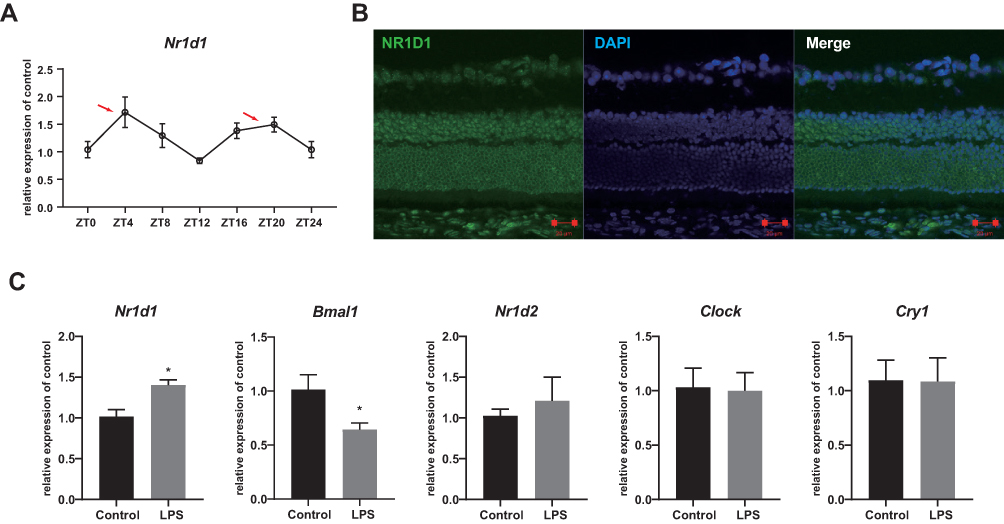 |
Figure 1 Increased Nr1d1 expression in LPS-induced retinal inflammation. (A) The expression level of Nr1d1 in the mouse retina. The red arrows indicate relative peaks around ZT4 and ZT16. (B) Immunofluorescent images of the mouse retina stained with NR1D1 (green), DAPI (blue) and Merge. Scale bar: 20μM. (C) The relative expression level of Nr1d1, Bmal1, Nr1d2, Clock and Cry1 in the retinas. Compare with controls, the expression of Nr1d1 was increased and the expression of Bmal1 was decreased in the LPS-induced retinal inflammation group. *p < 0.05. |
SR9009 Inhibited LPS-Induced Retinal Inflammation
To determine whether Nr1d1 can regulate retinal inflammation, we evaluated the inflammatory conditions in LPS-induced retinal inflammation mice models treated with SR9009 (a pharmacological activator of NR1D1).39 Since that Nr1d1 has relatively high level around ZT4 and ZT16, we intraperitoneally injected SR9009 (100 mg/kg/day) at ZT4 and ZT16 for five days. Given that the number of infiltrated inflammatory cells is a widely used indicator of retinal inflammation,40,41 we assessed the number of infiltrated inflammatory cells in the vitreous and around the ciliary body. Figure 2A and B shows that intravitreal injection of LPS induced massive cell infiltrations in the vitreous and ciliary body (Figure 2A and B), while few infiltrated cells were detected in the control group. Following SR9009 pre-treatment, a markedly decreased number of infiltrated inflammatory cells was found in the ciliary body and in the vitreous (Figure 2A and B). To minimize the bias, another slide at paracenter of each eye was selected for evaluating cell infiltrations. Consistently, the effect of inhibiting infiltrated inflammatory cells of SR9009 treatment also observed at paracenter slide (Supplementary Figure 1). Meanwhile, we evaluated the expression levels of cytokines in the retina through RT-qPCR. Compared to the LPS group, SR9009 pre-treatment suppressed the inflammatory-induced expressions of various cytokines, such as Il-6, Il-1β, and Tnfα in the retina (Figure 2C). Upon activation, marked changes were detected in microglia morphology. After LPS stimulation, ramified morphologies of microglia showed a retraction of cellular processes, while SR9009 treatment partially restored the ramified morphologies of microglia (Figure 2D). In addition, we performed GFAP staining in retinal sections to evaluate Müller cell activation, which has also been recognized as a pathologic change of LPS-induced retinal inflammation.42 As shown in Figure 2E and F, immunostaining for GFAP showed an increased intensity in the retina after LPS-induced retinal inflammation, while this effect was inhibited by SR9009 treatment. Taken together, pharmacological activation of NR1D1 with SR9009 inhibited LPS-induced retinal inflammation.
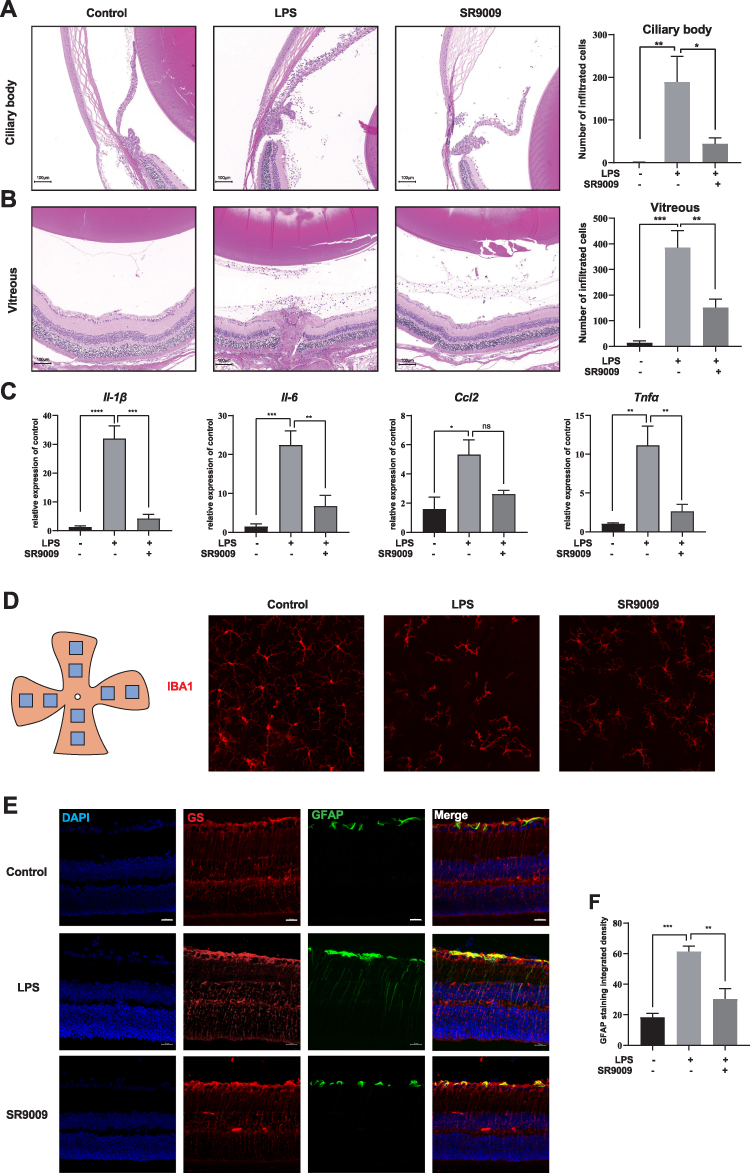 |
Figure 2 SR9009 inhibited LPS-induced ocular inflammation. (A and B) H&E staining showed that SR9009 treatment significantly reduced the number of infiltrated inflammatory cells in the ciliary body (A) and vitreous (B). The right panels indicate the statistical results. Scale bar: 100μm. (C) The qPCR results show that relative expression of Il-1β, Il-6, Ccl2 and Tnfα. SR9009 treatment significantly inhibited LPS-induced Il-1β, Il-6 and Tnfα in retinal inflammation. (n = 3–4, means±SEM). (D) Eight areas of each retina were imaged by IBA1 (red) staining to evaluate the morphology of microglia. The ramified morphology of microglia showed a retraction of the cellular process after LPS stimulation, while the SR9009 treatment partly restored the ramified morphology of microglia. Scale bar, 50μm. (E) Glial fibrillary acidic protein (GFAP, green), glutamine synthetase (GS, red) and DAPI (blue) immunostaining in retinal sections. GS is a marker of Müller cell. GFAP is an indicator of Müller cell activation. Scale bar, 20μm. (F) The barplot displayed the integrated density value of GFAP staining in retinal sections. (n = 4, means±SEM). *p < 0.05, **p < 0.01, ***p < 0.001, and ****p < 0.001. Abbreviation: ns, no significant difference. |
SR9009 Attenuated LPS-Induced Inflammatory Activation of Microglia in vitro
Based on our in vivo findings, we investigated the anti-inflammatory effects of SR9009 in LPS-induced inflammatory activation of microglia in vitro. First, we performed the CCK-8 assay to evaluate cell viabilities after SR9009 treatment. The results showed that SR9009 treatment below 10μM had no significant effects on cell viabilities (Supplementary Figure 2). Therefore, SR9009 was used to treat BV2 immortalized microglial cells at doses of 2.5 μM, 5 μM, and 10 μM for 4 h before LPS induction. SR9009 inhibited LPS-induced expressions of Ccl2, Tnf-α, Il-6 and Il-1β (Supplementary Figure 3A–D). Consistently, ELISA assays revealed that SR9009 treatment significantly suppressed CCL2, TNF-α, IL-6 and IL-1B levels (Supplementary Figure 3E–H). Moreover, SR9009 treatment suppressed iNOS and NO levels (Supplementary Figure 3I and J).
To confirm the anti-inflammatory effects of SR9009 in primary retinal microglia cells, we cultured primary microglia cells from mice retinas, after which microglial purities were assessed using microglial markers IBA1, CD11b and F4/80 (Supplementary Figure 4). SR9009 inhibited LPS-induced expressions of Ccl2, Tnfα, Il-6 and Il-1β in primary retinal microglia (Figure 3A–D). Moreover, concentrations of CCL2, TNF-α, IL-6 and IL-1B in cell supernatants were markedly suppressed after SR9009 treatment, compared to the LPS group (Figure 3E–H). In response to external stimulation, microglia are either polarized towards the proinflammatory M1 phenotype or the anti-inflammatory M2 phenotype. To study the polarization phenotype of microglia, an M2 marker, CD206, was stained. Low expression levels of CD206 were observed in the LPS-stimulated group, while the administration of SR9009 increased CD206 staining (Figure 3I and J). Moreover, we performed phalloidin staining to evaluate morphological changes in primary microglia. Figure 3K shows that LPS stimulation transformed the microglia from a resting ramified phenotype to an activated amoeboid phenotype. SR9009 treatment markedly improved the proportion of ramified microglia, compared to the LPS group (Figure 3K and L). These results indicate that SR9009 can alleviate inflammatory responses in both the BV2 cell line and in the primary retinal microglia in vitro. Moreover, SR9009 attenuated the microglial M1 phenotype and improved polarization towards the M2 phenotype.
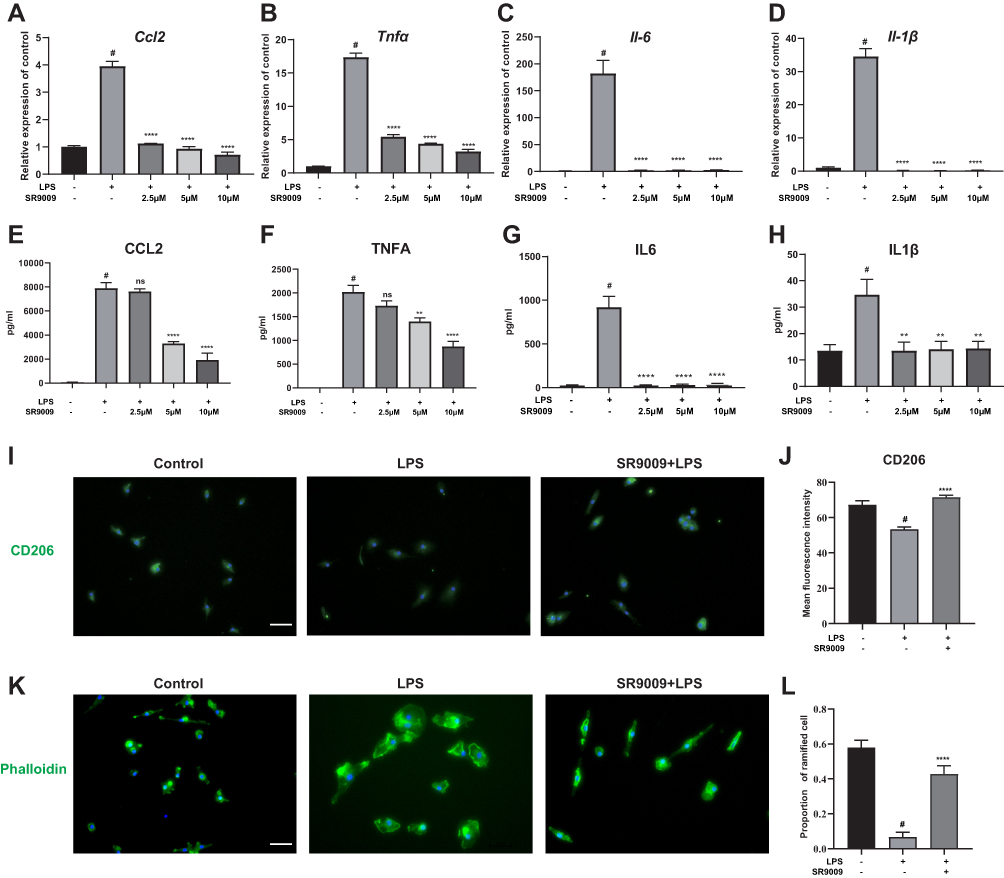 |
Figure 3 SR9009 attenuated LPS-induced cytokines release in primary retinal microglia. (A–D) The qPCR results showing that SR9009 treatment decreased the release of cytokines Ccl2 (A), Tnfα (B), Il-6 (C) and Il-1β (D) in primary retinal microglia. (E–H) The results of ELISA test demonstrating that SR9009 treatment decreased the release of CCL2 (E), TNFA (F), IL6 (G) and IL1B (H) following LPS stimulation. (n = 3–4). (I) Immunofluorescent staining of CD206 (green) and DAPI (blue) in primary microglia with or without SR9009 treatment. (J) The barplot demonstrate the intensity value of CD206 staining in different groups. (n=5). (K) The actin filaments were stained with phalloidin (green) to demonstrate the morphology change of microglia under different treatments. Scale bar, 10μm. (L) The barplot show the proportion of ramified microglia cells. SR9009 treatment significantly attenuated the morphology of microglia change from a ramified morphology to an amoeboid morphology. (n = 6–7). (Means±SEM). #p<0.05 compared with the control group. **p < 0.01, and ****p < 0.001 compared with LPS group. Abbreviation: ns, no significant difference. |
Given that SR9009 is an agonist for both NR1D1 and NR1D2 (also known as REV-ERBα and REV-ERBβ), to investigate the specific functions of NR1D1, we established Nr1d1 overexpressing BV2 cell lines (Supplementary Figure 5A and B). Overexpressed Nr1d1 inhibited LPS-induced expressions of Il-6, Il-1β and Ccl2 (Supplementary Figure 5C–E). Then, we determined whether SR9009 regulates inflammation via Nr1d1 activation. Nr1d1 in BV2 cells was silenced using siRNA (Figure 4A). Nr1d1 knockdown elevated Il-6, Il-1β and Tnf-α levels under LPS stimulation (Figure 4B–D). In addition, our results suggest that suppressed Nr1d1 attenuated the anti-inflammatory effects of SR9009 in LPS-treated mice (Figure 4B–D). However, reduced Nr1d1 had no effect on Ccl2 levels (Figure 4E). In conclusion, SR9009 suppresses LPS-induced inflammation in microglia by activating NR1D1.
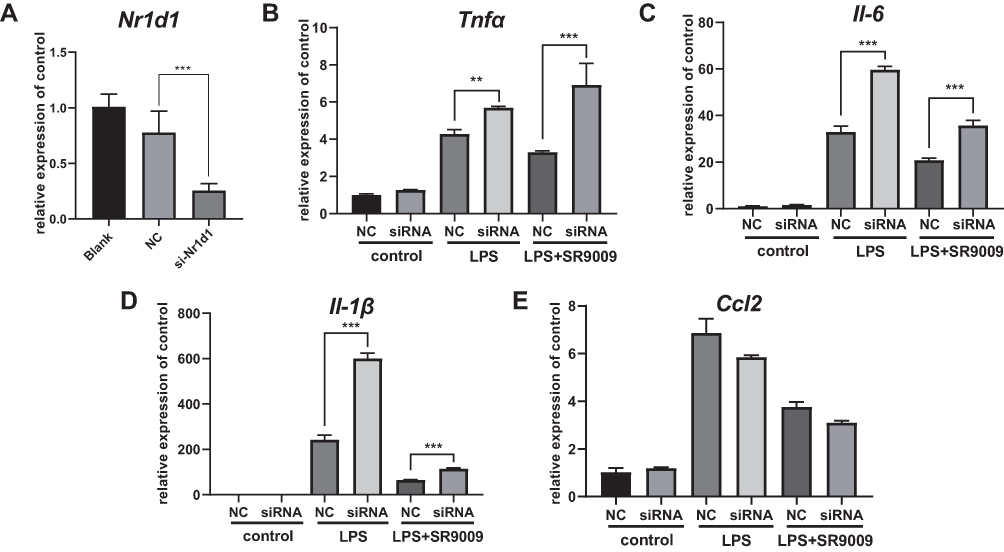 |
Figure 4 Nr1d1 knockdown increased the release of cytokines and blocks the anti-inflammatory effect of SR9009 in BV2. (A) The mRNA level of Nr1d1 was decreased in si-Nr1d1 group. (B and E) Expression levels of Tnfα (B), Il-6 (C) and Il-1β (D) and Ccl2 (E) in various groups. Nr1d1 knockdown increased the expression of Tnfα, Il-6 and Il-1β in BV2 cells following LPS-stimulation. And knockdown of Nr1d1 attenuates the effect of SR9009 on Il-6, Il-1β and Tnfα expression following LPS treatment. (n = 4, means±SEM). **p < 0.01, and ***p < 0.001. |
SR9009 Suppressed Inflammation via the NF-κB Pathway
We investigated the molecular pathways underlying the anti-inflammatory effects of SR9009. Both NF-κB and MAPK pathways are involved in anti-inflammatory effects of SR9009,21,43 and these two pathways are essential for inflammatory responses of microglia. Thus, we evaluated the effects of SR9009 on NF-κB and MAPK pathways in BV2 cells. SR9009 suppressed the phosphorylation levels of p65 and IKK after LPS stimulation of BV2 cells (Figure 5A–C). In addition, SR9009 inhibited LPS-induced nuclear translocations of P65 (Figure 5D and E), which coincides with a finding from another agonist of NR1D1 GSK4112.22 However, SR9009 had no effect on LPS-induced phosphorylation of ERK and p38 MAPK (Figure 5F–H). These data suggest that anti-inflammatory effects of SR9009 are mainly mediated by the NF-κB signaling pathway rather than the MAPK signaling pathway in BV2 cells.
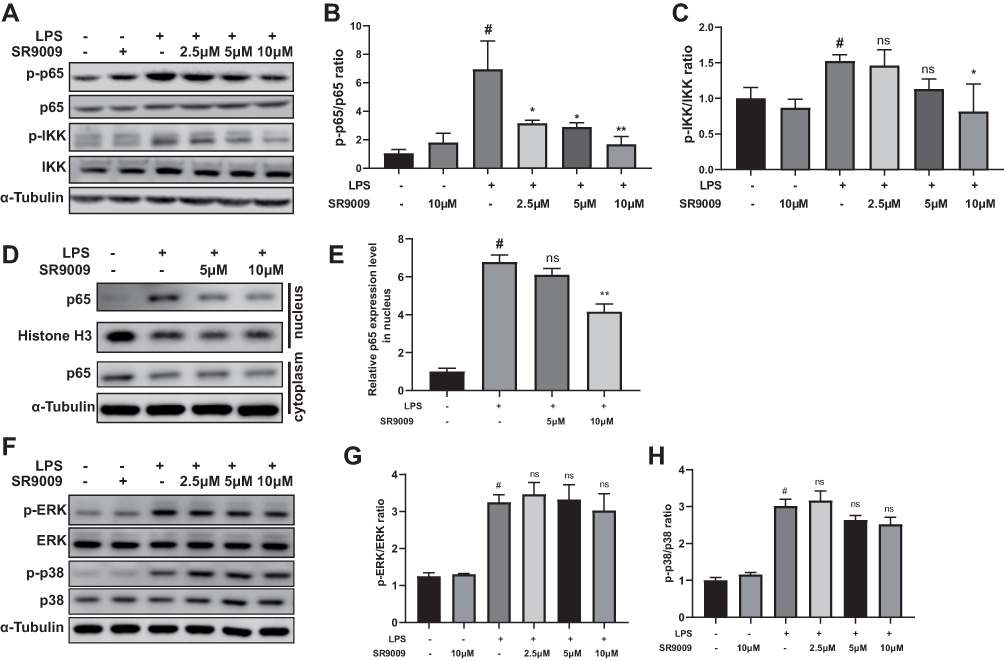 |
Figure 5 SR9009 suppressed inflammation via the NF-κB signaling pathway but not the MAPK pathway. (A) Representative gel images of p-p65, p65, p-IKK and IKK. (B and C) The densities of p-p65, p65, p-IKK, IKK. The ratios of p-p65/p65 (B) and p-IKK/IKK (C) are shown. (D) Representative gel images of p65, Histone-H3 and α-Tubulin in the nuclear fraction and cytoplasmic fraction. The histone-H3 protein was set as loading control for nuclear fraction, and α-Tubulin was set as the loading control for cytoplasmic fraction. (E) The relative level of p65 in the nuclear fraction. (F) Representative gel images of p-ERK, ERK, p-p38 and p38. (G and H) The densities of p-ERK, ERK, p-p38 and p38. The ratios of p-ERK/ERK (G) and p-p38/p38 (H) are shown. (n = 3–4, means±SEM). #p < 0.05 compared with the control group. *p < 0.05 and **p < 0.01 compared with LPS group. Abbreviation: ns, no significant difference. |
Nr1d1 Deficiency Enhanced Inflammatory-Associated Gene Expressions
RNA-seq was conducted in Nr1d1 silenced BV2 cells to elucidate on their biological processes and molecular functions. Compared to the NC group, 257 upregulated genes and 265 downregulated genes were identified in the Nr1d1 knockdown group. Moreover, GO and KEGG enrichment analyses on DEGs were performed to determine the relationships between Nr1d1-associated biological processes and pathways (Supplementary Table 1). Among 257 upregulated genes in the Nr1d1 knockdown group, inflammatory-associated biological processes and pathways were enriched, and there was a positive regulation of responses to external stimulus, interferon-beta, TNF signaling pathway, and IL-17 signaling pathway (Figure 6A and B). These results validate the intrinsic anti-inflammatory activities of Nr1d1 in the microglia.
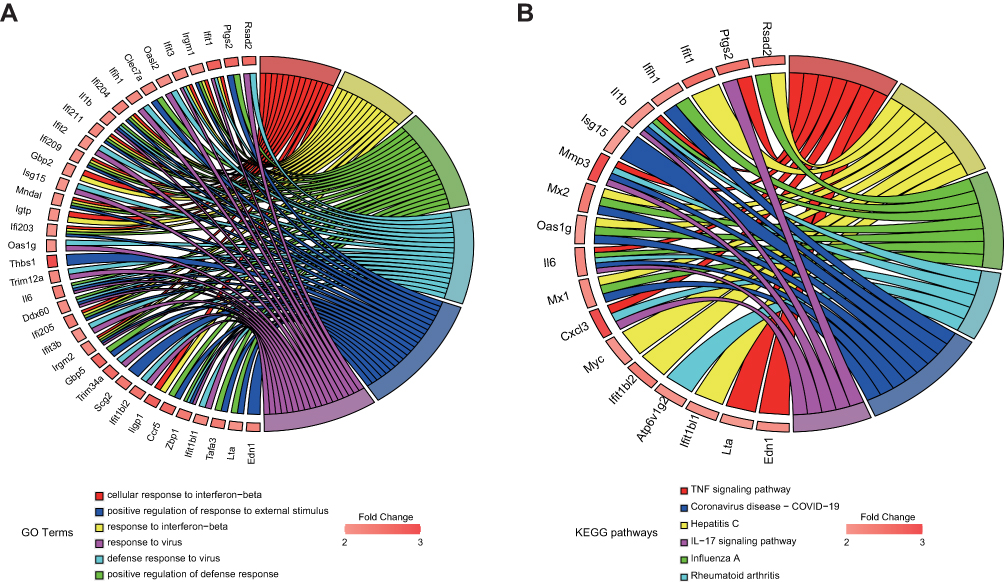 |
Figure 6 Nr1d1 silencing activated inflammation-associated biological processes and pathways. (A and B) Chord plots were used to visualize the top 6 enriched (A) biological processes and (B) KEGG pathways, and their relationship with upregulated genes. |
Downstream Effectors of Nr1d1 in the Anti-Inflammation Process
Our findings are in tandem with those of previous studies that Nr1d1 alleviates microglia-related inflammation, including neuroinflammatory diseases.21 However, the mechanisms of Nr1d1 in microglia are yet to be fully elucidated. Given NR1D1 can act as a transcription repressor, we hypothesized that NR1D1 can inhibit the transcription of inflammation-associated genes. We performed ChIP-seq analysis in BV2 cells to establish direct effectors of NR1D1 in microglia. A total of 699 peaks and 631 peak-associated genes were identified. Most peaks were localized in the distal intergenic regions (31.36%), intron (42.48%) and promoter (20.67%, ± 3 kb from TSS) regions (Figure 7A). Consistent with previous reports, motif analysis showed that NR1D1 binds ROR/REV-ERBΑ-response elements (RORE)44 (Figure 7B).
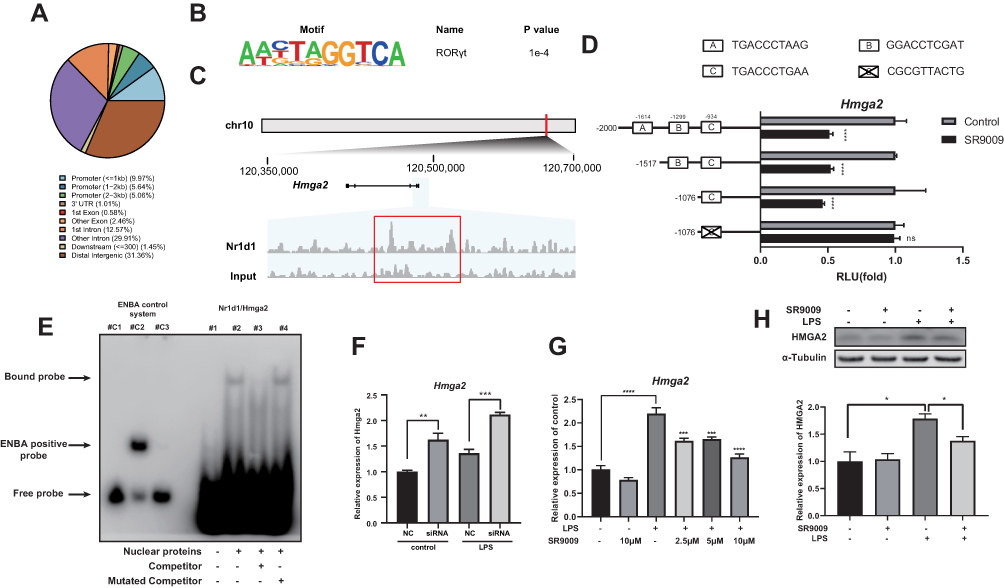 |
Figure 7 Hmga2 is a potential downstream target of NR1D1 in BV2 cells. (A) The peak distribution of NR1D1 within different genomic regions. (B) Top 1 known HOMER motif enriched at NR1D1 binding sites from ChIP-seq analysis in BV2 cells (C) NR1D1 ChIP-seq tracks at the Hmga2 gene. The red box indicates the peak of NR1D1 in Hmga2 gene. (D) Relative luciferase activity measured by dual-luciferase reporter assay. SR9009 decreases the transcription activities of Hmga2 promoters containing the C-site in HEK293T cells. However, a C-site mutant reporter construct abolished the ability of SR9009 to repress the promoter activity. (E) EMSA showing that NR1D1 binds Hmga2 promoter region containing C-sites but not the mutated sequence. Lane c1, c2 and c3 show the ENBA control system containing: (c1) biotin-ENBA control DNA as negative control, (c2) biotin-ENBA control DNA + ENBA extract protein as positive control, (c3) biotin-ENBA control DNA + ENBA extract protein + unlabeled ENBA DNA as cold competition. (F) Inhibition of Nr1d1 elevates Hmga2 expression in BV2 cells. (G and H) SR9009 decreases LPS-induced Hmga2 expression at mRNA (G) and protein levels (H). (n = 3–4, means±SEM). *p < 0.05, **p < 0.01, ***p < 0.001, and ****p < 0.001. Abbreviation: ns, no significant difference. |
To reveal candidate downstream effectors of NR1D1, we integrated RNA-seq and ChIP-seq results using BETA tools. Briefly, BETA tools is a software for integrating ChIP-seq results with differential gene expression data to infer direct target genes.37 BETA analysis identified Hmga2 as the most possible target of NR1D1 (Supplementary Table 2). HMGA2, a member of the HMGA family, has the potential to drive inflammation through the NF-κB pathway.18 Thus, we hypothesized that Hmga2 is a potential downstream effector of NR1D1. Besides, ChIP-seq results revealed the presence of peaks in the promoter of Hmga2, suggesting that NR1D1 can bind the Hmga2 promoter (Figure 7C).
To investigate the transcriptional activity of NR1D1, we used dual-luciferase reporter assays. First, we analyzed the Hmga2 promoter sequence and three potential Nr1d1 binding sites (A, B, C-sites) were identified using the JASPAR database (http://jaspar.genereg.net/) (Figure 7D). Accordingly, full-length promoter and multiple deletion reporter constructs were generated to determine the actual binding site of NR1D1. Dual-luciferase assays confirmed that SR9009 treatment significantly suppressed promoter activities of all constructs covering the C-site (Figure 7D). Thereafter, we generated a C-site mutant reporter construct and found that SR9009 cannot suppress promoter activities (Figure 7D). Moreover, the EMSA assay was performed to determine whether NR1D1 could bind the C-site of the Hmga2 promoter. Figure 7E shows that the biotin-labeled probe encompassing C-site formed a DNA-protein complex with the NR1D1 protein. The unlabeled competitor weakened the DNA-protein complex, but the mutated competitor did not suppress the biotin-labeled probe binding properties of NR1D1 protein. To confirm the correlation between Nr1d1 and Hmga2, we assessed the expression level of Hmga2 after Nr1d1 knockdown. Nr1d1 knockdown elevated Hmga2 levels in BV2 cells (Figure 7F). In addition, the NR1D1 agonist, SR9009, inhibited LPS-induced Hmga2 expression (Figure 7G and H). These results indicate that NR1D1 can bind the promoter region of Hmga2 to downregulate its transcription in BV2 cells.
Overexpressed Hmga2 Blunted the Anti-Inflammatory Effects of Nr1d1 in BV2
Hmga2 levels were markedly increased after LPS stimulation (Figure 7G and H). HMGA2 has been shown to elevate pro-inflammatory cytokine levels through the NF-κB pathway in RAW264.7 cells.18 Therefore, to determine whether Hmga2 enhances inflammation in BV2 cells, a BV2 cell line with stable overexpression of Hmga2 were generated (Figure 8A and B). A significant increase in cytokine and NO levels following Hmga2 over-expression occurred under LPS stimulation (Figure 8C–G). In addition, Hmga2 over-expression promoted NF-κB pathway activation (Figure 8H–J). Thus, Hmga2 enhances LPS-induced inflammation in the microglia.
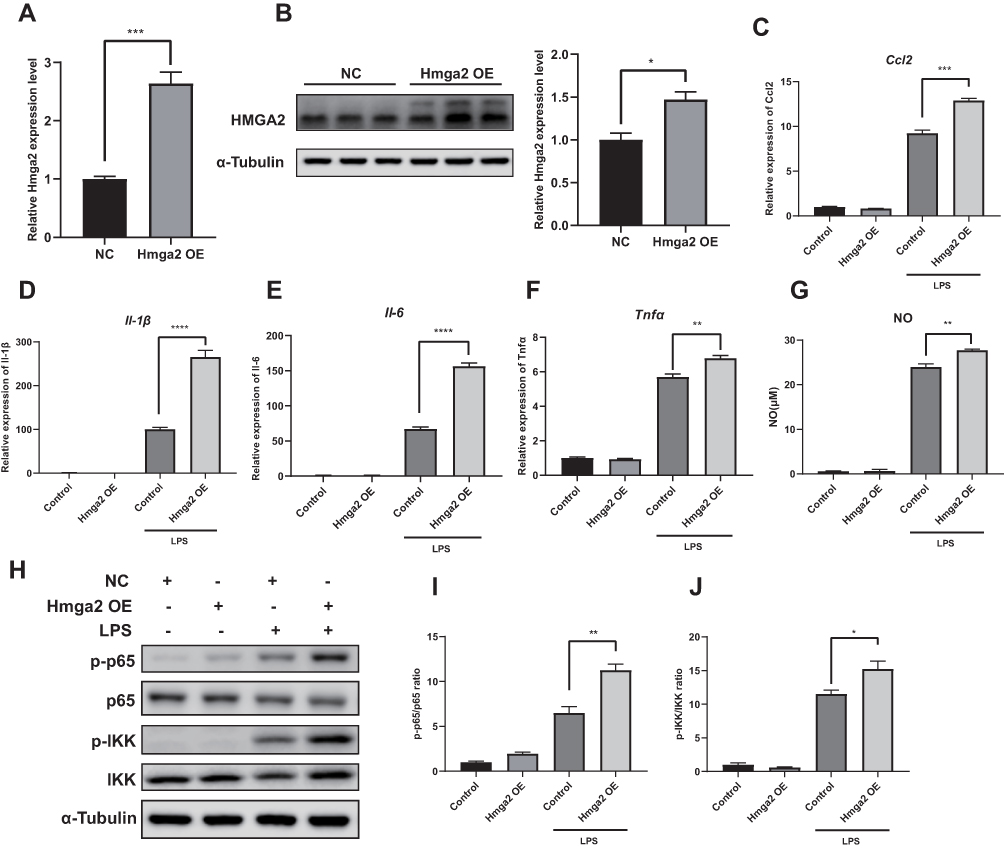 |
Figure 8 Hmga2 promoted LPS-induced inflammation in BV2 cells. (A and B) qPCR and Western blot assay results showing Hmga2 expression in BV2 cells transfected with Hmga2 lentivirus or negative control lentivirus. NC, negative control. OE, overexpression. (C–F) The mRNA levels of Ccl2 (C), Il-1β (D), Il-6 (E) and Tnfα (F) measured by qPCR assays. Hmga2 overexpression further promote the expression of cytokines Ccl2, Il-1β, Il-6 and Tnfα in BV2 cells under LPS stimulation. (G) The concentration of NO in the supernatant of cultured BV2 cells. Hmga2 overexpression promotes the release of NO following LPS stimulation. (H) Representative gel images of p-p65, p65, p-IKK and IKK. (I and J) The densities of p-p65, p65, p-IKK, IKK. The ratios of p-p65/p65 (I) and p-IKK/IKK (J) are shown. (n = 3–4, means±SEM). *p < 0.05, **p < 0.01, ***p < 0.001, and ****p < 0.001. |
To establish whether the anti-inflammatory effects of SR9009 are Hmga2-dependent, we used Hmga2 overexpressing SR9009-treated BV2 cells. Intriguingly, Hmga2 overexpression reversed the SR9009 treatment-induced downregulation of cytokine expression (Figure 9A–D). Overexpression of Hmga2 restored LPS-induced phosphorylation of p65 and IKK, which were suppressed by SR9009 (Figure 9E–G). These findings imply that Hmga2 overexpression blunts the anti-inflammatory effects of Nr1d1 in BV2 cells, suggesting that Nr1d1 plays an anti-inflammatory role, in part, by suppressing Hmga2.
 |
Figure 9 Hmga2 overexpression abolished the anti-inflammatory effect of SR9009. (A–D) The mRNA levels of Ccl2 (A), Il-1β (B), Il-6 (C) and Tnfα (D) as measured using qPCR assays. Overexpression of Hmga2 abolishes the SR9009 treatment-induced downregulation of cytokines Ccl2, Il-1β, and Il-6. (E) Representative gel images of p-p65, p65, p-IKK and IKK proteins. (F and G) The densities of p-p65, p65, p-IKK, IKK. The rations of p-p65/p65 (F) and p-IKK/IKK (G) are shown. Overexpression of Hmga2 blocks the SR9009 treatment-induced inhibition of NF-κB pathway. (n = 3–4, means±SEM). *p < 0.05, **p < 0.01, and ****p < 0.001. Abbreviation: ns, no significant difference. |
Discussion
We investigated the potential role of the Nr1d1 clock gene in regulation of retinal inflammation and elucidated on its mechanisms in inhibition of microglial activation. Activation of Nr1d1 with agonist SR9009 attenuated the inflammatory phenotypes of LPS-induced retinal inflammation. SR9009 also inhibited LPS-induced cytokine production and activation of the NF-κB pathway in microglia. To further understand the anti-inflammatory mechanism of Nr1d1, we integrated RNA-seq with ChIP-seq assays to screen downstream targets of Nr1d1, whereby the inflammation driver gene, Hmga2, was determined as the downstream target and was transcriptionally repressed by Nr1d1. Thus, Nr1d1 modulated microglial activation through Hmga2 regulation.
Many retinal physiologies, such as visual sensitivity, dopamine synthesis, photoreceptor outer segment disk shedding, axial length, and amplitude of the photopic electroretinogram have been revealed to be rhythmic under the day-night cycle.45–48 High-throughput transcriptome analyses demonstrated that energy production, glycolysis, Hif-1α pathway activity and cilium organization are rhythmically maintained in mouse retina.27 Since the circadian rhythm is involved in many key physiological processes of the eye, disruption of the circadian rhythm or genetic perturbations of clock genes is crucial in the pathogenesis of various ocular diseases and abnormalities. For example, Bmal1 knockout mice exhibited corneal neovascularization, keratinization, and progressive inflammation.49 Moreover, a significantly reduced viability of photoreceptors during aging was found in Bmal1 knockout mice.50 Nr1d1 has also been shown to influence rod functions, however, reduced b wave amplitudes in scotopic and photopic electroretinogram were observed post-Nr1d1 knockdown.51 In Nr1d1−/− mice, the visual phenotype exhibited a marked hypersensitivity to low ambient light, demonstrating the vital role of Nr1d1 in visual information processing.52
Evidence has shown the link between the core clock gene, Nr1d1, and inflammatory pathologies, such as neuroinflammation, rheumatoid arthritis, and colitis.21,43,53 However, the effects of Nr1d1 in retinal inflammation have not been conclusively determined. Therefore, first, we analyzed protein localization and expression level during the 24 h cycle of Nr1d1 in mouse retina. We found that Nr1d1 was ubiquitously expressed in the retina and attained its peak value around ZT4 and ZT16 during the light-dark cycle. Therefore, the Nr1d1 agonist, SR9009, was administered at ZT4 and ZT16 in the treatment of LPS-induced retinal inflammation. These findings imply that SR9009 has the potential to mitigate inflammatory phenotypes during retinal inflammation. Assessment of anti-inflammatory effects of SR9009 in LPS-induced microglial activation showed that SR9009 significantly inhibited LPS-induced elevations of cytokines in BV2 cells and in primary cultured retinal microglia, in vitro, consistent with previous findings.22 In addition, SR9009 exerted an anti-inflammatory effect by inhibiting activation of the NF-κB pathway rather than the MAPK pathway. Through RNA-seq, we found that upregulated genes in Nr1d1 knockdown BV2 cells are involved in inflammation-associated pathways and biological processes.
To establish the anti-inflammatory effects of Nr1d1, ChIP-seq assays were performed and the results integrated with RNA-seq data to identify downstream targets of NR1D1. Hmga2 was found to be a potential downstream effector of NR1D1. To determine whether Nr1d1 can regulate the transcription of Hmga2, truncated and mutant constructs of the Hmga2 promoter were generated for dual-luciferase assays. In addition, we evaluated RNA and protein levels of Hmga2 upon SR9009 treatment. Our results indicate that NR1D1 binds the Hmga2 promoter to negatively regulate its expression.
HMGA2 mediates various biological events, such as cell proliferation, apoptosis, cell-cycle control, and metastasis.54,55 Thus, it is frequently over-expressed in various human malignancies and acts as a critical regulator in cancer development.56–58 HMGA2 can interact with the p50 subunit of NF-κB59 and enhances the transcriptional activity of NF-κB by binding AT-rich sequences adjacent to the NF-κB consensus site.60 Recent studies have reported a possible link between HMG proteins and inflammation.16,61 Huang et al reported that HMGA2 promotes the expression of inflammatory cytokines by activating the NF-κB pathway.18 In addition, Jin et al found that miR-26a inhibits the inflammatory responses of microglia by targeting HMGA2 in intracerebral hemorrhage.17 Consistently, these results indicate that Hmga2 promotes LPS-induced inflammation through the NF-κB pathway in BV2 cells.
Nr1d1 regulates inflammation through various mechanisms. It inactivates the NLRP3 inflammasome by suppressing NLRP3 transcription and suppression of NF-κB signaling.21,22,53 Furthermore, it can directly suppresse inflammatory mediators, including CCL2 and IL-6.62,63 Lin et al reported that Nr1d1 can regulate lncRNA Platr4, which inhibits NLRP3 transactivation by preventing the binding of NF-κB to κB sites.64 In this study, exogenous expression of Hmga2 partially blocked the downregulated expression of cytokines by SR9009 treatment in BV2 cells. Western blot analysis revealed that Hmga2 overexpression alleviated the inhibitory effects of p-p65 and p-IKK by SR9009 treatment. This indicates that Hmga2 plays a critical role in anti-inflammatory effects of activated Nr1d1 in BV2 cells. Thus, we hypothesize that Hmga2 suppression might be a novel mechanism through which Nr1d1 exerts its anti-inflammatory effects, especially in the microglia.
Microglia activation and elevated pro-inflammation cytokine levels are critical in retinal inflammatory diseases. Therefore, we investigated the anti-inflammatory effects and mechanisms of activated Nr1d1 in microglia. SR9009 has no cell specificity, implying that anti-inflammatory effects of SR9009 might not only occur through microglia. It has been found that SR9009 plays anti-inflammatory roles in various cell types, such as macrophages, microglia, endometrial stroma cells and fibroblasts.21,65–68 Even though the vast majority of immune cells in the retina are microglia, it should be noted that the Müller glial cell and infiltrating monocytes are vital for immune responses.69,70 Therefore, we postulate that microglia, Müller glial cells and infiltrating monocytes are involved in anti-inflammatory effects of SR9009, however, studies should be performed to confirm this hypothesis.
Our study shows that in the management of inflammatory diseases, activated Nr1d1 attenuated LPS-induced retinal inflammation. Moreover, its mechanisms may be associated with transcriptionally suppressing Hmga2, an activator of the NF-κB signaling pathway, in microglia. Despite these findings, this study has limitations. First, it was not determined whether Nr1d1 can regulate Hmga2 in other cell types. At the tissue level, involvement of Hmga2 in retinal inflammation remain elusive. To elucidate on the roles of Hmga2 in retinal inflammation, additional experiments, such as Hmga2 knockout models, should be performed to uncover the mechanisms of Hmga2 on retinal inflammation. Second, because of the low yield of primary retinal microglia, most experiments were performed in BV2 cell lines. Since the BV2 cell line cannot completely recapitulate the phenotypes of primary retinal microglia, some findings from the BV2 cell line are insufficient. Third, mRNA expression levels of Ccl2 after Nr1d1 knockdown were inconsistence, which might be attributed to either technical factors or other regulators. Therefore, further studies are recommended to address these limitations.
Conclusions
Pharmacological activation of Nr1d1 can effectively alleviate LPS-induced retinal inflammation and inhibit microglial inflammatory responses. Suppression of the pro-inflammation gene, Hmga2, may be the molecular mechanism through which Nr1d1 exerts its anti-inflammatory effects in the microglia. These findings show the significance of Nr1d1 as a potential target for inflammation-associated retinal diseases.
Funding
This study was supported by the Science Research Grant of Aier Eye Institute, China (01-2020003).
Disclosure
The authors report no conflicts of interest in this work.
References
1. Kauppinen A, Paterno JJ, Blasiak J, Salminen A, Kaarniranta K. Inflammation and its role in age-related macular degeneration. Cell Mol Life Sci. 2016;73(9):1765–1786.
2. Mesquida M, Drawnel F, Fauser S. The role of inflammation in diabetic eye disease. Semin Immunopathol. 2019;41(4):427–445. doi:10.1007/s00281-019-00750-7
3. Wingate RJ, Beaumont PE. Intravitreal triamcinolone and elevated intraocular pressure. Aust N Z J Ophthalmol. 1999;27(6):431–432. doi:10.1046/j.1440-1606.1999.00238.x
4. Jobling AI, Augusteyn RC. What causes steroid cataracts? A review of steroid-induced posterior subcapsular cataracts. Clin Exp Optom. 2002;85(2):61–75. doi:10.1111/j.1444-0938.2002.tb03011.x
5. Karlstetter M, Scholz R, Rutar M, Wong WT, Provis JM, Langmann T. Retinal microglia: just bystander or target for therapy? Prog Retin Eye Res. 2015;45:30–57.
6. Combadiere C, Feumi C, Raoul W, et al. CX3CR1-dependent subretinal microglia cell accumulation is associated with cardinal features of age-related macular degeneration. J Clin Invest. 2007;117(10):2920–2928. doi:10.1172/JCI31692
7. Grigsby JG, Cardona SM, Pouw CE, et al. The role of microglia in diabetic retinopathy. J Ophthalmol. 2014;2014:705783. doi:10.1155/2014/705783
8. Okunuki Y, Mukai R, Nakao T, et al. Retinal microglia initiate neuroinflammation in ocular autoimmunity. Proc Natl Acad Sci U S A. 2019;116(20):9989–9998. doi:10.1073/pnas.1820387116
9. Takahashi JS. Transcriptional architecture of the mammalian circadian clock. Nat Rev Genet. 2017;18(3):164–179. doi:10.1038/nrg.2016.150
10. Ueda HR, Chen W, Adachi A, et al. A transcription factor response element for gene expression during circadian night. Nature. 2002;418(6897):534–539. doi:10.1038/nature00906
11. Cho H, Zhao X, Hatori M, et al. Regulation of circadian behaviour and metabolism by REV-ERB-alpha and REV-ERB-beta. Nature. 2012;485(7396):123–127. doi:10.1038/nature11048
12. Sulli G, Rommel A, Wang X, et al. Pharmacological activation of REV-ERBs is lethal in cancer and oncogene-induced senescence. Nature. 2018;553(7688):351–355. doi:10.1038/nature25170
13. Shen W, Zhang W, Ye W, et al. SR9009 induces a REV-ERB dependent anti-small-cell lung cancer effect through inhibition of autophagy. Theranostics. 2020;10(10):4466–4480. doi:10.7150/thno.42478
14. Scheiermann C, Kunisaki Y, Frenette PS. Circadian control of the immune system. Nat Rev Immunol. 2013;13(3):190–198. doi:10.1038/nri3386
15. Sgarra R, Rustighi A, Tessari MA, et al. Nuclear phosphoproteins HMGA and their relationship with chromatin structure and cancer. FEBS Lett. 2004;574(1–3):1–8. doi:10.1016/j.febslet.2004.08.013
16. Zhu J, Lin X, Yan C, Yang S, Zhu Z. microRNA-98 protects sepsis mice from cardiac dysfunction, liver and lung injury by negatively regulating HMGA2 through inhibiting NF-kappaB signaling pathway. Cell Cycle. 2019;18(16):1948–1964. doi:10.1080/15384101.2019.1635869
17. Jin J, Zhou F, Zhu J, Zeng W, Liu Y. MiR-26a inhibits the inflammatory response of microglia by targeting HMGA2 in intracerebral hemorrhage. J Int Med Res. 2020;48(6):300060520929615. doi:10.1177/0300060520929615
18. Huang H, Li H, Chen X, et al. HMGA2, a driver of inflammation, is associated with hypermethylation in acute liver injury. Toxicol Appl Pharmacol. 2017;328:34–45. doi:10.1016/j.taap.2017.05.005
19. Hayashi Y, Koyanagi S, Kusunose N, et al. The intrinsic microglial molecular clock controls synaptic strength via the circadian expression of cathepsin S. Sci Rep. 2013;3:2744. doi:10.1038/srep02744
20. Fonken LK, Frank MG, Kitt MM, Barrientos RM, Watkins LR, Maier SF. Microglia inflammatory responses are controlled by an intrinsic circadian clock. Brain Behav Immun. 2015;45:171–179. doi:10.1016/j.bbi.2014.11.009
21. Griffin P, Dimitry JM, Sheehan PW, et al. Circadian clock protein Rev-erbalpha regulates neuroinflammation. Proc Natl Acad Sci U S A. 2019;116(11):5102–5107. doi:10.1073/pnas.1812405116
22. Guo DK, Zhu Y, Sun HY, et al. Pharmacological activation of Nr1d1 represses LPS-induced microglial activation through the NF-κB pathway. Acta Pharmacol Sin. 2019;40(1):26–34. doi:10.1038/s41401-018-0064-0
23. Devarajan G, Chen M, Muckersie E, Xu H. Culture and characterization of microglia from the adult murine retina. Sci World J. 2014;2014:894368. doi:10.1155/2014/894368
24. Saddala MS, Yang X, Tang S, Huang H. Transcriptome-wide analysis reveals core sets of transcriptional regulators of sensome and inflammation genes in retinal microglia. Genomics. 2021;113(5):3058–3071. doi:10.1016/j.ygeno.2021.07.001
25. Saura J, Tusell JM, Serratosa J. High-yield isolation of murine microglia by mild trypsinization. Glia. 2003;44(3):183–189. doi:10.1002/glia.10274
26. Luckoff A, Scholz R, Sennlaub F, Xu H, Langmann T. Comprehensive analysis of mouse retinal mononuclear phagocytes. Nat Protoc. 2017;12(6):1136–1150. doi:10.1038/nprot.2017.032
27. Wang Z, Ji S, Huang Y, et al. The daily gene transcription cycle in mouse retina. Exp Eye Res. 2021;207:108565. doi:10.1016/j.exer.2021.108565
28. Bolger AM, Lohse M, Usadel B. Trimmomatic: a flexible trimmer for illumina sequence data. Bioinformatics. 2014;30(15):2114–2120. doi:10.1093/bioinformatics/btu170
29. Kim D, Langmead B, Salzberg SL. HISAT: a fast spliced aligner with low memory requirements. Nat Methods. 2015;12(4):357–360. doi:10.1038/nmeth.3317
30. Liao Y, Smyth GK, Shi W. featureCounts: an efficient general purpose program for assigning sequence reads to genomic features. Bioinformatics. 2014;30(7):923–930. doi:10.1093/bioinformatics/btt656
31. Robinson MD, McCarthy DJ, Smyth GK. edgeR: a Bioconductor package for differential expression analysis of digital gene expression data. Bioinformatics. 2010;26(1):139–140. doi:10.1093/bioinformatics/btp616
32. Wu T, Hu E, Xu S, et al. clusterProfiler 4.0: a universal enrichment tool for interpreting omics data. Innovation. 2021;2(3):100141.
33. Walter W, Sanchez-Cabo F, Ricote M. GOplot: an R package for visually combining expression data with functional analysis. Bioinformatics. 2015;31(17):2912–2914. doi:10.1093/bioinformatics/btv300
34. Dobin A, Davis CA, Schlesinger F, et al. STAR: ultrafast universal RNA-seq aligner. Bioinformatics. 2013;29(1):15–21. doi:10.1093/bioinformatics/bts635
35. Zhang Y, Liu T, Meyer CA, et al. Model-based analysis of ChIP-Seq (MACS). Genome Biol. 2008;9(9):R137. doi:10.1186/gb-2008-9-9-r137
36. Yu G, Wang LG, He QY. ChIPseeker: an R/Bioconductor package for ChIP peak annotation, comparison and visualization. Bioinformatics. 2015;31(14):2382–2383. doi:10.1093/bioinformatics/btv145
37. Wang S, Sun H, Ma J, et al. Target analysis by integration of transcriptome and ChIP-seq data with BETA. Nat Protoc. 2013;8(12):2502–2515. doi:10.1038/nprot.2013.150
38. Members BIGDC. Database resources of the BIG data center in 2018. Nucleic Acids Res. 2018;46(D1):D14–D20. doi:10.1093/nar/gkx897
39. Solt LA, Wang Y, Banerjee S, et al. Regulation of circadian behaviour and metabolism by synthetic REV-ERB agonists. Nature. 2012;485(7396):62–68. doi:10.1038/nature11030
40. Yuan Z, Chen X, Yang W, Lou B, Ye N, Liu Y. The anti-inflammatory effect of minocycline on endotoxin-induced uveitis and retinal inflammation in rats. Mol Vis. 2019;25:359–372.
41. Ren JL, Yu QX, Liang WC, et al. Green tea extract attenuates LPS-induced retinal inflammation in rats. Sci Rep. 2018;8(1):429. doi:10.1038/s41598-017-18888-5
42. Lin FL, Ho JD, Cheng YW, et al. Theissenolactone C exhibited ocular protection of endotoxin-induced uveitis by attenuating ocular inflammatory responses and glial activation. Front Pharmacol. 2018;9:326. doi:10.3389/fphar.2018.00326
43. Liu H, Zhu Y, Gao Y, et al. NR1D1 modulates synovial inflammation and bone destruction in rheumatoid arthritis. Cell Death Dis. 2020;11(2):129. doi:10.1038/s41419-020-2314-6
44. Harding HP, Lazar MA. The orphan receptor Rev-ErbA alpha activates transcription via a novel response element. Mol Cell Biol. 1993;13(5):3113–3121.
45. Teirstein PS, Goldman AI, O’Brien PJ. Evidence for both local and central regulation of rat rod outer segment disc shedding. Invest Ophthalmol Vis Sci. 1980;19(11):1268–1273.
46. Jackson CR, Ruan GX, Aseem F, et al. Retinal dopamine mediates multiple dimensions of light-adapted vision. J Neurosci. 2012;32(27):9359–9368. doi:10.1523/JNEUROSCI.0711-12.2012
47. Barnard AR, Hattar S, Hankins MW, Lucas RJ. Melanopsin regulates visual processing in the mouse retina. Curr Biol. 2006;16(4):389–395. doi:10.1016/j.cub.2005.12.045
48. Papastergiou GI, Schmid GF, Riva CE, Mendel MJ, Stone RA, Laties AM. Ocular axial length and choroidal thickness in newly hatched chicks and one-year-old chickens fluctuate in a diurnal pattern that is influenced by visual experience and intraocular pressure changes. Exp Eye Res. 1998;66(2):195–205. doi:10.1006/exer.1997.0421
49. Yang G, Chen L, Grant GR, et al. Timing of expression of the core clock gene Bmal1 influences its effects on aging and survival. Sci Transl Med. 2016;8(324):324ra316. doi:10.1126/scitranslmed.aad3305
50. Baba K, Ribelayga CP, Michael Iuvone P, Tosini G. The retinal circadian clock and photoreceptor viability. Adv Exp Med Biol. 2018;1074:345–350.
51. Mollema NJ, Yuan Y, Jelcick AS, et al. Nuclear receptor Rev-erb alpha (Nr1d1) functions in concert with Nr2e3 to regulate transcriptional networks in the retina. PLoS One. 2011;6(3):e17494. doi:10.1371/journal.pone.0017494
52. Ait-Hmyed Hakkari O, Acar N, Savier E, et al. Rev-Erbα modulates retinal visual processing and behavioral responses to light. FASEB J. 2016;30(11):3690–3701. doi:10.1096/fj.201600414R
53. Wang S, Lin Y, Yuan X, Li F, Guo L, Wu B. REV-ERBα integrates colon clock with experimental colitis through regulation of NF-κB/NLRP3 axis. Nat Commun. 2018;9(1):4246. doi:10.1038/s41467-018-06568-5
54. Li Y, Peng L, Seto E. Histone deacetylase 10 regulates the cell cycle G2/M phase transition via a novel let-7-HMGA2-cyclin A2 pathway. Mol Cell Biol. 2015;35(20):3547–3565. doi:10.1128/MCB.00400-15
55. Xie H, Wang J, Jiang L, et al. ROS-dependent HMGA2 upregulation mediates Cd-induced proliferation in MRC-5 cells. Toxicol in Vitro. 2016;34:146–152. doi:10.1016/j.tiv.2016.04.001
56. Mansoori B, Mohammadi A, Ditzel HJ, et al. HMGA2 as a critical regulator in cancer development. Genes. 2021;12(2):269. doi:10.3390/genes12020269
57. Gao X, Dai M, Li Q, Wang Z, Lu Y, Song Z. HMGA2 regulates lung cancer proliferation and metastasis. Thorac Cancer. 2017;8(5):501–510. doi:10.1111/1759-7714.12476
58. Mansoori B, Duijf PHG, Mohammadi A, et al. Overexpression of HMGA2 in breast cancer promotes cell proliferation, migration, invasion and stemness. Expert Opin Ther Targets. 2020;24:255–265.
59. Noro B, Licheri B, Sgarra R, et al. Molecular dissection of the architectural transcription factor HMGA2. Biochemistry. 2003;42(15):4569–4577. doi:10.1021/bi026605k
60. Cleynen I, Van de Ven WJ. The HMGA proteins: a myriad of functions (Review). Int J Oncol. 2008;32(2):289–305.
61. Chen CY, Chang JT, Ho YF, Shyu AB. MiR-26 down-regulates TNF-alpha/NF-kappaB signalling and IL-6 expression by silencing HMGA1 and MALT1. Nucleic Acids Res. 2016;44(8):3772–3787. doi:10.1093/nar/gkw205
62. Lam MT, Cho H, Lesch HP, et al. Rev-Erbs repress macrophage gene expression by inhibiting enhancer-directed transcription. Nature. 2013;498(7455):511–515. doi:10.1038/nature12209
63. Sato S, Sakurai T, Ogasawara J, et al. A circadian clock gene, Rev-erbalpha, modulates the inflammatory function of macrophages through the negative regulation of Ccl2 expression. J Immunol. 2014;192(1):407–417. doi:10.4049/jimmunol.1301982
64. Lin Y, Wang S, Gao L, et al. Oscillating lncRNA Platr4 regulates NLRP3 inflammasome to ameliorate nonalcoholic steatohepatitis in mice. Theranostics. 2021;11(1):426–444. doi:10.7150/thno.50281
65. Reitz CJ, Alibhai FJ, Khatua TN, et al. SR9009 administered for one day after myocardial ischemia-reperfusion prevents heart failure in mice by targeting the cardiac inflammasome. Commun Biol. 2019;2:353. doi:10.1038/s42003-019-0595-z
66. Zhao W, Cui L, Huang X, et al. Activation of Rev-erbalpha attenuates lipopolysaccharide-induced inflammatory reactions in human endometrial stroma cells via suppressing TLR4-regulated NF-kappaB activation. Acta Biochim Biophys Sin. 2019;51(9):908–914. doi:10.1093/abbs/gmz078
67. Cui L, Xu F, Wang S, et al. Pharmacological activation of rev-erbalpha suppresses LPS-induced macrophage M1 polarization and prevents pregnancy loss. BMC Immunol. 2021;22(1):57. doi:10.1186/s12865-021-00438-4
68. Hong H, Cheung YM, Cao X, Wu Y, Li C, Tian XY. REV-ERBalpha agonist SR9009 suppresses IL-1beta production in macrophages through BMAL1-dependent inhibition of inflammasome. Biochem Pharmacol. 2021;192:114701. doi:10.1016/j.bcp.2021.114701
69. Karlen SJ, Miller EB, Burns ME. Microglia activation and inflammation during the death of mammalian photoreceptors. Annu Rev Vis Sci. 2020;6:149–169. doi:10.1146/annurev-vision-121219-081730
70. Wang M, Ma W, Zhao L, Fariss RN, Wong WT. Adaptive Muller cell responses to microglial activation mediate neuroprotection and coordinate inflammation in the retina. J Neuroinflammation. 2011;8:173. doi:10.1186/1742-2094-8-173
 © 2021 The Author(s). This work is published and licensed by Dove Medical Press Limited. The full terms of this license are available at https://www.dovepress.com/terms.php and incorporate the Creative Commons Attribution - Non Commercial (unported, v3.0) License.
By accessing the work you hereby accept the Terms. Non-commercial uses of the work are permitted without any further permission from Dove Medical Press Limited, provided the work is properly attributed. For permission for commercial use of this work, please see paragraphs 4.2 and 5 of our Terms.
© 2021 The Author(s). This work is published and licensed by Dove Medical Press Limited. The full terms of this license are available at https://www.dovepress.com/terms.php and incorporate the Creative Commons Attribution - Non Commercial (unported, v3.0) License.
By accessing the work you hereby accept the Terms. Non-commercial uses of the work are permitted without any further permission from Dove Medical Press Limited, provided the work is properly attributed. For permission for commercial use of this work, please see paragraphs 4.2 and 5 of our Terms.