")
Back to Journals » Cancer Management and Research » Volume 13
Clinical Value of Combined Detection of Serum sTim-3 and Pepsinogen for Gastric Cancer Diagnosis
Authors Chen L, Hong J, Hu R , Yu X, Chen X, Zheng S, Qin Y, Zhou X, Wang Y , Zheng L, Fang H, Liu P, Huang B
Received 13 July 2021
Accepted for publication 27 September 2021
Published 9 October 2021 Volume 2021:13 Pages 7759—7769
DOI https://doi.org/10.2147/CMAR.S328312
Checked for plagiarism Yes
Review by Single anonymous peer review
Peer reviewer comments 2
Editor who approved publication: Professor Harikrishna Nakshatri
Lingli Chen,1,* Jianfeng Hong,2,* Renjing Hu,3,* Xiaomei Yu,1 Xindong Chen,1 Shaoxiong Zheng,1 Yuan Qin,1 Xiumei Zhou,1 Yigang Wang,1 Liping Zheng,2 Hongming Fang,2 Pengfei Liu,4 Biao Huang1
1Department of Immunoassay Laboratory, College of Life Sciences and Medicine, Zhejiang Sci-Tech University, Hangzhou, People’s Republic of China; 2Department of Laboratory, Affiliated Xiaoshan Hospital, Hangzhou Normal University, Hangzhou, People’s Republic of China; 3Department of Laboratory, The Affiliated Wuxi No.2 People’s Hospital of Nanjing Medical University, Wuxi, People’s Republic of China; 4Department of Gastroenterology, The Jiangyin Clinical College of Xuzhou Medical University, Wuxi, People’s Republic of China
*These authors contributed equally to this work
Correspondence: Biao Huang
Immunoassay Laboratory, College of Life Sciences and Medicine, Zhejiang Sci-Tech University, Hangzhou, 310016, People’s Republic of China
Tel +86 571-86843187
Email [email protected]
Hongming Fang
Department of Laboratory, Affiliated Xiaoshan Hospital, Hangzhou Normal University, Hangzhou, 310016, People’s Republic of China
Tel +86 571 83865858
Email [email protected]
Purpose: The present study aimed to evaluate the clinical value of the combined detection of soluble T cell immunoglobulinand mucin domain molecule 3 (sTim-3) and pepsinogen (PG) in sera for gastric cancer (GC) diagnosis.
Patients and Methods: The double antibody sandwich method was used to establish a highly sensitive time-resolved fluorescence immunoassay for the detection of sTim-3. Serum sTim-3, PGI, and PGII levels in 149 GC patients (123 first-diagnosis GC patients and 26 post-GC patients), 81 patients with benign gastric disease (BGD), and 73 healthy controls were quantitatively detected. The clinical diagnostic value of the combined detection of sTim-3 and PG in GC was analyzed.
Results: Serum sTim-3 levels in GC (20.41 ± 9.55 ng/mL) and BGD (16.50 ± 9.76 ng/mL) patients were significantly higher (P < 0.001) than those in healthy controls (9.22 ± 3.40 ng/mL). Combined detection of sTim-3 and PGI/PGII (AUC: 0.9330, sensitivity: 86.44%, and specificity: 91.78%) showed a high diagnostic value for GC. When the level of PGI/PGII was less than 12.11 and that of sTim-3 was greater than 14.30 ng/mL, the positive rate of the control group was reduced to 0%, and the positive detection rate of GC was 54.47%. In addition, in post-operative patients, serum sTim-3 levels in the recurrence group (33.56 ± 4.91 ng/mL) were significantly higher than those in the no recurrence group (11.95 ± 5.16 ng/mL).
Conclusion: sTim-3 levels in BGD and GC sera were significantly higher than those in the control group sera. Additionally, sTim-3 serum levels can predict recurrence in post-operative patients. Compared with PG alone, the combined detection of serum PG and sTim-3 can significantly improve the detection sensitivity and specificity of BGD and GC.
Keywords: T cell immunoglobulin and mucin domain molecule 3, time-resolved fluorescence immunoassay, biomarker, gastric cancer
Introduction
Gastric cancer (GC) is the most common malignant tumor of the digestive system, and there are approximately one million GC patients worldwide.1 Although the incidence of GC has declined in the past few decades, the high mortality rate of GC remains a concern. While surgical resection and chemotherapy can safely and effectively prolong the survival of GC patients,2 effective treatment of patients diagnosed with advanced or metastatic GC remains difficult. Therefore, to improve the survival rate of GC patients, an early and accurate diagnosis is important. Currently, clinical diagnosis of GC mainly involves gastroscopy, which is a costly procedure. Moreover, the examinee experiences considerable discomfort during gastroscopy, limiting its potential in large-scale screening. Therefore, high-accuracy serum markers are urgently needed for the detection of GC. Several common tumor serum markers, such as carbohydrate antigens (CA72-4, CA12-5 and CA19-9) and carcinoembryonic antigen, have sensitivities in the range of 5–25.5%.3–8 The positive combined detection rate of the above-mentioned markers reaches 60.9%.5 However, these serum markers show a low sensitivity in the diagnosis of GC. Pepsinogen (PG) is a relatively mature serum marker for gastric diseases;9–11 serum PGI and PGII levels and the PGI/PGII ratio are potential diagnostic indicators of GC.12 However, the detection rate of PG in GC is low, with a sensitivity of 59.3–72.1% and specificity of 61.8–87.39%.13–15 Therefore, there is a need to identify new serum markers, which, in addition to PG, can improve the diagnostic sensitivity of GC.
T cell immunoglobulin and mucin domain molecule 3 (Tim-3) is a tumor immune checkpoint molecule,16 and it can be found in two forms: soluble (sTim-3) and membrane-bound Tim-3. Serum sTim-3 is mainly shed from cells expressing this molecule (eg, monocytes and CD8+T cells) as well as tumor cells.17–21 Tim-3 expression on T cells is related to GC staging, and this expression may be related to the occurrence and development of GC.14 However, these studies were conducted at the cellular level and no study has reported whether serum sTim-3 can serve as a clinical auxiliary diagnostic marker for GC.
In the present study, the highly sensitive time-resolved fluorescence immunoassay (TRFIA) was used to quantitatively detect the serum levels of sTim-3, PGI, and PGII in GC patients and healthy group and analyze the value of detecting sTim-3 alone and in combination with PG for GC diagnosis.
Materials and Methods
Instruments and Reagents
Tim-3 antigen and two antibodies against different epitopes of this antigen—capture and detection antibodies—were purchased from Sino Biological Inc. PGI-TRFIA detection kit (China), PGII-TRFIA detection kit, and the enhancement solution were provided by Zhejiang Boshi Biotechnology Co., Ltd (China). Tris, ProClin 300, bovine serum albumin (BSA), Sephadex-G50, and other reagents were purchased from Shanghai Xibao Biotechnology Company (China).
The time-resolved immunofluorescence analyzer, DEM-3 plate washer, 96-well plates, and micro-oscillator were purchased from Foshan Daan Medical Equipment Co., Ltd., Guangzhou Darui Biotechnology Co., Ltd., Xiamen Yunpeng Technology Development Co., Ltd., and Jiangsu Kangjian Medical Products Co., Ltd., respectively.
Study Population
In total, 149 patients with GC (123 patients were first-diagnosis with GC, while 26 were postoperative patients with GC), 81 patients with BGD (17 cases of gastric polyps, 14 cases of atrophic gastritis, 13 cases of erosive gastritis, 12 cases of gastric ulcer, 11 cases of superficial gastritis, 10 cases of chronic gastritis, and 4 cases of gastric mucosal injury), and 73 healthy individuals from Zhejiang Xiaoshan Hospital and Jiangyin Clinical College of Xuzhou Medical University were included in this study. A serum sample was collected from each study participant. All healthy subjects were adults who underwent a physical examination at the hospital and tested negative for tumor markers (eg, CEA, CA12-5, CA19-9, and CA72-4) and Helicobacter pylori infection; in addition, they had no history of stomach disease. As per the 8th edition of the TNM staging system for GC promulgated by the International Union Against Cancer (UICC) and the American Cancer Council (AJCC), we divided the newly diagnosed GC patients into stages I, II, III, and IV. The postoperative group should encompass those patients who have undergone surgical resection (the time of surgery being 1–7 years before blood collection). This study was conducted in accordance with the Declaration of Helsinki and approved by the ethics committee of the Affiliated Xiaoshan Hospital (approval no. 2021–011). Informed consent was obtained from all registered subjects.
Serum Collection and Storage
Venous blood (5 mL) was collected from participants after overnight fasting and centrifuged at 4000 rpm for 5 min. Next, the supernatant (serum) was collected and stored at ‒80 °C until use.
Double Antibody Sandwich Method-Based TRFIA to Detect sTim-3 in Serum22
The experimental steps were as follows:
- Buffer configuration: elution buffer (50 mmol/L Tris-HCl, 0.2% BSA, 0.05% ProClin; pH 7.8); labeling buffer (50 mmol/L Na2CO3-NaHCO3; pH 9.0); coating buffer (50 mmol/L Na2CO3-NaHCO3; pH 9.6); standard buffer (50 mmol/L Tris-HCl,0.9% NaCl, 0.5% BSA, 0.05% (v/v) Proclin300, pH 7.8); analysis buffer (50 mmol/L Tris-HCl, 0.9% NaCl, 0.5% BSA, 0.0008% DTPA, 0.0005% PHloxine B, 0.01% Tween-40, 0.05% Proclin 300; pH 7.8); blocking solution (50 mmol/L Tris-HCl, 0.9% NaCl, 1% BSA, 0.05% NaN3; pH 7.8); washing buffer (50 mmol/L Tris-HCl, 0.9% NaCl, 0.02% Tween-20, 0.01% Proclin 300; pH 7.8).
- Antibody coating: The capture antibody was diluted to 2 µg/mL with the coating buffer, and 100 µL diluted antibody solution was added to each well of a 96-well plate. After overnight incubation at 4 °C, the plate was washed once with washing buffer, and 150 µL blocking solution was added to each well. Next, the non-specific binding sites were blocked for 2 h at room temperature, and the blocking solution was discarded. After drying, the antibody-coated plate was stored at ‒20 °C until use.
- Labeling antibody: A total of 300 µg of detection antibody was placed in an ultrafiltration tube and mixed with 200 µL labeling buffer. The antibody mixture was centrifuged at 10,000 rpm for 6 min. After discarding the supernatant, 300 µL labeling buffer was added and centrifuged at 10,000 rpm for 6 min. This process was repeated eight times. Finally, 50 µL labeling buffer was added to the tube, and the centrifuge tube was inverted and centrifuged at 3000 rpm for 1 min to collect the filtrate containing the detection antibody. The collected antibody was mixed with 60 µg diethylenetriaminetriacetic acid-Eu3+, and the mixture was incubated at 30 °C overnight. The following day, the labeled antibody was purified using Sephadex G50 and stored in the eluent containing 0.2% BSA. Finally, the antibody labeled with acid-Eu3+ (Eu3+-McAb) was collected and stored at ‒20 °C.
- The sTim-3 antigen was diluted to different concentrations (0, 6.25, 12.5, 25, 50, and 100 ng/mL) using a standard buffer, where a concentration of 0 indicated the standard buffer not containing the sTim-3 antigen.
- Measurement of sTim-3 concentration in serum: A total of 100 µL of standard solution and serum samples were added to a 96-well microplate coated with 2 µg/mL anti-Tim-3 capture antibody. The plate was incubated with shaking at 37 °C for 1 h and washed twice with washing buffer. Then, 100 µL Eu3+-McAb (diluted 1:1000 with analysis buffer) was added to each well. The plate was incubated with shaking at 37 °C for 2 h and washed six times with washing buffer. A total of 100 μL of enhancement solution was added to each well, following which the plate was incubated with shaking on a 96-well plate shaker for 3 min. Finally, the fluorescence intensity was measured using a time-resolved immunofluorescence analyzer.
Determination of Serum PGI and PGII Levels
The serum levels of PGI and PGII were determined using the PGI-TRFIA and PGII-TRFIA detection kits (Zhejiang Boshi Biotechnology Co., Ltd (China)) based on the manufacturer’s instructions accompanying.
Statistical Analysis
SPSS version 21.0 was used for data analysis. Binary logistic regression was used to fit the combined variables, and the fitted probability variables were used to construct the receiver operating characteristic curve (ROC) curve of the combined detection. Quantitative data are expressed as the mean ± standard deviation (SD), and analysis of variance (ANOVA) was used to analyze the differences between the groups. GraphPad Prism (GraphPad Software Company) was used for statistical analyses, and the Youden index was used to determine the best sensitivity and specificity of the combined diagnosis.
Results
sTim-3, PGI, and PGII Levels and the PGI/PGII Ratio in Serum Samples Collected from Different Participant Groups
Serum PGI level (123.93 ± 79.16 ng/mL) in BGD patients was significantly lower than that in healthy individuals (146.89 ± 47.68 ng/mL) (Figure 1A; P < 0.05). The average PGI level in GC patients did not markedly differ from that in the control group, whereas the average PGI level in BGD patients was lower than that in the control group. As shown in Figure 1A, PGI levels in some BGD and GC patients were higher or lower than the average.
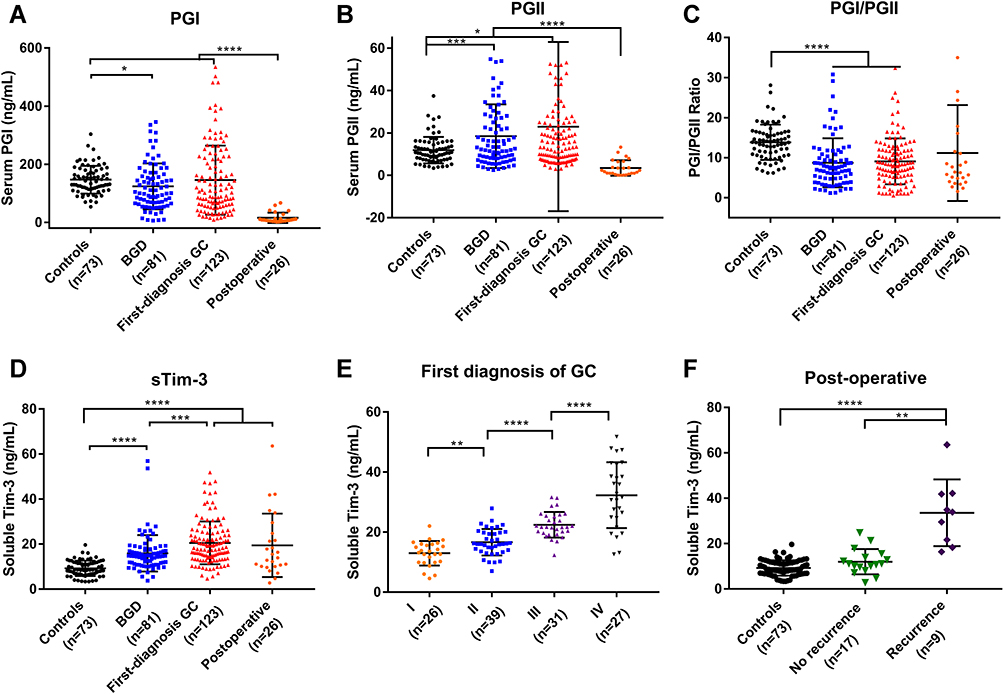 |
Figure 1 (A) PGI levels in controls and BGD and first-diagnosis GC patients; (B) PGII levels in controls and BGD and first-diagnosis GC patients; (C) PGI/PGII ratio in controls and BGD and first-diagnosis GC patients; (D) sTim-3 levels in controls and BGD and first-diagnosis GC patients; (E) sTim-3 levels in first-diagnosis GC patients (stage I, stage II, stage III, and stage IV); (F) sTim-3 levels in controls, recurrence group after GC surgery, and no recurrence group after GC surgery. *P < 0.05; **P < 0.01; ***P < 0.001; ****P < 0.0001. |
Serum PGII levels (22.94 ± 13.66 ng/mL) in first-diagnosis GC and BGD patients (18.39 ± 14.94 ng/mL) were significantly higher than that in healthy individuals (11.94 ± 6.24 ng/mL) (Figure 1B; P < 0.05).
The serum PGI/PGII ratio in first-diagnosis GC (9.25 ± 4.43) and BGD patients (9.24 ± 5.43) was significantly lower than that in healthy individuals (13.91 ± 4.49) (Figure 1C; P < 0.05).
Serum sTim-3 levels in healthy controls (9.22 ± 3.40 ng/mL) and BGD (16.50 ± 9.76 ng/mL) and first-diagnosis GC patients (20.41 ± 9.55 ng/mL) showed a gradual upward trend, and the differences among the groups were significant. (Figure 1D; P < 0.05).
Serum PGI and PGII levels in 26 patients after gastrectomy were significantly lower than those in the control group (P < 0.0001). Notably, serum sTim-3 levels (19.57 ± 2.76 ng/mL) in these 26 patients were significantly higher than those in the control group (9.23 ± 0.40 ng/mL) (P < 0.001). Upon initial diagnosis, first-diagnosis GC patients were divided into stages I, II, III, and IV, depending on the clinical stage of the disease. As shown in Figure 1E, serum sTim-3 levels gradually increased (P < 0.01) at each GC stage. Based on the recovery of patients after GC, they were divided into two groups: those with recurrence and those without recurrence. Post-operative recurrence was defined as a positive outcome at consecutive bimonthly clinical examinations or annual computed tomography (CT) scans in the hospital. As shown in Table 1 and Figure 1F, serum sTim-3 levels in the recurrence group (33.56 ± 4.91 ng/mL) were significantly higher than those in the no recurrence group (11.95 ± 5.16 ng/mL).
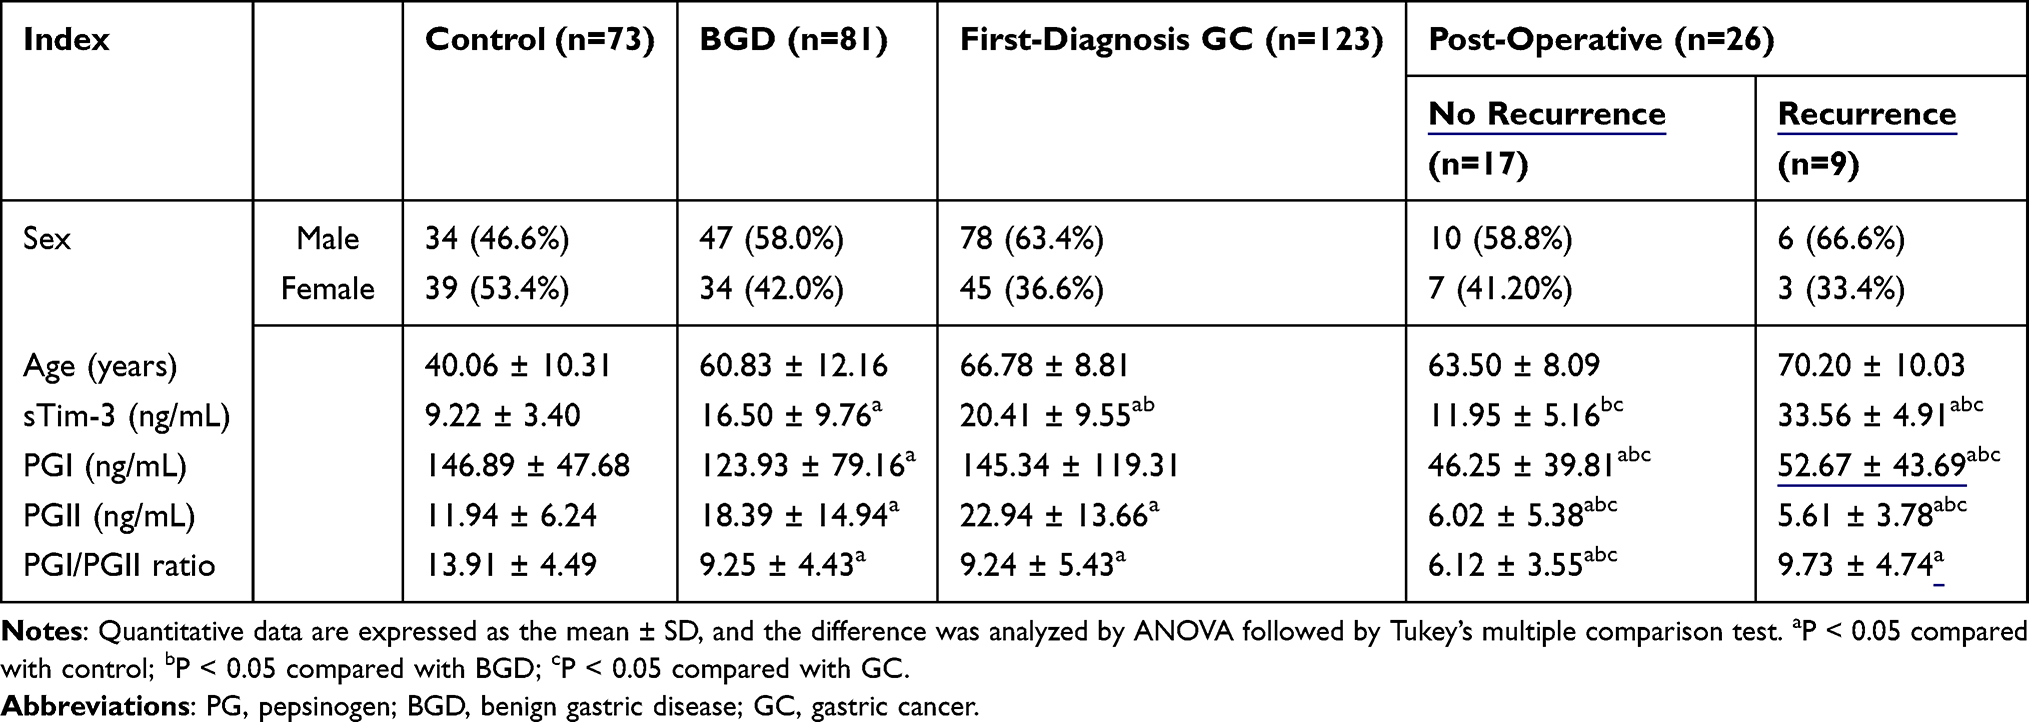 |
Table 1 Serum Indices of Control, BGD, First-Diagnosis GC, and Post-Operative GC Groups |
Group Positive Rate
The cut-off values of PGI and PGII levels and the PGI/PGII ratio were determined according to the values provided in the instructions of the PG commercial kit. The normal range is 70 < PGI < 210 ng/mL, PGII < 23 ng/mL, and PGI/PGII > 6. If the value exceeds the normal range, gastric ulcer, AG, chronic gastritis, gastric mucosal damage, or GC may occur. The cutoff value of sTim-3 level was calculated as mean + 2 SD. Given that the master cells of the fundus gland and cervical mucus cells are removed after surgical resection, the levels of PGI and PGII were low in serum samples collected from such GC patients. Thus, GC surgery was excluded from this analysis. We considered serum samples with PGI or PGII levels or PGI/PGII ratio not outside the normal range as PG abnormalities (Table 2). PG had a low positive detection rate for BGD and first-diagnosis GC. When sTim-3 levels exceeded 16.03 ng/mL, the positive detection rate of GC reached 61.79%, which was higher than that of PG abnormality (55.28%). Furthermore, the positive detection rate in the control group (2.74%) was significantly lower than that of PG abnormality (15.01%). With PG abnormalities or sTim-3 levels exceeding 16.03 ng/mL, the controls showed a high positive detection rate of up to 17.80%. Compared with PG, the positive detection rate of BGD (64.20%) and GC (78.05%) was significantly improved. With PG abnormalities and sTim-3 levels exceeding 16.03 ng/mL, the positive detection rate of the controls was 0%, while the positive detection rate of GC reached 32.52%. To further improve the sensitivity of detection and identify a more effective combination, the best detection combination was obtained using the ROC curve, allowing the cutoff value to be optimized through the ROC score.
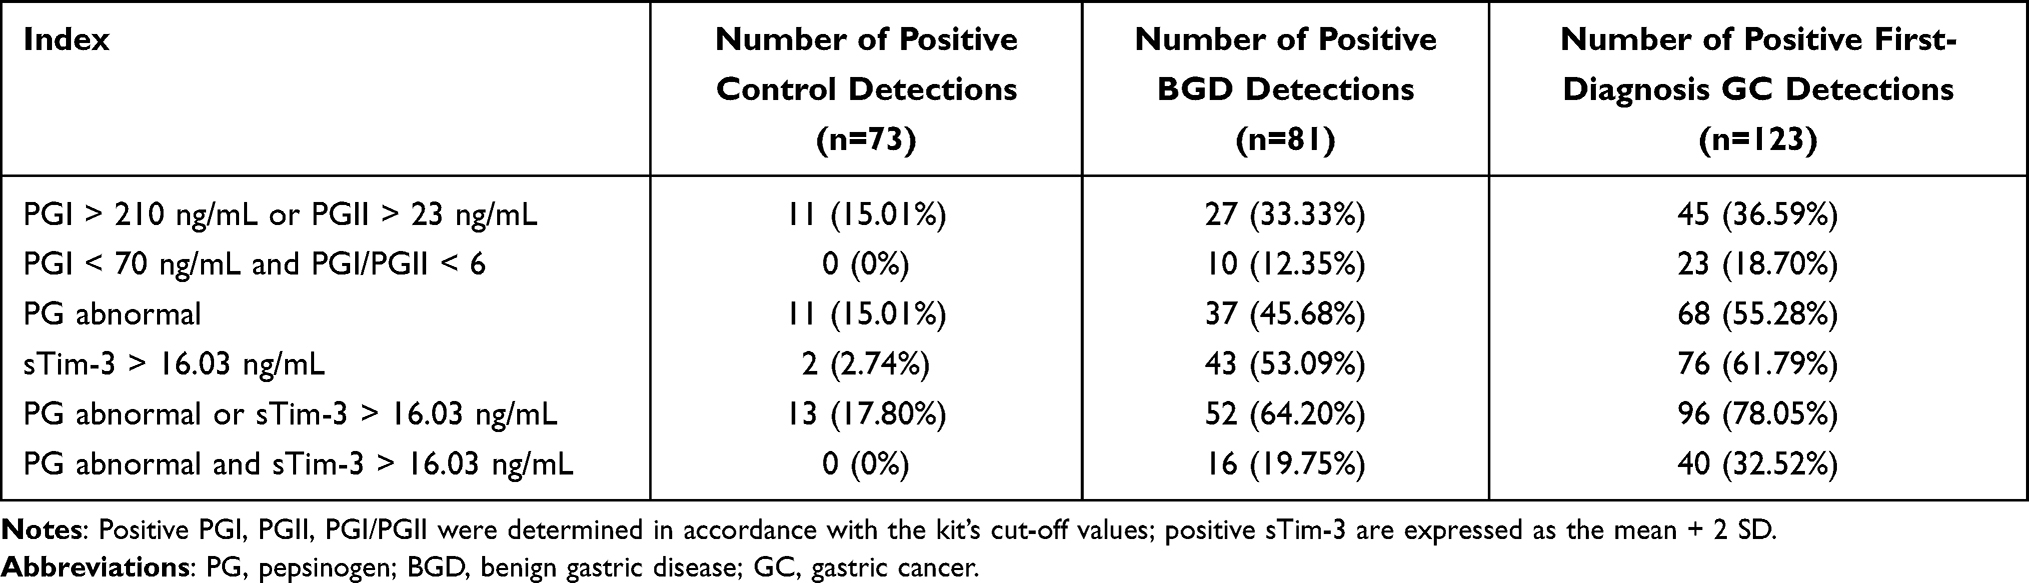 |
Table 2 Positive Detection Rates of PGI, PGII, and sTim-3 Levels and the PGI/PGII Ratio in the Control, BGD, and First-Diagnosis GC Groups |
Clinical Value of sTim-3, PGI, and PGII Levels and the PGI/PGII Ratio for the Initial Diagnosis of GC
As shown in Figure 2 and Table 3, the sensitivity and specificity of BGD and GC diagnosis according to the cut-off values specified by the manufacturer of the PG detection kits, as well as the potential of their clinical detection, are limited. Therefore, we constructed a ROC curve, re-determined the cutoff value using the Youden index, and evaluated the clinical value of sTim-3, PGI, and PGII levels and the PGI/PGII ratio for BGD diagnosis as well as the initial diagnosis of GC.
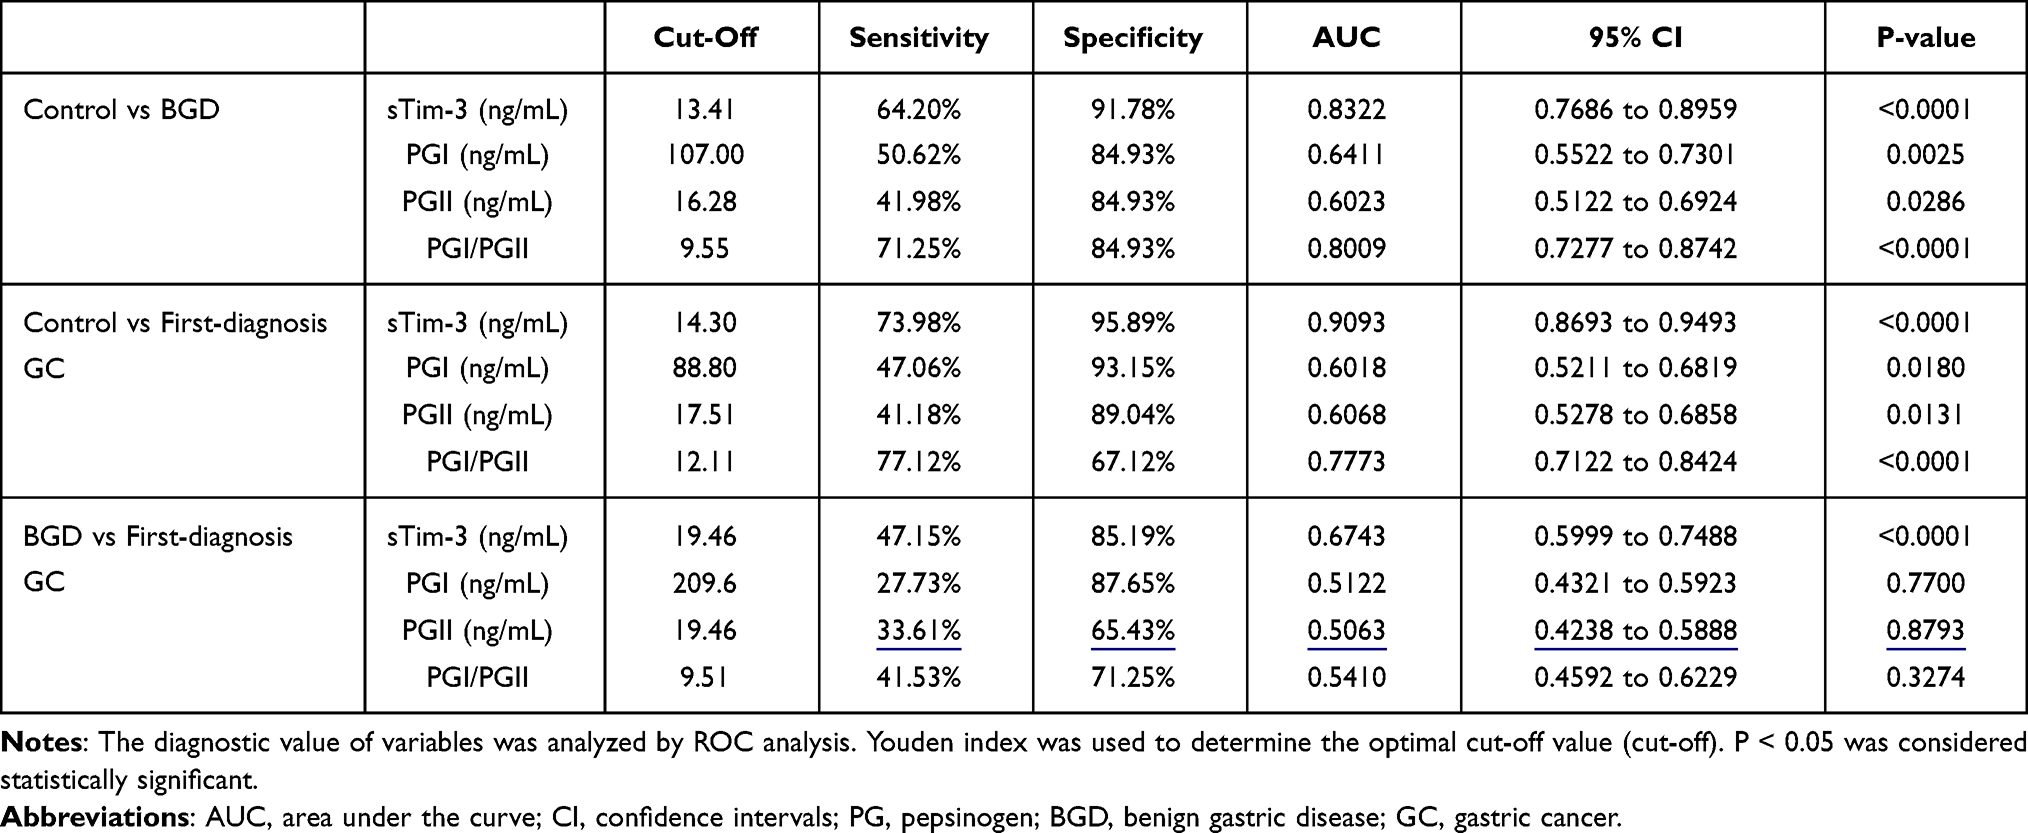 |
Table 3 Independent Diagnostic Value of Serum Markers in BGD and First-Diagnosis GC |
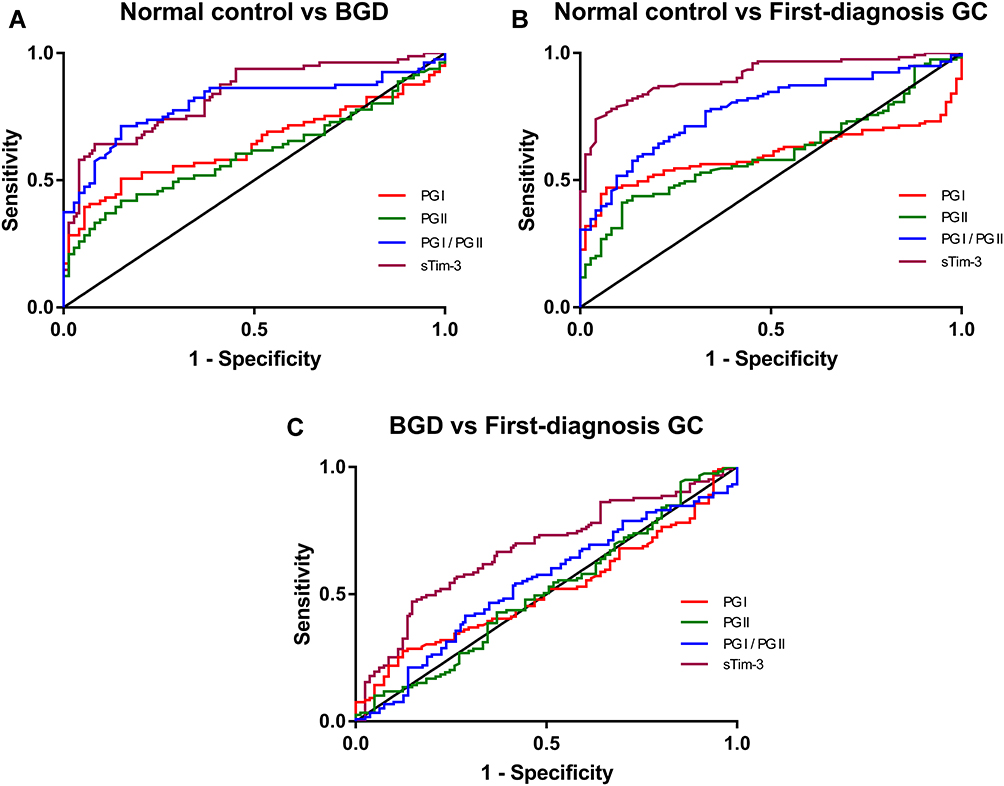 |
Figure 2 Independent diagnostic value of serum sTim-3, PGI, and PGII levels and the PGI/PGII ratio in BGD and first-diagnosis GC analyzed by ROC. (A) ROC curves of serum marker levels between the controls and BGD patients; (B) ROC curves of serum marker levels between the controls and first-diagnosis GC patients; (C) ROC curves of serum marker levels between BGD and first-diagnosis GC patients. |
As shown in Figure 2A and Table 3, when the cutoff value of PGI/PGII ratio was 9.55, as determined using the Youden index, the PGI/PGII ratio detected BGD independently (area under the ROC curve (AUC): 0.8009, sensitivity: 71.25%, and specificity: 84.93%) compared with other indicators. The sensitivity, specificity, and accuracy were high, and thus, the PGI/PGII ratio could serve as a suitable diagnostic biomarker for BGD.
As shown in Figure 2B and Table 3, sTim-3 is sensitive to the initial diagnosis of GC. Based on sTim-3 levels (AUC: 0.9093, sensitivity: 73.98%, and specificity: 95.89%) an initial diagnosis of GC could be independently made. According to the Youden index, the cutoff value of sTim-3 level was 14.30 ng/mL.
As shown Figure 2C and Table 3, compared with the other three indicators, detection with sTim-3 alone (AUC: 0.6743, sensitivity: 47.15%, and specificity: 85.19%) can distinguish BGD from newly diagnosed GC to a certain extent.
Combined Clinical Value of Serum sTim-3, PGI, and PGII Levels and the PGI/PGII Ratio for GC Detection
Three indicators, which could help improve the diagnosis of BGD and GC, were selected, and the detection power of certain combinations of these indicators was analyzed by constructing an ROC curve. As shown in Figure 3A and Table 4, the combination of sTim-3 levels and the PGI/PGII ratio (AUC: 0.8879, sensitivity: 79.01%, and specificity: 87.67%) effectively diagnosed BGD.PGI levels, the PGI/PGII ratio, and sTim-3 levels were used in combination for the initial diagnosis of GC (Figure 3B and Table 4). The combination of sTim-3 levels and the PGI/PGII ratio (AUC: 0.9330, sensitivity: 86.44%, and specificity: 91.78%) could effectively diagnose GC.
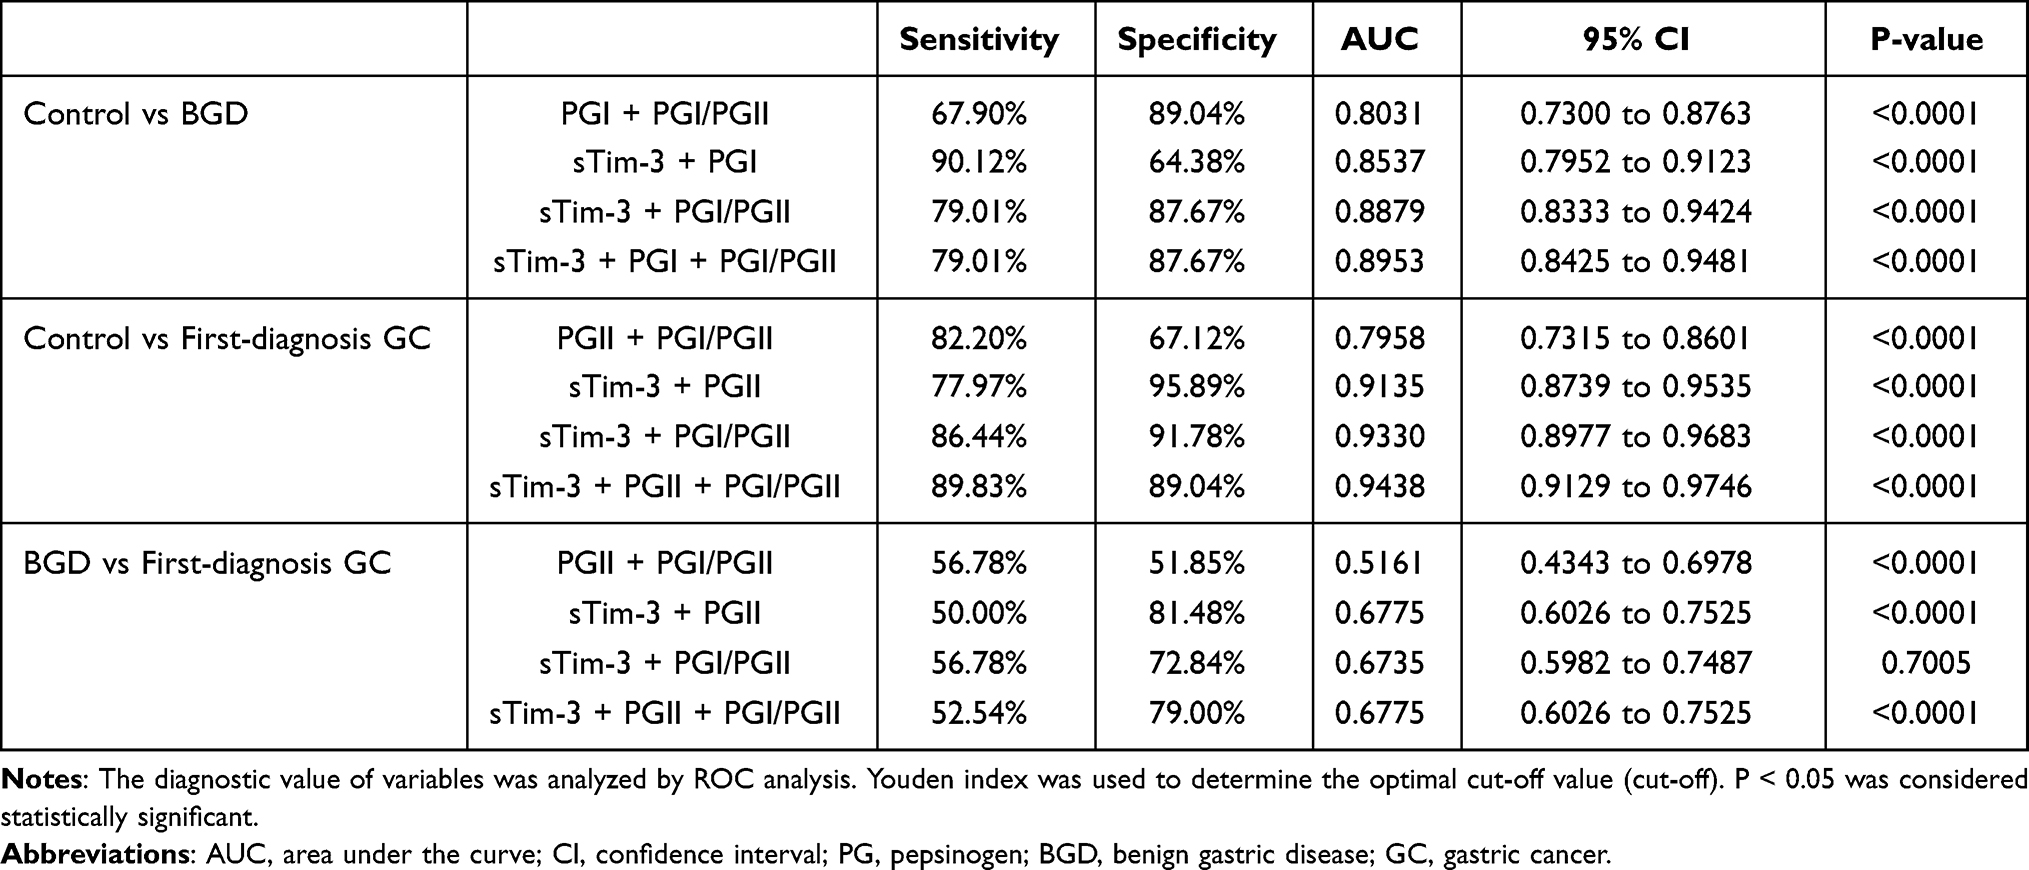 |
Table 4 Diagnostic Value of Serum Marker Combinations in BGD and First-Diagnosis GC |
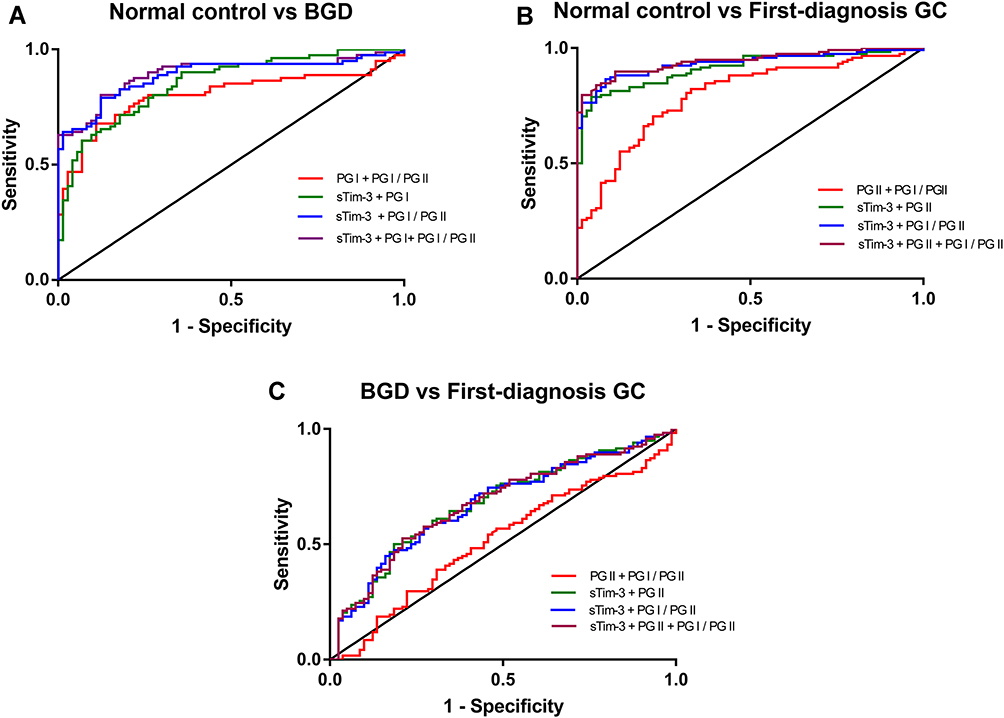 |
Figure 3 Independent diagnostic value of serum sTim-3, PGI, and PGII levels and the PGI/PGII ratio in BGD and first-diagnosis GC patients was analyzed by ROC analysis. (A) ROC curves of serum marker levels between the controls and BGD patients; (B) ROC curves of serum marker levels between the control and first-diagnosis GC patients; (C) ROC curves of serum marker levels between BGD and first-diagnosis GC patients. |
As shown in Figure 3C and Table 4, the combination of sTim-3 and PGII levels (AUC: 0.6775, sensitivity: 50.00%, and specificity: 81.48%) could effectively distinguish between newly diagnosed GC and BGD.
Participants Showed a Positive Detection Rate After Redefining the Cut-Off Value According to the ROC Curve
Two indicators with high diagnostic value were selected based on the combined test. The value of the indicator was considered critical when tested individually. The combination of sTim-3 levels and the PGI/PGII ratio had a high diagnostic value in GC (Table 3), with the cut-off values of sTim-3 and PGI/PGII levels being 14.30 and 12.11 ng/mL, respectively. When the positive detection rate of the controls was 0%, the positive detection rate of the PGI/PGII ratio < 12.11 and sTim-3 level > 14.30 ng/mL for GC was 54.47%. Compared with PG abnormalities and sTim-3 levels exceeding 16.03 ng/mL (32.52%), the positive detection rate with the PGI/PGII ratio < 12.11 and sTim-3 level > 14.30 ng/mL increased by approximately 20% (Table 5). PGII level > 19.46 ng/mL and sTim-3 level > 19.46 ng/mL are also critical for distinguishing BGD from GC. When the positive detection rate of the control group was 0%, the positive detection rate of BGD and GC was 3.70% and 20.33%, respectively. Although the positive detection rate of GC decreased, it retained some value for distinguishing GC from BGD.
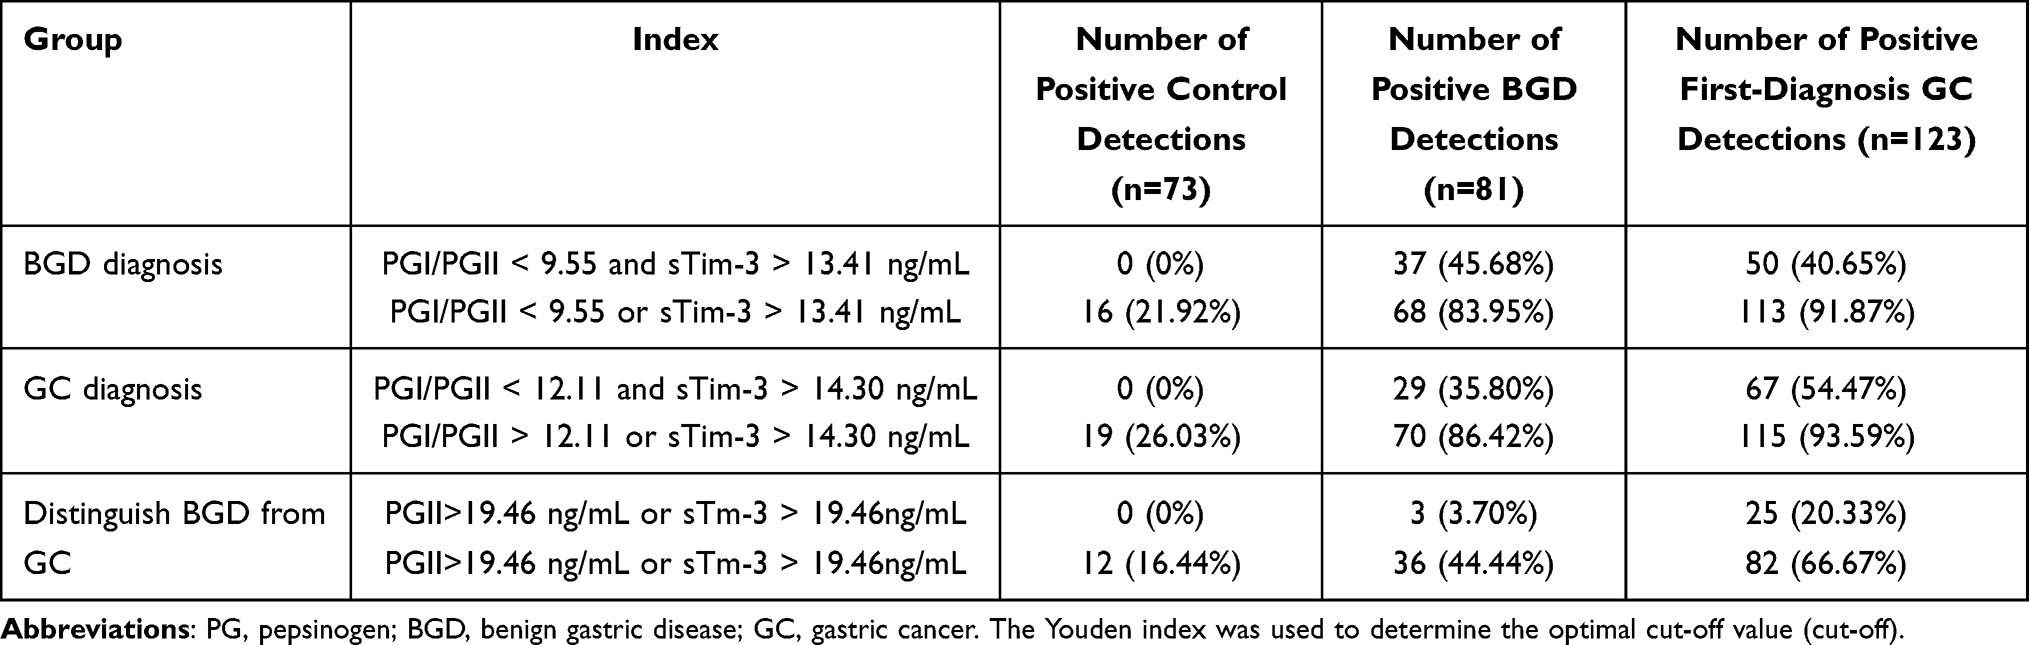 |
Table 5 Positive Detection Rate of the New Cut-Off Value of Combined Detection in BGD and GC |
Discussion
Currently, GC is clinically diagnosed by gastroscopy and tissue biopsy. However, these methods are expensive and cause trauma to the human body; therefore, they are not conducive for large-scale and early screening. Compared with gastroscopy and tissue biopsy, GC diagnosis using serum markers is non-invasive and cost-effective and allows real-time monitoring of the course of the disease. In this study, the combined detection of sTim-3 and PG in patient serum samples was used to analyze their diagnostic value for GC.
PG is mainly produced by the main cells of the fundus glands, and its level can reflect the atrophy of the gastric mucosa.23 Serum PG levels not only reflect current atrophy of the stomach but also predict the risk of developing GC.24,25 Serum PGI and PGII levels and the PGI/PGII ratio are closely related to the occurrence of GC and gastric precancerous lesions.26 Changes in serum PG levels are attributed to three main reasons: H. pylori infection, inflammation, and atrophic changes in the stomach. In H. pylori-induced gastritis, the serum PGI and PGII levels increase after the gastric glands are stimulated by H. pylori. Compared with PGI levels, PGII levels increase substantially, while the PGI/PGII ratio decreases. When the stomach undergoes atrophic changes, serum PGI levels decrease, while PGII levels remain stable or only increase marginally, resulting in a decrease in the PGI/II ratio.27–29 Serum PG levels are also related to inflammatory cell infiltration in the gastric mucosa and changes in gastric gland density.10 We found that with the progress of GC, gastric atrophy, intestinal metaplasia, and dysplasia further aggravate. Moreover, serum PGI levels decrease, serum PGII levels increase, and the PGI/PGI ratio gradually decreases.
Tim-3 is expressed in different cells, and its two-way regulation is crucial for immune regulation.30,31 Clinically, anti-Tim-3 antibodies can be used to promote the secretion of cytokines, such as interferon (IFN)-γ, thereby enhancing the activation degree of macrophages. The Tim-3/galectin-9 signaling pathway can inhibit the immune function of T cells to promote T cell tolerance, which can control the occurrence and development of related diseases.32 In recent years, the expression and role of Tim-3 in several tumors has garnered considerable research attention. Tim-3 is expressed in various tumor tissues.33–36 In GC, Tim-3 may inhibit the secretion of IFN-γ and tumor necrosis factor-α to inhibit the function of T cells, thereby participating in the occurrence and development of GC. In addition to T cells, the expression of Tim-3 in monocytes or macrophages may be associated with GC progression.37 Serum sTim-3 is mainly produced by cell shedding, which refers to the shedding mediated by metalloproteinases (a disintegrin and metalloprotease [ADAM] 10 and ADAM17).38,39 The changes in serum sTim-3 levels are related to the expression of Tim-3 in immune cells. During the development of GC, the expression of Tim-3 in immune cells (natural killer and CD8+T cells) is upregulated,14,40–42 which may be the main reason for the significantly increased serum sTim-3 levels in newly diagnosed GC patients than in healthy individuals.
A previous study combined serum miR-101-3p (a small non-coding RNA molecule) and PGI levels and the PGI/PGII ratio for the detection of GC. The sensitivity of this method was 77.91%, and the specificity reached 91.89%,13 indicating satisfactory diagnostic value. In the current study, the serum sTim-3 and PGI levels and the PGI/PGII ratio were used in combination for the detection of GC. The sensitivity of this method was 86.44%, and the specificity was 91.78%. This aspect reflects the improved diagnostic value of sTim-3 for GC.
Here, we also showed that serum sTim-3 levels in BGD patients significantly differed from those in the controls and that the increase in serum sTim-3 levels was related to inflammation to a certain extent. Regulatory T cell (Treg), inflammatory tissue-associated memory T cell (mTreg), and non-associated resting T cell (rTreg) subsets are the main immunosuppressors. mTreg proportions are elevated during the inflammatory phase, and they accumulate during inflammation, significantly elevating Tim-3 expression.43 Therefore, high Tim-3 expression is associated with inflammation. In addition, the combination of sTim-3 and PGII levels (AUC: 0.6775, sensitivity: 50.00%, and specificity: 81.48%) is valuable in distinguishing BGD from GC, and the combination of the two indicators can provide a clinical reference value for distinguishing BGD from GC. In the current study, serum sTim-3 levels in the controls and BGD and first-diagnosis GC patients gradually increased, which may be because the patients experienced inflammation first and then developed cancer, resulting in high serum sTim-3 levels.
The GC and recurrent GC samples were separately evaluated because PGI and PGII are secreted by gastric mucosa cells. After gastrectomy or partial gastrectomy, numerous gastric mucosa cells secreting PGI and PGII are lost, leading to low levels of PGI and PGII in the serum. If they are evaluated together, the accuracy of detecting GC samples using PG levels will be affected. Notably, we divided GC patients into four clinical stages at initial diagnosis. With the progress of staging (ie, from stages I to IV), the levels of serum sTim-3 gradually increased. Post-operative GC patients were divided into recurrence and no recurrence groups to further explore the diagnostic value of serum sTim-3 levels for post-operative GC. The recurrence group had higher serum sTim-3 levels than the no recurrence group. Thus, we hypothesized that sTim-3 levels are related to GC recurrence. Tim-3 is also associated with the poor prognosis of patients with different types of tumors.36 Our results suggest that serum sTim-3 levels can be used to monitor the progression of GC and post-operative recovery.
In this study, TRFIA was used to quantitatively determine the serum levels of sTim-3 and PG. TRFIA has the advantages of high sensitivity and stability.44 This method is convenient for clinical diagnosis using the quantitative determination of serum sTim-3 and PG levels. Our results show that serum sTim-3 levels can be used to distinguish the controls from GC patients; in addition, they can be combined with PG levels as an auxiliary indicator for the early diagnosis of GC. When the PGI/PGII ratio was less than 12.11 and sTim-3 levels exceeded 14.30 ng/mL, the positive detection rate of the controls declined from 15.01% to 0%, although the positive detection rate of GC when PG alone was detected was negligibly reduced. In addition, when both PGII and sTim-3 levels exceeded 19.46 ng/mL, the positive detection rate of the controls, BGD, and GC was 0%, 3.70%, and 20.33%, respectively, indicating its use in distinguishing BGD from GC.
Conclusion
Serum sTim-3 levels in BGD and GC patients were significantly higher than those in healthy controls. sTim-3 may also help in monitoring the progression of GC and post-operative recurrence of GC. The detection of GC by the combined detection of serum sTim-3 and PG levels significantly improved their individual sensitivity and helped in distinguishing BGD from GC.
Funding
Funding was provided by the Social Development Fund of Zhejiang Province (No. LGF20H200008), the Key Research and Development Program of Zhejiang Province (No. 2020C03066), the National Natural Science Foundation of China (grant nos. 31670857 and 31700737, and the Key Research & Development Program of Jiangsu Province (BE2020637).
Disclosure
The authors report no conflicts of interest in this work.
References
1. Smyth EC, Nilsson M, Grabsch HI, van Grieken NC, Lordick F. Gastric cancer. Lancet. 2020;396(10251):635–648. doi:10.1016/S0140-6736(20)31288-5
2. Emoto S, Ishigami H, Yamashita H, Yamaguchi H, Kaisaki S, Kitayama J. Clinical significance of CA125 and CA72-4 in gastric cancer with peritoneal dissemination. Gastric Cancer. 2012;15(2):154–161. doi:10.1007/s10120-011-0091-8
3. He CZ, Zhang KH, Li Q, Liu XH, Hong Y, Lv NH. Combined use of AFP, CEA, CA125 and CAl9-9 improves the sensitivity for the diagnosis of gastric cancer. BMC Gastroenterol. 2013;13:87. doi:10.1186/1471-230X-13-87
4. Huang ZB, Zhou X, Xu J, et al. Prognostic value of preoperative serum tumor markers in gastric cancer. World J Clin Oncol. 2014;5(2):170–176. doi:10.5306/wjco.v5.i2.170
5. Chen C, Chen Q, Zhao Q, Liu M, Guo J. Value of combined detection of serum CEA, CA72-4, CA19-9, CA15-3 and CA12-5 in the diagnosis of gastric cancer. Ann Clin Lab Sci. 2017;47(3):260–263.
6. Yu J, Zheng W. An alternative method for screening gastric cancer based on serum levels of CEA, CA19-9, and CA72-4. J Gastrointest Cancer. 2018;49(1):57–62. doi:10.1007/s12029-016-9912-7
7. Miao J, Liu Y, Zhao G, et al. Feasibility of plasma-methylated SFRP2 for early detection of gastric cancer. Cancer Control. 2020;27(2):1073274820922559. doi:10.1177/1073274820922559
8. Huang C, Liu Z, Xiao L, et al. Clinical significance of serum CA125, CA19-9, CA72-4, and fibrinogen-to-lymphocyte ratio in gastric cancer with peritoneal dissemination. Front Oncol. 2019;9:1159. doi:10.3389/fonc.2019.01159
9. Miftahussurur M, Waskito LA, Aftab H, et al. Serum pepsinogens as a gastric cancer and gastritis biomarker in South and Southeast Asian populations. PLoS One. 2020;15(4):e0230064. doi:10.1371/journal.pone.0230064
10. Chiang TH, Chiu SY, Chen SL, et al. Serum pepsinogen as a predictor for gastric cancer death: a 16-year community-based cohort study. J Clin Gastroenterol. 2019;53(5):e186–e193. doi:10.1097/MCG.0000000000000992
11. Bang CS, Lee JJ, Baik GH. Diagnostic performance of serum pepsinogen assay for the prediction of atrophic gastritis and gastric neoplasms: protocol for a systematic review and meta-analysis. Medicine. 2019;98(4):e14240. doi:10.1097/MD.0000000000014240
12. Zoalfaghari A, Aletaha N, Roushan N, Taslimi R, Foroutan H, Faridnia B. Accuracy of pepsinogens for early diagnosis of atrophic gastritis and gastric cancer in Iranian population. Med J Islam Repub Iran. 2014;28:150.
13. Zeng W, Zhang S, Yang L, et al. Serum miR-101-3p combined with pepsinogen contributes to the early diagnosis of gastric cancer. BMC Med Genet. 2020;21(1):28. doi:10.1186/s12881-020-0967-8
14. Yu G, Wang GX, Wang HG, Mo FF, Tang BB. The value of detecting pepsinogen and gastrin-17 levels in serum for pre-cancerous lesion screening in gastric cancer. Neoplasma. 2019;66(4):637–640. doi:10.4149/neo_2018_180825N647
15. Yu J, Zhang H, Sun S, Sun S, Li L. The effects of Tim-3 activation on T-cells in gastric cancer progression. Oncol Lett. 2019;17(2):1461–1466.
16. Gantuya B, Oyuntsetseg K, Bolor D, et al. Evaluation of serum markers for gastric cancer and its precursor diseases among high incidence and mortality rate of gastric cancer area. Gastric Cancer. 2019;22(1):104–112. doi:10.1007/s10120-018-0844-8
17. Qin S, Xu L, Yi M, Yu S, Wu K, Luo S. Novel immune checkpoint targets: moving beyond PD-1 and CTLA-4. Mol Cancer. 2019;18(1):155. doi:10.1186/s12943-019-1091-2
18. Zhuang X, Zhang X, Xia X, et al. Ectopic expression of TIM-3 in lung cancers: a potential independent prognostic factor for patients with NSCLC. Am J Clin Pathol. 2012;137(6):978–985. doi:10.1309/AJCP9Q6OVLVSHTMY
19. Shang Y, Li Z, Li H, Xia H, Lin Z. TIM- 3 expression in human osteosarcoma: correlation with the expression of epithelial-mesenchymal transition-specific biomarkers. Oncol Lett. 2013;6(2):490–494. doi:10.3892/ol.2013.1410
20. Marcq E, Siozopoulou V, De Waele J, et al. Prognostic and predictive aspects of the tumor immune microenvironment and immune checkpoints in malignant pleural mesothelioma. Oncoimmunology. 2017;6(1):e1261241. doi:10.1080/2162402X.2016.1261241
21. Komohara Y, Morita T, Annan DA, et al. The coordinated actions of TIM-3 on cancer and myeloid cells in the regulation of tumorigenicity and clinical prognosis in clear cell renal cell carcinomas. Cancer Immunol Res. 2015;3(9):999–1007. doi:10.1158/2326-6066.CIR-14-0156
22. Yang M, Yu Q, Liu J, et al. T-cell immunoglobulin mucin-3 expression in bladder urothelial carcinoma: clinicopathologic correlations and association with survival. J Surg Oncol. 2015;112(4):430–435. doi:10.1002/jso.24012
23. Chen M, Wang L, Wang Y, et al. Soluble Tim3 detection by time-resolved fluorescence immunoassay and its application in membranous nephropathy. J Clin Lab Anal. 2020;34(6):e23248.
24. Samloff IM. Immunologic studies of human group I pepsinogens. J Immunol. 1971;106(4):962–968.
25. Huang JQ, Zheng GF, Sumanac K, Irvine EJ, Hunt RH. Meta-analysis of the relationship between cagA seropositivity and gastric cancer. Gastroenterology. 2003;125(6):1636–1644. doi:10.1053/j.gastro.2003.08.033
26. Huang YK, Yu JC, Kang WM, et al. Significance of serum pepsinogens as a biomarker for gastric cancer and atrophic gastritis screening: a systematic review and meta-analysis. PLoS One. 2015;10(11):e0142080. doi:10.1371/journal.pone.0142080
27. Li P, He C, Sun L, Dong N, Yuan Y. Pepsinogen I and II expressions in situ and their correlations with serum pesignogen levels in gastric cancer and its precancerous disease. BMC Clin Pathol. 2013;13(1):22. doi:10.1186/1472-6890-13-22
28. Nam SY, Jeon SW, Lee HS, Kwon YH, Park H, Choi JW. Long-term follow-up of pepsinogen I/II ratio after eradication of Helicobacter pylori in patients who underwent endoscopic mucosal resection for gastric cancer. Dig Liver Dis. 2017;49(5):500–506. doi:10.1016/j.dld.2016.12.016
29. Cho JH, Jeon SR, Kim HG, Jin SY, Park S. The serum pepsinogen levels for risk assessment of gastric neoplasms: new proposal from a case-control study in Korea. Medicine. 2017;96(29):e7603. doi:10.1097/MD.0000000000007603
30. Lorente S, Doiz O, Trinidad Serrano M, Castillo J, Lanas A. Helicobacter pylori stimulates pepsinogen secretion from isolated human peptic cells. Gut. 2002;50(1):13–18. doi:10.1136/gut.50.1.13
31. Liu H, Zhi L, Duan N, Su P. Abnormal expression of Tim-3 antigen on peripheral blood T cells is associated with progressive disease in osteosarcoma patients. FEBS Open Bio. 2016;6(8):807–815. doi:10.1002/2211-5463.12079
32. Lei L, Zhong XN, He ZY, Zhao C, Sun XJ. IL-21 induction of CD4+ T cell differentiation into Th17 cells contributes to bleomycin-induced fibrosis in mice. Cell Biol Int. 2015;39(4):388–399. doi:10.1002/cbin.10410
33. Solinas C, De Silva P, Bron D, Willard-Gallo K, Sangiolo D. Significance of TIM3 expression in cancer: from biology to the clinic. Semin Oncol. 2019;46(4–5):372–379. doi:10.1053/j.seminoncol.2019.08.005
34. Gao X, Zhu Y, Li G, et al. TIM-3 expression characterizes regulatory T cells in tumor tissues and is associated with lung cancer progression. PLoS One. 2012;7(2):e30676. doi:10.1371/journal.pone.0030676
35. Wu J, Liu C, Qian S, Hou H. The expression of Tim-3 in peripheral blood of ovarian cancer. DNA Cell Biol. 2013;32(11):648–653. doi:10.1089/dna.2013.2116
36. Cao Y, Zhou X, Huang X, et al. Tim-3 expression in cervical cancer promotes tumor metastasis. PLoS One. 2013;8(1):e53834. doi:10.1371/journal.pone.0053834
37. Zhang Y, Cai P, Liang T, Wang L, Hu L. TIM-3 is a potential prognostic marker for patients with solid tumors: a systematic review and meta-analysis. Oncotarget. 2017;8(19):31705–31713. doi:10.18632/oncotarget.15954
38. Wang Z, Yin N, Zhang Z, Zhang Y, Zhang G, Chen W. Upregulation of T-cell immunoglobulin and mucin-domain Containing-3 (Tim-3) in monocytes/macrophages associates with gastric cancer progression. Immunol Investig. 2017;46(2):134–148. doi:10.1080/08820139.2016.1229790
39. Yegin ZA, Can F, Aydın Kaynar L, et al. Pre-transplant sTIM-3 levels may have a predictive impact on transplant outcome in acute leukemia patients. Hematology. 2020;25(1):125–133. doi:10.1080/16078454.2020.1738097
40. Geng H, Zhang GM, Li D, et al. Soluble form of T cell Ig mucin 3 is an inhibitory molecule in T cell-mediated immune response. J Immunol. 2006;176(3):1411–1420. doi:10.4049/jimmunol.176.3.1411
41. Lu X, Yang L, Yao D, et al. Tumor antigen-specific CD8+ T cells are negatively regulated by PD-1 and Tim-3 in human gastric cancer. Cell Immunol. 2017;313:43–51. doi:10.1016/j.cellimm.2017.01.001
42. Naghavi-Alhosseini M, Tehrani M, Ajami A, et al. Tim-3 up-regulation in patients with gastric cancer and peptic ulcer disease. Asian Pac J Cancer Prev. 2017;18(3):765–770.
43. Wang Z, Zhu J, Gu H, et al. The clinical significance of abnormal Tim-3 expression on NK cells from patients with gastric cancer. Immunol Investig. 2015;44(6):578–589. doi:10.3109/08820139.2015.1052145
44. Hu CC, Jeng WJ, Chen YC, et al. Memory regulatory T cells increase only in inflammatory phase of chronic hepatitis B infection and related to galectin-9/Tim-3 interaction. Sci Rep. 2017;7(1):15280. doi:10.1038/s41598-017-15527-x
 © 2021 The Author(s). This work is published and licensed by Dove Medical Press Limited. The full terms of this license are available at https://www.dovepress.com/terms.php and incorporate the Creative Commons Attribution - Non Commercial (unported, v3.0) License.
By accessing the work you hereby accept the Terms. Non-commercial uses of the work are permitted without any further permission from Dove Medical Press Limited, provided the work is properly attributed. For permission for commercial use of this work, please see paragraphs 4.2 and 5 of our Terms.
© 2021 The Author(s). This work is published and licensed by Dove Medical Press Limited. The full terms of this license are available at https://www.dovepress.com/terms.php and incorporate the Creative Commons Attribution - Non Commercial (unported, v3.0) License.
By accessing the work you hereby accept the Terms. Non-commercial uses of the work are permitted without any further permission from Dove Medical Press Limited, provided the work is properly attributed. For permission for commercial use of this work, please see paragraphs 4.2 and 5 of our Terms.