")
Back to Journals » International Journal of General Medicine » Volume 14
Clinical Value for Diagnosis and Prognosis of Signal Sequence Receptor 1 (SSR1) and Its Potential Mechanism in Hepatocellular Carcinoma: A Comprehensive Study Based on High-Throughput Data Analysis
Authors Chen L, Lin Y, Liu G, Xu R, Hu Y, Xie J , Yu H
Received 30 August 2021
Accepted for publication 20 October 2021
Published 30 October 2021 Volume 2021:14 Pages 7435—7451
DOI https://doi.org/10.2147/IJGM.S336725
Checked for plagiarism Yes
Review by Single anonymous peer review
Peer reviewer comments 2
Editor who approved publication: Dr Scott Fraser
Liang Chen,1,* Yunhua Lin,2,* Guoqing Liu,2 Rubin Xu,1 Yiming Hu,3 Jiaheng Xie,4 Hongzhu Yu1
1Department of General Surgery, Fuyang Hospital Affiliated to Anhui Medical University, Fuyang, Anhui, People’s Republic of China; 2The First Clinical Medical College, Guangxi Medical University, Nanning, Guangxi, People’s Republic of China; 3College of Pharmacy, Jiangsu Ocean University, Lianyungang, Jiangsu, People’s Republic of China; 4Department of Burn and Plastic Surgery, The First Affiliated Hospital of Nanjing Medical University, Nanjing, Jiangsu, People’s Republic of China
*These authors contributed equally to this work
Correspondence: Hongzhu Yu
Fuyang Hospital Affiliated to Anhui Medical University, Fuyang, Anhui, People’s Republic of China
Tel +86 177 5686 0568
Email [email protected]
Jiaheng Xie
Department of Burn and Plastic Surgery, The First Affiliated Hospital of Nanjing Medical University, Nanjing, Jiangsu, People’s Republic of China
Tel +86 177 5686 0568
Email [email protected]
Objective: Hepatocellular Carcinoma (HCC) has the characteristics of high incidence and poor prognosis. However, the underlying mechanism of HCC has not yet been fully elucidated. This study aims to investigate the potential mechanism and clinical significance of signal sequence receptor (SSR1) in HCC through bioinformatics methods.
Methods: Four online (GEPIA, TIMER, TCGA, and GEO) databases were used to explore the expression level of SSR1 in HCC. The summary receiver operating characteristic (SROC) analysis and standardized mean difference (SMD) calculation were performed further to detect its diagnostic ability and expression level. The Human Protein Atlas (HPA) database was applied to verify the level of SSR1 protein expression. Chi-square test and Fisher’s exact test were carried out to determine the clinical relevance of SSR1 expression. KM survival analysis, univariate and multivariate COX regression analyses were employed to explore the prognostic impact of SSR1. Kyoto Encyclopedia of Genes and Genomes (KEGG) analysis and Gene set enrichment analysis (GSEA) were implemented to reveal the underlying mechanism of SSR1. Quantitative Real-Time Polymerase Chain Reaction (QRT-PCR) was used to verify the expression of SSR1 in HCC.
Results: SSR1 was significantly overexpressed in HCC (SMD=1.25, P=0.03) and had the moderate diagnostic ability (AUC=0.84). SSR1 expression was significantly correlated with T stage, Gender, Pathologic stage (All P< 0.05). Patients with high SSR1 expression had shorter overall survival (OS). Univariate and multivariate Cox regression analyses showed that high SSR1 expression was an independent risk factor for poor prognosis. KEGG analysis showed that SSR1-related genes were enriched in the cell cycle, DNA replication, and TGF-beta signaling pathway. GSEA analysis also shows that the high expression of SSR1 is related to the activation of the above three signal pathways. qRT-PCR showed that the SSR1 expression in HCC was significantly higher than the Peri-carcinoma tissue (PHCC) and the corresponding normal liver tissue.
Conclusion: SSR1 expression was significantly up-regulated, and it had the potential as a biomarker for the diagnosis and prognosis of HCC. It was very likely to participate in the occurrence and development of HCC by regulating the cell cycle. In summary, our study comprehensively analyzed the clinical value of SSR1 and also conducted a preliminary study on its potential mechanism, which will provide inspiration for the in-depth study of SSR1 in HCC.
Keywords: hepatocellular carcinoma, signal sequence receptor, SSR1, prognosis, diagnostic
Introduction
As one of the most common malignancies, Liver cancer seriously harms human health and hinders the development of the social economy.1 Cholangiocarcinoma, liver hepatocellular carcinoma (HCC), and mixed hepatocellular carcinoma are the three key pathological types of liver cancer.2 As the major component of liver cancer, HCC accounts for nearly 85% of liver cancer cases.3,4 It has the characteristics of poor prognosis, high recurrence rate, and low survival rate.5 As reported, the five-year survival rate can even be as low as 18%, while the recurrence rate is as high as 60% ~70%.6 Currently, clinical strategies including liver transplantation, surgical resection, and chemotherapy seem to bring greater clinical benefits to patients with early HCC, while their application in advanced HCC cases is limited.7 It is particularly critical to realize the early diagnosis, treatment, and effective monitoring of the prognosis of HCC. The diagnosis of HCC mainly relies on the imaging examination and serum alpha-fetoprotein (AFP) level detection. However, due to insufficient sensitivity and specificity to detect early HCC, satisfactory results have not been achieved.8–10 Therefore, there is an urgent need to find new non-invasive diagnostic and prognostic biomarkers to improve the prognosis of HCC patients.
The signal sequence receptor (SSR), a translocation-related protein located in the endoplasmic reticulum, plays a vital role in translocating secreted proteins. Briefly, it acts in a substrate-specific manner to promote the initiation of protein translocation. The SSR complex is composed of four subunits, namely α (SSR1), β (SSR2), γ (SSR3) and δ (SSR4).11 Signal sequence receptor (SSR) has been proven to play an essential role in various cancers such as hypopharyngeal squamous cell carcinoma, gastric cancer, human primary melanomas, hepatocellular carcinoma,12–15 and participate in the occurrence and development of cancers.
SSR1, one of the four subunits of the SSR complex, has been reported on its role in the occurrence and development of several tumors. The previous study has shown SSR1 was overexpressed in hypopharyngeal squamous cell carcinoma (HSCC) and was involved in the proliferation, migration, and invasion of HSCC cells as a downstream target of lncRNA RP11-156L14.1 and miR-548ao-3p.12 Another study found that compared with the non-inflammatory breast cancer not of mesenchymal stem-like subtype, the expression of SSR1 was down-regulated in the triple-negative inflammatory breast cancer not of mesenchymal stem-like subtype.16 Studies have also found that the expression of SSR1 in human colorectal cancer cells can be down-regulated by curcumin treatment, which ultimately leads to cell cycle arrest in the G2/M phase.17 Liu et al’s study observed that the expression of SSR1 in three gynecological tumors (Cervical, endometrial and vulvar cancer) was significantly up-regulated and suggested that it may be a potential biomarker.18 In short, the current research shows that SSR1 may play a key role in tumors and has broad research prospects. However, to our knowledge, the study of SSR1 in HCC is rarely reported. It is essential to explore the potential mechanism of SSR1 in HCC and its clinical value in diagnosis and prognosis.
Herein, we combined multiple methods to confirm the expression of SSR1 at the protein level and mRNA level in HCC. ROC analysis was performed to detect the diagnostic value of SSR1 in HCC. Moreover, we aggregated SSR1 expression profile data and calculated the standard mean deviation (SMD) and summary receiver operating characteristics (SROC) to further evaluate the expression pattern and diagnostic value of SSR1 in HCC. Then, we examined the correlation between SSR1 expression and clinical parameters and explored the effect of SSR1 expression on the prognosis of HCC. Finally, the potential mechanism of SSR1 in HCC was explored through Kyoto Encyclopedia of Genes and Genomes (KEGG) analysis and Gene set enrichment analysis (GSEA). To conclude, SSR1 can be a potentially promising diagnostic and prognostic biomarker for HCC.
Materials and Methods
Expression Pattern of SSR1 in HCC Based on GEPIA and TIMER Databases
The database GEPIA (http://gepia.cancer-pku.cn/index.html) is an online database that contains the datasets from The Cancer Genome Atlas (TCGA) and Genotype-Tissue Expression (GTEx) projects. The TIMER (http://cistrome.dfci.harvard.edu/TIMER/) database can be applied to detect the gene expression level of interest in various tumors. Our study used the above two online databases (GEPIA, TIMER) to detect the expression difference between HCC and normal tissues.
Data Mining from TCGA and GEO Databases
We conducted a systematic search in the TCGA (http://tcga-data.nci.nih.gov) and Gene Expression Omnibus (GEO) (https://www.ncbi.nlm.nih.gov/geo/) databases to obtain the HCC datasets related to SSR1. Briefly, Gene expression and corresponding clinical data for HCC patients were firstly obtained from the TCGA database. Subsequently, log2 conversion was performed on RNAseq data of FPKM (Fragments Per Kilobase per Million) format. Meanwhile, for validation of SSR1 expression, the HCC datasets available at the GEO database were also included to carry out data mining. The GEO datasets included in our current study should strictly comply with all the following principles: (1) The species was Homo sapiens; (2) The data included the expression profile data of SSR1 in HCC; (3) The total number of samples contained in tumor group and the non-tumor group was more than 10. All the datasets obtained from the GEO database were subjected to normalization and log2 transformation. SSR1 expression profile data were extracted from the TCGA and GEO datasets and used for further analysis. Based on R software, ggplot2 was used for data visualization, and the results of TCGA and GEO were presented in the form of box plots and violin plots, respectively.
Diagnostic Value of SSR1 in Patients with HCC
To evaluate the diagnostic capabilities of SSR1, the receiver operating characteristic (ROC) curve was generated based on the SSR1 expression profile data from the GEO and TCGA databases. The area under the curve (AUC) of SSR1 was calculated to quantify the discriminatory ability between the HCC and normal groups.
Comprehensive Analysis of SSR1 in HCC Based on GEO Datasets
To further investigate the SSR1expression pattern in HCC, we organized the expression levels of SSR1 in tumor and normal groups in each independent dataset and presented them as mean±SD (standard deviation). Then, the combined SMD (standardized mean difference) with 95% CI was calculated. If SMD>0 and P<0.05 were observed, it indicated that the expression level of SSR1 in HCC was significantly increased than that in the normal group. To further determine the ability of SSR1 to recognize HCC and normal samples, we generated the SROC (summary receiver operator characteristic) curve and calculated the area under the curve (AUC).
In addition, we also analyzed the heterogeneity between the various independent studies. If I2 >50%, the random effects model will be applied, while if I2 <50%, we will choose the fixed effects model. To further evaluate the robustness of the above results, sensitivity analysis was performed by omitting individual studies to evaluate each dataset’s impact on the aggregated results. Besides, Begg’s test and Egger’s test were applied to assess the publication bias. If P>0.05, no significant publication bias existed in our study. Stata was used for the Begg’s test, Egger’s test, and SROC analysis, and all other analyses were carried out via the meta package and forestplot package in R software.
Immunohistochemistry Analysis
Based on the Human Protein Atlas (HPA, https://www.proteinatlas.org/) database, we compared protein expression of SSR1 between normal and HCC tissues, which was visualized in immunohistochemistry staining images.
Correlation Analysis Between SRRI Expression and Clinicopathologic Characteristics
UALCAN (http://ualcan.path.uab.edu/) was a comprehensive web resource for analyzing cancer data, allowing us to identify cancer biomarkers.19 We used UALCAN and GEPIA databases to explore the expression level of SSR1 in different clinicopathological stages. Besides, the chi-square test and Fisher’s exact test were carried out to evaluate the significance of the correlation between SSR1 expression and clinicopathologic characteristics. It was recommended to use the chi-square test only if the data meets the conditions that the theoretical frequency was more than 5 and the total sample size was more than 40. Otherwise, Fisher’s exact test should be employed.20
Prognostic Value of SSR1 in Patients with HCC
In our current study, the univariate and multivariate Cox regression methods were performed to clarify the prognostic value of SSR1 in patients with HCC. Firstly, we incorporated SSR1 expression profile data and other clinical information into univariate Cox regression analysis to determine factors related to the prognosis of HCC. Then, the multivariate Cox regression analysis was used to investigate the prognosis factors identified as significant in the univariate Cox regression analysis. Besides, based on the GEPIA database and TCGA cohorts, KM survival analysis was performed to compare the overall survival (OS) of HCC patients with different SSR1 expression. Hazard ratio (HR) and p-value were implemented through Log rank tests and univariate Cox regression analysis.
Relevant Genes of SSR1 and Functional Enrichment Analysis
In this study, the UALCAN database was utilized to obtain a series of genes that had similar expression patterns with SSR1 in HCC. Correlation coefficients equal to or greater than 0.60 was set as the criteria. Further, we performed the Kyoto Encyclopedia of Genes and Genomes (KEGG) pathway analysis on these related genes to explore the pathways in which the relevant genes were mainly involved. The Database for Annotation, Visualization, and Integrated Discovery (DAVID, https://david.ncifcrf.gov/tools.jsp) was used to perform the KEGG pathway analysis. Results obtained with DAVID were drawn by R software.
Gene Set Enrichment Analysis
In order to further explore the classic pathways related to SSR1 in HCC, we performed Gene set enrichment analysis (GSEA) analysis based on the expression profile data from the TCGA database. Briefly, all HCC patients with different SSR1 expressions in the TCGA cohort were divided into two groups (low and high), according to the median expression value of SSR1. Subsequently, GSEA was conducted using the R package DESeq2 and clusterProfile.21 Furtherly, the R package enrichplot was used to visualize the results.
Quantitative Real-Time Polymerase Chain Reaction (qRT-PCR)
We next conducted qRT-PCR analysis on 11 heaptocellular carcinoma (HCC) patients, from whom the HCC tissue, Peri-carcinoma liver tissue (PHCC) and the normal liver tissue was taken for SSR1 mRNA quantification. Total cellular RNAs were isolated from cells using Trizol Reagent (Invitrogen, Carlsbad, CA, USA) according to the manufacturer’s instructions. The reverse transcription was conducted using the reverse transcription kit provided by Takara (Otsu, Shiga, Japan). Real-time polymerase chain reaction (RT-PCR) was performed using a QuantiTect SYBR Green PCR Kit (Takara), and on a Applied Biosystems QuantStudio 1 (Thermo, Waltham, MA, USA). Relative quantification was determined using the −2ΔΔCt method. The relative expression of messenger RNA (mRNA) for each gene was normalized to the level of glyceraldehyde-3-phosphate dehydrogenase (GAPDH) mRNA. The specific primer sequences adopted in this experiment are: SSR1: Forward: 5ʹ-CTGCTTCTCTTACTCGTGTTCC-3ʹ;Reverse:5ʹ-TCTTCTTCTACCTCGGCTTCAT-3ʹ. GAPDH: Forward: 5ʹ-GGAGcGAGatCCCTCCAAAat-3ʹ;Reverse: 5ʹ- GGCTGTTGTCATACTTCTCATGG - 3ʹ.
Statistical Analysis
All the statistical analyses were carried out based on R software and Stata. Comparisons between HCC and normal groups were performed using the Student’s t-test. The Chi-squared test and Fisher’s exact test were performed to compare the clinical variables. ROC analysis was generated to determine the discrimination value of SSR1. The R package meta and forest plot were used for calculating the overall SMD and sensitivity analysis, whereas publication bias assessment and SROC analysis were performed with Stata software. GSEA was conducted with the clusterProfiler package. KM survival analysis was utilized to assess the OS in each group. Unless otherwise specified, P<0.05 is considered significant.
Results
Research Data Sources
After screening and inspection, a total of 12 datasets from public databases, including 11 GEO datasets and 1 TCGA dataset, were collected in our study. The above 12 datasets all contained the expression value of SSR1 in HCC and normal groups, as shown in Table 1.
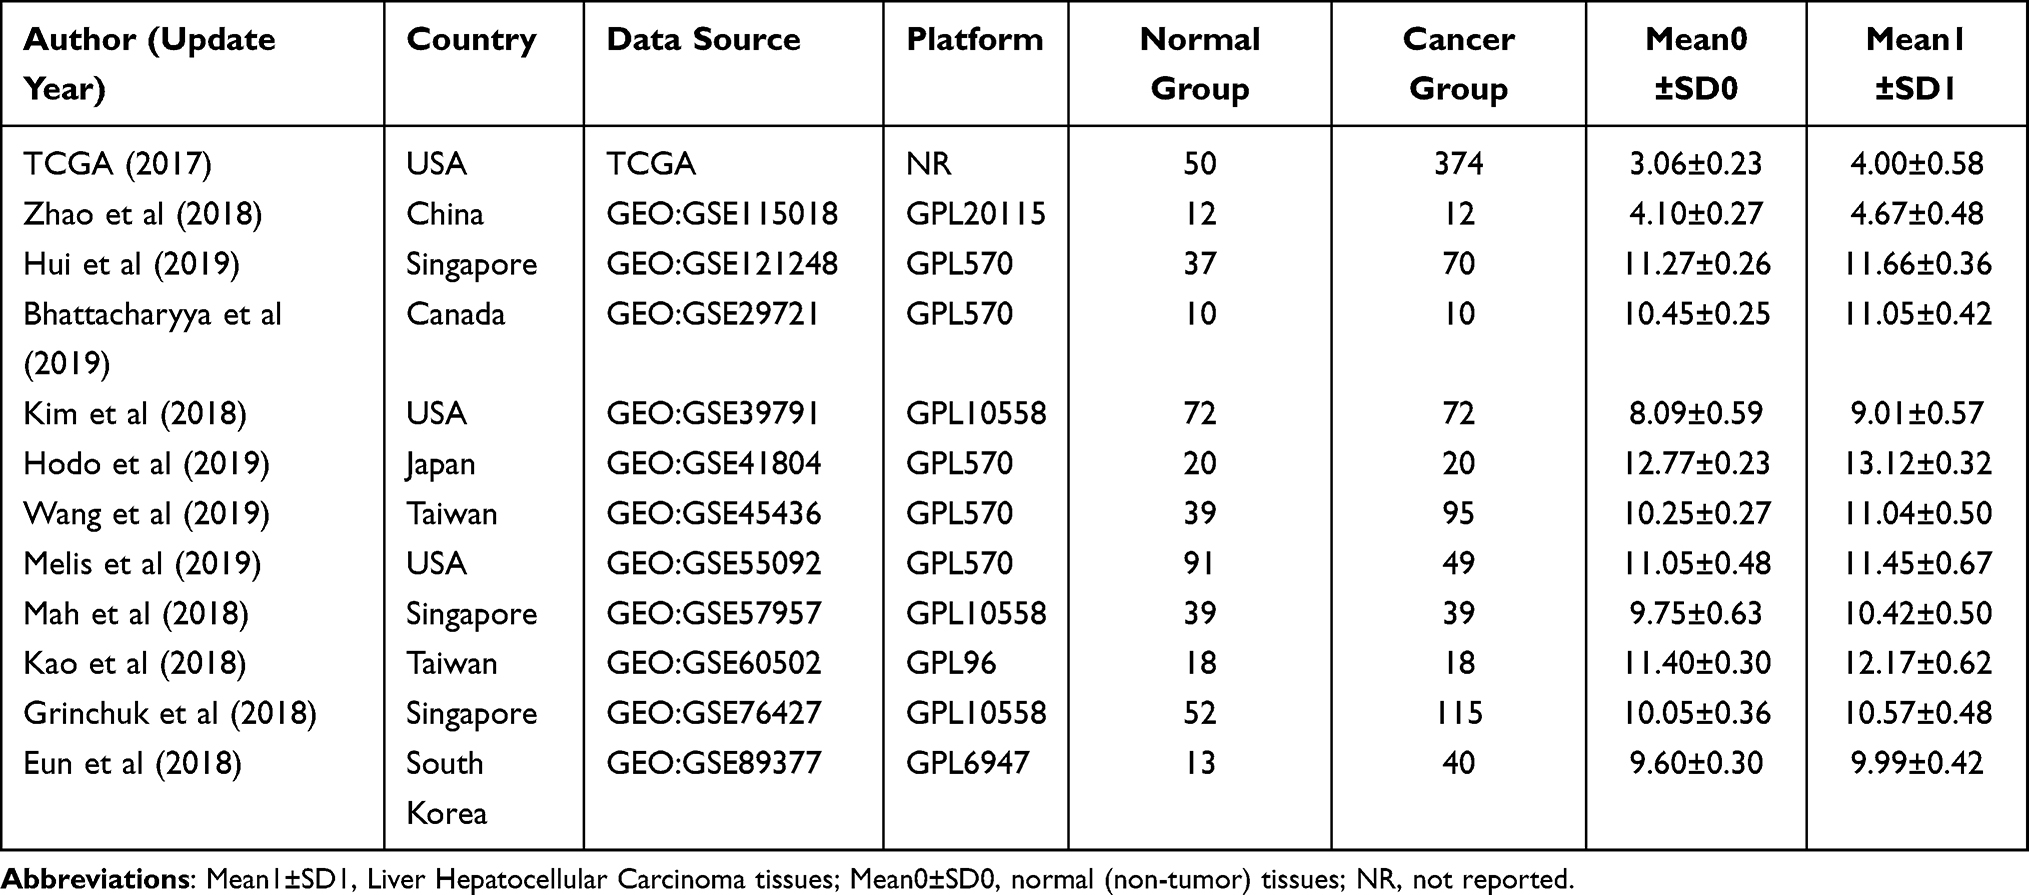 |
Table 1 Characteristics of GEO Datasets Included in the Study |
Analysis of SSR1 Expression Levels in HCC Based on Various Databases
To compare the expression pattern of SSR1 between the HCC tissues and normal tissues, the expression profile of SSR1 was investigated using the GEPIA and TIMER databases. Based on the analysis results of GEPIA and TIMER, the expression of SSR1 was significantly higher in HCC tissues compared to normal tissues (P<0.05). (Figure 1A–C). Similarly, we found that compared to normal tissues, the analysis results from the TCGA dataset also showed that SSR1 was significantly overexpressed in HCC tissues (Figure 1D). Meanwhile, we studied the expression pattern of SSR1 in HCC based on 11 GEO datasets (Figure 2). Interestingly, we also found that SSR1 expression was significantly up-regulated in HCC, which was consistent with the above conclusions.
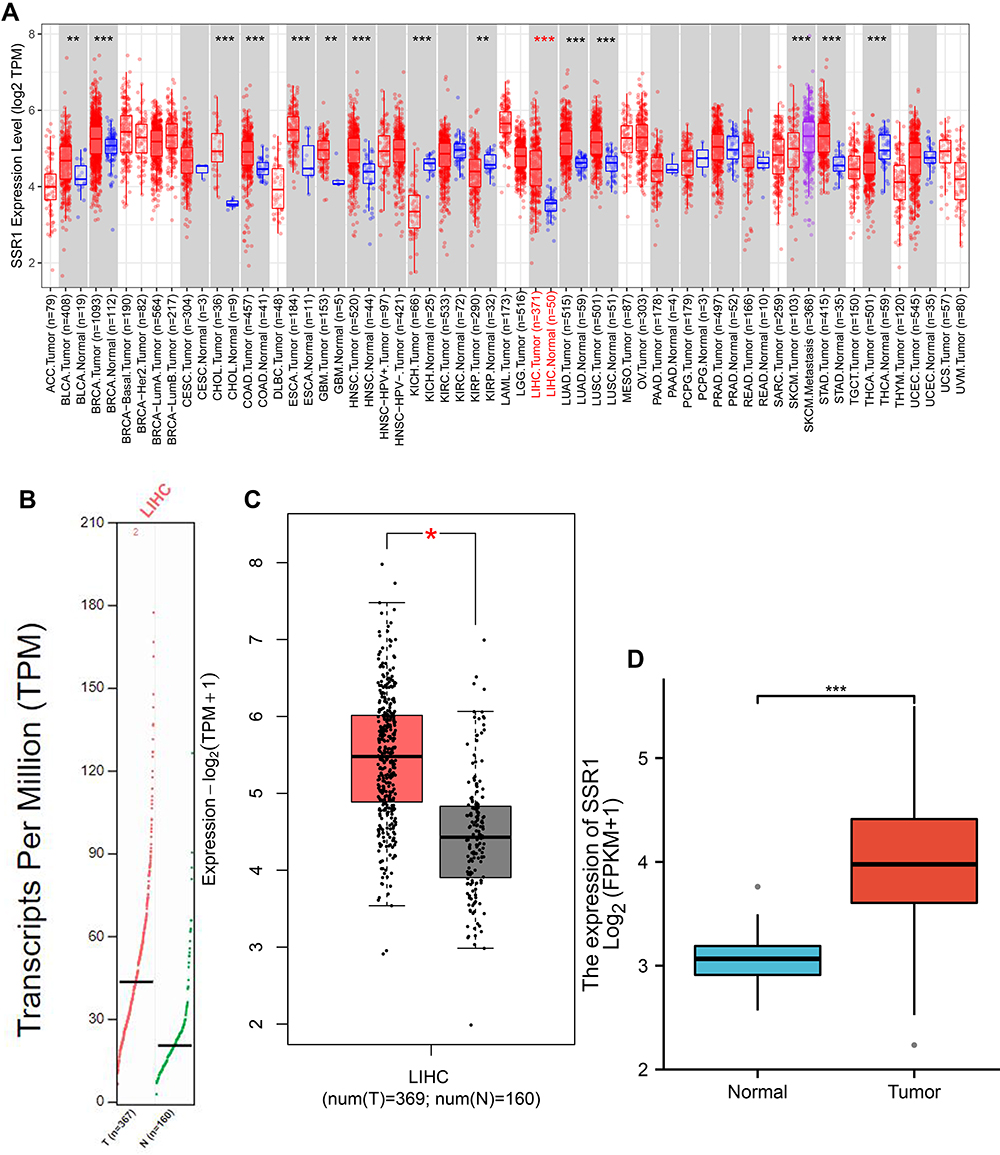 |
Figure 1 The expression levels of SSR1 in Hepatocellular Carcinoma (TIMER and GEPIA databases). (A) SSR1 expression in different types of tumors and normal tissues by TIMER (**P < 0.01, ***P < 0.001). (B) Scatter diagram of SSR1 expression in Hepatocellular Carcinoma compared to normal tissues using GEPIA. (C) Box plot of SSR1 expression in Hepatocellular Carcinoma compared to normal tissues using GEPIA (*P < 0.05). (D) Box plot of SSR1 expression in Hepatocellular Carcinoma compared to normal tissues based on dataset downloaded from TCGA database (***P < 0.001). |
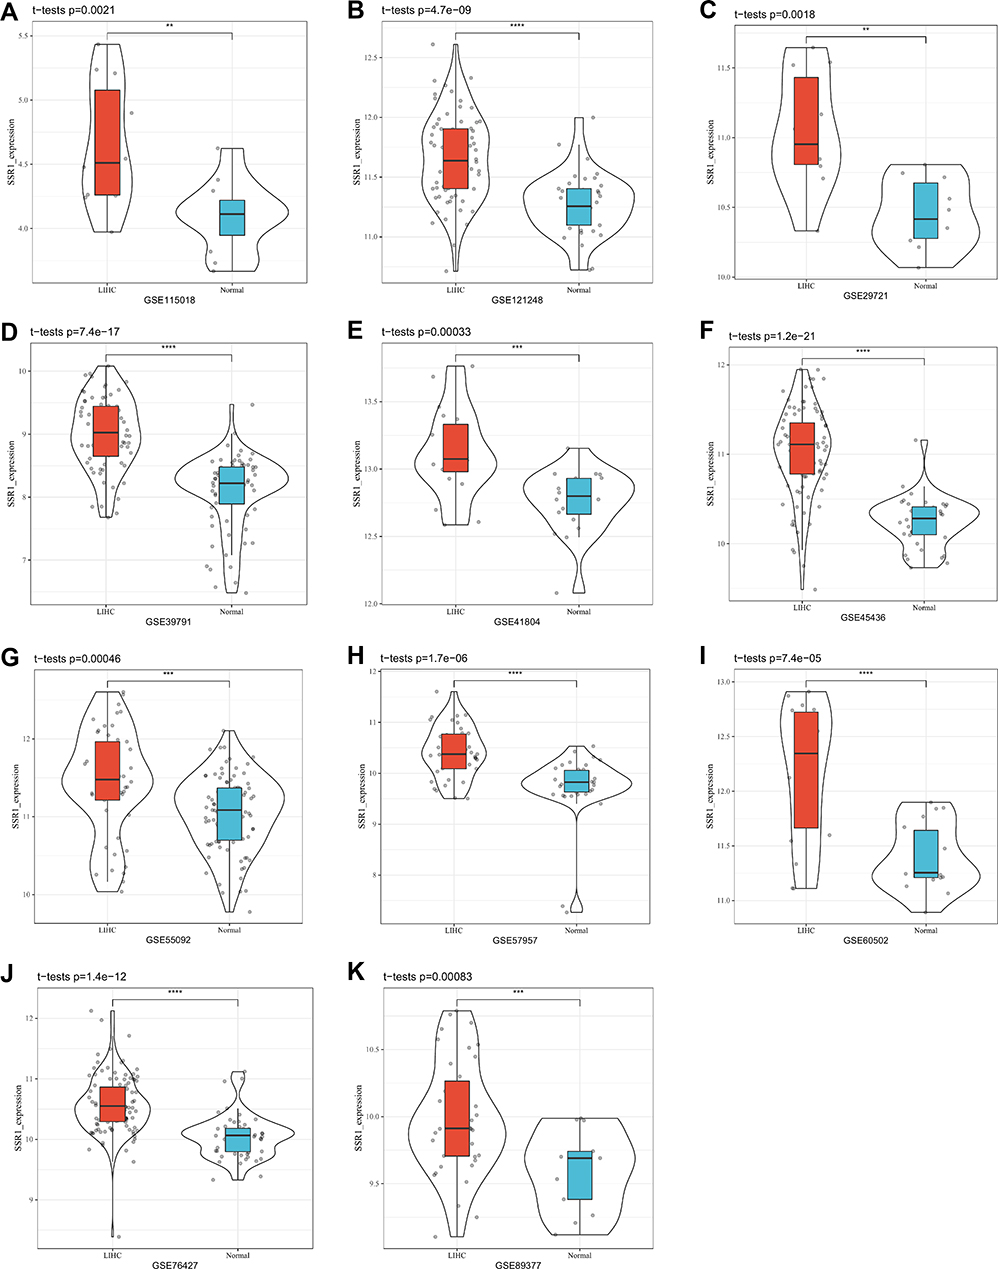 |
Figure 2 Violin plot of SSR1 expression in Hepatocellular Carcinoma based on 11 datasets downloaded from GEO database. (A) GSE115018. (B) GSE121248. (C) GSE29721. (D) GSE39791. (E) GSE41804. (F) GSE45436. (G) GSE55092. (H) GSE57957. (I) GSE60502. (J) GSE76427. (K) GSE89377. (**P <0.01, ***P <0.001, ****P<0.0001). |
Diagnostic Value of SSR1 for HCC
Based on the TCGA and 11 GEO datasets, ROC analysis was carried out to determine the diagnostic value of SSR1 in HCC. The results (Figure 3) revealed SSR1 had an upper-middle diagnostic ability in HCC (all AUC>0.70), which indicated that SSR1 had a good ability to distinguish HCC from normal tissues.
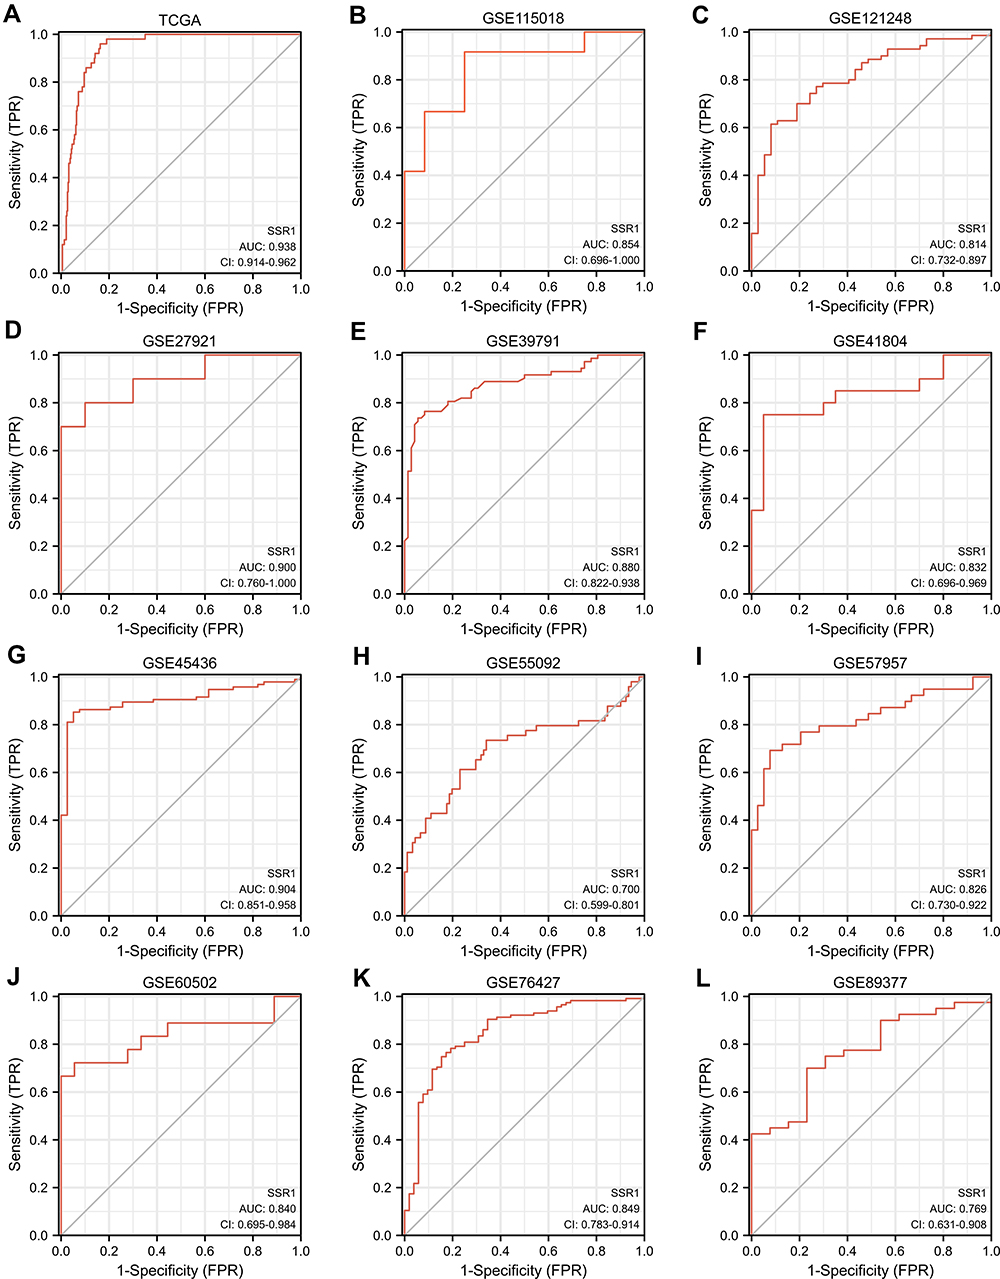 |
Figure 3 Receiver Operating Characteristic curves of SSR1 expression for the differentiation of Hepatocellular Carcinoma from normal tissues based on TCGA and 11 GEO datasets. (A) TCGA. (B) GSE115018. (C) GSE121248. (D) GSE29721. (E) GSE39791. (F) GSE41804. (G) GSE45436. (H) GSE55092. (I) GSE57957. (J) GSE60502. (K) GSE76427. (L) GSE89377. |
Comprehensive Analysis of Expression Pattern and Diagnostic Value of SSR1
To comprehensively evaluate the expression level and diagnostic value of SSR1 in HCC, SSR1 expression data in HCC and normal tissues were integrated from the included 11 datasets downloaded from the GEO database. Then, we calculated the SMD and generated the SROC curve of SSR1. The fixed effect model was used to calculate the SMD due to the small heterogeneity (I2 = 49%, P =0.03; Figure 4A). The SMD of SSR1 was 1.25 (95% CI:1.10–1.39, P =0.03; Figure 4A), indicating that the expression of SSR1 was significantly overexpressed in HCC. Sensitivity analysis demonstrated that our results were relatively stable and credible (Figure 4B). The result of SROC analysis indicated that SSR1 had the moderate diagnostic ability (AUC=0.84,95% CI:0.80–0.87; Figure 4C). Besides, as Figure 4D and E shows, the P values for Begg’s test and Egger’s test were 0.213 and 0.431, respectively, indicating no significant publication bias. Overall, these current results confirmed the overexpression of SSR1 in HCC and its potential as a diagnostic biomarker for HCC.
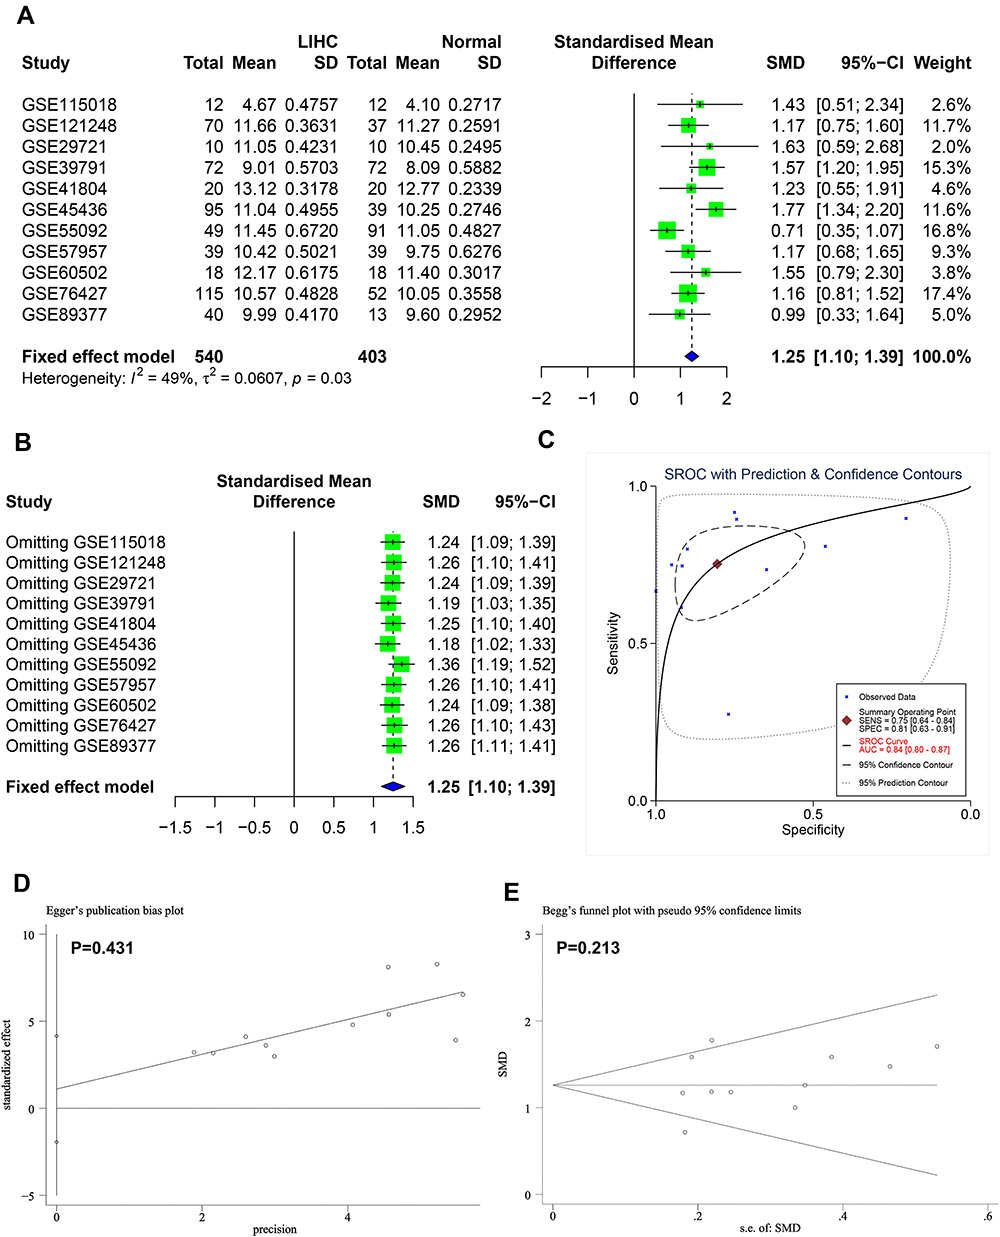 |
Figure 4 Comprehensive analysis of expression pattern and diagnostic value of SSR1. (A) Forest plot for evaluating SSR1 expression between Hepatocellular Carcinoma and normal tissues. (B) Sensitivity analysis of standard mean deviation (fixed effects model) based on stepwise omitting one study at a time. (C) Summary receiver operating characteristic curve of the distinguishing capability of SSR1 for tumor from normal tissues. (D and E) Analysis of the detection of publication bias in the meta-analysis of studies assessing the expression pattern of SSR1 in Hepatocellular Carcinoma. |
Protein-Level Validation of SSR1 Overexpression via HPA Database
In our study, for further validation, the HPA database was explored to confirm the protein expression levels of SSR1. Our result demonstrated that compared with the normal group, the protein level of SSR1 was significantly increased in the HCC group (Figure 5A). Based on current results, this study has detected the overexpression of SSR1 in HCC from the mRNA and protein levels.
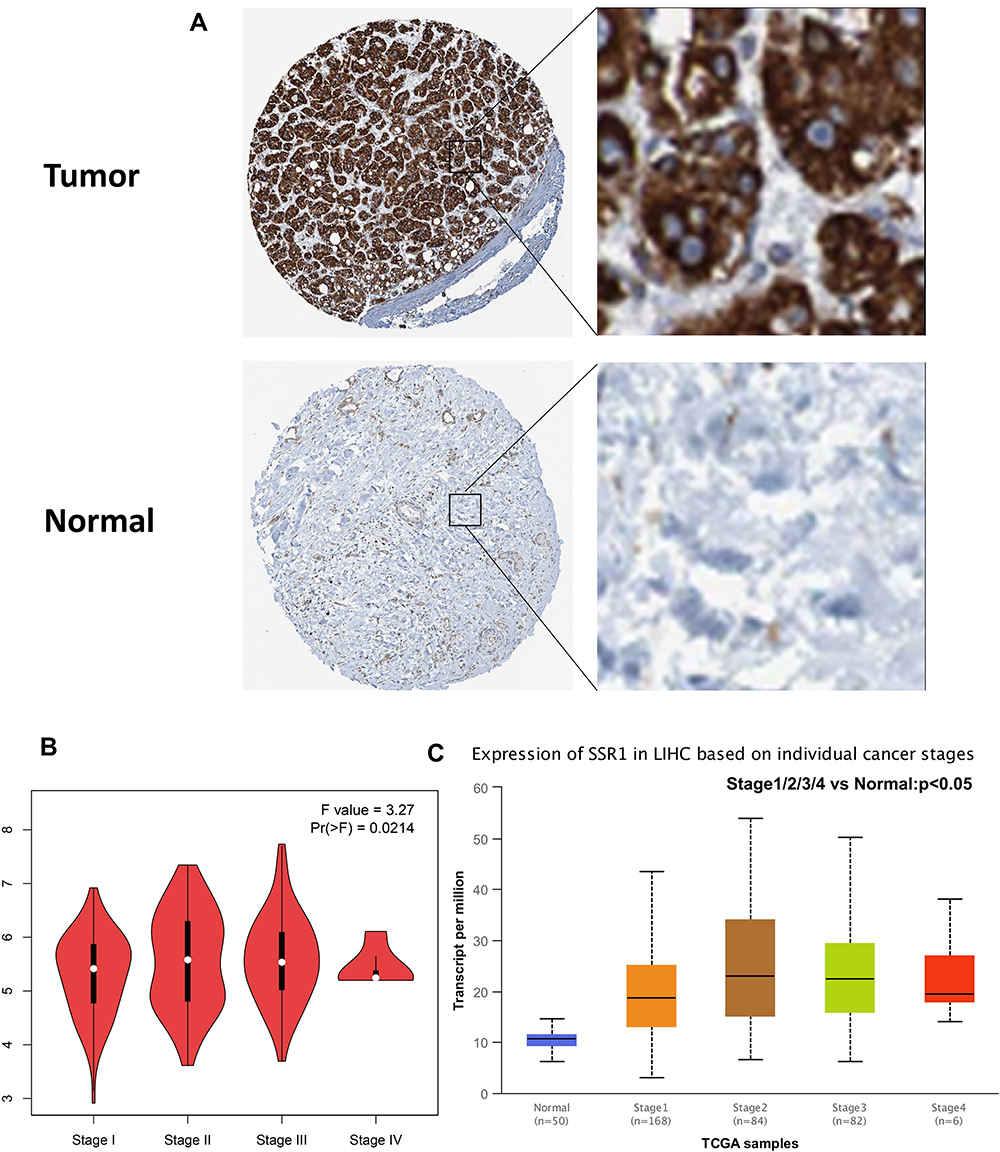 |
Figure 5 SSR1 protein expression based on HPA database and expression levels of SSR1 based on clinicopathological stages. (A) A Hepatocellular Carcinoma tissue showing high SSR1 expression (Antibody HPA011276, Female, age 61); A normal liver tissue showing low SSR1 expression (Antibod0y HPA011276, Female, age 65). (B) Expression levels of SSR1 in different clinicopathological stages based on GEPIA database. (C) Expression levels of SSR1 in different clinicopathological stages based on UALCAN database. |
Correlation of SSR1 Expression with Clinicopathological Features
The correlation between SSR1 expression and tumor stage in HCC patients was analyzed based on the GEPIA database and HCC dataset obtained from the TCGA database. The results demonstrated that the expression levels of SSR1 displayed a strong correlation with the tumor stages of HCC patients (P<0.05) (Figure 5B and C). Besides, the patients with HCC were divided into two groups (high and low expression of SSR1), and then the correlation between SSR1 expression and clinicopathological features with HCC was analyzed. The results indicated that overexpressed SSR1 was significantly associated with T stage (P=0.005), Gender (P=0.047), Pathologic stage (P=0.014) (Table 2).
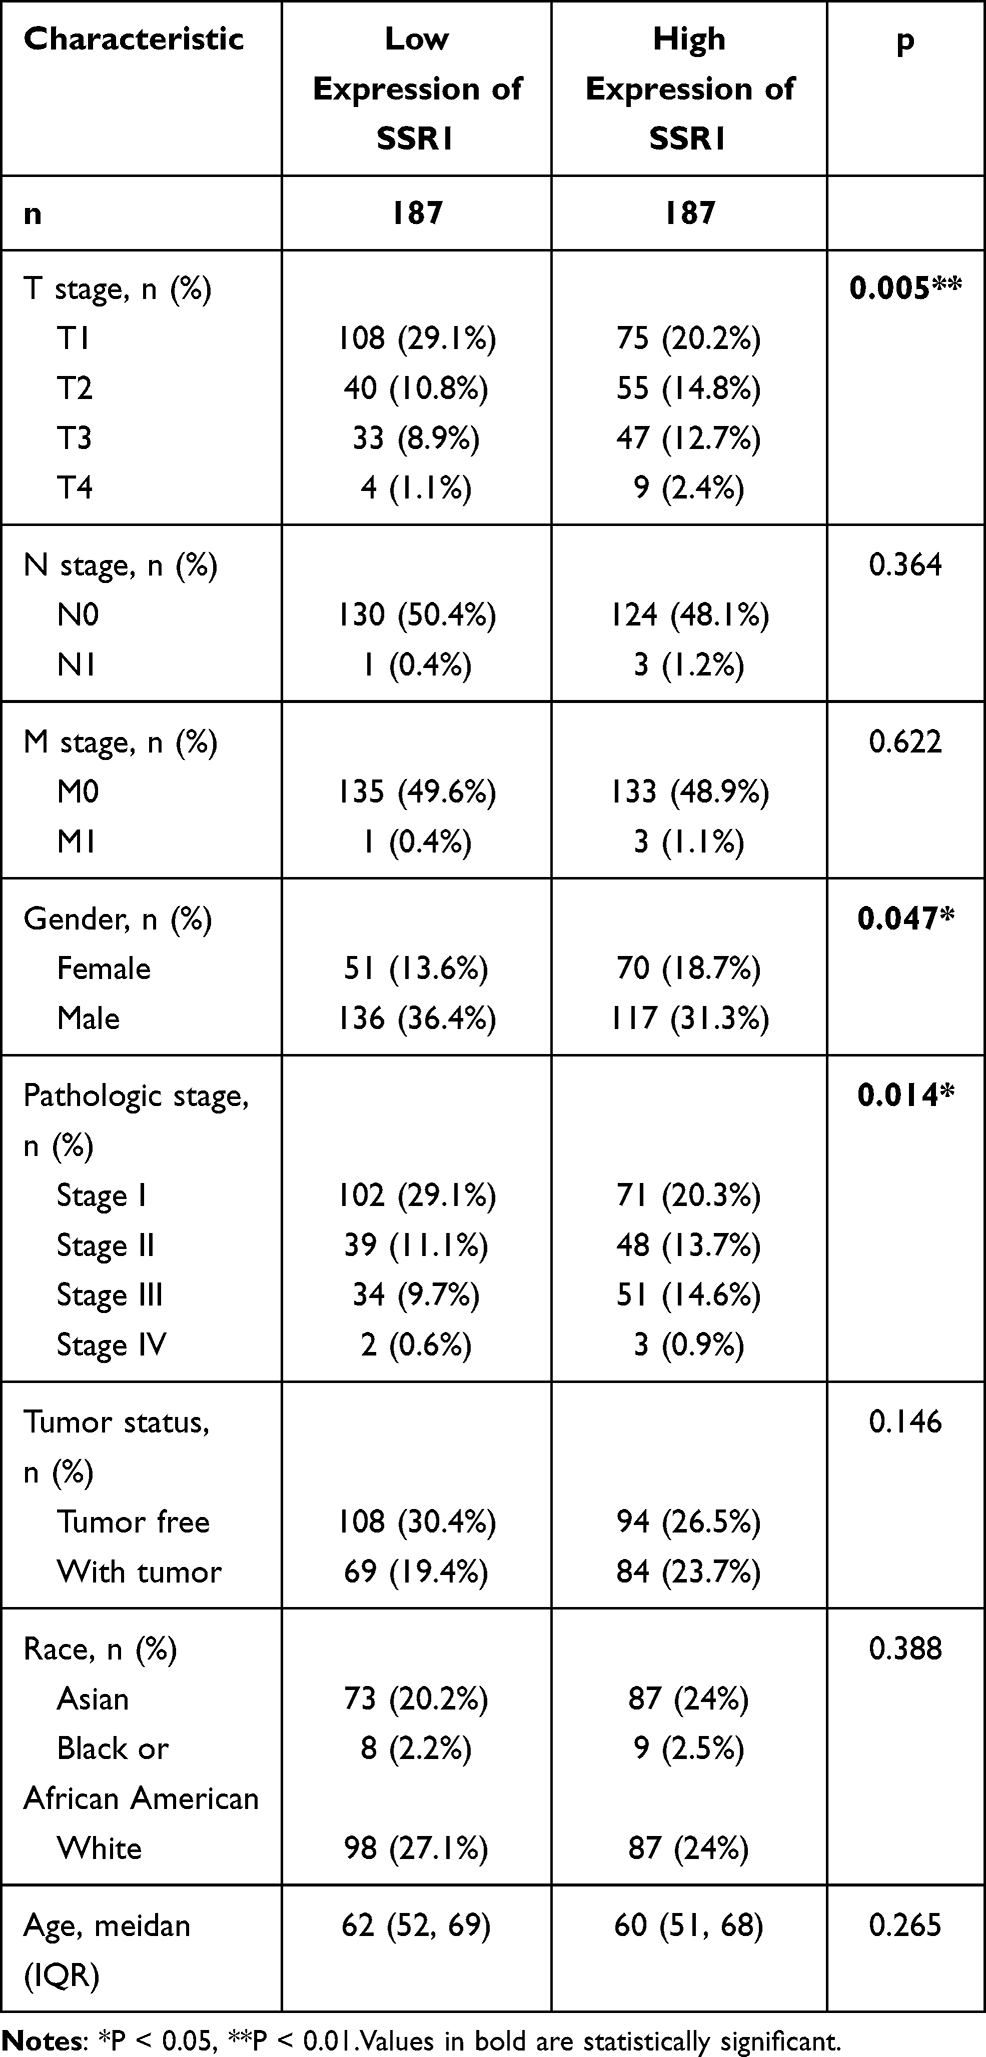 |
Table 2 Relationship Between the Clinical Features and SSR1 Expression in Hepatocellular Carcinoma Patients |
SSR1 Overexpression Was an Independent Risk Factor and Predicted a Poor Prognosis in HCC
Here, the univariate and multivariate Cox regression analyses were performed to unveil the prognostic value of SSR1 (Table 3). Increased SSR1 expression (HR=1.698, 95% CI=1.198–2.409; P=0.003) was significantly associated with poor survival in univariate Cox analysis. The multivariate Cox regression analysis also obtained a consistent result (HR=1.528, 95% CI=1.053–2.217; P=0.026). Besides, we also verified the prognostic value of SSR1 in HCC by using KM survival analysis. According to the median expression level of SSR1, HCC patients were divided into low and high expression groups. The analysis results from the GEPIA database and the TCGA dataset (GEPIA: HR=2.2, P=0.0022; TCGA: HR=1.70, P=0.003) indicate that HCC patients in the SSR1 high expression group had a poor prognosis than HCC patients in the SSR1 low expression group (Figure 6A and B). Summarily, our results revealed that SSR1 overexpression was revealed to be an independent indicator and predicted a poor prognosis of HCC patients.
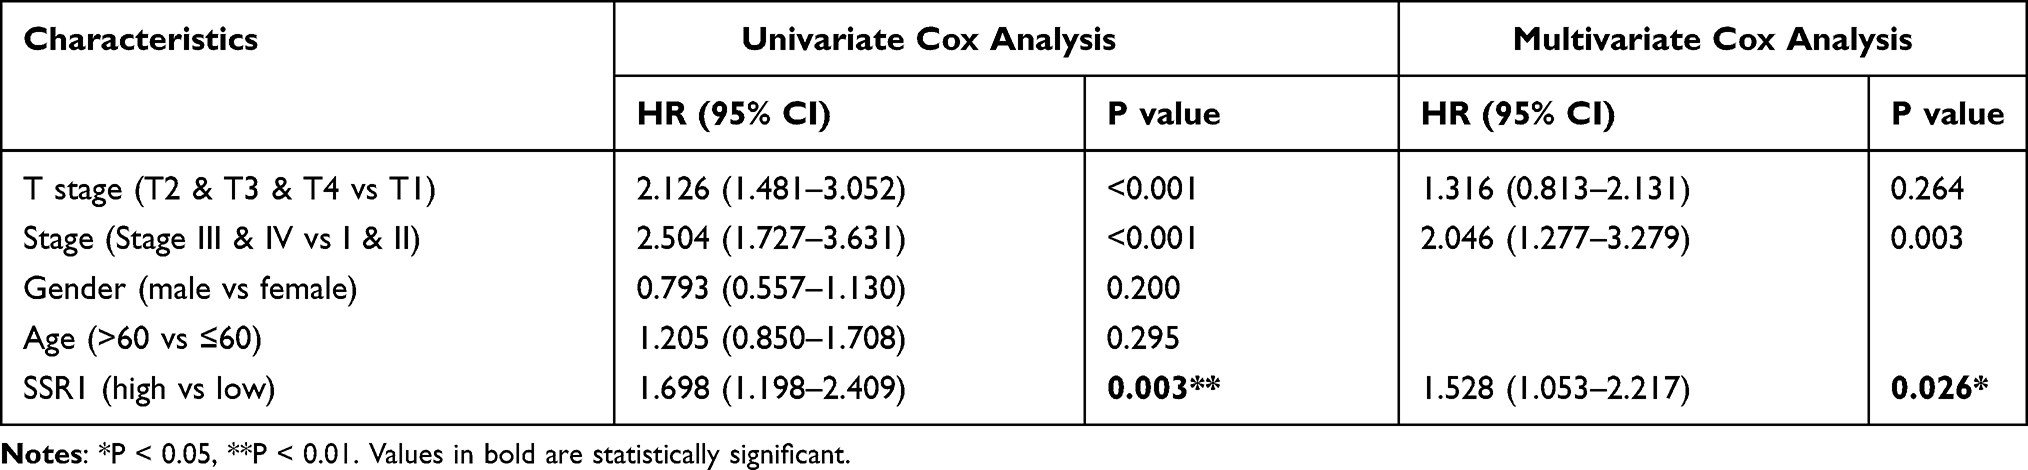 |
Table 3 Univariate Analysis and Multivariate Analysis of Hpatocellular Carcinoma Patients’ Overall Survival |
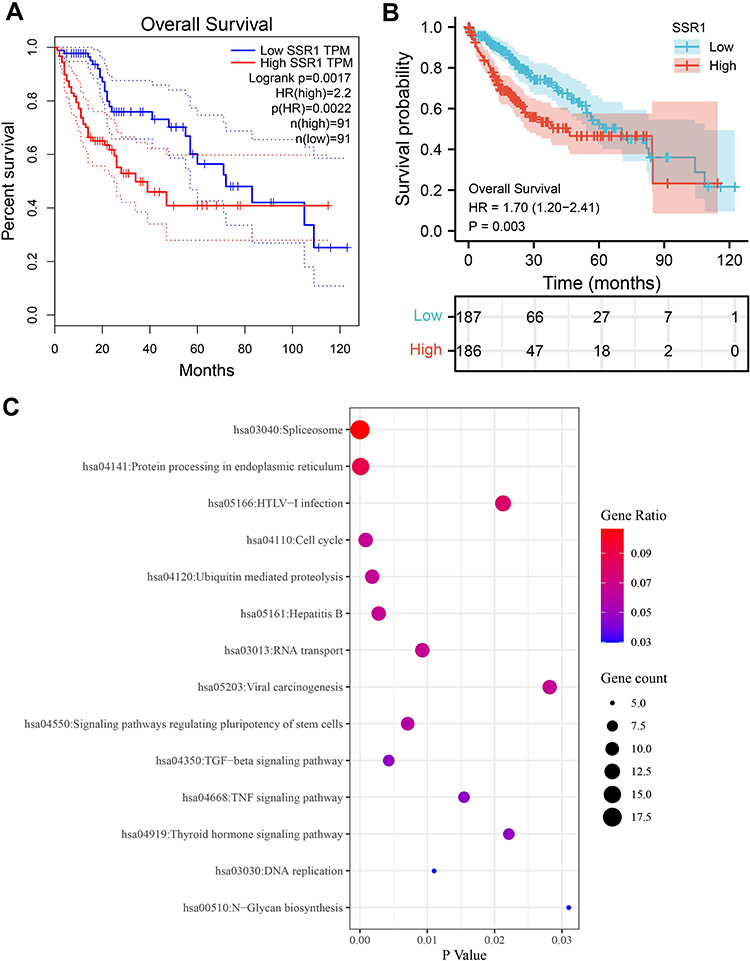 |
Figure 6 KM survival analysis and functional enrichment analysis of the genes relevant to SSR1 in Hepatocellular Carcinoma. (A) Overall survival of patients with different SSR1 expression in Hepatocellular Carcinoma based on GEPIA database. (B) Overall survival of patients with different SSR1 expression in Hepatocellular Carcinoma based on dataset downloaded from TCGA database. (C) The Kyoto Encyclopedia of Genes and Genomes pathway analysis of the genes relevant to SSR1 in Hepatocellular Carcinoma. |
SSR1-Related Genes and KEGG Pathway Analysis
Through using the method described in the method section, 587 SSR1 related genes that had a similar expression pattern to SSR1 were obtained in the UALCAN database. Then, we conducted the KEGG pathway analysis on the above SSR1-related genes. The results obtained in our study indicated that SSR1-related genes were mainly enriched in “hsa03040: Spliceosome”, “hsa04110: Cell cycle”, “hsa04350: TGF-beta signaling pathway”, “hsa03030: DNA replication”, etc. (Figure 6C).
Exploring SSR1-Related Pathways Through GSEA
In our study, we used GSEA to initially explore the potential pathways and functions of SSR1 in HCC (Figure 7). The results showed that the overexpression of SSR1 in HCC might be involved in several signal pathways related to cancers, such as the DNA replication signal pathway, Cell cycle signal pathway, and WNT signal pathway. The overexpression of SSR1 was also related to the MAPK and TGF-beta signaling pathways.
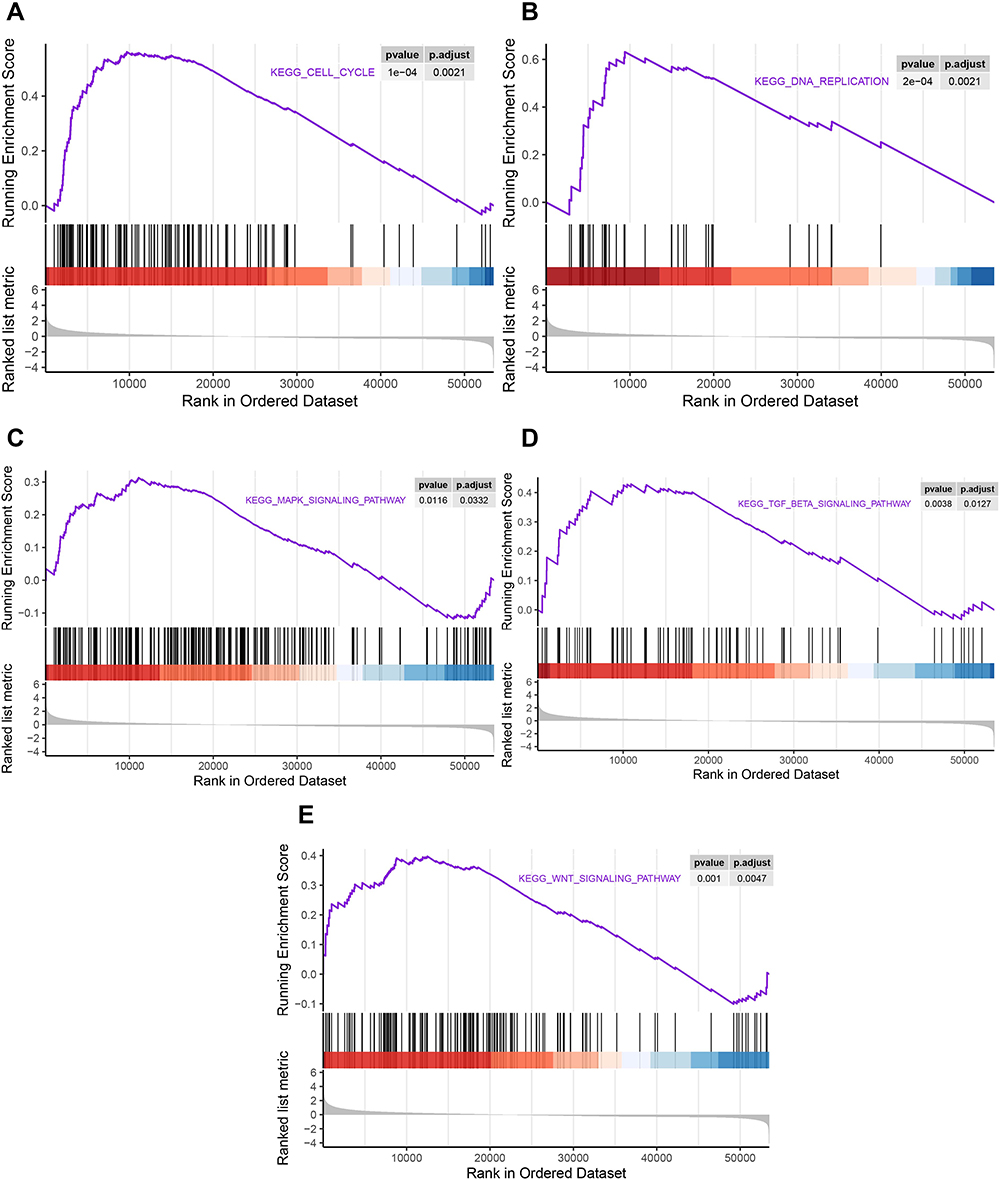 |
Figure 7 GSEA plot showing that SSR1 expression positively correlated with five significant Signaling pathways. (A) Cell cycle signal pathway; (B) DNA replication signal pathway; (C) MAPK signaling pathways. (D) TGF-beta signaling pathways; (E) WNT signal pathway. |
Quantitative Real-Time Polymerase Chain Reaction (qRT-PCR)
We next conducted qRT-PCR analysis on 11 heaptocellular carcinoma (HCC) patients, from whom the HCC tissue, Peri-carcinoma liver tissue (PHCC) and the normal liver tissue was taken for SSR1 mRNA quantification. Figure 8 showed that the SSR1 expression in HCC was significantly higher than the Peri-carcinoma tissue (PHCC) and the corresponding normal liver tissue taken from the same patient. The results were analyzed using one-way ANOVA (**p<0.01, ***p<0.001).
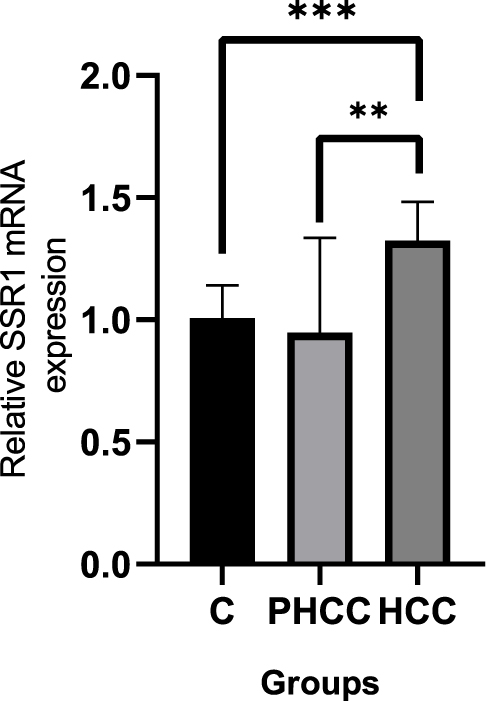 |
Figure 8 Quantitative Real-Time Polymerase Chain Reaction (QRT-PCR) to verify the expression of SSR1 in HCC. The SSR1 expression in HCC was significantly higher than the Peri-carcinoma tissue (PHCC) and the corresponding normal liver tissue taken from the same patient. The results were analyzed using one-way ANOVA (**p<0.01, ***p<0.001). |
Discussion
Hepatocellular Carcinoma (HCC) is a common primary liver cancer with a high degree of malignancy.22 Due to the shortcomings of existing biomarkers, most patients can only be diagnosed at an advanced stage. At this time, their treatment options were already very limited, and the prognosis was often abysmal.23 Therefore, finding meaningful biomarkers is particularly critical. SSR1 is an endoplasmic reticulum membrane receptor involved in protein translocation across the endoplasmic reticulum membrane.24 As a member of the SSR family, it is closely related to cellular growth and proliferation and is closely related to various tumor types.25,26 However, the role of SSR1 in HCC remains unrevealed. In our current study, we combined multiple databases to conduct data mining to comprehensively analyze the diagnostic value and prognostic value of SSR1 and try to clarify its potential molecular mechanism in HCC.
As mentioned in the introduction, previous studies have observed the overexpression of SSR1 in a variety of cancers, but its expression pattern in HCC has not been thoroughly studied. Here, we first utilized online databases (GEPIA, TIMER) and 12 independent datasets (from TCGA and GEO databases) to prove a significant upregulation in patients with HCC, while the immunohistochemical analysis from the HPA database also achieved consistent results. Further, as expected, the overall SMD (SMD=1.25, 95% CI: 1.10–1.39, P=0.03), calculated by integrating 11 GEO datasets, also confirmed the overexpression of SSR1 in HCC. In summary, the above sufficient evidence confirmed that SSR1 overexpression in HCC, which was similar to its expression pattern in other cancers.
This study also aims to reveal the clinical significance of SSR1 in HCC. Our research found that SSR1 expression is significantly correlated with the T stage, Gender, and Pathologic stage. Studies have also shown that overexpression of SSR1 was an independent risk factor for HCC, and its high expression indicated a poor prognosis for HCC. Patients with high SSR1 expression had shorter overall survival (OS). Meanwhile, ROC analysis from multiple independent datasets showed that SSR1 had an upper-middle diagnostic ability. SROC analysis integrating SSR1 expression profile data from 11 GEO datasets also showed that SSR1 had a moderate diagnostic ability in HCC, representing a strong distinguishing ability between HCC tissues and normal tissues. In general, all the current evidence revealed that over-expressed SSR1 might act as a cancer-promoting factor in HCC, which could be used as a potential diagnostic and prognostic marker for HCC.
The molecular mechanisms and function of SSR1 in HCC are unclear. Therefore, we collected 587 genes with similar expression patterns of SSR1 in HCC and performed KEGG pathway analysis. The results show that these genes are mainly involved in the Cell cycle, DNA replication, and TGF-beta signaling pathway, which may be the mechanism by which SSR1 cooperates with similar genes to exert its many critical biological functions in HCC. In addition, the results of GSEA also showed that the excessive activation of the above three signaling pathways was most closely related to the increase of SSR1 expression in HCC patients. Based on the above results, SSR1 is most likely to play a potential cancer-promoting effect in HCC through the intersecting signal pathways. Among the three pathways, the role of cell cycle signaling pathways in cancer has received extensive attention. As we all know, the complete and effective cell cycle was necessary for normal cell proliferation.27 Cell cycle changes were a critical feature of malignant tumors, and its imbalance is an essential step in tumorigenesis.28 Uncontrolled cell proliferation was an essential feature of cancer, which was closely related to the unbalanced cell cycle. The transition from normal cells to malignant tumor cells involved the dysregulation of various cell cycle control genes. Multiple signaling pathways, including MAPK, Wnt, and Notch signaling pathways, were involved in regulating the expression of cyclin and participating in tumor progression.29,30 The GSEA analysis in this study also showed excessive activation of MAPK and Wnt signaling pathways in HCC patients, which further suggested the existence of a correlation between SSR1 and the cell cycle. Besides, successful G2 /M transformation was the key to cell division.31 Limited studies have shown that curcumin-treated human colorectal cancer cells down-regulate the expression of SSR1, arresting the cell cycle in the G2/M phase, thereby exerting an anti-cancer effect.17 Therefore, based on our research and previous evidence, we speculate that SSR1, which is up-regulated in HCC, promotes the occurrence and development of HCC by regulating the cell cycle and plays a role as a cancer-promoting factor.
However, some restrictions may affect the reliability of our conclusions. First, the SSR1 expression profile data comes from multiple platforms, and the lack of uniform standardization may lead to inaccurate results. Second, the specific signaling pathways regulated by SSR1 in HCC must still be verified using rigorous in vitro and in vivo experiments. Finally, the adverse effects of the asymmetric sample size between groups cannot be completely eliminated, and the results need to be interpreted carefully.
Summarily, this study shows that SSR1 may be used as a biomarker for HCC diagnosis and prognosis, and it is very likely to participate in the occurrence and development of HCC by regulating the cell cycle. However, further research is needed to determine the specific molecular mechanism of SSR1 in HCC.
Conclusion
Our research showed that overexpressed SSR1 in HCC was likely to participate in the occurrence and development of HCC by affecting the cell cycle. Besides, it could predict the poor prognosis of HCC patients and had the potential as a biomarker for the diagnosis and prognosis of HCC. Our research will provide some references for the further study of SSR1.
Abbreviations
HCC, hepatocellular carcinoma; HR, hazard ratio; CI, confidence interval; KEGG, Kyoto Encyclopedia of Genes and Genomes; SSR1, signal sequence receptor 1; SMD, standardized mean difference; ROC, receiver operating characteristic; SROC, summary receiver operating characteristic; GSEA, gene set enrichment analysis; OS, overall survival; TCGA, The Cancer Genome Atlas; GEO, Gene Expression Omnibus; GTEx, Genotype-Tissue Expression.
Data Sharing Statement
The datasets supporting the conclusions of this study are included in the article.
Ethics Declarations
All procedures performed were in accordance with the declaration of the ethical standards of the Fuyang Hospital Affiliated to Anhui Medical University and with the 1964 Helsinki 387 Declaration and its later amendments. The ethics committee of the Fuyang Hospital Affiliated to Anhui Medical University has approved this study.
Author Contributions
All authors made a significant contribution to the work reported, whether that is in the conception, study design, execution, acquisition of data, analysis and interpretation, or in all these areas; took part in drafting, revising or critically reviewing the article; gave final approval of the version to be published; have agreed on the journal to which the article has been submitted; and agree to be accountable for all aspects of the work.
Funding
There is no funding to report.
Disclosure
The authors report no conflicts of interest in this work.
References
1. Kim DW, Talati C, Kim R. Hepatocellular carcinoma (HCC): beyond sorafenib-chemotherapy. J Gastrointest Oncol. 2017;8(2):256–265. doi:10.21037/jgo.2016.09.07
2. Chen J, Yang J, Xu Q, et al. Integrated bioinformatics analysis identified MTHFD1L as a potential biomarker and correlated with immune infiltrates in hepatocellular carcinoma. Biosci Rep. 2021;41(2). doi:10.1042/BSR20202063
3. Wang A, Chen X, Li D, Yang L, Jiang J. METTL3-mediated m6A methylation of ASPM drives hepatocellular carcinoma cells growth and metastasis. J Clin Lab Anal. 2021;35:e23931.
4. Yang H, Zhang X, Cai XY, et al. From big data to diagnosis and prognosis: gene expression signatures in liver hepatocellular carcinoma. PeerJ. 2017;5:e3089. doi:10.7717/peerj.3089
5. Shi L, Shang X, Nie K, et al. Identification of potential crucial genes associated with the pathogenesis and prognosis of liver hepatocellular carcinoma. J Clin Pathol. 2021;74(8):504–512. doi:10.1136/jclinpath-2020-206979
6. Jiang W, Wang L, Zhang Y, Li H. Circ-ATP5H induces hepatitis B virus replication and expression by regulating miR-138-5p/TNFAIP3 axis. Cancer Manag Res. 2020;12:11031–11040. doi:10.2147/CMAR.S272983
7. Chen G, Mo S, Yuan D. Upregulation mitochondrial carrier 1 (MTCH1) is associated with cell proliferation, invasion, and migration of liver hepatocellular carcinoma. Biomed Res Int. 2021;2021:9911784. doi:10.1155/2021/9911784
8. Abdel Samee NM, Solouma NH, Kadah YM. Detection of biomarkers for hepatocellular carcinoma using a hybrid univariate gene selection methods. Theor Biol Med Model. 2012;9:34. doi:10.1186/1742-4682-9-34
9. Luo J, Chen M, Huang H, et al. Circulating microRNA-122a as a diagnostic marker for hepatocellular carcinoma. Onco Targets Ther. 2013;6:577–583.
10. Akada J, Kamei S, Ito A, et al. A new type of protein chip to detect hepatocellular carcinoma-related autoimmune antibodies in the sera of hepatitis C virus-positive patients. Proteome Sci. 2013;11(1):33. doi:10.1186/1477-5956-11-33
11. Huang S, Zhong W, Shi Z, et al. Overexpression of signal sequence receptor Î3 predicts poor survival in patients with hepatocellular carcinoma. Hum Pathol. 2018;81:47–54. doi:10.1016/j.humpath.2018.06.014
12. Yan J, Wang ZH, Yan Y, et al. RP11-156L14.1 regulates SSR1 expression by competitively binding to miR-548ao-3p in hypopharyngeal squamous cell carcinoma. Oncol Rep. 2020;44(5):2080–2092.
13. Liu Y, Cao J, Pu YS, Ma Y, Wu M, Wang JH. RP11-874J12.4, a novel lncRNA, confers chemoresistance in human gastric cancer cells by sponging miR-3972 and upregulating SSR2 expression. Am J Transl Res. 2021;13(6):5892–5910.
14. Garg B, Pathria G, Wagner C, Maurer M, Wagner SN. Signal Sequence Receptor 2 is required for survival of human melanoma cells as part of an unfolded protein response to endoplasmic reticulum stress. Mutagenesis. 2016;31(5):573–582. doi:10.1093/mutage/gew023
15. Hong X, Luo H, Zhu G, et al. SSR2 overexpression associates with tumorigenesis and metastasis of Hepatocellular Carcinoma through modulating EMT. J Cancer. 2020;11(19):5578–5587. doi:10.7150/jca.44788
16. Funakoshi Y, Wang Y, Semba T, et al. Comparison of molecular profile in triple-negative inflammatory and non-inflammatory breast cancer not of mesenchymal stem-like subtype. PLoS One. 2019;14(9):e0222336. doi:10.1371/journal.pone.0222336
17. Van Erk MJ, Teuling E, Staal YC, et al. Time- and dose-dependent effects of curcumin on gene expression in human colon cancer cells. J Carcinog. 2004;3(1):8. doi:10.1186/1477-3163-3-8
18. Liu Y, Yi Y, Wu W, Wu K, Zhang W. Bioinformatics prediction and analysis of hub genes and pathways of three types of gynecological cancer. Oncol Lett. 2019;18(1):617–628.
19. Chandrashekar DS, Bashel B, Balasubramanya SAH, et al. UALCAN: a portal for facilitating tumor subgroup gene expression and survival analyses. Neoplasia. 2017;19(8):649–658. doi:10.1016/j.neo.2017.05.002
20. Wang F, Li X, Zhu X, Chen Q, Jiang L, Zhu Z. Renal tubular complement 3 deposition in children with primary nephrotic syndrome. Biomed Res Int. 2018;2018:4386438.
21. Yu G, Wang LG, Han Y, He QY. clusterProfiler: an R package for comparing biological themes among gene clusters. Omics. 2012;16(5):284–287. doi:10.1089/omi.2011.0118
22. Guo J, Tang Q. Recent updates on chimeric antigen receptor T cell therapy for hepatocellular carcinoma. Cancer Gene Ther. 2021. doi:10.1038/s41417-020-00259-4
23. Xiao S, Huang S, Yang J. Overexpression of GIHCG is associated with a poor prognosis and immune infiltration in hepatocellular carcinoma. Onco Targets Ther. 2020;13:11607–11619. doi:10.2147/OTT.S271966
24. Ju Z, Bhardwaj A, Embury MD, et al. Integrative analyses of multilevel omics reveal preneoplastic breast to possess a molecular landscape that is globally shared with invasive basal-like breast cancer (Running title: molecular landscape of basal-like breast cancer progression). Cancers. 2020;12(3):722.
25. Simerman AA, Phan JD, Dumesic DA, Chazenbalk GD. Muse cells: nontumorigenic pluripotent stem cells present in adult tissues-A paradigm shift in tissue regeneration and evolution. Stem Cells Int. 2016;2016:1463258. doi:10.1155/2016/1463258
26. Tornesello ML, Buonaguro L, Izzo F, Buonaguro FM. Molecular alterations in hepatocellular carcinoma associated with hepatitis B and hepatitis C infections. Oncotarget. 2016;7(18):25087–25102. doi:10.18632/oncotarget.7837
27. Mahajan UM, Teller S, Sendler M, et al. Tumour-specific delivery of siRNA-coupled superparamagnetic iron oxide nanoparticles, targeted against PLK1, stops progression of pancreatic cancer. Gut. 2016;65(11):1838–1849. doi:10.1136/gutjnl-2016-311393
28. Wang H, Zhang P. lncRNA‑CASC15 promotes osteosarcoma proliferation and metastasis by regulating epithelial‑mesenchymal transition via the Wnt/Î2‑catenin signaling pathway. Oncol Rep. 2021;45(5). doi:10.3892/or.2021.8027
29. Lonetto G, Koifman G, Silberman A, et al. Mutant p53-dependent mitochondrial metabolic alterations in a mesenchymal stem cell-based model of progressive malignancy. Cell Death Differ. 2019;26(9):1566–1581. doi:10.1038/s41418-018-0227-z
30. Yue Z, Guan X, Chao R, et al. Diallyl disulfide induces apoptosis and autophagy in human osteosarcoma MG-63 cells through the PI3K/Akt/mTOR pathway. Molecules. 2019;24(14):2665. doi:10.3390/molecules24142665
31. Yin X, Zhang R, Feng C, et al. Diallyl disulfide induces G2/M arrest and promotes apoptosis through the p53/p21 and MEK-ERK pathways in human esophageal squamous cell carcinoma. Oncol Rep. 2014;32(4):1748–1756. doi:10.3892/or.2014.3361
 © 2021 The Author(s). This work is published and licensed by Dove Medical Press Limited. The full terms of this license are available at https://www.dovepress.com/terms.php and incorporate the Creative Commons Attribution - Non Commercial (unported, v3.0) License.
By accessing the work you hereby accept the Terms. Non-commercial uses of the work are permitted without any further permission from Dove Medical Press Limited, provided the work is properly attributed. For permission for commercial use of this work, please see paragraphs 4.2 and 5 of our Terms.
© 2021 The Author(s). This work is published and licensed by Dove Medical Press Limited. The full terms of this license are available at https://www.dovepress.com/terms.php and incorporate the Creative Commons Attribution - Non Commercial (unported, v3.0) License.
By accessing the work you hereby accept the Terms. Non-commercial uses of the work are permitted without any further permission from Dove Medical Press Limited, provided the work is properly attributed. For permission for commercial use of this work, please see paragraphs 4.2 and 5 of our Terms.