")
Back to Journals » International Journal of Chronic Obstructive Pulmonary Disease » Volume 13
Clinical utility of fractional exhaled nitric oxide and blood eosinophils counts in the diagnosis of asthma-COPD overlap
Authors Takayama Y, Ohnishi H, Ogasawara F, Oyama K , Kubota T, Yokoyama A
Received 9 March 2018
Accepted for publication 2 June 2018
Published 21 August 2018 Volume 2018:13 Pages 2525—2532
DOI https://doi.org/10.2147/COPD.S167600
Checked for plagiarism Yes
Review by Single anonymous peer review
Peer reviewer comments 2
Editor who approved publication: Dr Richard Russell
Yusuke Takayama, Hiroshi Ohnishi, Fumiya Ogasawara, Kosuke Oyama, Tetsuya Kubota, Akihito Yokoyama
Department of Hematology and Respiratory Medicine, Kochi Medical School, Kochi University, Nankoku City, Kochi, Japan
Background: Asthma–COPD overlap (ACO) is difficult to diagnose because it is characterized by persistent airflow limitation, and patients present with several manifestations that are usually associated with both asthma and COPD. In this retrospective study, we aimed to evaluate the diagnostic accuracy of fractional exhaled nitric oxide (FeNO) and blood eosinophil counts for the clinical diagnosis of ACO.
Patients and methods: A total of 121 patients were divided into two study groups, COPD alone or ACO, which was based on criteria from the joint document by the Global Initiative for Asthma and the Global initiative for chronic Obstructive Lung Disease. From July 2014 to April 2017, FeNO levels and blood eosinophil counts were measured in specimens from patients naïve to inhaled corticosteroids (ICS) and those using ICS. Receiver operating characteristic curve analysis was used to determine the cutoff values of FeNO and blood eosinophil levels that provided the best differential diagnosis between ACO and COPD.
Results: Among a total of 121 patients, 65 patients were diagnosed with COPD and 56 patients with ACO. The FeNO level was higher in patients with ACO than in patients with COPD (median 24.5 vs 16.0 ppb, respectively; P<0.01). Among patients naïve to ICS, the area under the receiver operating characteristic curve of FeNO values was 0.726, and the optimal diagnostic cutoff level of FeNO was 25.0 ppb, with 60.6% sensitivity and 87.7% specificity for differentiating ACO from COPD. FeNO (≥25.0 ppb) combined with blood eosinophil counts (≥250/µL) showed 96.1% specificity.
Conclusion: These results demonstrate that the FeNO level combined with blood eosinophil count is useful for the differential diagnosis between ACO and COPD.
Keywords: asthma–COPD overlap, fractional exhaled nitric oxide, blood eosinophil counts
Introduction
Asthma–COPD overlap (ACO) is characterized by persistent airflow limitation and several manifestations usually associated with both asthma and COPD.1 There is broad agreement that patients with ACO have worse outcomes than patients with COPD or asthma alone, unless they receive adequate treatment, which includes inhaled corticosteroids (ICS).2,3 Although the Global Initiative for Asthma (GINA) and the Global initiative for chronic Obstructive Lung Disease (GOLD) proposed a stepwise approach for the diagnosis of ACO,1 the diagnostic criteria were based on syndromic features and lacked objective indicators, such as results from lung function testing, imaging, and testing for inflammatory biomarkers. A GINA/GOLD document on ACO recommended that both fractional exhaled nitric oxide (FeNO) and blood eosinophils be used as inflammatory biomarkers for differentiating ACO from COPD.1
Although previous studies have reported that FeNO4–6 and blood eosinophil levels4 were good parameters for differentiating between ACO and COPD, several limitations were identified. First, ACO was not defined according to the universally accepted definition.5,6 Second, these studies4–6 included patients receiving ICS, which affect FeNO levels7,8 and blood eosinophil counts.9 Taking these limitations into account, we performed a retrospective study that aimed to evaluate the diagnostic accuracy of FeNO levels and blood eosinophil counts for the clinical diagnosis of ACO.
Patients and methods
Patient population
Patients with COPD who underwent FeNO testing at Kochi Medical School Hospital from July 2014 to April 2017 were retrospectively enrolled in this study. COPD patients were diagnosed according to the following GOLD criterion: a forced expiratory volume in 1 second/forced vital capacity ratio of <0.70 after bronchodilator use. Subjects were excluded if they had used oral corticosteroids during the previous 4 weeks. The ethical review board of Kochi Medical School approved this study protocol and waived written informed consent from patients, because this was a noninterventional trial and the study was retrospective (approval number: 29-124). We confirmed that the patient confidentiality in this study was maintained.
Methods
Patients were divided into two study groups, COPD alone and ACO according to syndromic and spirometric features of the ACO from the GINA/GOLD joint document.1 The features of the ACO took into consideration the following general categories: age at onset, pattern of symptoms, lung function, patient or family history, time course, and chest X-ray. Participants in this study fulfilled three or more features of COPD. Among patients with COPD, we further identified ACO patients as those with three or more features of asthma as follows: onset before age 20 years, family history of asthma or allergic rhinitis or eczema, normal findings on chest X-rays without severe hyperinflation, common time course in asthmatic patients, variable respiratory symptoms, and variable expiratory airflow limitation. The common time course included spontaneous improvement and immediate response to bronchodilator or to ICS over weeks. Variable respiratory symptoms included wheezing and shortness of breath that varied over minutes, hours, or days and worsened during the night or early morning. Variable expiratory airflow limitation was defined as improvement in forced expiratory volume in 1 second ≥200 mL and ≥12% from baseline immediately after the use of a bronchodilator or several weeks after the use of ICS. We evaluated these diagnostic features, which were extracted from the patients’ medical records.
Inflammatory biomarkers
FeNO was measured using the NIOX MINO device (Aerocrine AB, Solna, Sweden), according to the recommendations of the American Thoracic Society/European Respiratory Society.10 FeNO results are reported as parts per billion (ppb).
Blood eosinophil counts were determined from peripheral blood samples; absolute blood eosinophil counts are reported as cells/μL. Blood eosinophil counts were acquired from 110 of the 121 patients enrolled in this study.
Data on these biomarkers were extracted from the patients’ medical records. In patients who were measured for these biomarkers before and after the use of ICS, we extracted data at any two time points.
Statistical analysis
Data are shown as medians (interquartile range) or mean ± SD, unless otherwise specified. Differences between groups were assessed by the Mann–Whitney U test and Fisher’s exact test. The relationship between FeNO levels and blood eosinophil counts was assessed by determining Spearman’s rank correlation coefficients. Receiver operating characteristic (ROC) curve analysis with measurements of area under the curve (AUC) was used to evaluate the diagnostic value of FeNO and blood eosinophil levels for differentiating ACO from COPD. We performed the analysis with different cutoff values for FeNO and blood eosinophils, and an optimal cutoff value was obtained from the highest value for the sum of sensitivity and specificity. All statistical analyses were performed with EZR software (Saitama Medical Center, Jichi Medical University, Saitama, Japan), a graphical user interface for R (The R Foundation for Statistical Computing, Vienna, Austria). Briefly, the EZR software is a modified version of R commander that was designed to add statistical functions frequently used in biostatistics.11 P-values <0.05 were considered significant.
Results
Characteristics of the study patients
A total of 121 patients were enrolled in this study. According to the diagnostic criteria, 65 (53.7%) patients had COPD alone and 56 (46.3%) patients had ACO. The characteristics of the study patients are shown in Table 1. Patients with ACO had fewer tobacco smoking pack-years (P=0.048) than patients with COPD. In addition, the proportion of patients with ACO who were treated with ICS at the time of FeNO measurement was higher than the proportion of patients with COPD treated with ICS at the time of FeNO measurement (41.1% vs 12.3%, respectively; P<0.001). The difference between the frequency of comorbidities in patients with COPD and ACO was not significant.
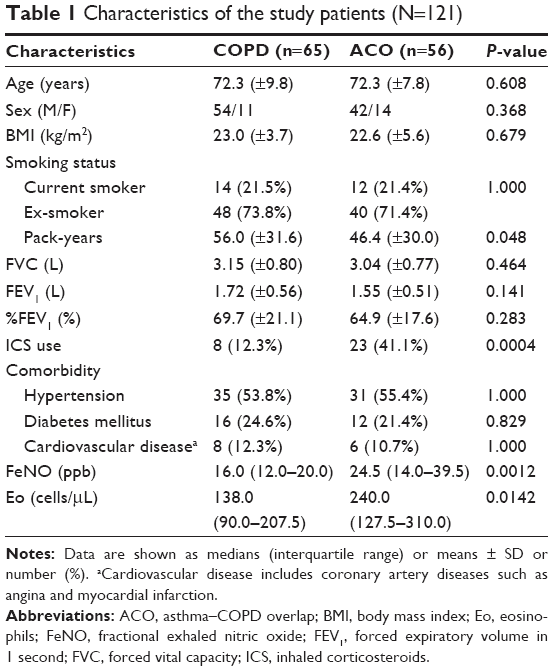 | Table 1 Characteristics of the study patients (N=121) |
Inflammatory biomarkers in patients with COPD and ACO
The FeNO levels were higher in patients with ACO than in patients with COPD (median 24.5 ppb [14.0–39.5 ppb] vs 16.0 ppb [12.0–20.0 ppb], respectively; P<0.01). Among patients naïve to ICS, the difference between the FeNO levels of the two patient groups (median 27.0 ppb [15.0–44.0 ppb] vs 15.0 ppb [11.0–19.0 ppb]; P<0.001) was notable when compared to the differences between all patients in the two groups. The difference between the FeNO levels of patients being treated with ICS in both the ACO and COPD groups was not significant (median 21.0 ppb [12.5–35.0 ppb] vs 19.0 ppb [15.3–31.5 ppb], respectively; P=0.95; Figure 1A). In addition, among current smokers, the FeNO levels were higher in patients with ACO than in patients with COPD (median 24.0 ppb [13.8–39.3 ppb] vs 14.0 ppb [9.5–16.0 ppb], respectively; P<0.05). Similarly, the blood eosinophil counts were higher in patients with ACO than in patients with COPD (median 240.0 cells/μL [127.5–310.0 cells/μL] vs 138.0 cells/μL [90.0–207.5 cells/μL], respectively; P<0.05). However, among patients treated with ICS, the difference between the blood eosinophil counts of the patients in each group was not significant (Figure 1B). Moreover, FeNO levels were significantly reduced from a baseline median value of 36.0 ppb (25.0–46.0 ppb) to 21.0 ppb (15.0–36.0 ppb) after ICS treatment (P<0.05; Figure 2A). The median treatment duration of ICS in patients whose FeNO levels are shown in Figure 2A was 18 weeks. In addition, blood eosinophil counts were also significantly reduced from a median baseline value of 294.0 cells/μL (177.5–347.5 cells/μL) to 185.0 cells/μL (120.0–269.5 cells/μL) after ICS treatment (P<0.05; Figure 2B). The median treatment duration of ICS in patients whose eosinophil counts are shown in Figure 2B was 23 weeks. Although both FeNO levels and blood eosinophil counts were higher in patients with ACO than in patients with COPD, the correlations between FeNO levels and blood eosinophil counts in patients with either COPD or ACO were not significant (Figure 3).
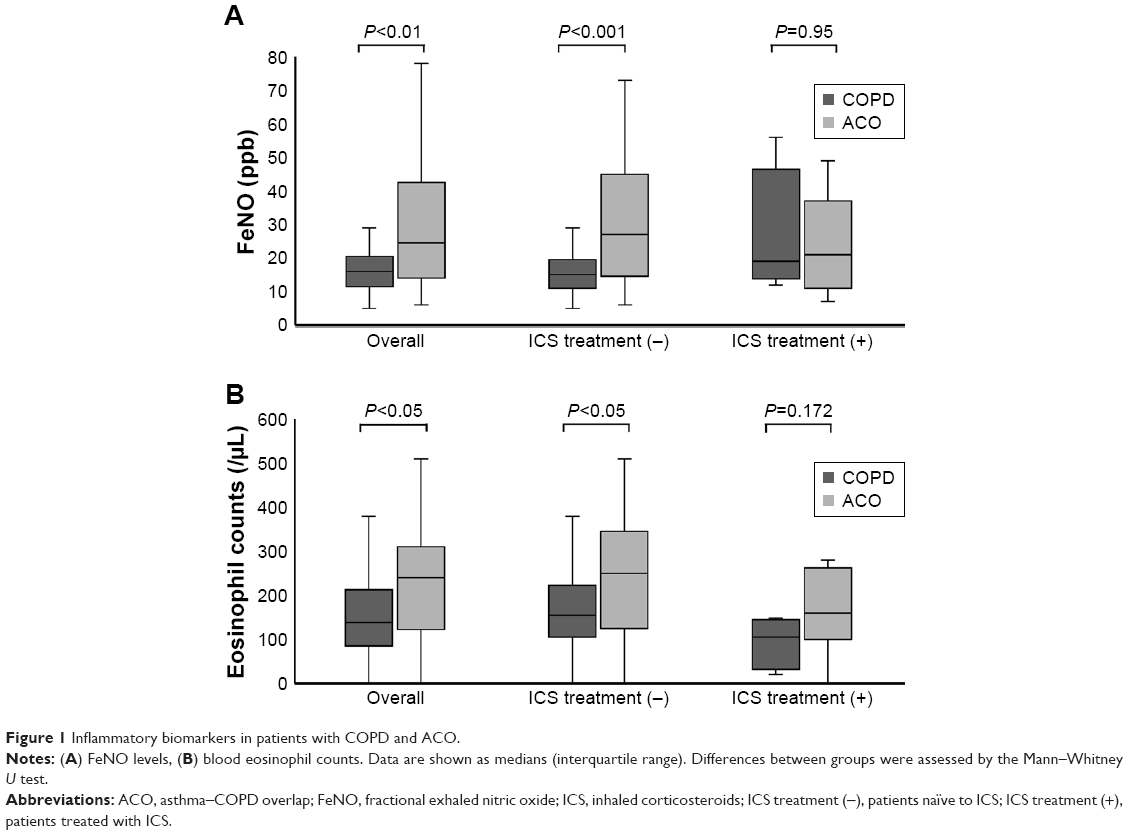 | Figure 1 Inflammatory biomarkers in patients with COPD and ACO. |
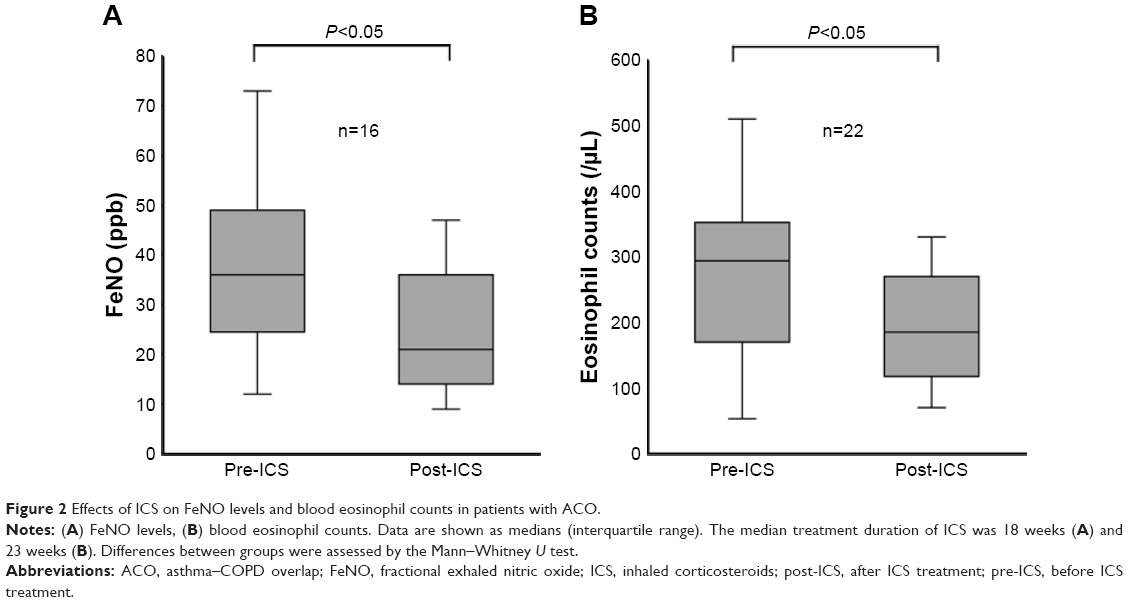 | Figure 2 Effects of ICS on FeNO levels and blood eosinophil counts in patients with ACO. |
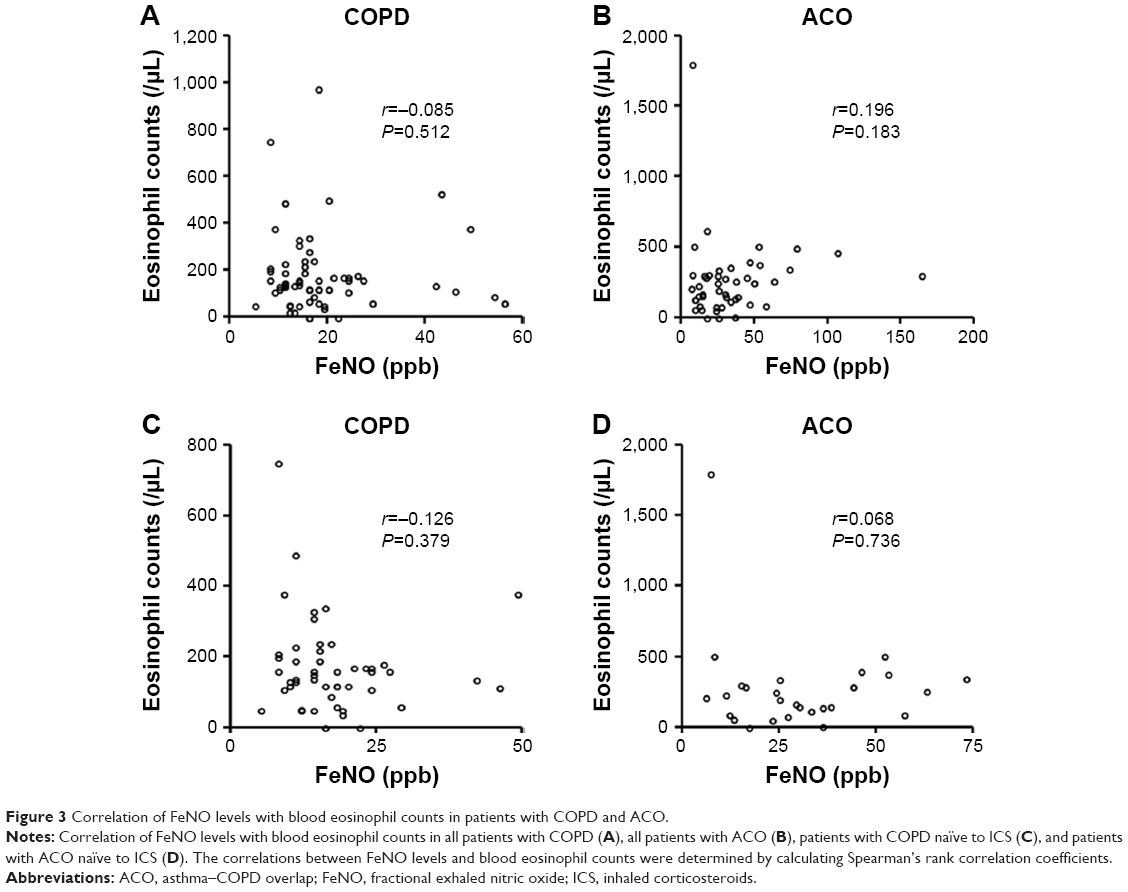 | Figure 3 Correlation of FeNO levels with blood eosinophil counts in patients with COPD and ACO. |
Diagnostic accuracy of biomarkers
ROC curve analysis demonstrated that 21.0 ppb was the best diagnostic cutoff value of FeNO for differentiating ACO from COPD (AUC: 0.671). The sensitivity and specificity at 21.0 ppb for the diagnosis of ACO were 62.5% and 75.4%, respectively. Among patients naïve to ICS, the AUC for FeNO was calculated to be 0.726, and the optimal diagnostic cutoff level was 25.0 ppb, with 60.6% sensitivity and 87.7% specificity for differentiating ACO from COPD (Figure 4A). On the other hand, ROC curve analysis demonstrated that 250 cells/μL was the best cutoff value for blood eosinophil counts in differentiating ACO from COPD. However, the AUC for blood eosinophil counts was relatively low, even among patients naïve to ICS (Figure 4B). Unlike blood eosinophil counts, FeNO was thought to be useful for differentiating ACO from COPD, especially among patients naïve to ICS.
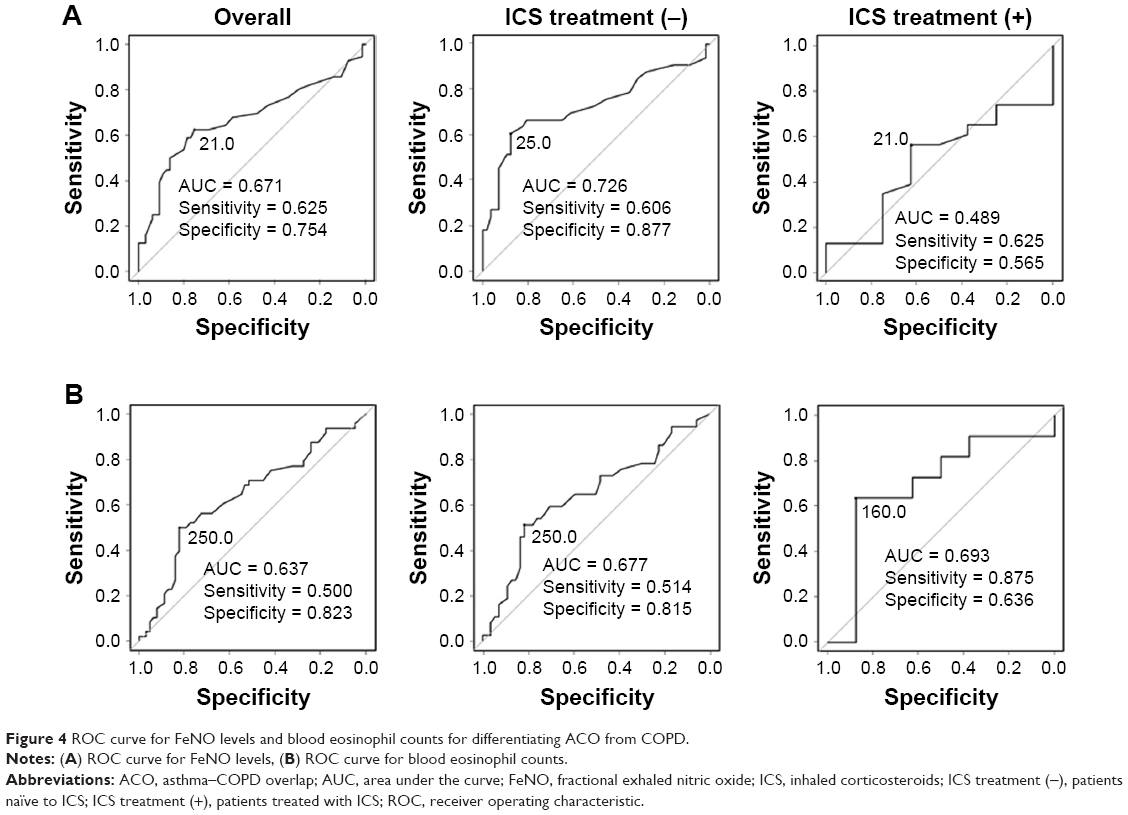 | Figure 4 ROC curve for FeNO levels and blood eosinophil counts for differentiating ACO from COPD. |
Diagnostic accuracy of FeNO levels and blood eosinophil counts combined
We examined the diagnostic accuracy of FeNO levels combined with blood eosinophil counts, since each biomarker showed relatively low sensitivity and specificity. The combination of an FeNO level ≥21.0 ppb and a blood eosinophil count ≥250 cells/μL showed 35.4% sensitivity and 96.8% specificity. Among patients naïve to ICS, an FeNO level ≥21.0 ppb plus a blood eosinophil count ≥250 cells/μL showed 25.9% sensitivity and 96.1% specificity (Table 2). These data show that the biomarkers combined led to increased specificity and decreased sensitivity for the diagnosis of ACO compared to the use of either biomarker alone.
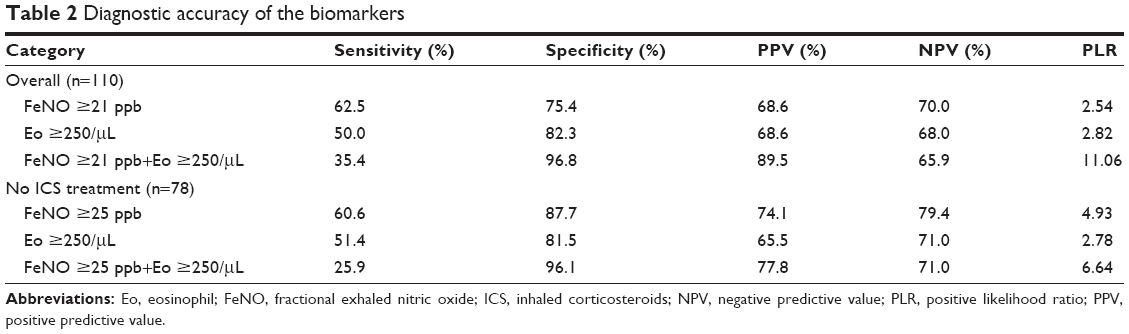 | Table 2 Diagnostic accuracy of the biomarkers |
Discussion
We performed a retrospective study to assess whether inflammatory biomarkers were useful for the diagnosis of ACO. ROC curve analysis demonstrated that 25.0 ppb was the best diagnostic cutoff level of FeNO, with 60.6% sensitivity and 87.7% specificity for differentiating ACO from COPD in patients naïve to ICS. In addition, an FeNO level ≥25.0 ppb combined with a blood eosinophil count ≥250 cells/μL showed high specificity (96.1%). The results of this study demonstrate the utility of FeNO and blood eosinophils for the differential diagnosis of ACO in a population of patients with COPD.
Previous studies4–6 demonstrated the inflammatory biomarkers FeNO and blood eosinophil counts supported the diagnosis of ACO. Chen et al6 reported that the best diagnostic cutoff level of FeNO was 22.5 ppb, with 70.2% sensitivity and 75.0% specificity for differentiating ACO from COPD. In addition, Kobayashi et al4 reported that an FeNO level (≥23.0 ppb) combined with a blood eosinophil count (≥156.2 cells/μL) showed 59.5% sensitivity and 85.5% specificity for the diagnosis of ACO. However, the diagnosis of ACO was not performed using the universally accepted definition5,6 and patients using ICS were not excluded from these studies.4–6 In our study, we used the universally accepted definition in the GINA/GOLD joint document1 to perform the diagnosis of ACO.
This study clearly demonstrated that FeNO levels and/or blood eosinophil counts should be used for differentiating ACO from COPD in patients naïve to ICS treatment, but not in patients using ICS. We believe that this distinction is the primary strength of our study. ICS treatment is known to decrease FeNO levels in patients with asthma.7,8 Our study found that FeNO levels were decreased in patients with ACO after ICS treatment, which could account for the low diagnostic value of FeNO in the diagnosis of ACO in patients being treated by ICS.
Interestingly, the correlations between FeNO levels and blood eosinophil counts in patients with either COPD or ACO were not significant. In patients with asthma, a weak-to-moderate correlation has been observed between FeNO levels and eosinophil counts in blood or sputum.12,13 On the other hand, FeNO levels and blood eosinophil counts were each found to be independently associated with wheezing and asthmatic events,14 which suggests that FeNO and blood eosinophils, respectively, relate to two different inflammatory pathways, interleukin (IL)-4- and IL-13-mediated pathways15 and the IL-5-mediated pathway.16 Our study found that the FeNO level combined with a blood eosinophil count showed high specificity for the diagnosis of ACO. We speculate that the use of two types of inflammatory biomarkers with different properties led to increased diagnostic specificity for the ACO.
ICS play a central role in the treatment of ACO because the asthmatic component of T helper 2 cell-mediated airway inflammation is observed in patients with ACO. However, previous studies have reported that ICS treatment was associated with an increased risk of pneumonia in patients with COPD.17,18 Therefore, ICS should not be used in patients without an asthmatic component. Our study found that the combination of FeNO (≥25.0 ppb) and blood eosinophil counts (≥250 cells/μL) showed high specificity (96.1%) for differentiating ACO from COPD. This combination of cutoff values, which showed such high specificity, could be useful for preventing the inappropriate use of ICS in patients without an asthmatic component.
This was a retrospective study with several limitations. First, current smoking has been reported to reduce FeNO levels.19 In our study, the number of smoking pack-years of patients with ACO was lower than that of patients with COPD (P=0.048). Although the FeNO levels of ACO patients were higher than those of COPD patients, even among current smokers, the smoking history might have affected the difference between the FeNO levels of the two groups. Second, the FeNO level has been reported to be increased in patients with allergic rhinitis.19 We could not determine if the coexistence of allergic rhinitis affected the FeNO levels of the patients in our study. Third, FeNO levels20 in healthy adults and blood eosinophil counts21 in the general population have been reported to be higher for males than for females. In the present study, there was a higher proportion of male patients than female patients in both the COPD and ACO groups. Additional detailed examinations are required for the diagnosis of ACO.
Conclusion
The results of this study demonstrated that the inflammatory biomarkers FeNO and blood eosinophils can support the diagnosis of ACO. The primary strengths of our study were that ACO was defined according to the universally accepted criteria in the joint GINA/GOLD document and that this study evaluated patients naïve to ICS as well as patients using ICS. For patients naïve to ICS, an FeNO level ≥25.0 ppb combined with a blood eosinophil count ≥250 cells/μL showed high specificity (96.1%) for differentiating ACO from COPD. Treatment with ICS could be useful for patients who satisfy the criteria of an FeNO level ≥25.0 ppb and a blood eosinophil count ≥250 cells/μL.
Disclosure
The authors report no conflicts of interest in this work.
References
Global Initiative for Asthma, Global Initiative for Chronic Obstructive Lung Disease. Diagnosis of Disease of Chronic Airflow Limitation: Asthma, COPD, and Asthma–COPD Overlap Syndrome (ACOS). Available from: http://www.ginasthma.org/local/uploads/files/ACOS_2015.pdf. Accessed February 20, 2018. | ||
Hardin M, Silverman EK, Barr RG, et al. The clinical features of the overlap between COPD and asthma. Respir Res. 2011;12:127. | ||
Silva GE, Sherrill DL, Guerra S, Barbee RA. Asthma as a risk factor for COPD in a longitudinal study. Chest. 2004;126(1):59–65. | ||
Kobayashi S, Hanagama M, Yamanda S, Ishida M, Yanai M. Inflammatory biomarkers in asthma–COPD overlap syndrome. Int J Chron Obstruct Pulmon Dis. 2016;11:2117–2123. | ||
Goto T, Camargo CA, Hasegawa K. Fractional exhaled nitric oxide levels in asthma–COPD overlap syndrome: analysis of the National Health and Nutrition Examination Survey, 2007–2012. Int J Chron Obstruct Pulmon Dis. 2016;11:2149–2155. | ||
Chen FJ, Huang XY, Liu YL, Lin GP, Xie CM. Importance of fractional exhaled nitric oxide in the differentiation of asthma–COPD overlap syndrome, asthma, and COPD. Int J Chron Obstruct Pulmon Dis. 2016;11:2385–2390. | ||
Ichinose M, Takahashi T, Sugiura H, et al. Baseline airway hyperresponsiveness and its reversible component: role of airway inflammation and airway calibre. Eur Respir J. 2000;15(2):248–253. | ||
Kharitonov SA, Yates DH, Barnes PJ. Inhaled glucocorticoids decrease nitric oxide in exhaled air of asthmatic patients. Am J Respir Crit Care Med. 1996;153(1):454–457. | ||
Evans PM, O’Connor BJ, Fuller RW, Barnes PJ, Chung KF. Effect of inhaled corticosteroids on peripheral blood eosinophil counts and density profiles in asthma. J Allergy Clin Immunol. 1993;91(2):643–650. | ||
Dweik RA, Boggs PB, Erzurum SC, et al. An official ATS clinical practice guideline: interpretation of exhaled nitric oxide levels (FENO) for clinical applications. Am J Respir Crit Care Med. 2011;184(5):602–615. | ||
Kanda Y. Investigation of the freely available easy-to-use software ‘EZR’ for medical statistics. Bone Marrow Transplant. 2013;48(3):452–458. | ||
Strunk RC, Szefler SJ, Phillips BR, et al. Relationship of exhaled nitric oxide to clinical and inflammatory markers of persistent asthma in children. J Allergy Clin Immunol. 2003;112(5):883–892. | ||
Mattes J, Storm van’s Gravesande K, Reining U, et al. NO in exhaled air is correlated with markers of eosinophilic airway inflammation in corticosteroid-dependent childhood asthma. Eur Respir J. 1999;13(6):1391–1395. | ||
Malinovschi A, Fonseca JA, Jacinto T, Alving K, Janson C. Exhaled nitric oxide levels and blood eosinophil counts independently associate with wheeze and asthma events in National Health and Nutrition Examination Survey subjects. J Allergy Clin Immunol. 2013;132(4):821–827. | ||
Alving K, Malinovschi A. Basic aspects of exhaled nitric oxide. European Respiratory Society Monograph. 2010;49:1–31. | ||
Stirling RG, van Rensen EL, Barnes PJ, Chung KF. Interleukin-5 induces CD34(+) eosinophil progenitor mobilization and eosinophil CCR3 expression in asthma. Am J Respir Crit Care Med. 2001;164(8 Pt 1):1403–1409. | ||
Drummond MB, Dasenbrook EC, Pitz MW, Murphy DJ, Fan E. Inhaled corticosteroids in patients with stable chronic obstructive pulmonary disease: a systematic review and meta-analysis. JAMA. 2008;300(20):2407–2416. | ||
Singh S, Amin AV, Loke YK. Long-term use of inhaled corticosteroids and the risk of pneumonia in chronic obstructive pulmonary disease: a meta-analysis. Arch Intern Med. 2009;169(3):219–229. | ||
Matsunaga K, Hirano T, Akamatsu K, et al. Exhaled nitric oxide cutoff values for asthma diagnosis according to rhinitis and smoking status in Japanese subjects. Allergol Int. 2011;60(3):331–336. | ||
Matsunaga K, Hirano T, Kawayama T, et al. Reference ranges for exhaled nitric oxide fraction in healthy Japanese adult population. Allergol Int. 2010;59(4):363–367. | ||
Lewis SA, Pavord ID, Stringer JR, et al. The relation between peripheral blood leukocyte counts and respiratory symptoms, atopy, lung function, and airway responsiveness in adults. Chest. 2001;119(1):105–114. |
 © 2018 The Author(s). This work is published and licensed by Dove Medical Press Limited. The full terms of this license are available at https://www.dovepress.com/terms.php and incorporate the Creative Commons Attribution - Non Commercial (unported, v3.0) License.
By accessing the work you hereby accept the Terms. Non-commercial uses of the work are permitted without any further permission from Dove Medical Press Limited, provided the work is properly attributed. For permission for commercial use of this work, please see paragraphs 4.2 and 5 of our Terms.
© 2018 The Author(s). This work is published and licensed by Dove Medical Press Limited. The full terms of this license are available at https://www.dovepress.com/terms.php and incorporate the Creative Commons Attribution - Non Commercial (unported, v3.0) License.
By accessing the work you hereby accept the Terms. Non-commercial uses of the work are permitted without any further permission from Dove Medical Press Limited, provided the work is properly attributed. For permission for commercial use of this work, please see paragraphs 4.2 and 5 of our Terms.