")
Back to Journals » OncoTargets and Therapy » Volume 10
Clinical significance of serum cathepsin B and cystatin C levels and their ratio in the prognosis of patients with esophageal cancer
Authors Yan Y, Zhou K, Wang L, Wang F, Chen X, Fan Q
Received 23 September 2016
Accepted for publication 10 December 2016
Published 3 April 2017 Volume 2017:10 Pages 1947—1954
DOI https://doi.org/10.2147/OTT.S123042
Checked for plagiarism Yes
Review by Single anonymous peer review
Peer reviewer comments 3
Editor who approved publication: Dr Samir Farghaly
Yan Yan,1,* Kun Zhou,2,* Liping Wang,1 Feng Wang,1 Xinfeng Chen,3 Qingxia Fan1
1Department of Oncology, 2Department of Thoracic Surgery, 3Department of Biotherapy Center, The First Affiliated Hospital of Zhengzhou University, Zhengzhou, People’s Republic of China
*These authors contributed equally to this work
Objective: The main purpose of this study was to analyze the serum cathepsin B (CTSB) and cystatin C (CysC) levels in patients with esophageal carcinoma and their correlation with the clinical indices and prognosis.
Methods: The serum levels of CTSB and CysC from 56 patients with esophageal carcinoma and 30 healthy donors were determined preoperatively by using enzyme-linked immunosorbent assay. The correlation between CTSB and CysC was evaluated by Spearman correlation coefficient test. Kaplan–Meier survival curves were plotted, while the survival rates were compared using the log-rank test. Univariate and multivariate analyses of prognostic factors for survival were performed using the Cox proportional hazard regression model with a 95% confidence interval.
Results: CTSB (38.35±4.3 ng/mL) and CysC (703.96±23.6 ng/mL) levels were significantly higher in the sera of the patients than in controls. A significant correlation was observed between CTSB and CysC (r=0.754, P<0.001). The levels of CTSB and CysC/CTSB in the patient serum significantly correlated with the T status. CysC/CTSB ratio was also found to be significantly correlated with lymph node metastasis. None of the parameters were observed to be related to CysC, including age, gender, pathologic type, tumor differentiation and tumor invasion depth. Kaplan–Meier analysis showed that patients with higher levels of CysC/CTSB and negative lymph node metastasis experienced significantly longer overall survival time, whereas patients with higher CSTB levels tended to live shorter, although the difference was not statistically significant (P=0.081).
Conclusion: Serum CTSB and CysC levels are of diagnostic significance in esophageal cancer. The ratio of serum CysC/CTSB is prognostic for the survival of esophageal carcinoma patients.
Keywords: esophageal squamous cell carcinoma, cathepsin B, cystatin C, diagnostic value, prognosis
Introduction
Esophageal cancer is the eighth most common cancer worldwide, which is of low survival rate and rapid progression.1,2 Over 80% of the deaths from esophageal cancer occur in developing and less-developed countries.3,4 People’s Republic of China has a high incidence of esophageal cancer. In spite of the constant progress in treatment, the 5-year survival rate of esophageal cancer patients is still <20%.5 Most patients with esophageal cancer are unresectable in time due to lack of effective diagnostic approaches. Serum markers are of great importance for early diagnosis and prognosis in esophageal cancer patients. Therefore, it is urgent to find new reliable markers.
Proteases were regarded as playing vital roles in a diverse range of processes including inflammation, cell migration, angiogenesis, apoptosis, tumor invasion and metastasis.6–8 Cathepsin B (CTSB), a member of lysosomal cysteine protease, has a structure analogous to the papaya enzyme papain and correlates with the general protein turnover in lysosomes.9,10 A large body of literature revealed that increased activity of CTSB could enhance metastasis or the malignancy of various cancer cells.11,12 Besides, many genomic and proteomic analyses showed that CTSB expression was markedly upregulated in numerous types of cancer, such as breast, gastric, thyroid, ovarian and colorectal cancers, and higher levels of CTSB were significantly related to poorer prognosis.13–17
The activity of CTSB is regulated mainly by its endogenous cysteine protease inhibitors, the cystatins, which are divided into three families. Cystatin C (CysC) is a nonglycosylated 13 kDa basic protein, which is composed of 120 amino acids. It is regarded as a housekeeping gene and is strongly inhibited by the activities of cathepsins B, K and L. CysC is present in all human body fluids including the cerebrospinal fluid and semen, while its concentration could be detected by enzyme-linked immunosorbent assay and immunohistochemical methods. CysC levels were found to be higher, similar, or lower than normal controls in different types of cancers.18,19 CysC overexpression was found to inhibit the invasion and metastasis of tumor cells significantly.20,21 Thus, CTSB and CysC could be potential diagnostic biologic markers for cancers.
Our previous study showed that in 56 surgically resected specimens of esophageal carcinoma patients, the protein and mRNA levels of both CTSB and CysC were markedly higher in the cancer tissues than those in the adjacent normal epithelial tissues, and CysC overexpression could inhibit the invasion of EC9706 cells in vitro. However, it is still unclear whether CTSB and CysC serve as diagnostic markers of esophageal carcinoma. In this study, we aimed to determine CTSB and CysC levels in the sera of esophageal carcinoma patients and controls and study their correlation with the clinicopathologic characteristics and prognosis of esophageal cancer patients.
Materials and methods
Ethics statement
This research was approved by the Ethical Committee of the First Affiliated Hospital of Zhengzhou University. A written informed consent was obtained from all participants.
Serum and tissue samples
Fifty-six cases of esophageal carcinoma (31 males and 25 females) with a median age of 59.5 years (ranging from 36 to 77 years), who underwent tumor resection at the First Affiliated Hospital of Zhengzhou University from March 2009 to May 2011 were enrolled randomly in this study. Tumor histology was classified according to the World Health Organization classification. None of the patients had received radiotherapy or chemotherapy. The clinical and histopathologic features of the 56 patients were recorded, including age, pathologic type, differentiation grade, depth of invasion and the lymph node metastasis (LNM). The control sera were obtained from 30 healthy volunteers who came for check-up at the First Affiliated Hospital of Zhengzhou University, which consisted of 18 males and 12 females, with a median age of 60.4 years (40–79 years).
Blood samples were collected 1–3 days before surgery from the subjects. Morning fasting venous blood samples (3 mL) were obtained from all patients and healthy controls. The sera were centrifuged at 3,000× g for 10 min within 1 h and then stored at −80°C until required.
Specimens of cancer tissues and matched adjacent normal esophageal tissues of these 56 patients were obtained during the operation. These tissues were placed in liquid nitrogen immediately and then were given routine paraffin embedding.
Measurement of CTSB and CysC levels in the sera
Serum CTSB and CysC levels were measured using enzyme-linked immunosorbent assay kits for CTSB and CysC (Yanjin Biological, Shanghai, People’s Republic of China), respectively. The sera were diluted at 1:20 and the assays were performed according to the manufacturer’s instructions. All samples were analyzed simultaneously. First, we added different concentrations of standard diluent (50 μL) to the standard wells and then added 40 μL of sample dilutions and 10 μL of testing samples to the testing sample wells. After 100 μL of horseradish peroxidase-conjugate reagent was added to each well, it was covered with a plate cover. Then the plates were incubated at 37°C for 60 min. Then we removed the cover and washed the plate. After the washing was completed, substrates A and B were added to each well at 50 μL, respectively. After incubation in dark at 37°C for 15 min, stop reagent was added to each well. The concentrations were measured by reading the absorbance values at 450 nm, which were subsequently calculated using standard curves and expressed as ng/mL. Each test was repeated three times.
Follow-up
All 56 patients were followed up. We adopted overall survival (OS), which was defined as the time from the diagnosed date till the date of death or of the latest follow-up. Patients who did not die of esophageal cancer were ruled out. The longest follow-up period was 60 months.
Statistical analysis
All data were expressed as mean ± standard deviation (SD) and analyzed by using the statistical software Statistical Package for the Social Sciences 17.0. The intergroup differences were assessed using Mann–Whitney U test and Kruskal–Wallis tests. The correlation between CTSB and CysC was evaluated by Spearman correlation coefficient. Kaplan–Meier survival curves were plotted, while the survival rates were compared using the log-rank test. Univariate and multivariate analyses of prognostic factors for survival were performed using the Cox proportional hazard regression model with a 95% confidence interval. In all tests, two-sided P-values <0.05 were regarded statistically significant.
Results
Serum CTSB and CysC levels were significantly upregulated in esophageal cancer patients
Serum CTSB, CysC and CysC/CTSB levels of patients with esophageal carcinoma and healthy controls are listed as mean with quartile deviation and median (min–max) in Table 1. Serum CTSB levels of the patients (38.35±4.3 ng/mL) were significantly higher (P<0.01) than those of the control group (22.35±1.8 ng/mL). Serum CysC levels of the patients group (703.96±23.6 ng/mL) were also significantly higher (P<0.01) than those of the controls (501.97±11.5 ng/mL). As for the ratio of CysC/CTSB, although no significant difference was observed, the patients displayed a lower ratio than that of the control group (P=0.093). In addition, a significant correlation between CTSB and CysC (r=0.754, P<0.001) was demonstrated by using Pearson correlation analysis.
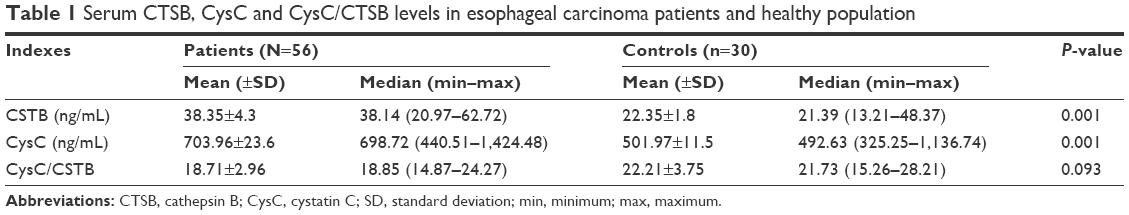 | Table 1 Serum CTSB, CysC and CysC/CTSB levels in esophageal carcinoma patients and healthy population |
Correlation of CTSB and CysC levels with clinicopathologic features
The association between CTSB, CysC and CysC/CTSB levels and the clinicopathologic features are shown in Table 2. CTSB and CysC/CTSB levels significantly correlated with the clinical T stage. CTSB levels in group T3+T4 were higher than in group T1+T2 (P=0.008), and CysC/CTSB levels in group T3+T4 were markedly lower than in group T1+T2 (P=0.001). Besides, CysC/CTSB levels were significantly lower in the group with metastasis of lymph node than those of the negative group (P=0.001). They showed no correlation with age, gender, pathologic type or tumor differentiation.
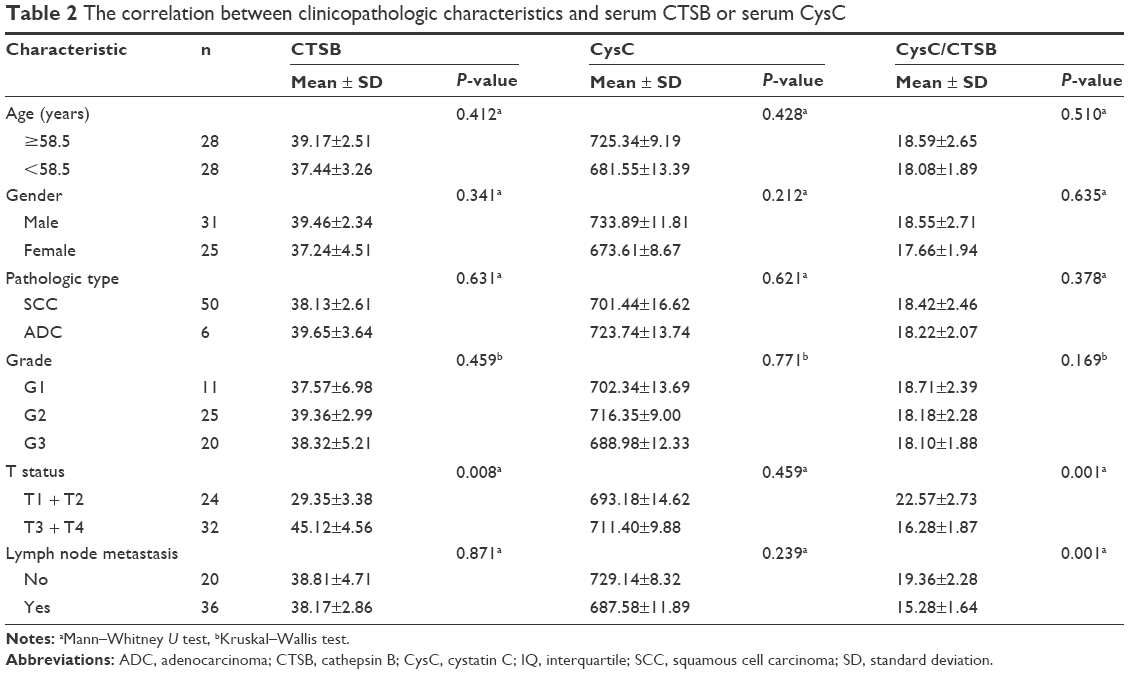 | Table 2 The correlation between clinicopathologic characteristics and serum CTSB or serum CysC |
Correlation of CTSB and CysC levels with OS
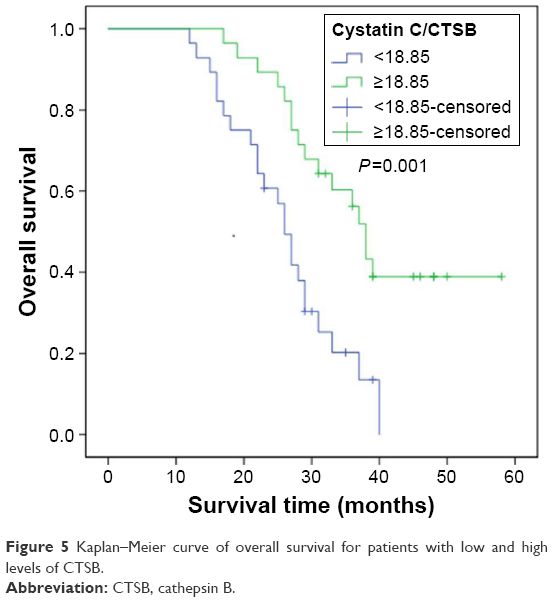
We used the median values of CTSB, CysC and CysC/CTSB as the cutoff points to respectively divide the patients into low- and high-level groups. Kaplan–Meier curve together with log-rank test was used to find the factors influencing OS. The results showed that the median OS time of patients with higher CysC/CTSB ratio (median OS, 38.5 months) was significantly longer than that of the low ratio group (median OS, 26.2 months, P=0.001; Figure 1). However, it was very interesting to see that, when adjusted for T stage, the difference in OS was statistically significant only in the T3+T4 stage group (P=0.007, Figure 2) rather than in the T1+T2 group (P=0.727, Figure 3). The median OS period of patients with positive LNM (median OS, 27 months) was found to be significantly shorter than that of those with negative LNM (median OS, 38.1 months, P=0.01; Figure 4). Besides, patients in low-level CTSB group (median OS, 35.9 months) were found to live longer than those in high-level CTSB group (median OS, 28.5 months), although the difference was not statistically significant (P=0.081, Figure 5). However, levels of CysC were not associated with the survival of esophageal cancer patients. Likewise, there was no significant correlation between the OS of cases with esophageal cancer and their age, gender, pathologic type, tumor differentiation and tumor invasion depth (Table 2).
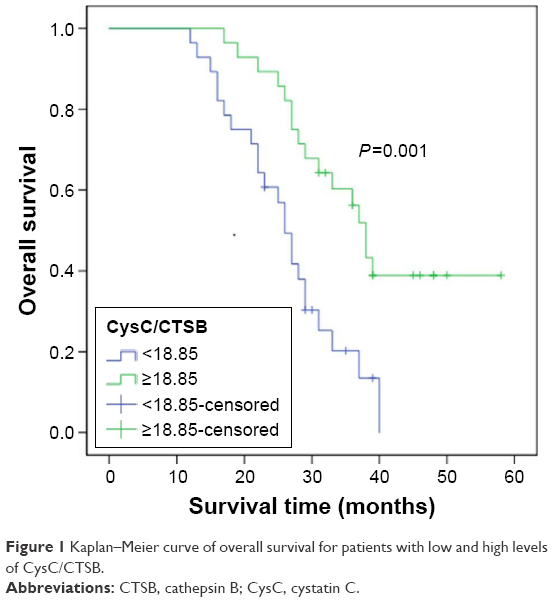 | Figure 1 Kaplan–Meier curve of overall survival for patients with low and high levels of CysC/CTSB. |
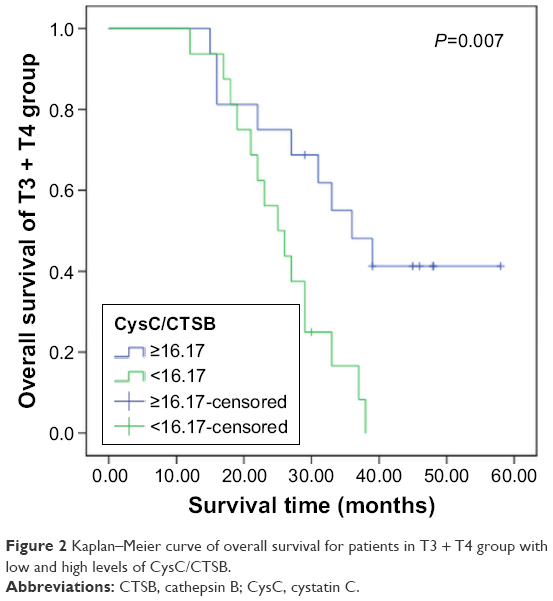 | Figure 2 Kaplan–Meier curve of overall survival for patients in T3 + T4 group with low and high levels of CysC/CTSB. |
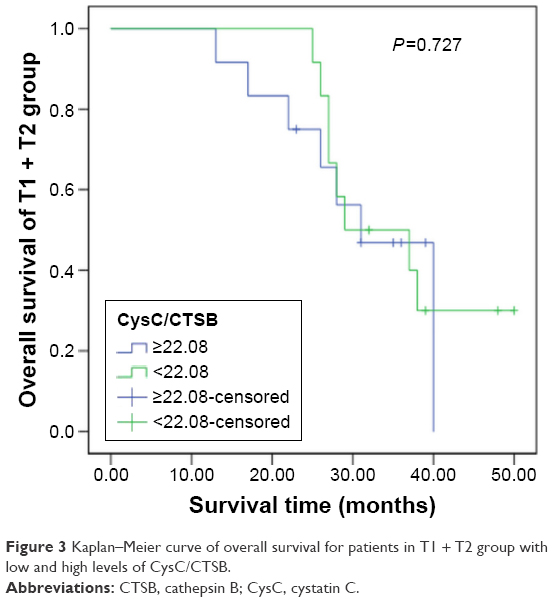 | Figure 3 Kaplan–Meier curve of overall survival for patients in T1 + T2 group with low and high levels of CysC/CTSB. |
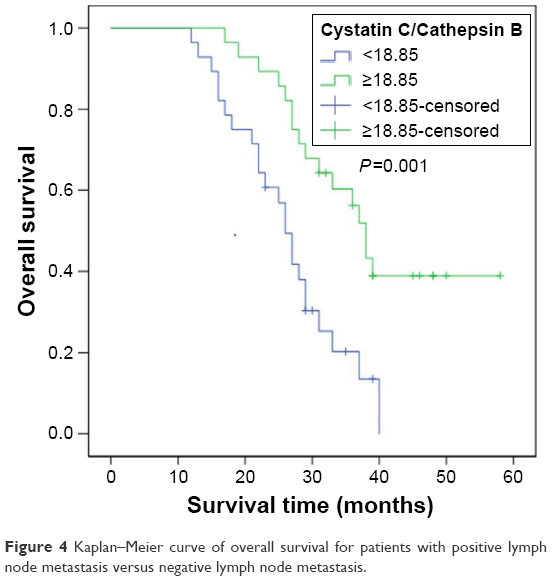 | Figure 4 Kaplan–Meier curve of overall survival for patients with positive lymph node metastasis versus negative lymph node metastasis. |
 | Figure 5 Kaplan–Meier curve of overall survival for patients with low and high levels of CTSB. |
CysC/CTSB was an independent prognostic factor in esophageal cancer patients
As shown in Table 3, univariate and multivariate Cox regression analyses were used to evaluate the proportional hazards of the indices in the OS time, including age, gender, pathologic type, grade, T stage, LNM, CysC/CTSB ratio, CTSB level and CysC level. The results showed that CysC/CTSB and LNM could be regarded as independent prognostic factors in esophageal cancer patients.
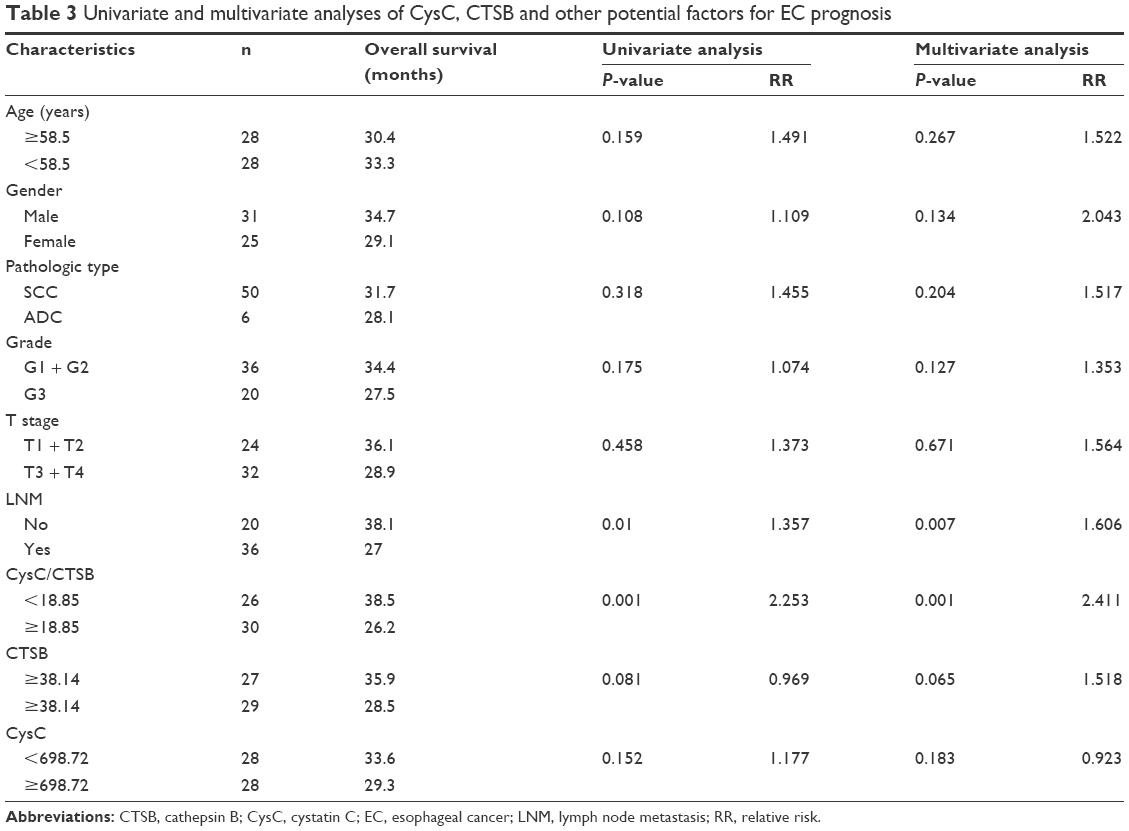 | Table 3 Univariate and multivariate analyses of CysC, CTSB and other potential factors for EC prognosis |
Discussion
Elevated levels of CTSB have been observed in primary and metastatic tumor tissues of various types of cancers. A two-dimensional electrophoresis assay of the protein patterns of thyroid tissues revealed that CTSB was significantly upregulated in neoplastic diseases compared with nonneoplastic diseases.15 The expression of CTSB was upregulated in more than a half of gastric cancer patients, while the serum level of CTSB was higher in patients with advanced stage cancer than in healthy controls.14 Besides, CTSB expression was positively correlated to lymph node metastasis, poor differentiation and remote metastasis. Tan et al showed that the serum level of CTSB was considerably higher in nasopharyngeal carcinoma patients than in controls and was correlated with the TNM score.22 Moreover, CTSB was highly upregulated in human esophageal squamous cell carcinoma (ESCC), suggesting it plays a key role in the regulation of ESCC initiation and progression.23,24 In the present study, we observed a significant increase of CTSB levels in the sera of patients with esophageal cancer compared with that of the healthy controls. Furthermore, CTSB levels were positively correlated with increasing tumor invasion depth, which is consistent with the findings listed earlier. It suggests that CTSB might be involved in the occurrence and progression of esophageal cancer. We speculate that CTSB may serve as a candidate biomarker for esophageal cancer.
CysC overexpression could inhibit both invasion and metastasis of cancer cells. Numerous studies about CysC have shown that its expression levels vary in different types of cancers. CysC showed significantly higher expression in prostate cancer as well as in non-small-cell lung cancer.25,26 In contrast, the expression of CysC was downregulated in breast cancer and large granular lymphocytic leukemia.27,28 As for the CysC levels in sera, patients with cancers such as lung, gastric, breast and ovarian were found to have much higher levels than controls. In this study, we observed a significant increase of serum CysC levels in patients with esophageal cancer. In addition, we demonstrated a significant correlation between CTSB and CysC. The exact mechanism for this increase has not been studied so far. One putative cause is that increased CTSB could result in the upregulation of CysC expression by positive feedback regulation in order to inhibit the increased activity of CTSB.29 On the other hand, our previous study indicated that expression of CysC had a reverse relationship with the apoptosis of esophageal carcinoma. It was speculated that elevated CysC might protect esophageal cancer cells against CTSB-mediated apoptosis. Further studies are still needed to clarify the dual effect of CysC on different tumor types. In addition, no significant correlations were observed between CysC levels and the patient’s age, gender, pathologic type, grade, tumor invasion depth and lymph node status in our study. Konduri et al observed an inverse correlation between CysC and the tumor grade of glioma.19 Saleh et al found that the expression of CysC correlated with the differentiation and invasion of tumor cells in colorectal cancer.30 However, CysA, but not CysC, was one of the differentiation-associated genes regulated by c-Jun in the progression of ESCC.31 The inconsistency of our findings with those above may be mainly due to the following reasons: limited sample size, different detection method and distinct types of tumors.
Monsouvanh et al found that the CTSB/CysC ratio of cholangiocarcinoma patients was considerably higher than that of the healthy group.32 Another study showed that the serum levels of CTSB/CysC complexes were much lower in patients with lung cancer than in the patients with benign lung diseases or healthy controls.33 In this study, we found that the CysC/CTSB ratio of the esophageal cancer group was significantly lower than that of the control group, and its level significantly correlated with the T stage and LNM. A separate study on another inhibitor for cysteine proteinases, named stefin A, also showed the correlation between its ratio with CTSB and the aggressive potential of prostate carcinoma.34 These findings suggest that the imbalance between CTSB and CysC may contribute to tumorigenesis. Thus, the ratio of CysC to CTSB is more meaningful and significant than the absolute levels.
Analysis of the correlation between the variables and the prognosis of esophageal patients revealed that CysC to CTSB ratio as well as the status of lymph node possessed significant prognostic value. Patients with higher CysC/CTSB ratio exhibited significantly longer survival time. This is not consistent with the findings of another study which revealed that the ratio of cathepsins and CysC in the ovarian cyst fluid was not a significant predictor of survival for patients with epithelial ovarian cancer.35 In addition, we found that patients with lower CSTB levels tend to live longer than those with higher CSTB levels, although the difference was not statistically significant. CSTB levels were found to be associated with survival in pancreatic adenocarcinoma, breast cancer, acute myeloid leukemia, oral squamous cell carcinoma and hepatocellular carcinoma.36–40 This remains to be clarified by using larger samples in the future.
Generally, serum CTSB and CysC levels were markedly increased in patients with esophageal cancer. Serum CTSB and CysC concentrations are of diagnostic significance in esophageal cancer. The ratio of serum CysC/CTSB is prognostic for the survival for esophageal carcinoma patients.
Acknowledgment
This study was funded by the Science and Technology Project of Henan Province (162102310620).
Disclosure
The authors report no conflicts of interest in this work.
References
Allen DC. Oesophageal carcinoma. Lancet. 2013;381(9864):400–412. | ||
Zhang Y. Epidemiology of esophageal cancer. World J Gastroenterol. 2013;19(34):5598–5606. | ||
Ferlay J, Soerjomataram I, Dikshit R, et al. Cancer incidence and mortality worldwide: sources, methods and major patterns in GLOBOCAN 2012. Int J Cancer. 2015;136(5):E359–E386. | ||
Nikfarjam Z, Massoudi T, Salehi M, Khoshroo F. Demographic survey of four thousand patients with 10 common cancers in North Eastern Iran over the past three decades. Asian Pac J Cancer Prev. 2014;15(23):10193–10198. | ||
Cheng ML, Zhang L, Borok M, et al. The incidence of oesophageal cancer in Eastern Africa: identification of a new geographic hot spot? Cancer Epidemiol. 2015;39(2):143–149. | ||
Staun-Ram E, Miller A. Cathepsins (S and B) and their inhibitor Cystatin C in immune cells: modulation by interferon-β and role played in cell migration. J Neuroimmunol. 2010;232(1–2):200–206. | ||
Malla RR, Gopinath S, Gondi CS, et al. uPAR and cathepsin B downregulation induces apoptosis by targeting calcineurin A to BAD via Bcl-2 in glioma. J Neurooncol. 2011;107(1):69–80. | ||
Withana NP, Blum G, Sameni M, et al. Cathepsin B inhibition limits bone metastasis in breast cancer. Cancer Res. 2012;72(5):1199–1209. | ||
Kirschke H, Barrett AJ, Rawlings ND. Proteinases 1: lysosomal cysteine proteinases. Protein Profile. 1995;2(14):1581–1643. | ||
Rawlings ND, Waller M, Barrett AJ, Bateman A. MEROPS: the database of proteolytic enzymes, their substrates and inhibitors. Nucleic Acids Res. 2011;40(Database issue):503–509. | ||
Krueger S, Haeckel C, Buehling F, Roessner A. Inhibitory effects of antisense cathepsin B cDNA transfection on invasion and motility in a human osteosarcoma cell line. Cancer Res. 1999;59(23):6010–6014. | ||
Gocheva V, Zeng W, Ke D, et al. Distinct roles for cysteine cathepsin genes in multistage tumorigenesis. Genes Dev. 2006;20(5):543–556. | ||
Wulfkuhle JD, Sgroi DC, Krutzsch H, et al. Proteomics of human breast ductal carcinoma in situ. Cancer Res. 2002;62(22):6740–6749. | ||
Ebert MPA, Krüger S, Fogeron ML, et al. Overexpression of cathepsin B in gastric cancer identified by proteome analysis. Proteomics. 2005;5(6):1693–1704. | ||
Srisomsap C, Subhasitanont P, Otto A, et al. Detection of cathepsin B up-regulation in neoplastic thyroid tissues by proteomic analysis. Proteomics. 2002;2(6):706–712. | ||
Nishikawa H, Ozaki Y, Nakanishi T, et al. The role of cathepsin B and cystatin C in the mechanisms of invasion by ovarian cancer. Gynecol Oncol. 2004;92(3):881–886. | ||
Mckerrow JH, Bhargava V, Hansell E, et al. A functional proteomics screen of proteases in colorectal carcinoma. Mol Med. 2000;6(5):450–460. | ||
Kos J, Stabuc B, Schweiger A, et al. Cathepsins B, H, and L and their inhibitors stefin A and cystatin C in sera of melanoma patients. Clin Cancer Res. 1997;3(10):1815–1822. | ||
Konduri SD, Yanamandra N, Siddique K, et al. Modulation of cystatin C expression impairs the invasive and tumorigenic potential of human glioblastoma cells. Oncogene. 2002;21(57):8705–8712. | ||
Sexton PS, Cox JL. Inhibition of motility and invasion of B16 melanoma by the overexpression of cystatin C. Melanoma Res. 1997;7(2):97–101. | ||
Cox JL, Sexton PS, Green TJ, Darmani NA. Inhibition of B16 melanoma metastasis by overexpression of the cysteine proteinase inhibitor cystatin C. Melanoma Res. 1999;9(4):369–374. | ||
Tan G, Liu Q, Tang X, et al. Diagnostic values of serum cathepsin B and D in patients with nasopharyngeal carcinoma. BMC Cancer. 2016;16(1):1–7. | ||
Ma W, Ma L, Zhe H, et al. Detection of esophageal squamous cell carcinoma by cathepsin B activity in nude mice. Plos One. 2014;9(3):e92351. | ||
Luo A, Kong J, Hu G, et al. Discovery of Ca2+-relevant and differentiation-associated genes downregulated in esophageal squamous cell carcinoma using cDNA microarray. Oncogene. 2004;23(6):1291–1299. | ||
Jiborn T, Abrahamson M, Gadaleanu V, Lundwall A, Bjartell A. Aberrant expression of cystatin C in prostate cancer is associated with neuroendocrine differentiation. BJU Int. 2006;98(1):189–196. | ||
Petty RD, Kerr KM, Murray GI, et al. Tumor transcriptome reveals the predictive and prognostic impact of lysosomal protease inhibitors in non-small-cell lung cancer. J Clin Oncol. 2006;24(11):1729–1744. | ||
Wan R, Ge A, Wang H, Gao M. Expression of cathepsin B and cystatin M in human breast cancer. Chinese J Histochem Cytochem. 2006;15(6):613–616. | ||
Kothapalli R, Bailey RD, Kusmartseva I, Mane S, Epling-Burnette PK, Loughran TP Jr. Constitutive expression of cytotoxic proteases and down-regulation of protease inhibitors in LGL leukemia. Int J Oncol. 2003;22(1):33–39. | ||
Kos J, Krasovec M, Cimerman N, Nielsen HJ, Christensen IJ, Brünner N. Cysteine proteinase inhibitors stefin A, stefin B, and cystatin C in sera from patients with colorectal cancer: relation to prognosis. Clin Cancer Res. 2000;6(2):505–511. | ||
Saleh Y, Sebzda T, Warwas M, Kopec W, Ziólkowska J, Siewinski M. Expression of cystatin C in clinical human colorectal cancer tissues. J Exp Ther Oncol. 2005;5(1):49–53. | ||
Luo A, Yu X, Li G, et al. Differentiation-associated genes regulated by c-Jun and decreased in the progression of esophageal squamous cell carcinoma. Plos One. 2014;9(5):e96610. | ||
Monsouvanh A, Proungvitaya T, Limpaiboon T, et al. Serum cathepsin B to cystatin C ratio as a potential marker for the diagnosis of cholangiocarcinoma. Asian Pac J Cancer Prev. 2014;15(21):9511–9515. | ||
Zore I, Krasovec M, Cimerman N, et al. Cathepsin B/cystatin C complex levels in sera from patients with lung and colorectal cancer. Biol Chem. 2001;382(5):805–810. | ||
Sinha AA, Quast BJ, Wilson MJ, et al. Prediction of pelvic lymph node metastasis by the ratio of cathepsin B to stefin A in patients with prostate carcinoma. Cancer. 2002;94(12):3141–3149. | ||
Kolwijck E, Kos J, Obermajer N, et al. The balance between extracellular cathepsins and cystatin C is of importance for ovarian cancer. Eur J Clin Invest. 2010;40(7):591–599. | ||
Niedergethmann M, Wostbrock B, Sturm JW, Willeke F, Post S, Hildenbrand R. Prognostic impact of cysteine proteases cathepsin B and cathepsin L in pancreatic adenocarcinoma. Pancreas. 2004;29(3):204–211. | ||
Foekens JA, Kos J, Peters HA, et al. Prognostic significance of cathepsins B and L in primary human breast cancer. J Clin Oncol. 1998;16(3):1013–1021. | ||
Jain M, Bakhshi S, Shukla AA, Chauhan SS. Cathepsins B and L in peripheral blood mononuclear cells of pediatric acute myeloid leukemia: potential poor prognostic markers. Ann Hematol. 2010;89(12):1223–1232. | ||
Yang WE, Ho CC, Yang SF, et al. Cathepsin B expression and the correlation with clinical aspects of oral squamous cell carcinoma. Plos One. 2016;11(3):e0152165. | ||
Jian R, Zheng H, Rong X, et al. Over-expression of cathepsin B in hepatocellular carcinomas predicts poor prognosis of HCC patients. Mol Cancer. 2015;15(1):1–13. |
 © 2017 The Author(s). This work is published and licensed by Dove Medical Press Limited. The full terms of this license are available at https://www.dovepress.com/terms.php and incorporate the Creative Commons Attribution - Non Commercial (unported, v3.0) License.
By accessing the work you hereby accept the Terms. Non-commercial uses of the work are permitted without any further permission from Dove Medical Press Limited, provided the work is properly attributed. For permission for commercial use of this work, please see paragraphs 4.2 and 5 of our Terms.
© 2017 The Author(s). This work is published and licensed by Dove Medical Press Limited. The full terms of this license are available at https://www.dovepress.com/terms.php and incorporate the Creative Commons Attribution - Non Commercial (unported, v3.0) License.
By accessing the work you hereby accept the Terms. Non-commercial uses of the work are permitted without any further permission from Dove Medical Press Limited, provided the work is properly attributed. For permission for commercial use of this work, please see paragraphs 4.2 and 5 of our Terms.