")
Back to Journals » Cancer Management and Research » Volume 10
Clinical significance of prognostic score based on age, tumor size, and grade in gastric cancer after gastrectomy
Authors Lu J, Chen Y , Liu Y, Ding J, Piao Z, Liu W
Received 19 April 2018
Accepted for publication 6 August 2018
Published 8 October 2018 Volume 2018:10 Pages 4279—4286
DOI https://doi.org/10.2147/CMAR.S171663
Checked for plagiarism Yes
Review by Single anonymous peer review
Peer reviewer comments 4
Editor who approved publication: Dr Antonella D'Anneo
Jingfeng Lu,1,* Yi Chen,1,* Yanxia Liu,2,* Junbin Ding,1 Zhenhao Piao,1 Weiyan Liu1
1Department of General Surgery, Minhang Hospital, Fudan University, Minhang, Shanghai 201199, People’s Republic of China; 2Department of Nursing, Minhang Hospital, Fudan University, Minhang, Shanghai 201199, People’s Republic of China
*These authors contributed equally to this work
Background: Postoperative management and survival of gastric cancer is mainly determined by pathologic TNM stage. However, gastric cancer is a heterogeneity group, and the survival is quite different even when they are in the same TNM stage. Moreover, TNM stage system does not grasp other important clinicopathologic factors to determine the survival. The aim of the present study is to propose and validate prognostic score based on age, tumor size, and grade.
Materials and methods: Patients diagnosed with gastric cancer in the Surveillance, Epidemiology, and End Results database from 1988 to 2012 were included in the present study. Kaplan–Meier methods were adopted and multivariable Cox regression models were built for the analysis of long-term survival outcomes and risk factors.
Results: A total of 26,091 eligible patients diagnosed with noncardia gastric cancer were included in the study. In the univariate and multivariate survival analysis, age at diagnosis, tumor grade, and tumor size were validated as independent prognostic factors (P<0.05). Then, we proposed a prognostic score calculated from the number of risk factors, with 0, 1, and 2 points each given for favorable, intermediate, and poor prognostic categories of age (≤50, 50–70, and >70), grade (well, moderate, and poor differentiation), and size (≤3, 3–6, ≥7 cm). The prognostic score was verified as independent predictor in both univariate and multivariate survival analyses (P<0.001). In addition, nomograms on cause-specific survival were established according to prognostic factor and all other significant factors, and c-index was 0.715 (95% CI: 0.706–0.725).
Conclusion: Prognostic score based on age, tumor size, and grade is an independent predictor of survival after gastrectomy. The novel prognostic score can improve the accuracy of prediction for current TNM stage system. Patients who are with a high prognostic score should undergo extensive follow-up after surgery.
Keywords: gastric cancer, prognostic score, survival analysis
Background
The most commonly used psoriasis outcome measures do not individually capture all aspects of psoriatic disease and are of limited use in clinical practice.1 Specifically, Psoriasis Area and Severity Index (PASI) is considered impractical for everyday clinical practice because it is complicated to calculate, difficult to interpret, time consuming, and insensitive in mild psoriasis.2 Physician Global Assessment (PGA) is more practical; however, its value as a stand-alone instrument is limited because it does not assess the extent of body surface involvement. Likewise, Body Surface Area (BSA) is not suitable as a sole outcome measure because it does not measure the quality or morphology of lesions. In an evolving climate of outcome-based clinical practice,3 there remains an unmet need for a practical, uniform, validated, and standardized outcome measure of psoriasis for use in both clinical practice and clinical trials.1,4–6
The product of PGA and BSA (PGA × BSA) has previously been reported by our group as a simple and sensitive instrument for measuring psoriasis severity.2 However, response to therapy could not be assessed in that observational registry study because the participants were on many different therapies and were not evaluated at predefined time intervals, which would be necessary for evaluating response to therapy over time. Additionally, the previous study was limited because of low numbers of participants with severe psoriasis. PGA × BSA, also known as Simple-Measure for Assessing Psoriasis Activity, is increasingly being used as a simple measure for psoriasis severity.7–11
The objective of this post hoc analysis was to evaluate PGA × BSA as a simpler alternative to PASI for measuring psoriasis severity and response to therapy.
Methods
Study design
Data were pooled from two randomized, controlled trials, PRISTINE (NCT00663052)12 and PRESTA (NCT00245960),13 in patients with moderate-to-severe psoriasis. These two studies were selected for the current analysis because participants were on a predefined treatment regimen and PASI, PGA, and BSA measurements were recorded at weeks 0, 12, and 24 in both studies, thus allowing analysis of PGA × BSA as a static measure of disease activity at baseline and as a measure of response to therapy over time. The study design and primary outcomes of both trials have been described in detail previously.12,13 Patients received double-blind etanercept 50 mg twice weekly or once weekly for 12 weeks, then open-label etanercept 50 mg/week for 12 weeks. This retrospective analysis was conducted on the pooled etanercept 50 mg/week group in the modified intention-to-treat population at baseline, and weeks 12 and 24.
Both trials were conducted in accordance with the ethical principles of the Declaration of Helsinki and all patients signed and dated an approved informed consent form prior to participation in the trial. Regional Institutional Review Boards (IRBs)/Independent Ethics Committees (IECs) reviewed and approved the study protocols (Table S1).
Assessments
PGA was a global assessment of all lesions scored on a scale of 0–5 in both trials, with 0 representing clear skin, 1 almost clear skin, and 5 representing severe psoriasis.12,13 BSA was defined as the percent of BSA involvement, where 1% is approximately the area of the patient’s handprint. The PASI score consisted of the sum of the erythema, induration, and desquamation for each body region, multiplied by weighted area scores.14 Patient Global Assessment (PtGA) was scored on a scale of 1–100 in the PRESTA study and 0–5 in the PRISTINE study. The scale for PtGA in the PRESTA study was converted from 0–100 to 0–5 by dividing by 20. The Dermatology Life Quality Index (DLQI) is a validated patient-reported instrument that contains 10 questions used to assess the impact of skin disease on health-related quality of life and daily activities, with total scores ranging from 0 to 30 and higher scores indicating greater impairment of quality of life.15
Statistical analysis
PASI was used as the reference standard since it is frequently used as an efficacy endpoint in clinical trials and has been widely considered as the standard for measuring psoriasis severity. Means and standard deviation (SD), medians, frequencies, and percentages were used to describe samples. Chi-square or Fisher’s exact tests were performed to compare categorical variables, and one-way analysis of variance with treatment as a factor was used to compare continuous variables.
Correlations between PASI and PGA × BSA were evaluated using Spearman correlation coefficients. Agreement was evaluated with intra-class correlation coefficients (ICCs), scatterplots, Bland–Altman plots, and Cohen’s Kappa coefficients. For the Spearman correlation coefficients and ICCs, values of 0.30–0.50, 0.50–0.70, 0.70–0.90, and ≥0.90 roughly correspond to low, moderate, high, and very high correlation or agreement, respectively. ICCs differ from Spearman correlations in that ICCs take into account both correlation and the difference in values, whereas Spearman correlations take into account only the correlation. For example, parameter 1 might have values of 1, 2, 3, and parameter 2 might have values of 3, 4, 5. Spearman coefficients would give a correlation of 1.0 (perfectly correlated with identically sloping lines). However, the ICC would be lower because it also takes into account the differences in the values (the lines are not superimposed).
For each assessment, responsiveness to change was assessed using effect size estimates, with larger effect size indicating greater responsiveness to change. Effect size was calculated as the difference between the post-baseline mean and the baseline mean scores divided by the baseline SD.
Scatterplots and Bland–Altman plots were used to visually detect systemic differences and trends between PASI and PGA × BSA. In order to make the instruments comparable, PGA × BSA (scale 0–500) needed to be placed on the same scale as PASI (0–72) by dividing all PGA × BSA values by a constant factor (6.94) for some of the analyses. For scatterplots, the diagonal line represents the line of agreement, and data points that are dispersed above or below this line would indicate that PGA × BSA underestimates or overestimates psoriasis severity, respectively, when PASI is used as the reference standard. For Bland–Altman plots, the differences between PASI and PGA × BSA were plotted against the averages of these two assessments, along with vertical lines to denote the mean difference and its 95% limit of agreement (defined as the mean difference ±1.96*SD). Good agreement is indicated in a Bland–Altman plot by a small mean difference and low dispersion around the mean difference line and no apparent correlation between the average and the difference. Increasing or decreasing trends in the Bland–Altman plots would indicate that the level of agreement differs across the range of instrument scores.
Concordance between PASI50/75/90 and PGA × BSA50/75/90 was defined as the percentage of patients achieving specific outcomes as measured by each instrument; that is, the percentage of patients who achieved > PASI50/75/90 and >50/75/90% improvement for PGA × BSA (PGA × BSA50/75/90) plus the percentage of patients who were below the threshold for both measures (< PASI50/75/90 and < PGA × BSA50/75/90).
Correlations between PGA × BSA and BSA, PGA, PtGA, and DLQI were evaluated using Spearman correlation coefficients at baseline, week 12, and week 24.
The data analysis software UNIX SAS® version 9.2 (SAS Institute Inc., Cary, NC, USA) was used for statistical analyses.
Results
The mean age in the pooled patient group (N=510) was 46.1 years and 64.9% of patients were male. The mean duration of psoriasis was 18 years and the median BSA involvement was 22.0% (Table 1). Spearman correlation coefficients (Table 2) for PASI versus PGA × BSA were statistically significant (P<0.0001) and ranged from 0.78 (baseline) to 0.90 (week 24). ICC coefficients ranged from 0.76 to 0.85 (Table 2).
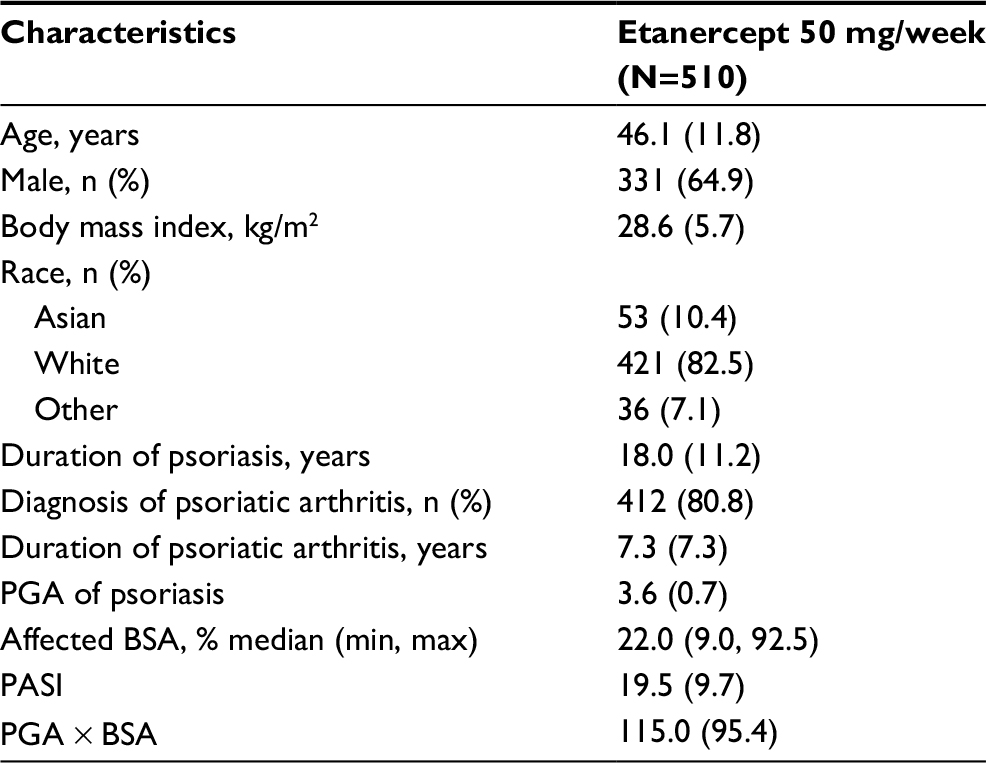 | Table 1 Baseline demographic and disease characteristics Note: Values are mean (standard deviation) unless otherwise stated. Abbreviations: BSA, Body Surface Area; PASI, Psoriasis Area and Severity Index; PGA, Physician Global Assessment. |
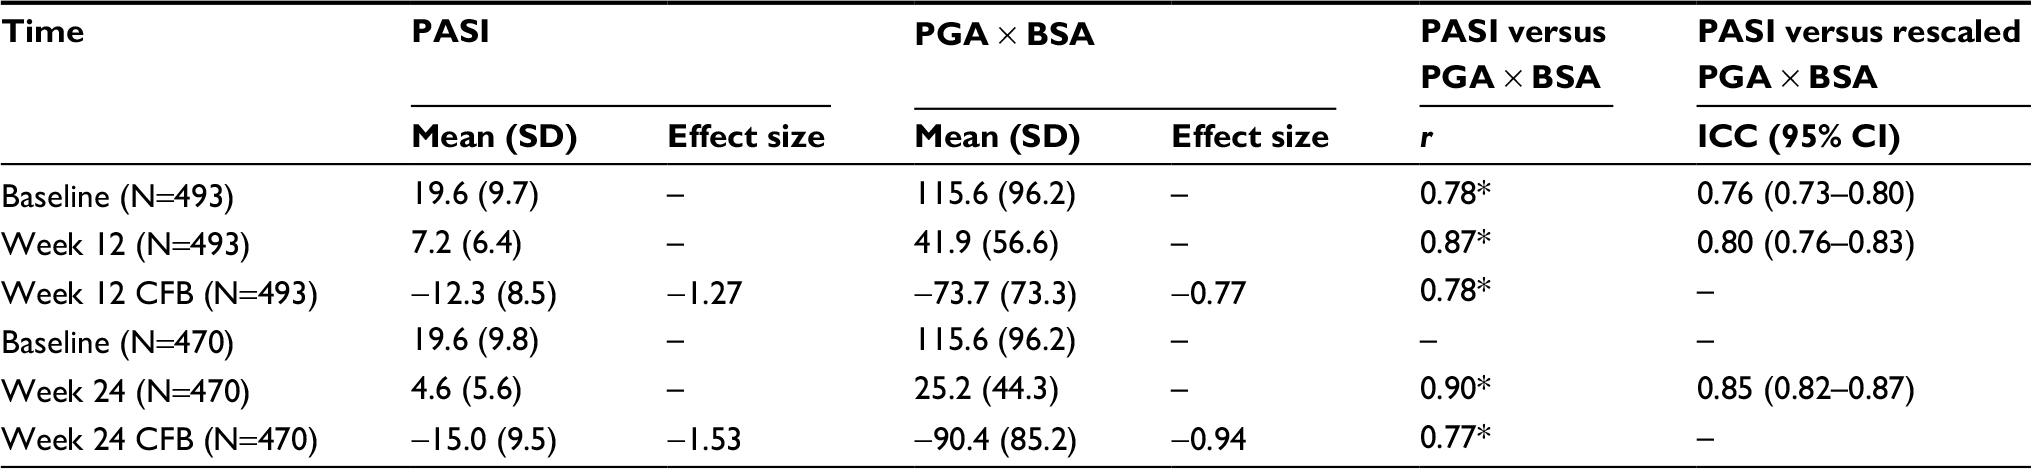 | Table 2 Correlations, agreement, and responsiveness to change between PASI and PGA × BSA Notes: *P<0.0001. Modified intention-to-treat population, observed cases by treatment. N = patients with baseline, week 12, or week 24 values. Effect size was calculated as the ratio of the difference between post-baseline and baseline mean scores, divided by baseline SD. Higher effect sizes suggest more responsiveness to change. Abbreviations: BSA, Body Surface Area; CFB, change from baseline; CI, confidence interval; ICC, intra-class correlation coefficient; PASI, Psoriasis Area and Severity Index; PGA, Physician Global Assessment; r, Spearman correlation coefficient; SD, standard deviation. |
Scatterplots between PASI and PGA × BSA at baseline and week 24 are shown in Figure 1A and B, respectively. Most of the data points fell above the line of agreement at the low end of the scale and below the line of agreement at the high end of the scale, demonstrating that psoriasis was rated more severely with PASI than scaled PGA × BSA at the low end of the scale and less severely at the high end. The magnitude of agreement between the instruments was further quantified with Bland–Altman plots at baseline (Figure 2A) and week 24 (Figure 2B). At both time points, as the average increased, a decreasing trend from positive to negative differences and more observations falling below the expected 95% lower bound of agreement can be seen.
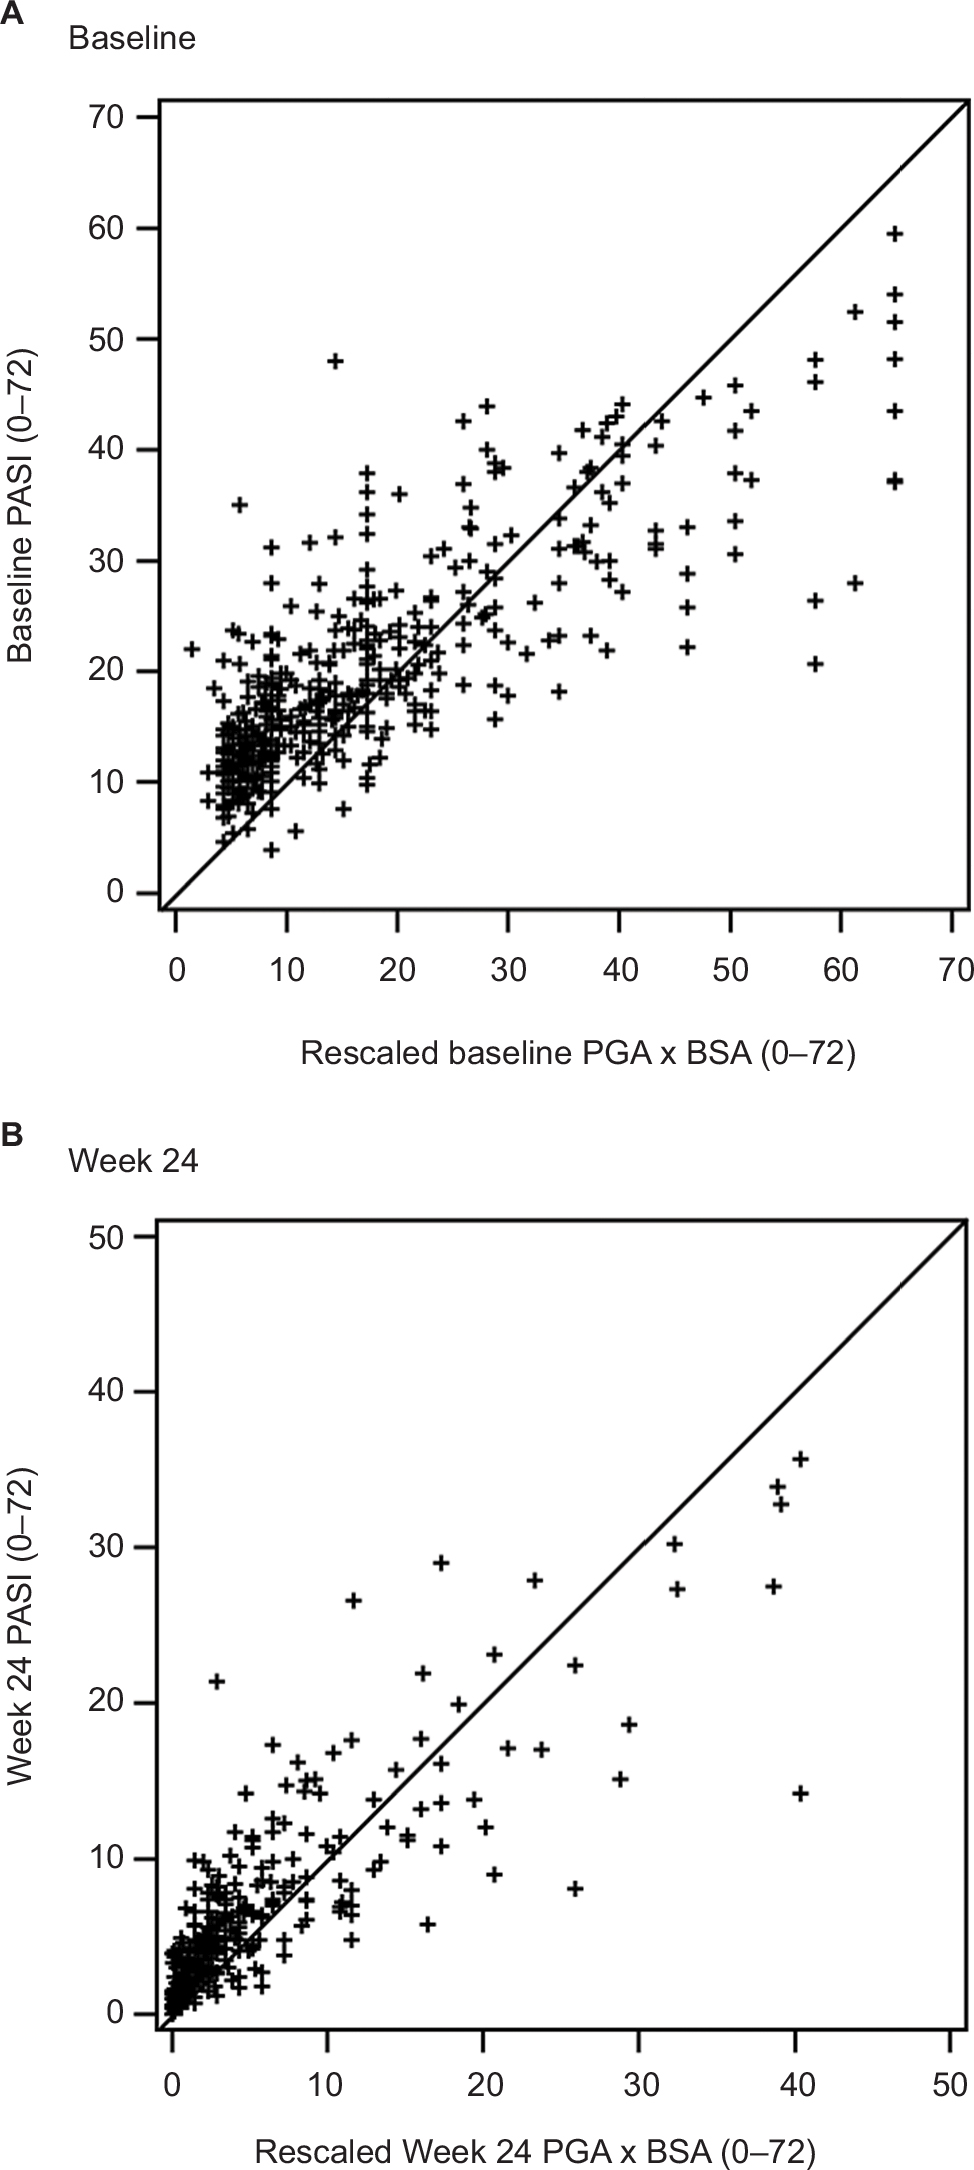 | Figure 1 PASI versus PGA × BSA scatterplots at baseline (A) and week 24 (B). Abbreviations: BSA, Body Surface Area; PASI, Psoriasis Area and Severity Index; PGA, Physician Global Assessment. |
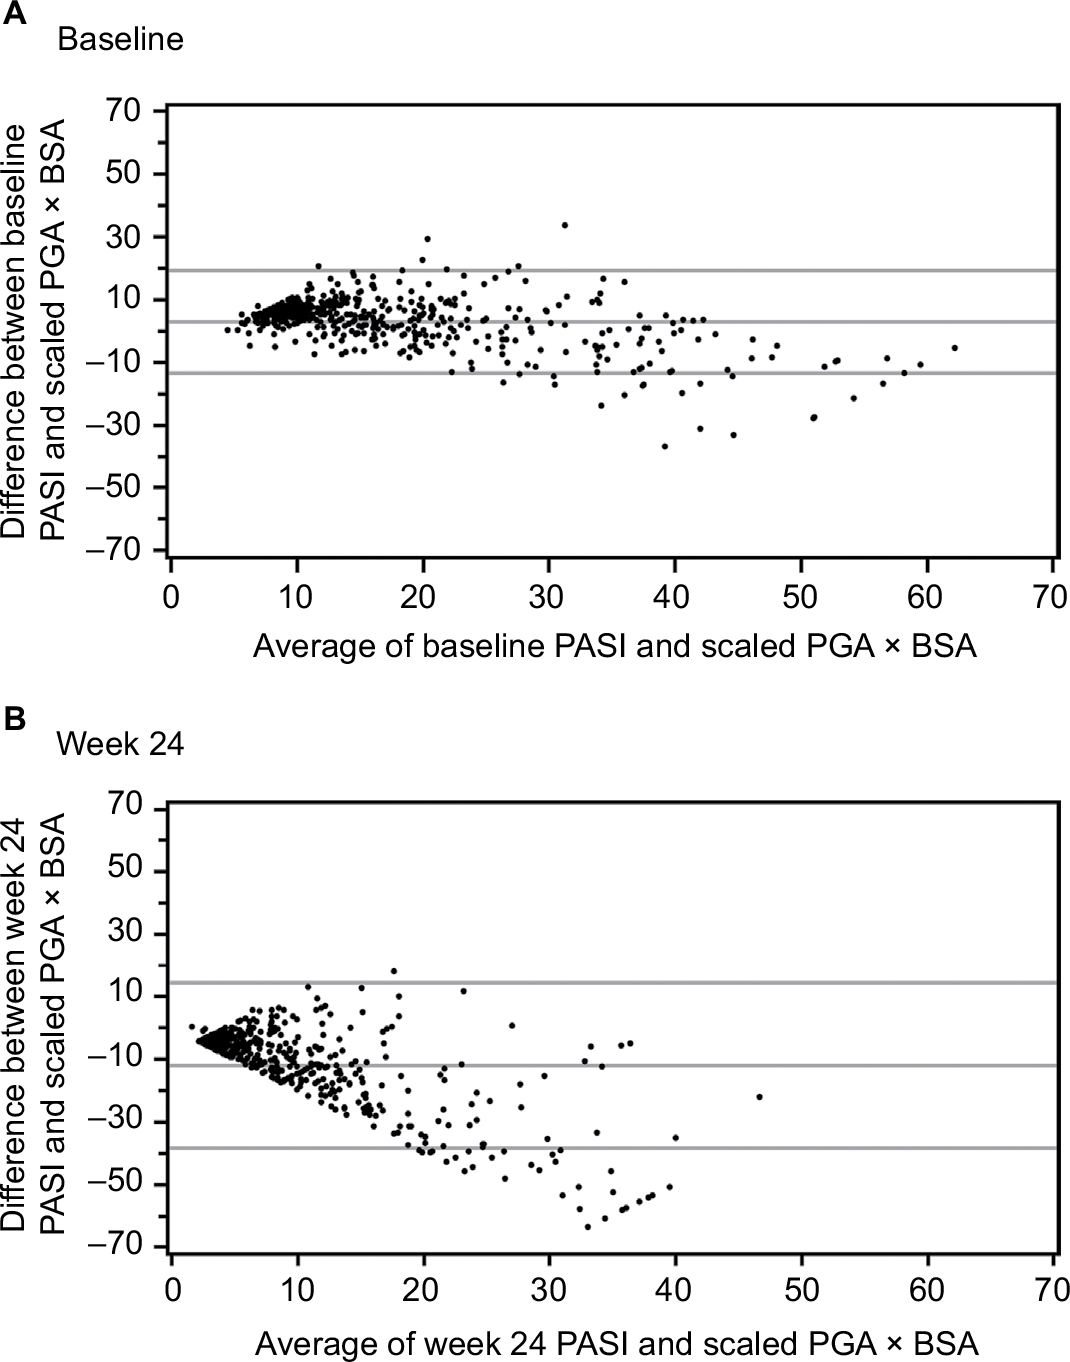 | Figure 2 Bland–Altman plots at baseline (A) and week 24 (B). Abbreviations: BSA, Body Surface Area; PASI, Psoriasis Area and Severity Index; PGA, Physician Global Assessment. |
Concordance between PASI50/75/90 and PGA × BSA50/75/90 at week 12 and week 24 is shown in Figure 3. An overall concordance >80% (that is, agreement, which included both PASI50/75/90 and PGA × BSA50/75/90 response and nonresponse) was achieved at both week 12 and 24. Among the patients who were discordant (that is, disagreement, which included both underrated and overrated responses), a greater percentage of patients achieved improvement with PGA × BSA50/75/90 than with PASI50/75/90 (overrated), at all time points except at week 12 for PGA × BSA50. Cohen’s Kappa coefficients ranged from 0.58 to 0.69 at week 12 and from 0.63 to 0.67 at week 24 (all P<0.0001).
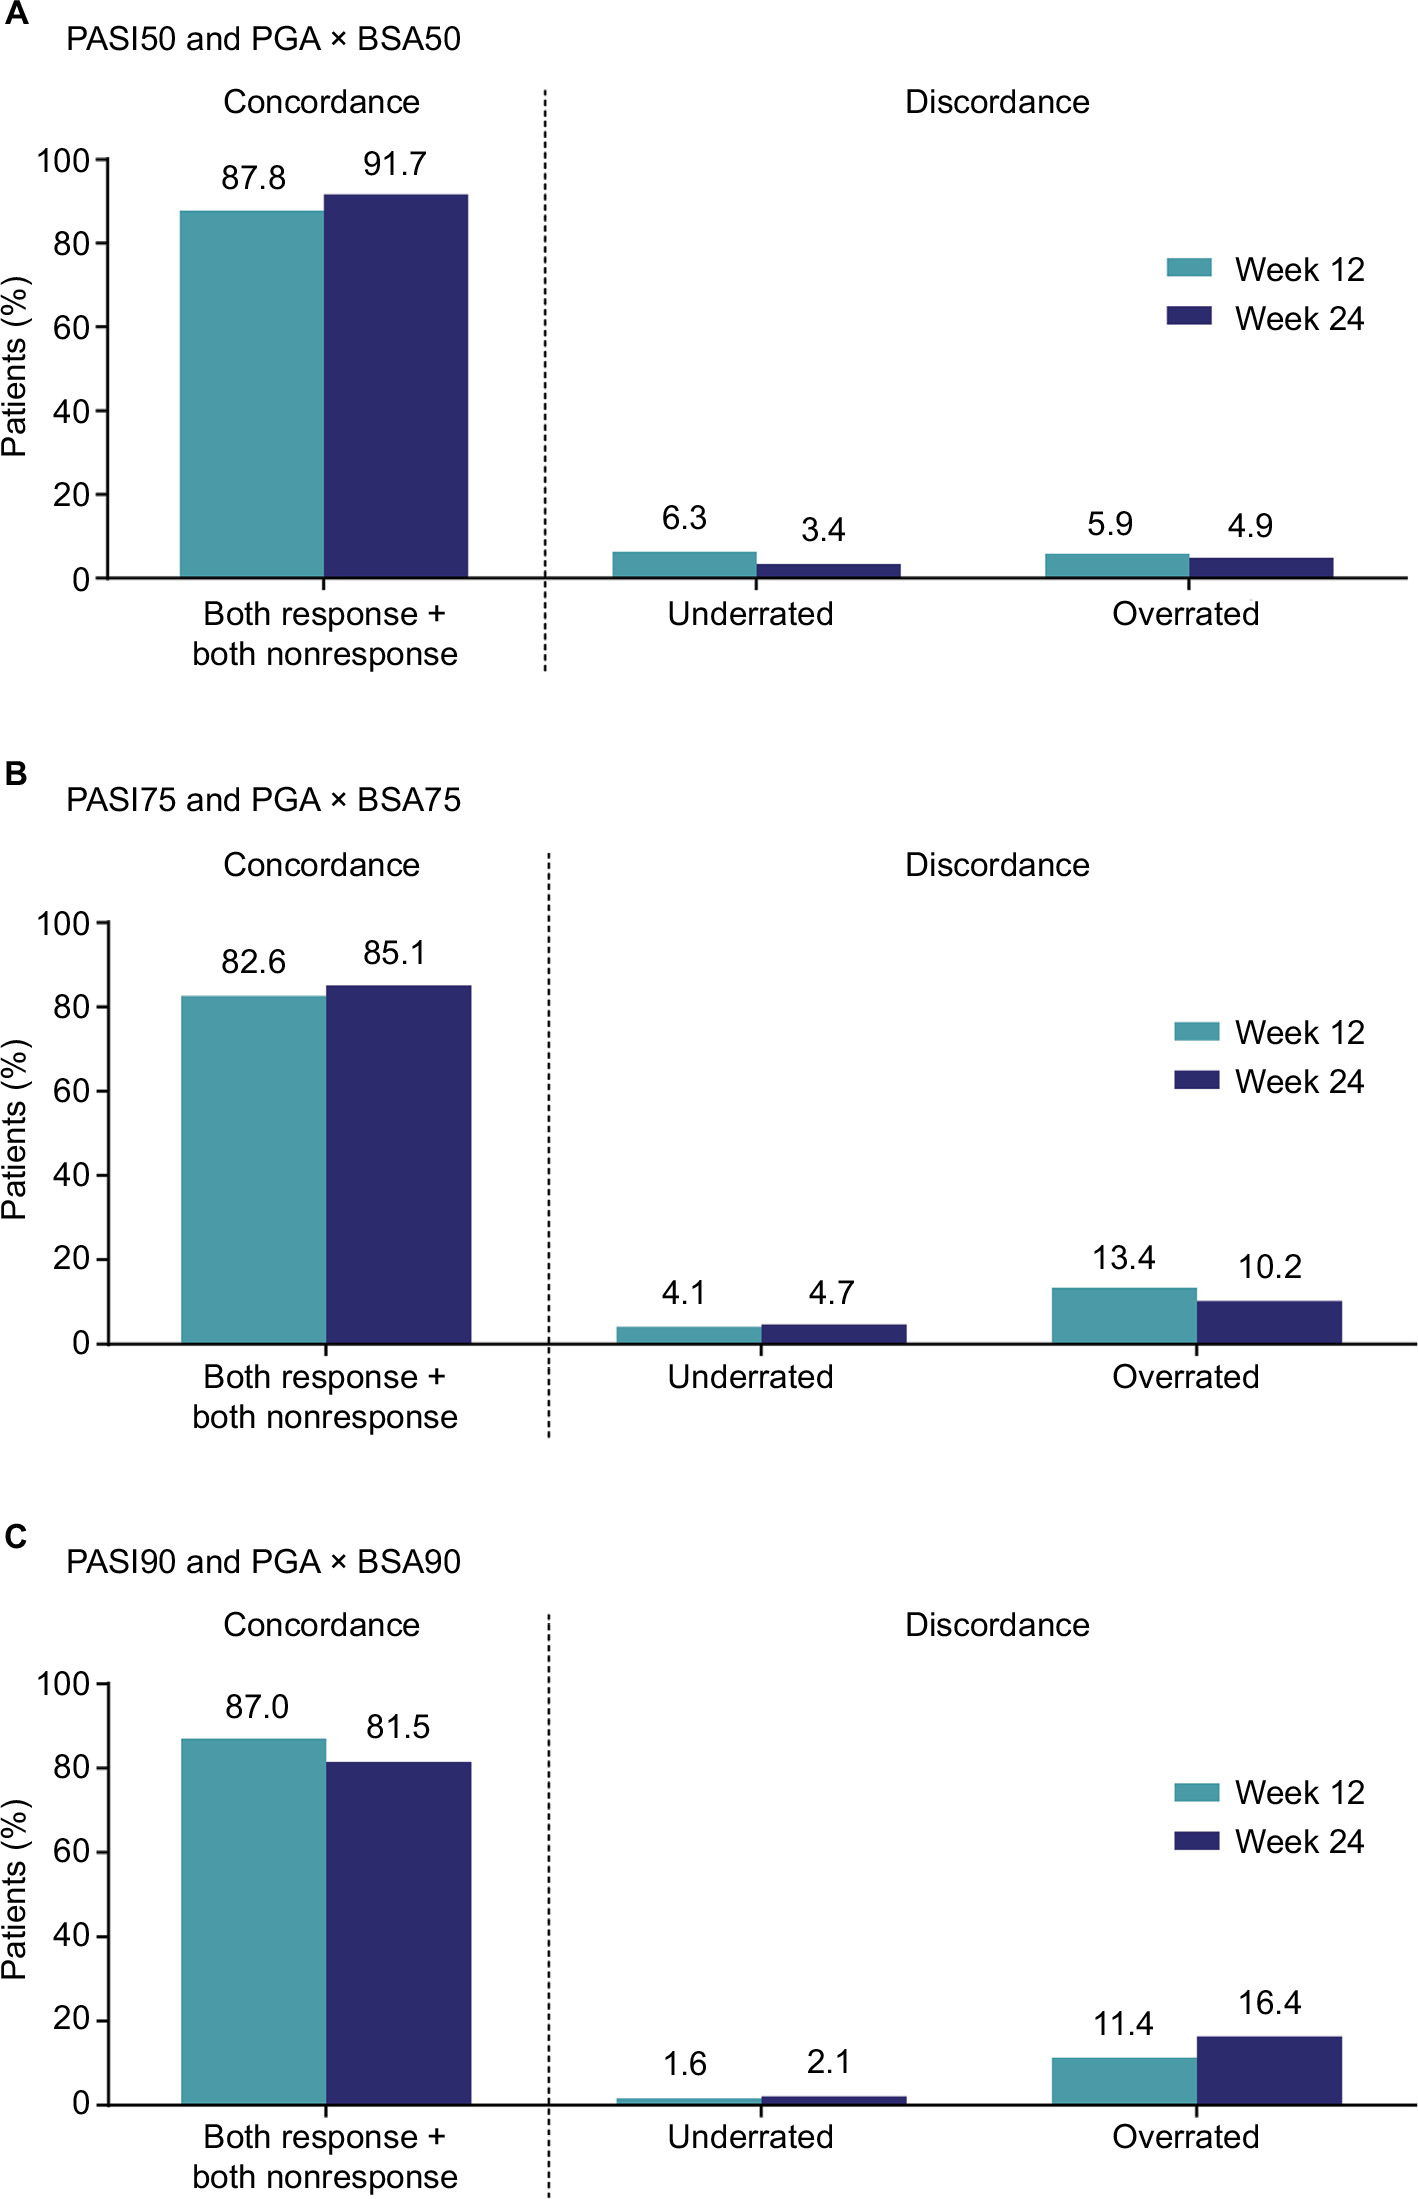 | Figure 3 Concordance and discordance between PASI50 and PGA × BSA50 (A), PASI75 and PGA × BSA75 (B), and PASI90 and PGA × BSA90 (C). Concordance included the total number of patients who achieved both PASI and PGA × BSA response or both PASI and PGA × BSA nonresponse, underrated responses included patients who achieved PASI response and PGA × BSA nonresponse, and overrated responses included patients who achieved PASI nonresponse and PGA × BSA response. Abbreviations: BSA, Body Surface Area; PASI, Psoriasis Area and Severity Index; PGA, Physician Global Assessment. |
Spearman correlation coefficients between PGA × BSA and other measures of psoriasis (Table 3) indicated very high correlations for PGA × BSA versus BSA, moderate to high correlations for PGA × BSA versus PGA, and low to moderate correlations for PGA × BSA versus PtGA and DLQI.
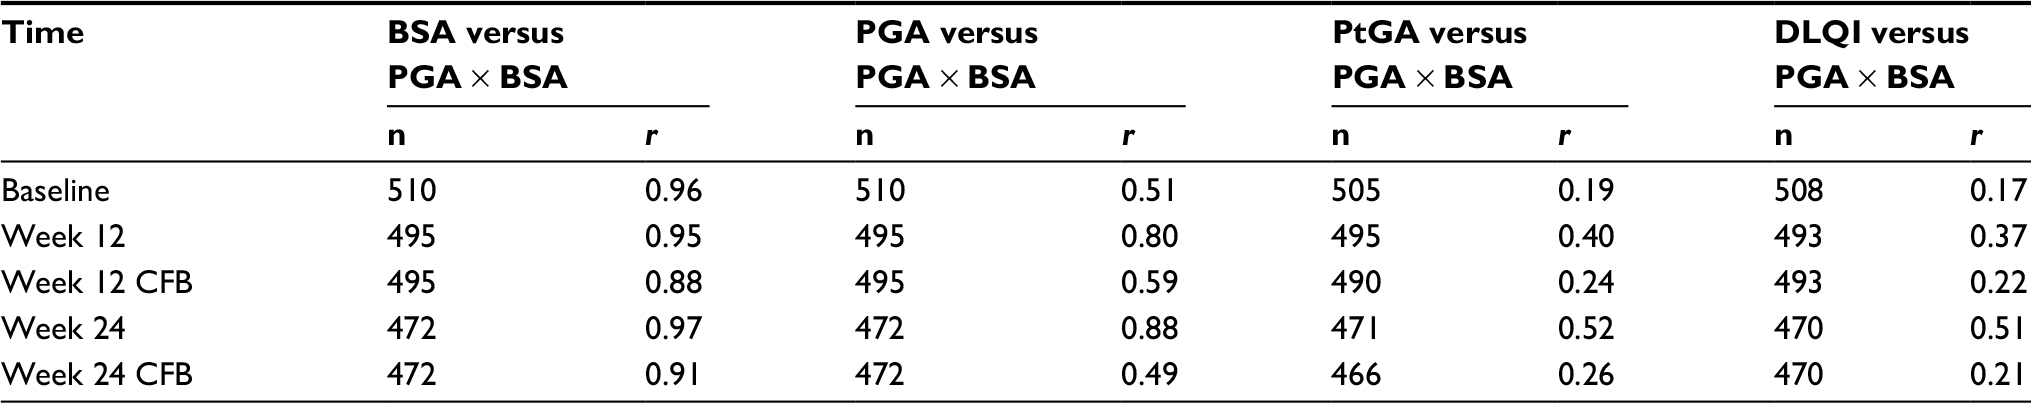 | Table 3 Correlations between other measures of psoriasis severity and PGA × BSA Notes: P<0.001 for all Spearman correlations. Data are for observed cases. Week 12/24 CFB in PGA × BSA was calculated as week 12/24 PGA × BSA − baseline PGA × BSA. The scale for PtGA in the PRESTA study was converted from 0–100 to 0–5 by dividing by 20. Abbreviations: BSA, Body Surface Area; CFB, change from baseline; DLQI, Dermatology Life Quality Index; PGA, Physician Global Assessment; PtGA, Patient Global Assessment; r, Spearman correlation coefficient. |
Discussion
The aim of this study was to evaluate the use of PGA × BSA as an alternative to PASI for measuring psoriasis severity and response to therapy. The results demonstrated strong correlation (from Spearman correlation coefficients) and strong agreement (from ICC statistics) between PASI and PGA × BSA in measuring psoriasis severity.16–18 Additionally, the correlations found between PASI and PGA × BSA in this study (r=0.78–0.90) are consistent with those in our earlier study (r=0.87 in all patients)2 as well as those reported in a recent post hoc analysis of data from the ESTEEM 1 and 2 studies (r=0.74–0.84).10 The ICCs in the current study (ICC =0.76–0.85) were also similar to those reported in the ESTEEM studies (ICC =0.80–0.92).10
This study is unique in evaluating PGA × BSA and PASI scores across the range of psoriasis severity. The scatterplots show that PGA × BSA underestimates psoriasis severity relative to PASI for the low end of the scale and it overestimates psoriasis severity relative to PASI for the high end of the scale. This is supported by the Bland–Altman plots, which show that the differences between PGA × BSA and PASI are not constant across the range of measurement. While the magnitude of these differences was not large, PGA × BSA should not be considered an exact surrogate for PASI. The high rate of concordance (81.5%–91.7%) and corresponding Kappa statistics showed that there was good agreement between PGA × BSA50/75/90 and PASI50/75/90.18,19 PASI50/75/90 and PGA × BSA50/75/90 concordance and discordance data from this study were in a similar range to those reported at week 16 in the ESTEEM studies.10
In this study, PGA × BSA had strong correlations with the component measure BSA, moderate/strong correlations with the component measure PGA, and low/moderate correlations with patient-reported measures (PtGA and DLQI), which has also been reported in other studies.9,10 The strong correlations between PGA × BSA and BSA demonstrated that PGA × BSA and BSA measure psoriasis severity similarly at the population level. However, on an individual level, PGA × BSA would be better at differentiating disease severity with regard to different plaque morphologies. For example, patient A with severe plaque morphology (PGA of 4) over a surface area of 10% will have a PGA × BSA score of 40 and a BSA of 10%, whereas patient B with mild plaque morphology (PGA 1) and identical surface area will have a lower PGA × BSA score of 10, but an identical (non-differentiating) BSA of 10%. The ability of PGA × BSA to capture changes in both plaque morphology and surface area is particularly important when measuring response to treatment, since plaque morphology and area may improve at different rates after treatment initiation.
This study was limited because inter-rater reliability, used to assess the degree to which different raters give consistent estimates of the same phenomenon, and test–retest reliability, used to assess the consistency of a measure from one time to another, were not assessed. These reliability analyses were not feasible because the same ratings were not given by different observers and the same test was not given twice in a short period of time. However, some information on this is already available; a systematic review of outcome measures for psoriasis reported moderate inter-rater reliability for PASI and PGA, high inter-rater reliability for BSA, and limited test–retest reliability for PASI, BSA, and PGA.4
Future studies should include evaluation of PGA × BSA (including response to change) in patients with mild-to-moderate psoriasis. Our expectation is that PGA × BSA will be more sensitive than PASI to differences in BSA in these patients. In our previous publication, we gave an example of two patients with identical PGA scores of 3; patient 1 had erythema 3, induration 3, and desquamation 3 and a BSA of 1%, and patient 2 had identical lesion severity scores but a BSA of 9%; they would have an identical PASI score of 9 as both BSA values would come under the <10% range and thus be considered equal in the calculation.2 In contrast, PGA × BSA scores would reflect their different disease states, with a score of 3 for patient 1 and 27 for patient 2. This sensitivity is most pronounced with mild disease, since there is a larger relative difference between 9% and 1% BSA (9× greater BSA) than between 29% and 21% BSA (1.4× greater BSA). PASI is limited by unequally distributed area score groupings that are not consistently sensitive to clinically meaningful differences in area involvement (for example, 1 for up to 10% BSA, 2 for 10%–29%, 3 for 30%–49%, 4 for 50%–69%, 5 for 70%–89%, and 6 for ≥90%). With PGA × BSA, this limitation is avoided with a continuous area score (for example, 0%–100%), which enables improved monitoring of treatment efficacy over time in clinical practice. Under some circumstances, the PGA × BSA score may be the same despite different combinations of PGA and BSA: for example, a PGA of 5 and BSA of 4 versus PGA of 1 and BSA of 20 (PGA × BSA is 20 for both). For such patients, the PGA × BSA score can easily be deconstructed into component scores to facilitate clinical judgment.
Conclusion
In conclusion, PGA × BSA is a sensitive tool for assessing psoriasis severity and response to therapy. While not interchangeable, PGA × BSA and PASI had high agreement, and PGA × BSA has the advantage of being practical for use in both clinical practice and clinical trials.
Acknowledgments
We are grateful to the Marriott Daughters Foundation and the Ben B and Iris M Margolis Foundation for supporting Dr Walsh’s work. We wish to thank all patients who participated in this study and medical staff of all participating centers. Medical writing support was provided by Rina Vekaria Passmore of Engage Scientific Solutions and was funded by Pfizer. This study was sponsored by Pfizer.
Preliminary data from this study were presented as a poster at the European Academy of Dermatology and Venereology 23rd Congress, October 8–12, 2014, Amsterdam (abstract published in the official congress abstract CD ROM) and the Australasian College of Dermatologists 48th Annual Scientific Meeting, May 16–19, 2015, Adelaide (abstract published in the Australasian Journal of Dermatology. 2015;56(Suppl 2):45; available from: https://onlinelibrary.wiley.com/doi/epdf/10.1111/ajd.12337).
Author contributions
All authors contributed toward data analysis, drafting and revising the paper and agreed to be accountable for all aspects of the work.
Disclosure
Jessica A Walsh has received honoraria for serving as a consultant for Novartis. Heather Jones is an employee of Pfizer and has a financial interest in Pfizer. Lotus Mallbris was employed by Pfizer at the time of the analysis and has a financial interest in Pfizer. Kristina Callis Duffin/her institution has received a salary for serving as an investigator for AbbVie, Amgen, Bristol-Myers Squibb, Celgene, Eli Lilly, Janssen, Novartis, and Stiefel, honoraria for serving as a consultant for AbbVie, Amgen, Bristol-Myers Squibb, Celgene, Eli Lilly, Janssen, Novartis, Pfizer, and Stiefel, and fellowship funding for serving as a consultant for AbbVie. Gerald G Krueger has received honoraria for serving as an advisory board member or consultant or speaker for AbbVie, Amgen, Boehringer Ingelheim, Bristol-Myers Squibb, Celgene, Genentech, Janssen, Eli Lilly, L’Oreal, Novartis, Pfizer, UCB, and Valeant. Daniel O Clegg has received honoraria as a consultant for Janssen Pharmaceuticals. Annette Szumski is an employee of inVentiv Health and was contracted by Pfizer to provide statistical support for the development of this paper. The authors report no other conflicts of interest in this work.
References
Gottlieb AB, Armstrong AW. Psoriasis outcome measures: a report from the GRAPPA 2012 annual meeting. J Rheumatol. 2013;40(8):1428–1433. | ||
Walsh JA, McFadden M, Woodcock J, et al. Product of the physician global assessment and body surface area: a simple static measure of psoriasis severity in a longitudinal cohort. J Am Acad Dermatol. 2013;69(6):931–937. | ||
Pascoe VL, Enamandram M, Corey KC, et al. Using the physician global assessment in a clinical setting to measure and track patient outcomes. JAMA Dermatol. 2015;151(4):375–381. | ||
Puzenat E, Bronsard V, Prey S, et al. What are the best outcome measures for assessing plaque psoriasis severity? A systematic review of the literature. J Eur Acad Dermatol Venereol. 2010;24(Suppl 2):10–16. | ||
Robinson A, Kardos M, Kimball AB. Physician global assessment (PGA) and Psoriasis Area and Severity Index (PASI): why do both? A systematic analysis of randomized controlled trials of biologic agents for moderate to severe plaque psoriasis. J Am Acad Dermatol. 2012;66(3):369–375. | ||
Spuls PI, Lecluse LL, Poulsen ML, Bos JD, Stern RS, Nijsten T. How good are clinical severity and outcome measures for psoriasis? Quantitative evaluation in a systematic review. J Invest Dermatol. 2010;130(4):933–943. | ||
Au SC, Madani A, Alhaddad M, Alkofide M, Gottlieb AB. Comparison of the efficacy of biologics versus conventional systemic therapies in the treatment of psoriasis at a comprehensive psoriasis care center. J Drugs Dermatol. 2013;12(8):861–866. | ||
Buzney CD, Peterman C, Saraiya A, et al. Clearance of psoriasis: the impact of private versus public insurance. J Drugs Dermatol. 2015;14(2):119–125. | ||
Chiesa Fuxench ZC, Callis Duffin K, Siegel M, Van Voorhees AS, Gelfand JM. Validity of the Simple-Measure for Assessing Psoriasis Activity (S-MAPA) for objectively evaluating disease severity in patients with plaque psoriasis. J Am Acad Dermatol. 2015;73(5):868–870. | ||
Duffin KC, Papp KA, Bagel J, Levi E, Chen R, Gottlieb AB. Evaluation of the physician global assessment and body surface area composite tool for assessing psoriasis response to apremilast therapy: results from ESTEEM 1 and ESTEEM 2. J Drugs Dermatol. 2017;16(2):147–153. | ||
Sorensen EP, Fanucci KA, Saraiya A, et al. Tumor necrosis factor inhibitor primary failure predicts decreased ustekinumab efficacy in psoriasis patients. J Drugs Dermatol. 2015;14(8):893–898. | ||
Strohal R, Puig L, Chouela E, et al. The efficacy and safety of etanercept when used with as-needed adjunctive topical therapy in a randomised, double-blind study in subjects with moderate-to-severe psoriasis (the PRISTINE trial). J Dermatolog Treat. 2013;24(3):169–178. | ||
Sterry W, Ortonne JP, Kirkham B, et al. Comparison of two etanercept regimens for treatment of psoriasis and psoriatic arthritis: PRESTA randomised double blind multicentre trial. BMJ. 2010;340:c147. | ||
Fredriksson T, Pettersson U. Severe psoriasis—oral therapy with a new retinoid. Dermatologica. 1978;157(4):238–244. | ||
Finlay AY. Current severe psoriasis and the rule of tens. Br J Dermatol. 2005;152(5):861–867. | ||
Chow R, Chiu N, Bruera E, et al. Inter-rater reliability in performance status assessment among health care professionals: a systematic review. Ann Palliat Med. 2016;5(2):83–92. | ||
Fantoni M, Izzi I, Del Borgo C, et al. Inter-rater reliability of a modified Karnofsky Scale of Performance Status for HIV-infected individuals. Aids Patient Care STDS. 1999;13(1):23–28. | ||
Landis JR, Koch GG. The measurement of observer agreement for categorical data. Biometrics. 1977;33(1):159–174. | ||
Fleiss JL. Statistical Methods for Rates and Proportions. 2nd ed. New York, NY: John Wiley; 1981. |
Supplementary materials
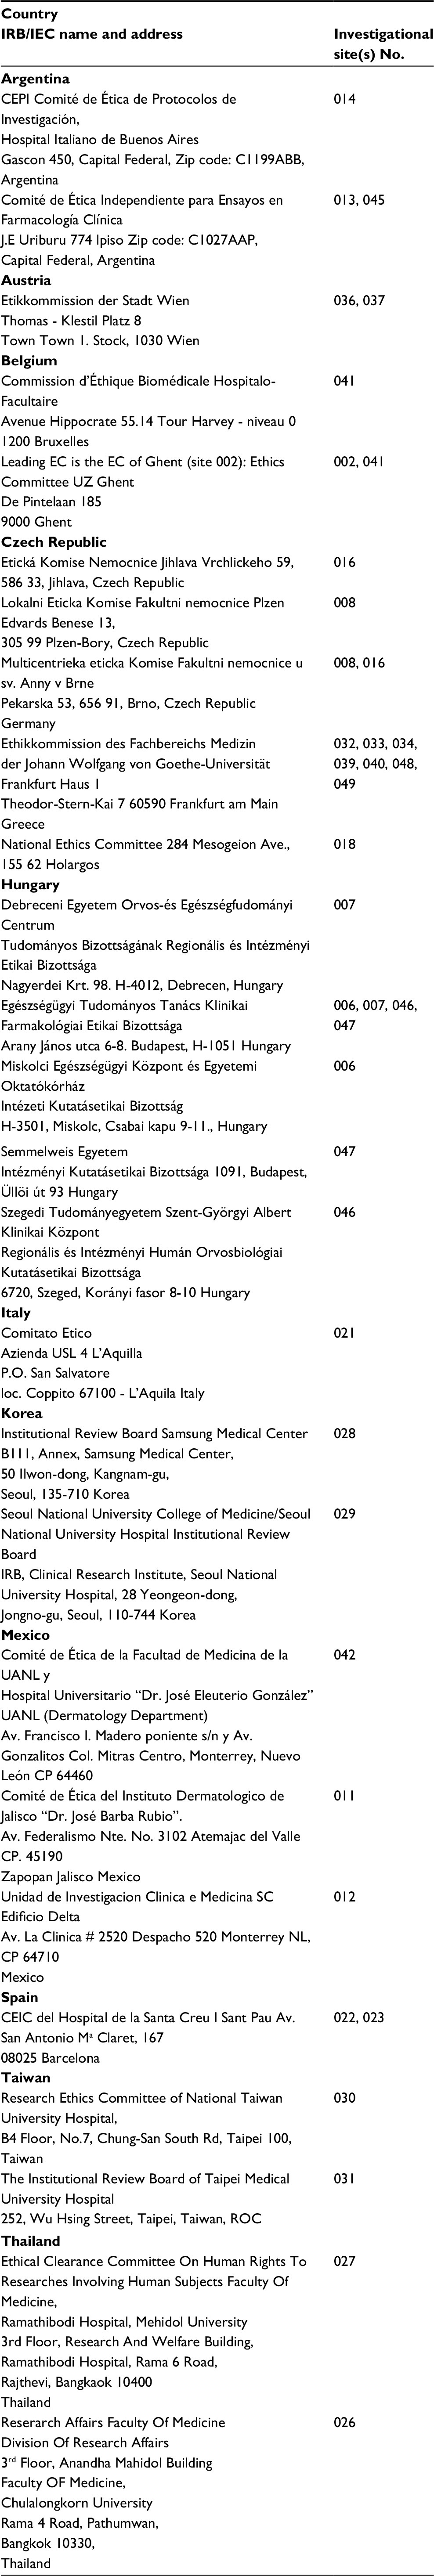 | Table S1 PRISTINE Trial (NCT00663052): names and addresses of IRBs or IECs Note: This post hoc analysis utilised data from old studies. IRB/EC names could be recovered for the PRISTINE (NCT00663052), but not PRESTA trial (NCT00245960). Abbreviations: IRB, Institutional Review Boards; IEC, Independent Ethics Committees. |
 © 2018 The Author(s). This work is published and licensed by Dove Medical Press Limited. The full terms of this license are available at https://www.dovepress.com/terms.php and incorporate the Creative Commons Attribution - Non Commercial (unported, v3.0) License.
By accessing the work you hereby accept the Terms. Non-commercial uses of the work are permitted without any further permission from Dove Medical Press Limited, provided the work is properly attributed. For permission for commercial use of this work, please see paragraphs 4.2 and 5 of our Terms.
© 2018 The Author(s). This work is published and licensed by Dove Medical Press Limited. The full terms of this license are available at https://www.dovepress.com/terms.php and incorporate the Creative Commons Attribution - Non Commercial (unported, v3.0) License.
By accessing the work you hereby accept the Terms. Non-commercial uses of the work are permitted without any further permission from Dove Medical Press Limited, provided the work is properly attributed. For permission for commercial use of this work, please see paragraphs 4.2 and 5 of our Terms.