")
Back to Journals » Diabetes, Metabolic Syndrome and Obesity » Volume 15
Clinical Significance of Glomerular Autophagy in Evaluation of Diabetic Kidney Disease Progression
Authors Wang X, Zeng HX, Jiang L, Liu XQ , Huang YB, Wu YG
Received 25 March 2022
Accepted for publication 9 June 2022
Published 24 June 2022 Volume 2022:15 Pages 1945—1959
DOI https://doi.org/10.2147/DMSO.S366907
Checked for plagiarism Yes
Review by Single anonymous peer review
Peer reviewer comments 3
Editor who approved publication: Professor Ming-Hui Zou
Xian Wang,1 Han-Xu Zeng,1 Ling Jiang,1 Xue-Qi Liu,1 Yue-Bo Huang,1 Yong-Gui Wu1,2
1Department of Nephropathy, The First Affiliated Hospital of Anhui Medical University, Hefei, Anhui, 230022, People’s Republic of China; 2Center for Scientific Research of Anhui Medical University, Hefei, Anhui, 230022, People’s Republic of China
Correspondence: Yong-Gui Wu, Department of Nephropathy, The First Affiliated Hospital of Anhui Medical University, Hefei, Anhui, People’s Republic of China, Tel +86 551 6292 2111, Email [email protected]
Background: Diabetic kidney disease (DKD) is closely associated with the death or survival of resident kidney cells.
Aim: The purpose of this study was to determine the changes in renal cell survival and death in DKD and their diagnostic values in DKD progression.
Materials and Methods: This study analyzed a dataset of renal tissues from DKD patients to identify changes in genes associated with renal cell death and survival. Our findings were subsequently validated in human kidney tissues. Differential indicators of DKD patients’ clinicopathological data screened by stepwise regression and glomerular P62 protein expression were included in binary logistic regression analysis to assess the impact of these parameters on DKD progression. A receiver operating characteristic (ROC) curve analysis was employed to evaluate the diagnostic value of P62 protein in DKD progression.
Results: Bioinformatics analysis results revealed that glomerular autophagy in DKD was more significantly altered, which was consistent with the semi-quantitative results of P62 in glomeruli. Further studies established that P62 expression was mainly increased in podocytes. Stepwise regression analysis indicated that changes in the expressions of glomerular P62 and apolipoprotein A1 (ApoA1) might be involved in the progression of DKD. However, binary logistic regression analysis results suggested that only P62 was significantly associated with DKD development. ROC curve analysis showed that the area under the curve (AUC) of P62 for the detection of DKD was 0.905.
Conclusion: Autophagy inhibition occurred in both glomeruli and tubules, and was most pronounced in glomerular podocytes. The levels of P62 protein in glomeruli, as an autophagy activity indicator, was one of the predictors of entering the stage of macroalbuminuria in DKD.
Keywords: diabetic kidney disease, autophagy, glomerulus, podocyte
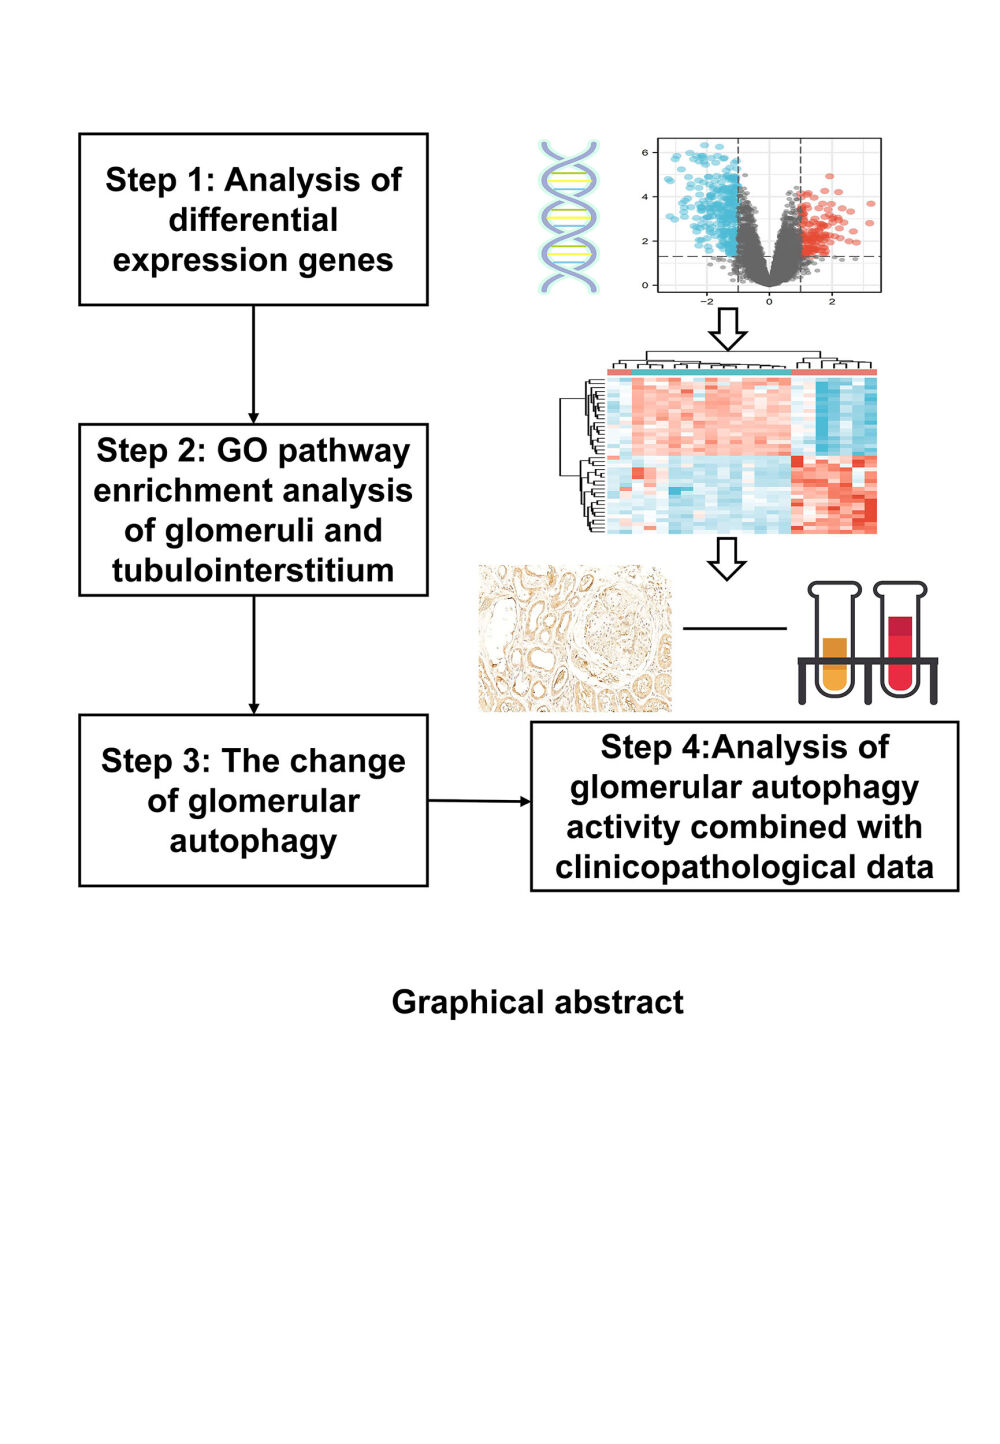
Graphical Abstract:
Plain Language Summary
Diabetic kidney disease (DKD) is closely associated with renal cell death and survival. Bioinformatics analysis results revealed more significantly altered glomerular autophagy in DKD, which was consistent with the semi-quantitative results of P62 in glomeruli. Further studies established that P62 was mainly increased in podocytes. Stepwise regression analysis showed that the changes in the expressions of glomerulus P62 and apolipoprotein A1 (ApoA1) might be involved in the progression of DKD. However, binary logistic regression analysis results indicated that only the level of P62 protein was significantly associated with DKD development. ROC curve analysis showed that the AUC of P62 for the detection of DKD was 0.905. In conclusion, autophagy inhibition occurred in both glomeruli and tubules, and was most pronounced in glomerular podocytes. The levels of P62 protein in glomeruli, as an autophagy activity indicator, were one of the predictors of entering the stage of macroalbuminuria in DKD.
Introduction
Diabetic kidney disease (DKD) is one of the main complications of diabetes and has become the leading cause of chronic kidney disease in hospitalized patients in China.1 The mechanism underlying the occurrence and development of DKD is complex, involving various cells and cytokines, and changes in systemic and local metabolic responses such as glucose and fat metabolism, forming network effects and cascade reactions, eventually leading to kidney damage. It seems easier to find answers by focusing on the beginning or end of the disease. The ultimate fate of a cell is death or survival. Various forms of programmed cell death exist, including podoptosis, pyroptosis and anoikis. In particular, autophagy is the process by which cells clear their own damaged organelles and metabolic waste, and exhibits anti-cell death effects.2 As a form of cell survival, autophagy has been little explored in terms of its relation to the progression of DKD.
The purpose of this paper was to observe the main forms of renal cell survival and death in DKD based on the results of bioinformatics analysis. By combining with clinicopathological indicators of DKD patients, the clinical values of cell death and survival forms in the progression of proteinuria in DKD were further explored.
Materials and Methods
Identification and Pathway Enrichment Analyses of Differentially Expressed Genes (DEGs)
Gene expression profile of GSE30122 was acquired from NCBI-GEO (http://www.ncbi.nlm.nih.gov/geo/) based on the GPL 571 platform and processed by R software package (R 3.6.3).3 This dataset was characterized by sequencing analysis on glomeruli and renal tubules isolated from renal tissues. Differential functions were analyzed using the Wilcox-test between the two groups. DEGs were defined by p value <0.05 and FC (fold change) ≥1.2 or ≤0.833. Gene Ontology (GO) and Kyoto Encyclopedia of Genes and Genomes (KEGG) analyses of DEGs were performed using the online tool DAVID (https://david.ncifcrf.gov). Both GO and KEGG enrichment assay showed the top 26 pathways related with DEGs.
Calculation of Sample Size
Participants were divided into three groups: normal control group (NC), minimal change disease (MCD) group (proteinuria control group), and DKD group. The DKD group was further divided into two subgroups based on urine albuminuria excretion rate (ACR), including microalbuminuria group (DKD1, urinary ACR 30–299 mg/g) and macroalbuminuria group (DKD2, urinary ACR ≥ 300 mg/g). The sample size was calculated according to the mean value and the standard deviation (SD) of P62 protein expression in glomeruli. We set the sample size ratio of NC:MCD:DKD1:DKD2 to be 1:2:2:2, and defined the type I error α of the hypothesis test to be 0.05 and the type II error β to be 0.1. The minimum sample size was calculated by comparing the quantitative expression of glomerular P62 protein in multiple groups with a mean value of 0.4 ± 0.1, 1.4 ± 0.4, 2.2 ± 0.9, and 3.0 ± 0.7 for the NC, MCD, DKD1, and DKD2 group, respectively. The minimum sample sizes of the four groups were 3, 6, 6, and 6, respectively. A total of 60 patients were selected for inclusion in this study (NC: MCD: DKD1: DKD2 = 6:11:13:30).
Inclusion and Exclusion Criteria of Patients
This study complied with the declaration of Helsinki and was approved by the medical ethics committee of the First Affiliated Hospital of Anhui Medical University (Hefei, China) (approval no.: 20190454), and performed from January 2019 to June 2021. The participants in this study provided their written informed consent to participate and underwent renal biopsy during hospitalization.
Inclusion criteria were as follows: (1) aged 18–80 years; (2) diagnosis of diabetes mellitus, including fasting plasma glucose ≥7.0 mmol/L, or 2 h postprandial blood glucose ≥11.1 mmol/L during an oral glucose tolerance test;4 and (3) diagnosis of DKD by renal biopsy.5 Exclusion criteria were as follows: (1) patients with another specific form of diabetes, including secondary to autoimmune diseases (AID), chronic pancreatitis, surgery or medicine; (2) accompanied by acute myocardial infarction, heart failure, or cerebrovascular disease; liver failure with alanine aminotransferase level exceedingly twice the upper normal limit; urinary system disease induced by urolithiasis, cancer, infection; acute diabetic complications; other severe circulatory, respiratory or digestive system diseases; (3) specific medication administration: antineoplastic drugs, autoimmune suppressants, and redox preparations; (4) pregnant and lactating women; (5) cancer; and (6) those lost for other reasons.
The renal tissues were acquired from MCD patients diagnosed by renal biopsy and with no obvious pathological changes under a light microscope. In NC group, the renal tissues adjacent to the tumor were collected during the removal of tumor tissue from patients with renal cancer. All patients in NC and MCD control groups were free of diabetes (fasting plasma glucose <6.1 mmol/L, or 2 h postprandial blood glucose <7.8 mmol/L during an oral glucose tolerance test). Exclusion criteria were as follows: (1) hypertension; (2) suffering from secondary nephropathies, heart failure, malignant hypertension, myocardial infarction, cerebrovascular accident, infect, liver dysfunction with alanine aminotransferase level exceedingly twice the upper normal limit; (3) pregnant and lactating women; (4) those lost for other reasons.
Data and Sample Collection of Patients
Clinical characteristics of participants in each group were collected, including age, gender and ACR. In addition, we further collected other clinical and pathological data of participants in the DKD group, such as diabetic duration, blood pressure, body weight, smoking, and biochemical and pathological indicators. Blood pressure and weight of participants were measured on admission. Blood and urine biochemical tests were performed after fasting for 6–8 hours the next morning after admission, including blood lipids, fasting blood glucose (FBG), plasma albumin, hemoglobin, serum creatinine (Scr), blood urea nitrogen (BUN), uric acid (UA), 24-h urine protein (24-hUTP), 24-h urinary albumin excretion (24-hUAER), urinary transferrin (U-TRF), N-acetyl β-glucosaminidase (U-NAG), urinary IgG (U-IgG), urinary albumin (U-ALB), urinary fibrinogen (U-FDP), urinary cystatin C (U-cyc), urinary β2 microglobulin (U-β2-MG), and urinary α1-microglobulin (U-α1-MG). The degree of glomerular damage, interstitial fibrosis and tubular atrophy (IFTA), arteriosclerosis and arterial hyalinosis were graded following the DKD pathological diagnostic criteria.3
Immunohistochemistry (IHC) and Immunofluorescence (IF) Double Staining of Kidney Tissues
Fresh renal tissues from patients were immediately fixed in 4% paraformaldehyde at room temperature for at least 24 h, routinely dehydrated, transparently embedded in paraffin, and then cut into 3-μm-thick slices. After deparaffinization, the renal tissue sections were subjected to high-pressure antigen retrieval. For IHC staining, endogenous peroxidase-blocking agent and 10% goat serum blocked non-specific antigens were mixed with the samples, followed by overnight incubation at 4°C with anti-P62/SQSTM1 antibody. Then the renal tissue samples were incubated with the secondary antibody at 37°C for 30 min, followed by staining with DAB chromogenic solution at room temperature. Nuclei were stained with hematoxylin. The sections were observed and photographed under a microscope, and the immunohistochemical staining intensity of P62 protein in glomeruli was measured by Image J software. For IF staining, anti-P62/SQSTM1 was, respectively, incubated with markers of glomerular resident cells (anti-WT-1, anti-CD31, anti-PDFGR-β) overnight at 4°C, followed by incubation with fluorescently labeled secondary antibodies at 37°C for 1 h in the dark. Nuclei were stained with DAPI, and the sections were observed and photographed under a fluorescence microscope.
Statistical Analysis
R3.6.3 (https://www.r-project.org/) was used for the analysis and visualization of the dataset. PASS15.0 was employed to calculate the sample size. ImageJ was used to analyze image data. SPSS 22.0 was utilized for statistical analysis. Data with normal distribution were analyzed by Shapiro–Wilk test. Categorical and non-normally distributed data between groups were compared with chi-square test, or rank sum test. Quantitative data were presented as mean ± standard deviation (SD)/ mean ± standard error of the mean (SEM). Statistical significance of normally distributed data between groups was calculated by independent sample t-test and one-way analysis of variance (ANOVA). Statistical significance of non-normally distributed data was calculated by Mann–Whitney U-test. Linear correlation analysis was performed using Spearman’s test. Stepwise regression was performed for the selection of the influencing factors, and their associations with the progression of DKD were evaluated via binary logistic regression analysis. Furthermore, ROC curve analysis evaluated the clinical diagnostic value of the influencing factors related to DKD. P < 0.05 was considered statistically significant difference.
Results
Gene Bioinformatics Analysis in DKD Kidney Tissues
The glomerular dataset contained the information of the NC group (n = 13) and DKD group (n = 9), in which a total number of 12,823 genes were detected and 3358 DEGs were screened. GO and KEGG analysis showed that DEGs were enriched mainly in the processes of immune cells, oxidative stress, complement and lectins, extracellular matrix secretion, and multiple signaling pathways (such as Ras, PI3K-AKT, and Wnt signaling pathways). Notably, BP enrichment analysis found that a large number of genes were enriched in autophagy pathway, suggesting that glomerular autophagy activity was altered (Figure 1).
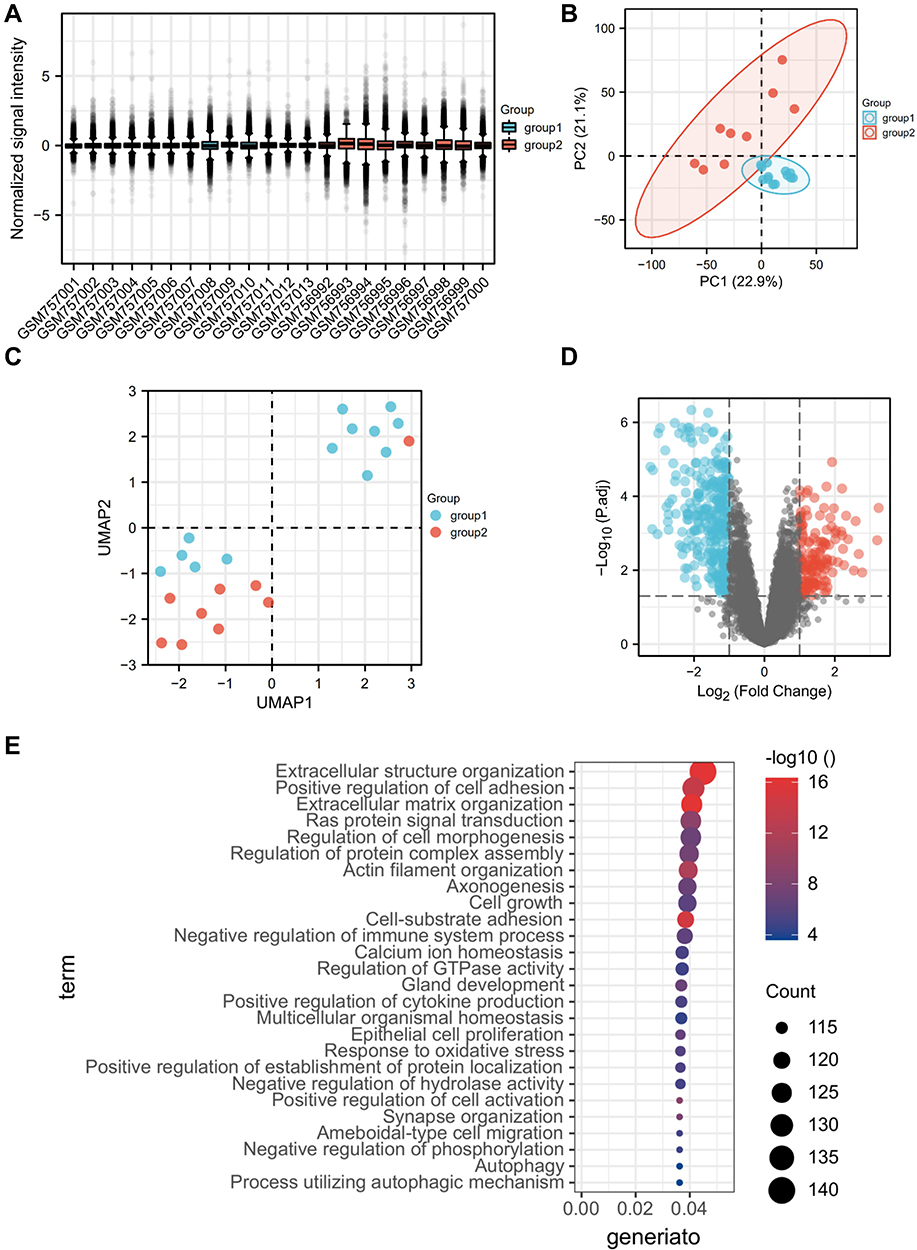 |
Figure 1 Identification and GO analysis of DEGs in glomeruli. (A) Sample normalization; (B) PCA of glomerular genes; (C) UMAP of glomerular genes; (D) volcanic map of DEGs in glomeruli; (E) GO analysis of DEGs in glomeruli (top 26). Abbreviations: DKD group, group 1; NC group, group 2; DEGs, differential expression genes; DKD, diabetic kidney disease. |
The renal tubulointerstitial dataset included data from the NC group (n = 12) and the DKD group (n = 10), where we detected a total number of 12,823 genes, among which 2242 DEGs were screened. The genes analyzed by GO and KEGG were enriched mainly in the extracellular matrix structure, secretion-related pathways and the activation and chemotactic regulation pathways of various immune cells, especially T cells (Figure 2).
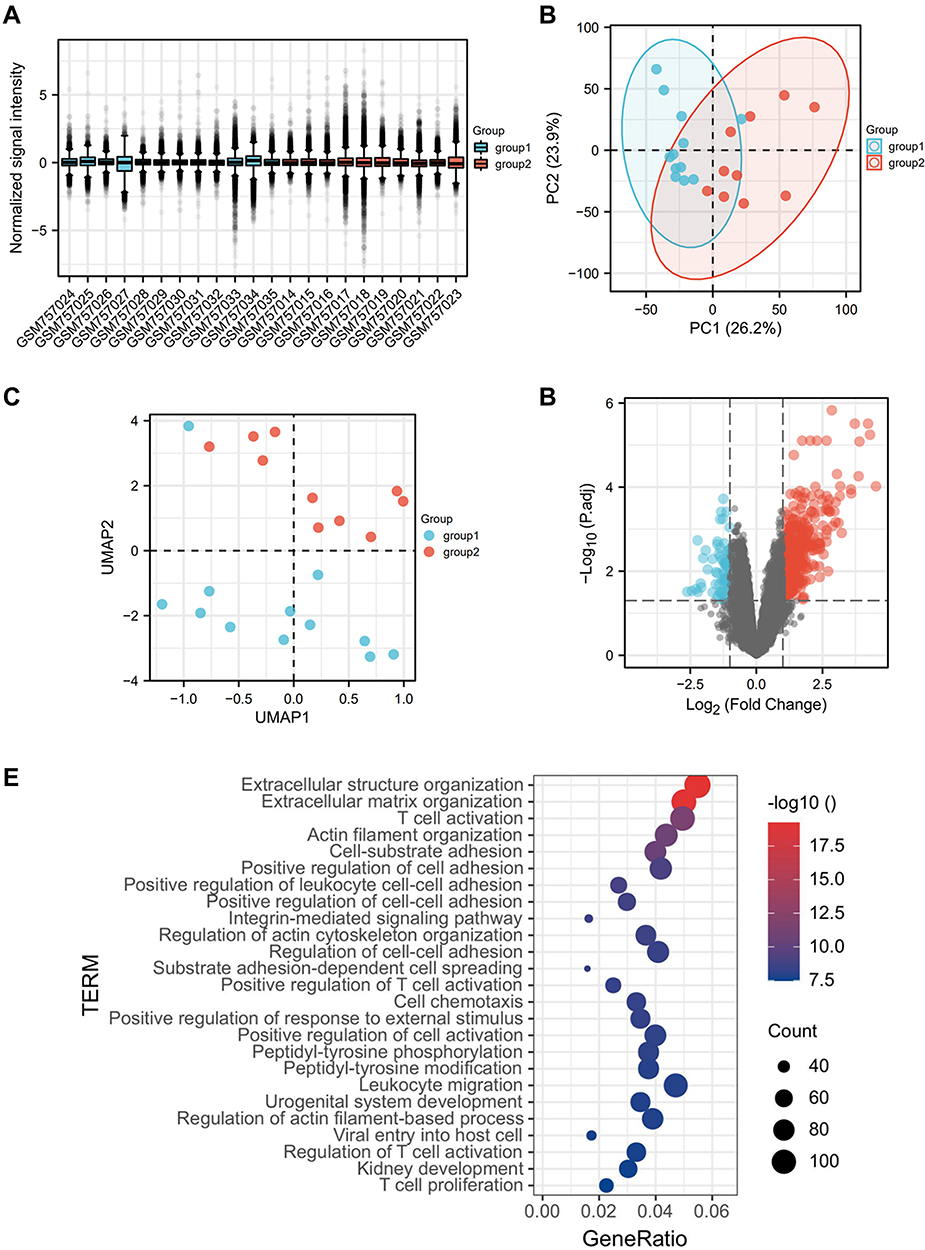 |
Figure 2 Identification and GO analysis of DEGs in renal tubular interstitium. (A) Sample normalization; (B) PCA of genes in renal tubulointerstitium; (C) UMAP of genes in renal tubulointerstitium; (D) volcanic map of DEGs in renal tubular interstitium; (E) GO analysis of DEGs in renal tubulointerstitium (top 26). Abbreviations: DKD group, group 1; NC group, group 2; DEGs, differential expression genes; DKD, diabetic kidney disease. |
P62 Protein Expression in Human Renal Tissues
IHC staining of the renal tissues showed that P62 protein was expressed in both glomeruli and tubules, with the highest level of expression in DKD patients with macroalbuminuria. In glomerulus, P62 semi-quantitative results of MCD group and DKD1 group were higher than normal group, but there was no statistical significance (p>0.05). In tubulointerstitium, P62 semi-quantitative results of NC group were lower than the other three groups, while the highest level of P62 protein expression was in DKD2 group. However, there was no statistical significance between DKD1 and DKD2 group (p>0.05) (Table 1 and Figure 3A). Renal tissues of patients in the DKD2 group were selected for immunofluorescence double staining of P62 and cellular markers of glomerular resident cells. There were many P62+/WT-1+ positive cells in the glomerulus, while endothelial cell marker (CD31) and mesangial cell marker (PDGFR-β) overlapped less with P62 staining, suggesting that autophagy inhibition had occurred in podocytes during DKD progression (Figure 3B–D).
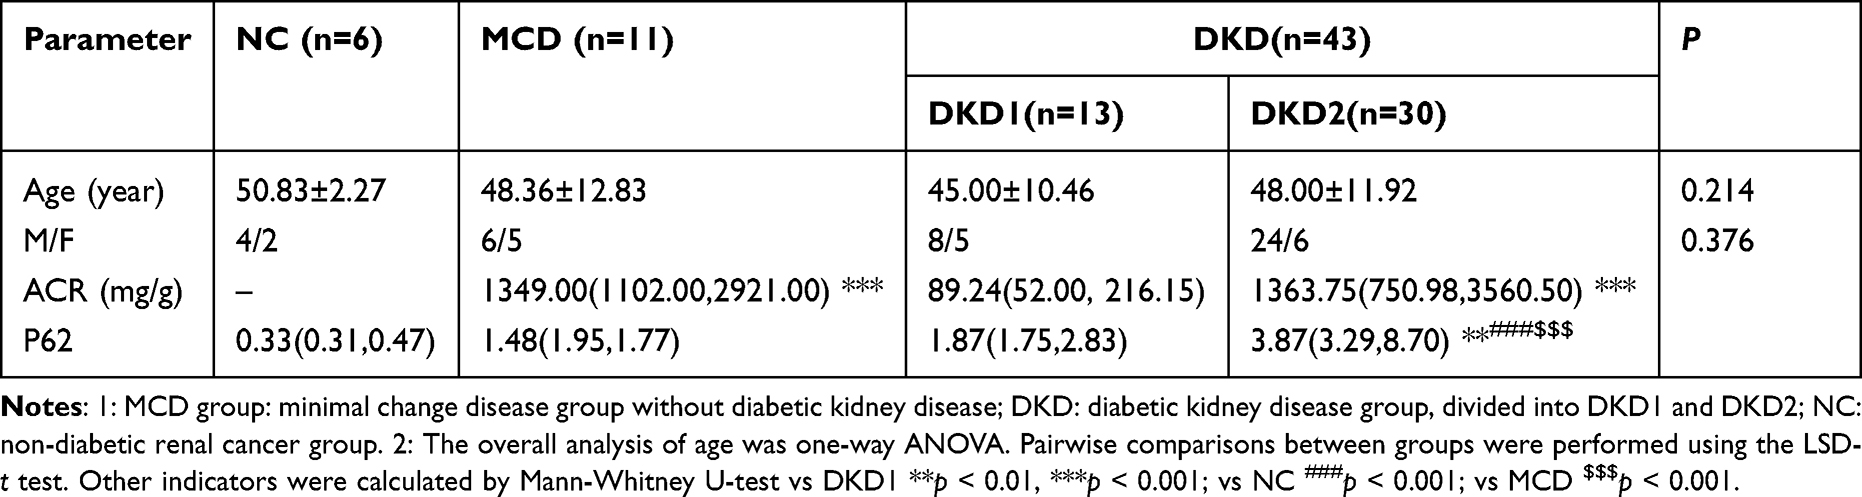 |
Table 1 Baseline Demographic Data of Patients and p62 Protein Expression of Renal Tissue |
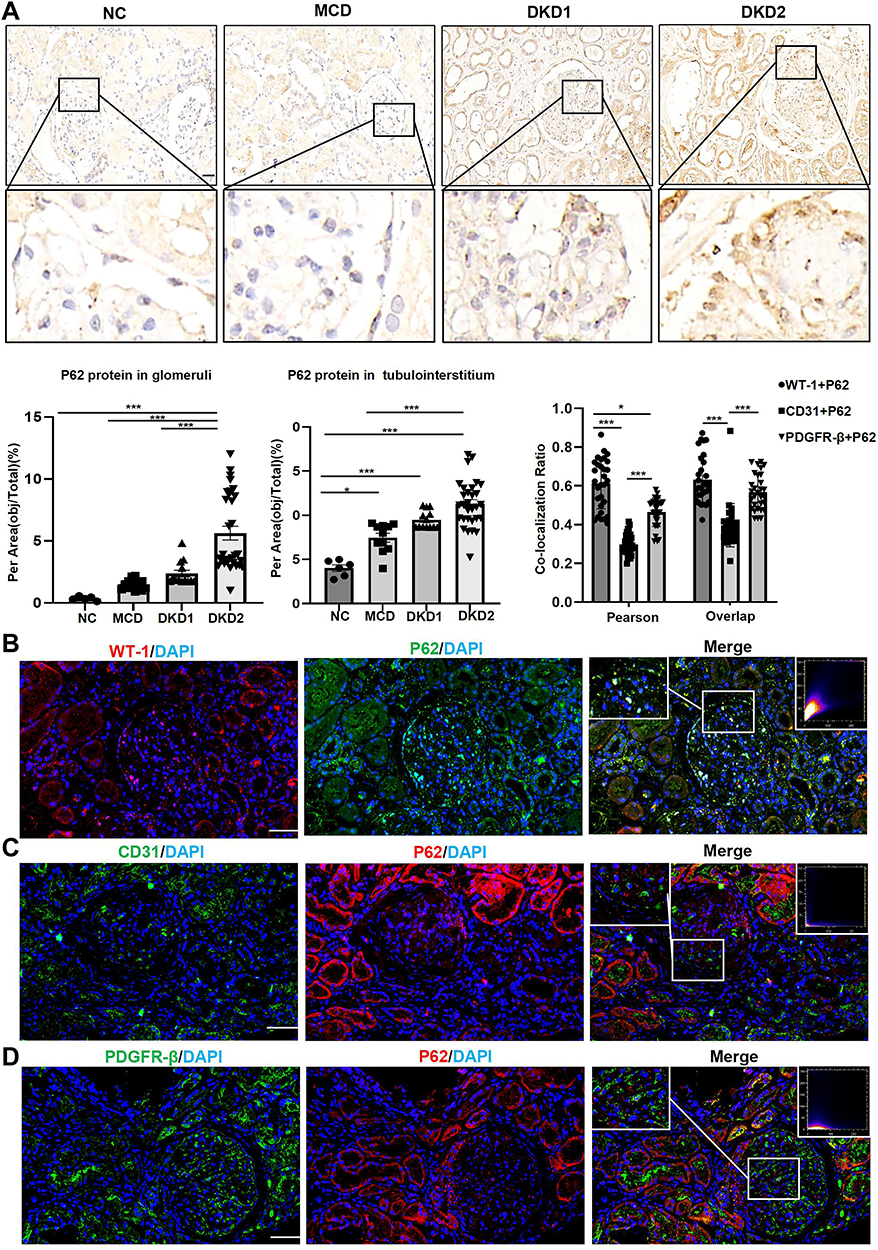 |
Figure 3 The expressions of the P62 protein in human renal tissues were significantly increased in the DKD group patients with macroalbuminuria, mainly in the podocytes. (A) IHC staining of P62 protein in human renal tissues; (B) double immunofluorescence staining of P62 and WT-1 in human renal tissue of DKD2 group. (C) Double immunofluorescence staining of P62 and CD31 in human renal tissue of DKD2 group. (D) Double immunofluorescence staining of P62 and PDGFR-β in human renal tissue of DKD2 group. Data are expressed as mean ± standard deviation (SEM). Scale bar = 50 μm; *p < 0.05, ***p < 0.001. |
Clinical and Pathological Data of DKD Patients
Comparison of the Clinical Data of DKD Patients
Clinical data of patients are presented in Table 2. There were no statistically significant differences were present in age and gender among groups. The analysis results suggested main differences in lipid metabolism biochemical indicators such as total cholesterol (CHO), low-density lipoprotein (LDL), apolipoprotein B (ApoB), and apolipoprotein A1 (ApoA1) in DKD patients with massive proteinuria. In the DKD2 group, the levels of serum albumin (ALB) and urinary creatinine (U-Cr) were decreased, while those of multiple urinary proteins, including U-TRF, U-IgG, U-NAG, U-ALB/Cr, U-TP/Cr, 24-h UTP, 24-h UTP/Cr, U-ALB, and 24-h UAER, were significantly increased. All differences were statistically significant (p < 0.05).
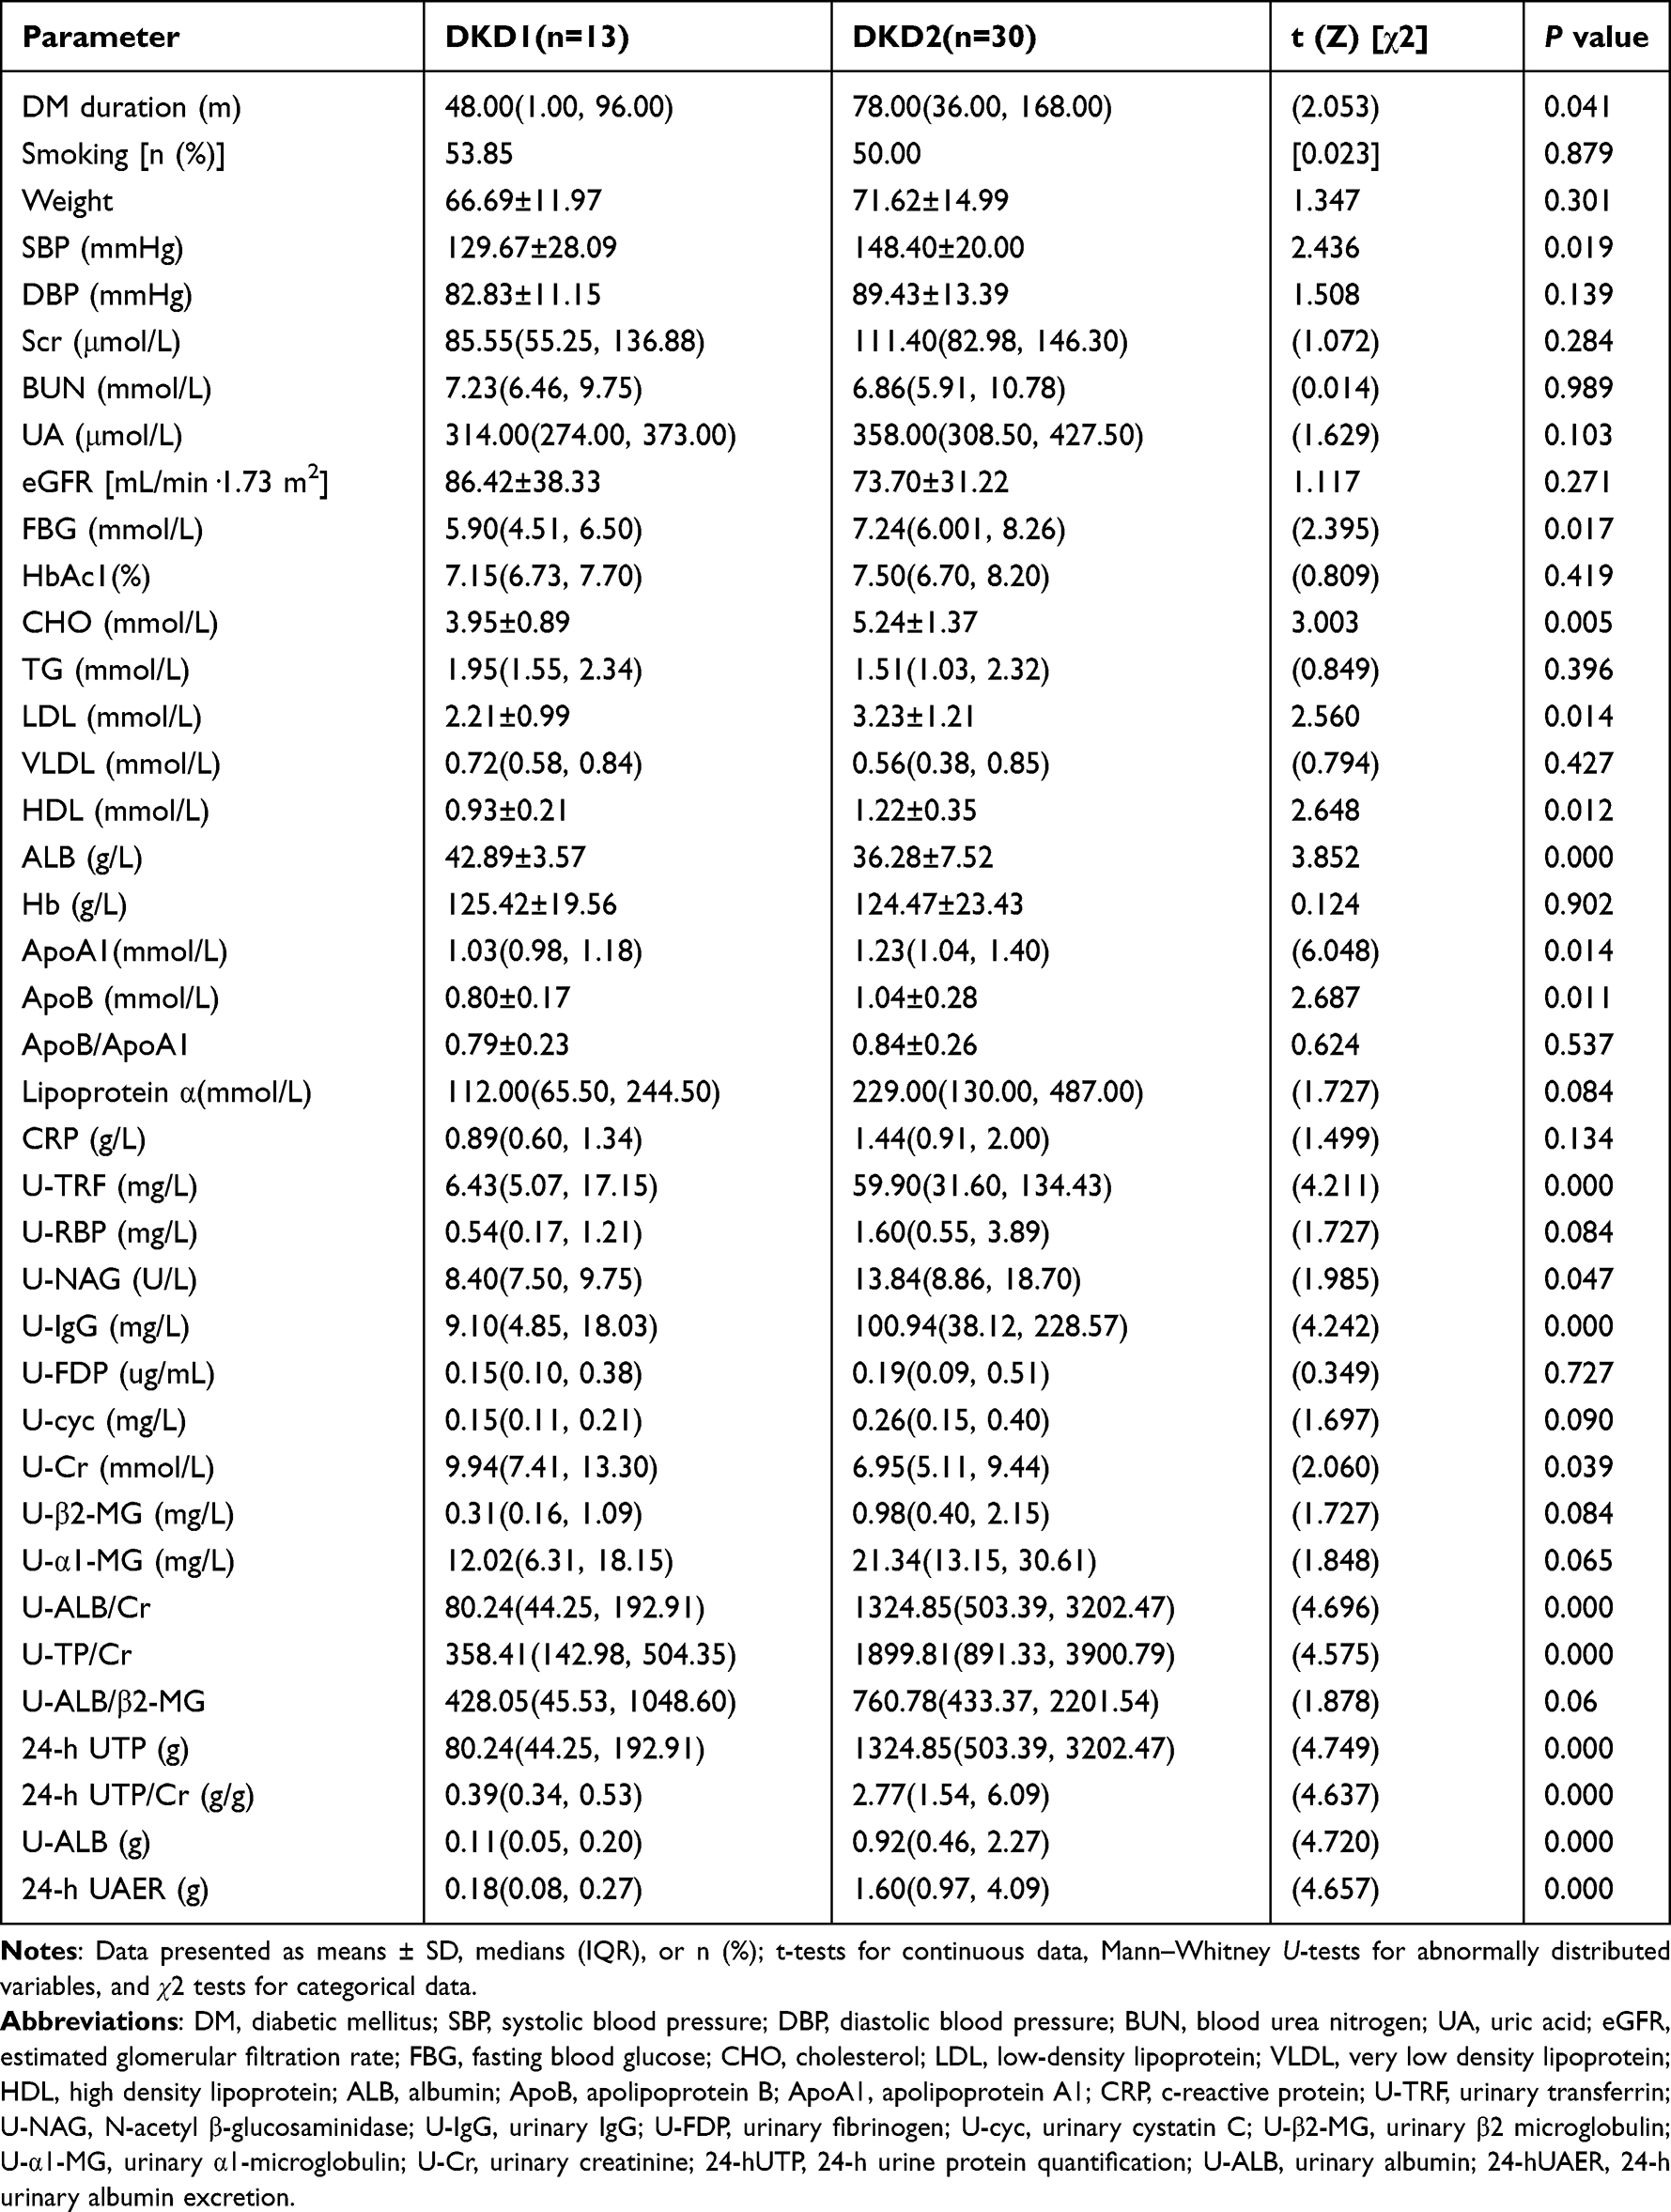 |
Table 2 Clinical Data of Patients with DKD |
Comparison of Pathological Data of DKD Patients
Next, this study compared the pathological data of DKD patients (Table 3). The results showed that in DKD patients with massive proteinuria, the grades of glomerular lesions, IFTA, inflammatory infiltration, and arteriosclerosis were significantly increased. However, no significant difference was found in the changes of arterial hyalinization and arteriosclerosis among the groups (p > 0.05).
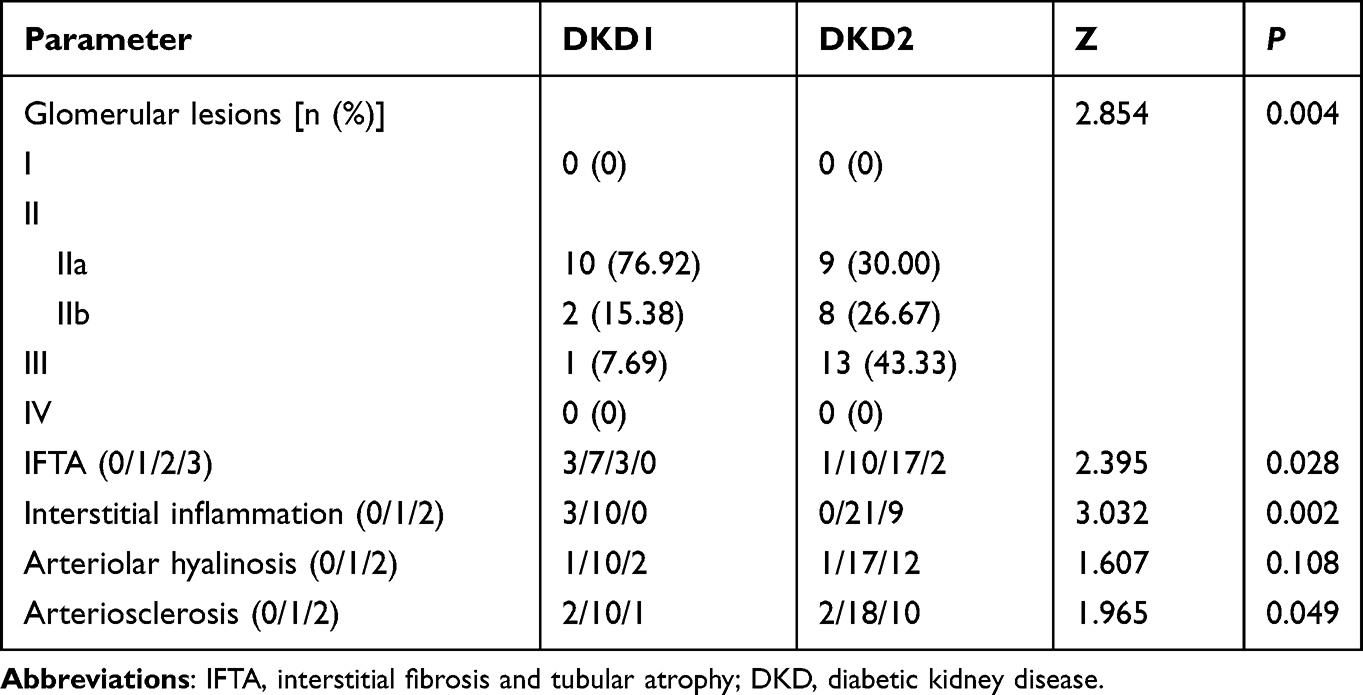 |
Table 3 Comparison of Pathological Data of DKD Patients |
Correlation Analysis of Glomerular P62 Protein with Clinicopathological Data of DKD Patients
To evaluate the clinical significance of P62 protein in glomeruli, we conducted a correlation analysis between semi-quantitative IHC results of P62 protein in human glomeruli and clinicopathological indicators with significant statistical differences in each group (Table 4). The results established that the level of P62 protein in glomeruli had a positive correlation with serum CHO, LDL, HDL, and ApoB levels and urine U-TRF, U-NAG, U-IgG, U-ALB/Cr, U-TP/Cr, U-ALB, U-ALB/Cr, 24-h UAER, 24-h UTP/Cr, and 24-h UTP levels. P62 protein level was also positively correlated with glomerular lesions, interstitial inflammation (p < 0.05), but negatively correlated with the changes in ALB and U-Cr levels (p < 0.05).
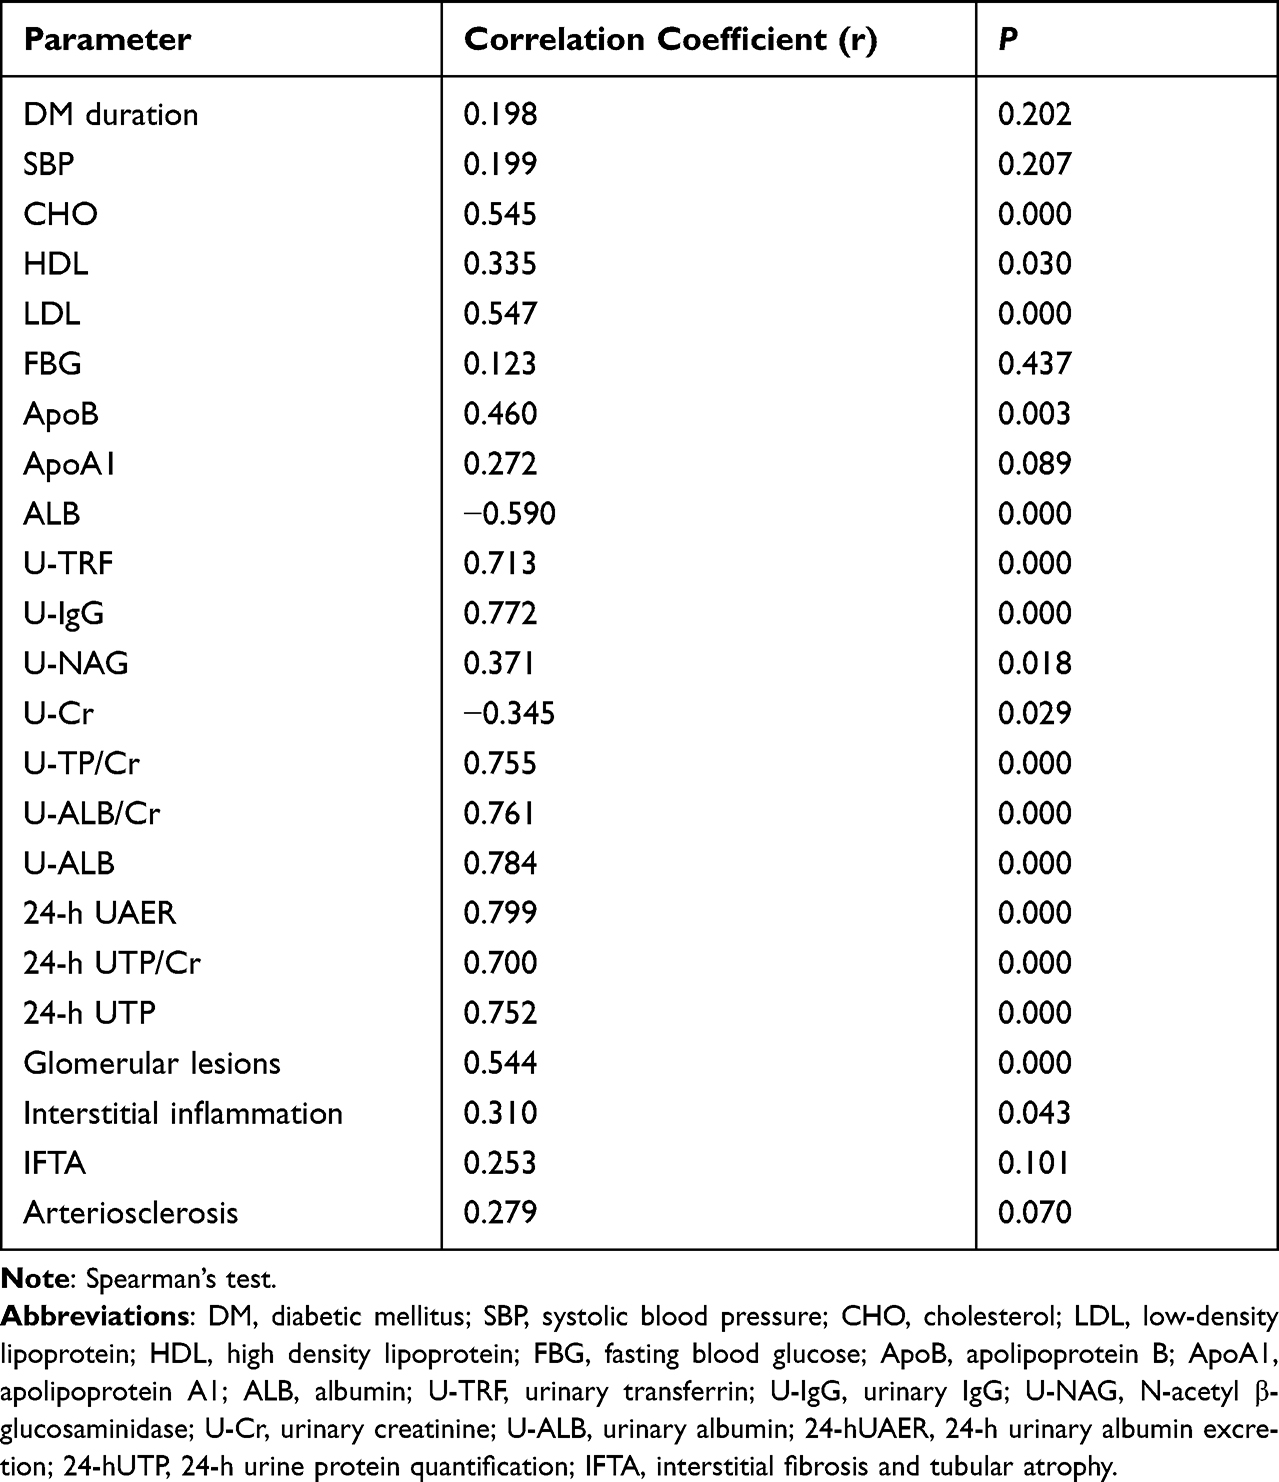 |
Table 4 Correlation Analysis of P62 Protein Level on Glomerulus and Clinicopathological Data of DKD Group |
Stepwise Regression Screening of Possible Influencing Factors for DKD Progression
Due to the limitation of the sample size, this study could not include all statistically significant indicators into the subsequent logistic regression analysis. Therefore, stepwise regression was applied for the preliminary screening of the variables. The specific method employed for the regression model included one variable at a time, which meant that the variable was retained if there was significant significance; otherwise, it was excluded. The remaining variables were then successively included into the regression model. The following detailed steps were implemented: (1) analysis of the model fitting (R2) and the VIF value (multicollinearity judging); (2) calculation of the model formula; and (3) evaluation of the significance of independent variables. Any significance established meant that the independent variables influenced the dependent variable; then, we specifically analyzed the direction of this influencing relationship; and (4) comparison and assessment of the degree of influence of independent variables on dependent variable, followed by summarizing the results.
The DKD1 group was set to group 0, and the DKD2 group was set to group 1. The data of the two groups were used as dependent variables, because the staging of clinical diagnosis of DKD was mainly based on urine ACR. Independent variables included P62, DM duration, SBP, FBG, LDL, HDL, ApoA1, ALB, ApoB, U-ALB, CHO, 24-h UTP, 24-h UTP/Cr, 24-h UAER, U-IgG, U-ALB/Cr, U-TP/Cr, U-NAG, U-Cr, IFTA, interstitial inflammation, and glomerular lesions. P62 and ApoA1 were included in the model after they were automatically recognized (Table 5). The model formula was as follows: group = −0.269 + 0.077 × P62 + 0.520 × ApoA1, and R2 was 0.397, which meant that changes in P62 and ApoA1 levels could explain 39.7% of the changes in the group. The model passed the F-test (F = 11.859, p = 0.000 < 0.05), indicating that the model was valid. The regression coefficient value of P62 was 0.077 (t = 3.911, p = 0.000 < 0.01), meaning that P62 had a significant positive effect on the influencing relationship among groups. The regression coefficient value of ApoA1 was 0.520 (t = 2.329, p = 0.026 < 0.05), which indicated that ApoA1 would have a significant positive effect on the group (Table 5). Hence, the results suggested that P62 and ApoA1 had significant positive effects on the progression of DKD, and could thus be used as independent variables in the regression model described later.
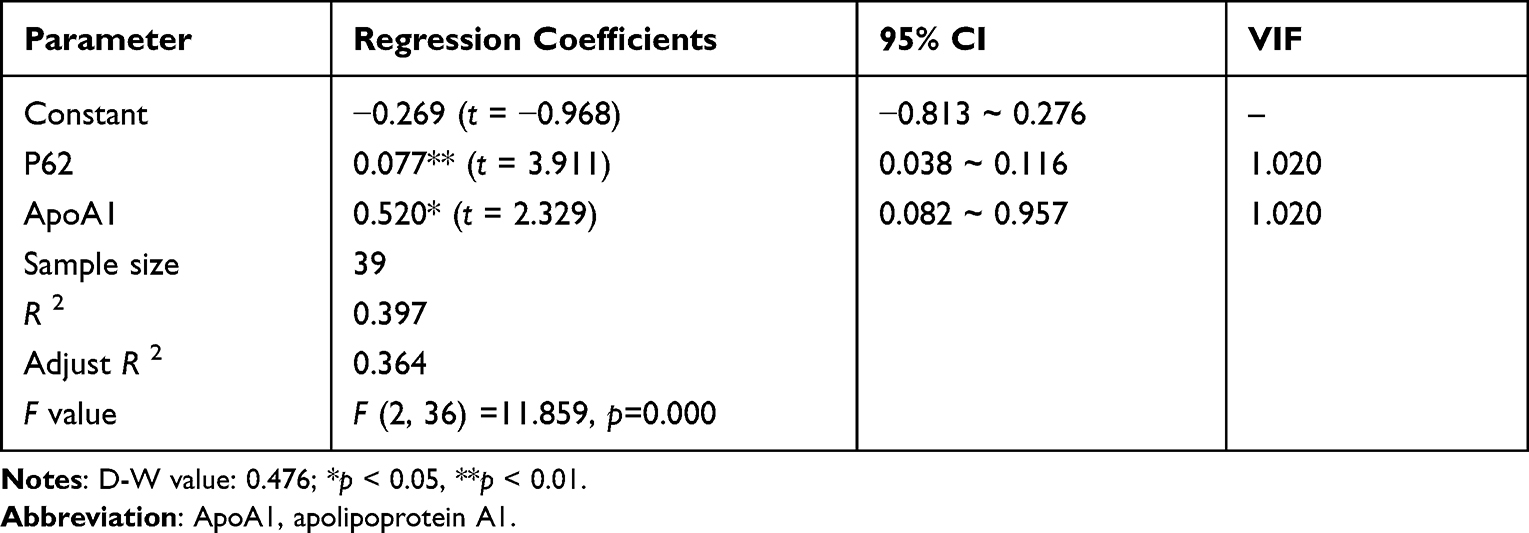 |
Table 5 Stepwise Regression Analysis |
Diagnostic Value of Glomerular P62 for the Progression of DKD
Establishment of a Regression Prediction Model
An unconditional binary logistic regression model was established, with DKD progression as the dependent variable, assigning 1 = progression (sample: DKD2 group) and 0 = no progression (sample: DKD1 group). P62 and ApoA1 were assigned as independent variables. The formula of the regression prediction model was as follows: ln (p/1-p) = −3.519 + 1.268 × P62 + 0.209 × ApoA1, where p represented the probability of the group was 1 and 1-p represented that the probability of the influence in the group was 0. The OR value of P62 was 3.554 (p = 0.027), suggesting that it had a significant positive/hazardous effect, while the OR of ApoA1 was 1.232 (p = 0.891). In summary, P62 was an independent risk factor for the progression of DKD (Table 6).
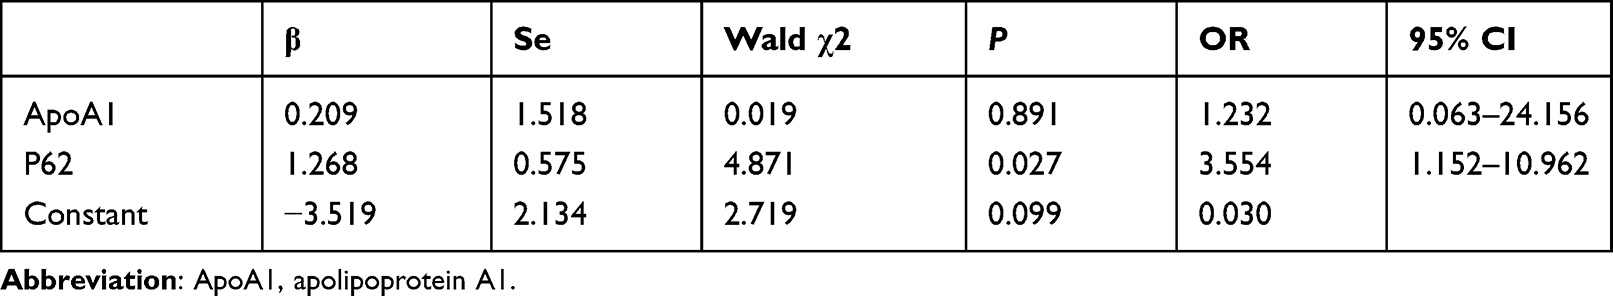 |
Table 6 Binary Logistic Regression Analysis |
ROC Analysis of the Diagnostic Value
To further explore the diagnostic value of glomerular P62 protein for DKD, we considered the kidneys from the DKD2 group as positive samples (n = 30), and those from the DKD1 group as negative samples (n = 13) to establish the ROC diagnostic model. The maximum point of the Youden index was determined from the ROC curve fitted by the software, and the theoretical threshold and the parameters of sensitivity, specificity, and accuracy were calculated accordingly based on sample measurements. The results showed that the AUC (0.95CI) was 0.905 (0.800–1.000). The ROC curve is displayed in Table 7 and Figure 4.
 |
Table 7 ROC Curve Analysis of P62 Protein on Glomerulus of DKD Patients |
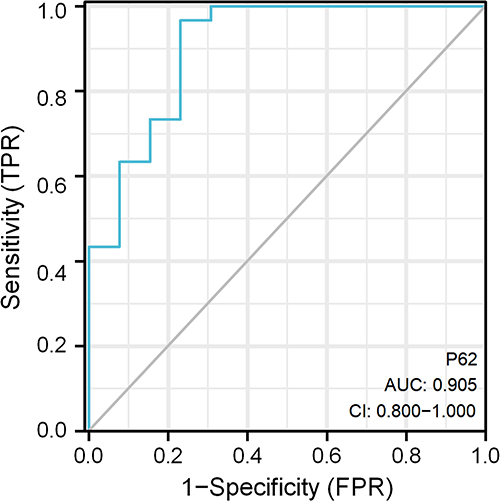 |
Figure 4 ROC curve analysis of glomerular P62 protein in DKD patients. |
Discussion
The clinical character of DKD is proteinuria, which is closely related to glomerular injury. However, the pathogenesis of DKD is complicated due to the participation of many factors. The death or survival is often the glomerular resident cell’s main outcome, which has been reported more frequently in animal and cell experiments, but less systematically in human tissues. Therefore, this study looked for the most significant signaling pathways in DKD related to cell survival or death in renal tissue by analyzing genomics, and further investigated the clinical value by observing the changes of corresponding markers in human renal tissue and combining with clinicopathological data.
In this study, we initially selected GSE30122 as the research subject for gene bioinformatics analysis. The advantage of this dataset included the available genetic sequencing results of isolated glomeruli, which more accurately reflected the glomerular genetic changes in DKD patients. The analysis of the data showed that a large number of glomerular autophagy-related genes were differentially expressed, suggesting that autophagy changes might be closely related to the occurrence and development of glomerular injury in DKD.
Autophagy was first detected by transmission electron microscopy (TEM) in the 1950s and was described as the process of maintaining intracellular homeostasis by degrading cytoplasmic components and organelles.6 Later, autophagy has been found to prevent further deterioration of human diseases by clearing damaged and senescent cells.7 For instance, cells can abolish redox damage by activating autophagy under oxidative stress,8 and reduced or excessively elevated autophagy activity may lead to autophagy inhibition, which is associated with aging and the development of degenerative and acute/chronic diseases.9
Autophagy has multiple steps,10 including initiation, nucleation, expansion, fusion, and degradation. Autophagy-related proteins (ATGs), which are composed of different complexes, coordinate their activities with membrane transport components in different processes of autophagosomes. Autophagy is established to be initiated by serine/threonine protein kinases ULK1 and ULK2 to form complexes with chaperones.11,12 Class III phosphoinositide 3-kinase (PI3K) complex regulates vesicle nucleation and phagocytic vesicle formation. On the other hand, the microtubule-associated protein 1 light chain 3 (MAP1LC3/LC3) system controls autophagosome expansion and final assembly.13 The analysis of changes in substrates degraded by autophagy, such as those involved in P62/Sequestosome 1 (SQSTM1) protein expression, can be used as markers for autophagic flux changes.14 Therefore, P62 protein expression changes in glomeruli were used to detect the changes in autophagy activity in this study.
DKD progression is closely related to metabolic changes in diabetes, including persistent hyperglycemia, damage caused by advanced glycation products, micro-inflammatory state, and fat and protein metabolism disorders, resulting in abnormal protein accumulation and organelle damage. Recent study evidence has confirmed that autophagy activity in podocytes and renal tubular epithelial cells is significantly inhibited in diabetes.15,16 Therefore, autophagy may be implicated in the unique pathogenesis of DKD and may thus serve as an important target for the treatment of diabetic nephropathy in the future. In this study, IHC staining of P62 showed that the P62 protein was expressed in both tubulointerstitium and glomeruli, and was most abundant in podocytes, indicating that inhibition of podocyte autophagy might be one of the main causes of podocyte damage in DKD with macroalbuminuria. Interestingly, autophagy inhibition in the DKD2 group was also statistically different from that in the MCD group, suggesting that glomerular autophagy inhibition of the MCD group was weaker than that of the DKD group with macroalbuminuria. This finding partly supported the hypothesis that alterations in glomerular autophagy in DKD might be disease-specific. However, it should be noted that further investigation is required to determine whether autophagy dynamics in MCD are the same as in DKD. In addition, the level of P62 protein in renal tubules was upregulated in both patients with DKD and MCD, suggesting the inhibition of autophagy activity in renal tubule epithelial cells might be not synchronized with those in glomerulus. The possible reasons for this phenomenon included long-term ischemia and hypoxia in renal tissues due to vascular lesions, increased proteinuria and inflammatory cytokines secreted by the activation of interstitial inflammatory cells. Since there was no difference between the DKD subgroups, this study focused on the evaluation of the change of glomerular autophagy activity in the progress of urinary protein.
A comparative analysis of the clinicopathological data of patients in the two subgroups of DKD (DKD1 group and DKD2 group) was performed. We found that the pathological blood, urine, and renal tissue changes were statistically different between the two DKD subgroups. The differences in blood biochemical indexes were predominantly related to lipid metabolism, which suggested that lipid metabolism disorders were accompanied by DKD. The urine excretion of various proteins was increased, including U-ALB, 24-h UTP, 24-h UTP/Cr, 24-h UAER, U-IgG, U-ALB/Cr, U-TP/Cr, and U-NAG, whereas the level of U-Cr was decreased, which also confirmed that the glomerular filtration barrier and renal tubular reabsorption were impaired. These results were consistent with the pathological findings of aggravated glomerular and tubulointerstitial damages. The aforementioned indicators with statistical differences may serve as markers for DKD progression.
The analysis of the correlation between P62 and the indicators with statistical differences also showed that P62 was positively correlated with multiple indicators, including CHO, LDL, ApoA1, ApoB, U-TRF, U-IgG, U-ALB/Cr, TP/Cr, glomerular lesions, and interstitial inflammation, but was negatively correlated with serum ALB and U-Cr in urine. These results suggested that autophagy in glomeruli might be an influencing factor for DKD progression. Then, the results of stepwise regression analysis revealed that the regression model only adopted P62 and apolipoprotein A1, which were then incorporated into the subsequent binary logistic regression equation to further analyze their impact on the progression of DKD. Binary logistic regression analysis showed that autophagy in glomeruli might be an independent risk factor for DKD. The AUC of P62 was calculated using ROC curve analysis, and the results suggested that the expression of P62 protein in glomeruli was the predictor of entering the stage of macroalbuminuria in DKD.
Admittedly, the study has limitations. It is necessary to further expand the sample size and conduct survival analysis to further evaluate the clinical value of autophagy in DKD. In addition, the further study is needed to explore the specific reasons why the inhibition of autophagy activity is not synchronized on the renal tubule and glomerulus in the progression of DKD.
Conclusions
In conclusion, autophagy inhibition occurred in both glomeruli and tubules, and was most pronounced in glomerular podocytes. The levels of P62 protein in glomeruli, as an autophagy activity indicator, were one of the predictors of entering the stage of macroalbuminuria in DKD.
Abbreviations
DKD, diabetic kidney disease; DEGs, differentially expressed genes; NC, normal control group; MCD, minimal change disease; ACR, albuminuria excretion rate; SD, standard deviation; AID, autoimmune disease; GO, gene ontology; KEGG, Kyoto Encyclopedia of Genes and Genomes; DM, diabetic mellitus; SBP, systolic blood pressure; DBP, diastolic blood pressure; BUN, blood urea nitrogen; UA, uric acid; eGFR, estimated glomerular filtration rate; FBG, fasting blood glucose; 24-hUTP, 24-h urine protein quantification; 24-hUAER, 24-h urinary albumin excretion; U-TRF, urinary transferrin; U-NAG, N-acetyl β-glucosaminidase; U-IgG, urinary IgG; U-ALB, urinary albumin; U-FDP, urinary fibrinogen; U-cyc, urinary cystatin C; U-β2-MG, urinary β2 microglobulin; U-α1-MG, urinary α1-microglobulin; IFTA, interstitial fibrosis and tubular atrophy; ANOVA, one-way analysis of variance; CHO, cholesterol; LDL, low-density lipoprotein; VLDL, very low density lipoprotein; HDL, high density lipoprotein; ApoB, apolipoprotein B; ApoA1, apolipoprotein A1; ALB, albumin; U-Cr, urinary creatinine; ROC, receiver operating characteristic; TEM, transmission electron microscopy; ATGs, autophagy-related proteins; PI3K, class III phosphoinositide 3-kinase; Ub, ubiquitin; MAP1LC3/LC3, microtubule-associated protein 1 light chain 3; SQSTM1, sequestosome 1.
Data Sharing Statement
All data in this paper are derived from published sources and are acknowledged or referenced accordingly.
Ethics Approval and Consent to Participate
This study was reviewed and approved by the Institutional Review Board of the First Affiliated Hospital of Anhui Medical University (Hefei, China, approval no.: 20190454). The patients provided their written informed consent to participate in this study.
Acknowledgments
The authors thank the Center for Scientific Research of Anhui Medical University for valuable help in our experiment.
Author Contributions
All authors made a significant contribution to the work reported, whether that is in the conception, study design, execution, acquisition of data, analysis and interpretation, or in all these areas; took part in drafting, revising or critically reviewing the article; gave final approval of the version to be published; have agreed on the journal to which the article has been submitted; and agree to be accountable for all aspects of the work.
Funding
There is no funding to report.
Disclosure
The authors declare no conflict of interest.
References
1. Zhang L, Long J, Jiang W, et al. Trends in chronic kidney disease in China. N Engl J Med. 2016;375(9):905–906. doi:10.1056/NEJMc1602469
2. Yin L, Yu L, He JC, Chen A. Controversies in podocyte loss: death or detachment? Front Cell Dev Biol. 2021;9:771931. doi:10.3389/fcell.2021.771931
3. Woroniecka KI, Park AS, Mohtat D, Thomas DB, Pullman JM, Susztak K. Transcriptome analysis of human diabetic kidney disease. Diabetes. 2011;60(9):2354–2369. doi:10.2337/db10-1181
4. American Diabetes, Association. Diagnosis and classification of diabetes mellitus. Diabetes Care. 2013;36 Suppl 1(Suppl1):S67–S74. doi:10.2337/dc13-S067
5. Tervaert TW, Mooyaart AL, Amann K, et al. Pathologic classification of diabetic nephropathy. J Am Soc Nephrol. 2010;21(4):556–563.2. doi:10.1681/ASN.2010010010
6. Tang C, Livingston MJ, Liu Z, Dong Z. Autophagy in kidney homeostasis and disease. Nat Rev Nephrol. 2020;16(9):489–508. doi:10.1038/s41581-020-0309-2
7. Yamano K, Fogel AI, Wang C, van der Bliek AM, Youle RJ. Mitochondrial Rab GAPs govern autophagosome biogenesis during mitophagy. Elife. 2014;3:e01612. doi:10.7554/eLife.01612
8. Lee J, Giordano S, Zhang J. Autophagy, mitochondria and oxidative stress: cross-talk and redox signalling. Biochem J. 2012;441(2):523–540. doi:10.1042/BJ20111451
9. Kaarniranta K, Sinha D, Blasiak J, et al. Autophagy and heterophagy dysregulation leads to retinal pigment epithelium dysfunction and development of age-related macular degeneration. Autophagy. 2013;9(7):973–984. doi:10.4161/auto.24546
10. Dikic I, Elazar Z. Mechanism and medical implications of mammalian autophagy. Nat Rev Mol Cell Biol. 2018;19(6):349–364. doi:10.1038/s41580-018-0003-4
11. Park JM, Jung CH, Seo M, et al. The ULK1 complex mediates MTORC1 signaling to the autophagy initiation machinery via binding and phosphorylating ATG14. Autophagy. 2016;12(3):547–564. doi:10.1080/15548627.2016.1140293
12. Park JM, Seo M, Jung CH, et al. ULK1 phosphorylates Ser30 of BECN1 in association with ATG14 to stimulate autophagy induction. Autophagy. 2018;14(4):584–597. doi:10.1080/15548627.2017.1422851
13. Walczak M, Martens S. Dissecting the role of the Atg12-Atg5-Atg16 complex during autophagosome formation. Autophagy. 2013;9(3):424–425. doi:10.4161/auto.22931
14. Klionsky DJ, Abdel-Aziz AK, Abdelfatah S, et al. Guidelines for the use and interpretation of assays for monitoring autophagy (4th edition) 1. Autophagy. 2021;17(1):1–382. doi:10.1080/15548627.2020.1797280
15. Liu N, Xu L, Shi Y, Zhuang S. Podocyte autophagy: a potential therapeutic target to prevent the progression of diabetic nephropathy. J Diabetes Res. 2017;2017:3560238. doi:10.1155/2017/3560238
16. Lv L, Zhang J, Tian F, Li X, Li D, Yu X. Arbutin protects HK-2 cells against high glucose-induced apoptosis and autophagy by up-regulating microRNA-27a. Artif Cells Nanomed Biotechnol. 2019;47(1):2940–2947. doi:10.1080/21691401.2019.1640231
 © 2022 The Author(s). This work is published and licensed by Dove Medical Press Limited. The full terms of this license are available at https://www.dovepress.com/terms.php and incorporate the Creative Commons Attribution - Non Commercial (unported, v3.0) License.
By accessing the work you hereby accept the Terms. Non-commercial uses of the work are permitted without any further permission from Dove Medical Press Limited, provided the work is properly attributed. For permission for commercial use of this work, please see paragraphs 4.2 and 5 of our Terms.
© 2022 The Author(s). This work is published and licensed by Dove Medical Press Limited. The full terms of this license are available at https://www.dovepress.com/terms.php and incorporate the Creative Commons Attribution - Non Commercial (unported, v3.0) License.
By accessing the work you hereby accept the Terms. Non-commercial uses of the work are permitted without any further permission from Dove Medical Press Limited, provided the work is properly attributed. For permission for commercial use of this work, please see paragraphs 4.2 and 5 of our Terms.