")
Back to Journals » Cancer Management and Research » Volume 10
Clinical significance and effect of MTDH/AEG-1 in bladder urothelial cancer: a study based on immunohistochemistry, RNA-seq, and in vitro verification
Authors Zhang Y, Zhang LJ, Dang YW , Li SH, Yan HB , Chen G
Received 11 June 2018
Accepted for publication 27 July 2018
Published 14 December 2018 Volume 2018:10 Pages 6921—6936
DOI https://doi.org/10.2147/CMAR.S176887
Checked for plagiarism Yes
Review by Single anonymous peer review
Peer reviewer comments 2
Editor who approved publication: Dr Kenan Onel
Yu Zhang, 1,* Li-jie Zhang, 1,* Yi-wu Dang, 1 Sheng-hua Li, 2 Hai-biao Yan, 2 Gang Chen 1
1Department of Pathology, First Affiliated Hospital of Guangxi Medical University, Nanning, Guangxi Zhuang Autonomous Region 530021, China; 2Urology, First Affiliated Hospital of Guangxi Medical University, Nanning, Guangxi Zhuang Autonomous Region 530021, China
*These authors contributed equally to this work
Background: Overexpression of metadherin/astrocyte elevated gene-1 (MTDH/AEG-1) has been implicated in various cancers. However, the clinical significance and the potential biological functions of MTDH/AEG-1 in bladder urothelial carcinoma (BUC) are not established.
Methods: In this study, the expression of MTDH/AEG-1in BUC was measured using the Cancer Genome Atlas (TCGA) database and immunohistochemistry, together with a meta-analysis, to investigate the expression and diagnostic value of MTDH/AEG-1. The possible association between MTDH/AEG-1 expression and the viability, proliferation, and apoptosis in BUC cell lines (T24, HT1376, and RT4) was also assessed in vitro by viability, MTS, colony formation, and caspase-3/7 assays, as well as Hoechst 33342 and propidium iodide (PI) double staining.
Results: MTDH/AEG-1 expression was significantly higher in BUC tissues than in normal bladder tissues, according to the TCGA and immunohistochemistry results, and these findings were verified by the meta-analysis. Functional knockdown of MTDH/AEG-1 suppressed BUC cell growth and induced apoptosis. Bioinformatics analyses indicated an involvement of MTDH/AEG-1 in several processes, including RNA binding, protein transport, intracellular transport, and the insulin signaling pathway.
Conclusion: We hypothesize that MTDH/AEG-1 could play essential roles in BUC, especially in cell growth and apoptosis, via the insulin signaling pathway.”
Keywords: MTDH, AEG-1, bladder urothelial cancer, meta-analysis
This paper has been retracted.
Introduction
Bladder cancer (BC) is one of the most aggressive urological malignancies, with an incidence of 79,030 cases and 16,870 deaths in the United States in 2017.1–4 Bladder urothelial carcinoma (BUC), the most common type of BC, is generally diagnosed at an advanced stage, leading to poor prognosis.5,6 Hence, investigation and development of the underlying biological mechanisms that promote BUC tumorigenesis is a vital clinical research area.
One feature of interest in BUC is its apparent association with metadherin/astrocyte elevated gene-1 (MTDH/AEG-1), also known as Lyric (lysine-rich CEACAM1). MTDH/AEG-1 was initially identified in human fetal astrocytes, where it was induced by human immunodeficiency virus 1 infection.7 MTDH/AEG-1 is involved in the tumorigenesis and progression of multiple cancers, including lung cancer, colon cancer, and glioblastoma,8–11 and has a known association with cancer proliferation, migration, and invasion.9,12,13 A few studies have also reported a relationship between MTDH/AEG-1 and BUC, as MTDH/AEG-1 is upregulated in BUC and high expression of MTDH/AEG-1 shows a relationship with poor prognosis.14–16 However, the exact functions of MTDH/AEG-1 and its mechanism of action in BUC are unclear.
The aim of the present study was to survey MTDH/AEG-1 expression and its clinicopathological significance in BUC tissues, as well as to examine the in vitro effects of this expression on cell viability, proliferation, and apoptosis in BUC cells. Original data from The Cancer Genome Atlas (TCGA), Gene Expression Omnibus (GEO), and ArrayExpress were also extracted for use in a meta-analysis to investigate the relationship between MTDH/AEG-1 expression and BUC. A further survey was conducted using the Gene Ontology (GO), Kyoto Encyclopedia of Genes and Genomes (KEGG), and network analyses to explore the underlying functions and pathways of the genes that are co-expressed with MTDH/AEG-1 in BUC.
Materials and methods
Investigation of the expression of MTDH/AEG-1 in BUC based on TCGA, GEO, and ArrayExpress databases
TCGA (http://cancergenome.nih.gov/), a database of expression profiles of more than 30 kinds of cancers, including gastric, lung, and ovarian cancers,17–20 is useful for investigating complicated clinicopathological parameters.21,22 In the current study, the RNA-Seq data of BUC patients, obtained from an Illumina HiSeq RNA-Seq platform, comprised collected data from 414 BUC cases and 19 normal bladder cases up to December 10, 2017. The relationship between MTDH/AEG-1 and the clinicopathological features in BUC was further analyzed with Student’s t-test. A receiver operating characteristic (ROC) curve was then applied to measure the diagnostic value of MTDH/AEG-1.
The data sets from GEO (http://www.ncbi.nlm.nih.gov/geo/) and ArrayExpress (http://www.ebi.ac.uk/arrayexpress/) were also researched using the keywords (bladder OR urothelial) AND (cancer OR carcinoma OR tumor OR neoplas* OR malignan*).
Study design for clinical samples
A tissue microarray containing 166 BUC and 56 normal bladder tissues was constructed for this study. All cases were diagnosed at the First Affiliated Hospital of Guangxi Medical University, China, from January 2003 to October 2006, and tissues were collected randomly from surgical resections without treatment. The study protocol was approved by the Ethical Committee of the First Affiliated Hospital of Guangxi Medical University, and the patients provided written informed consent for the use of the tissues in the study. The mean age was 61.62 years for the BUC cases and 52.43 years for the normal bladder cases. Histological sections were stained with hematoxylin and eosin (H&E) and were used to estimate the histological grade and pathologic stage.23,24 The 56 normal controls were removed from normal bladder tissues adjacent to neoplastic lesions and were confirmed from the H&E-stained slides as normal bladder tissues without cancer cells. The invasive stages of BUC were divided into two groups: low-stage non-muscle invasive (Ta–T1) and high-stage muscle invasive (T2–T4) tumors. The tumor size, lymph node metastasis, and distant metastasis were also determined.
Immunohistochemistry
All tissues were analyzed using a rabbit MTDH/AEG-1 antibody and monoclonal antibodies against Decoy receptor 3 (DcR3), caspase-3, Bcl-2, vascular endothelial growth factor (VEGF), Ki-67, proliferating cell nuclear antigen (PCNA), and p53 (Beijing Zhongshan Jinqiao Inc., Beijing, China). A standard avidin-biotin immunoperoxidase complex detection system (Beijing Zhongshan Jinqiao Inc.) was used, as previously described.25–28 Three independent pathologists evaluated the staining intensity and recorded the numbers of positive cells after immunohistochemistry. The staining intensity was scored as follows: negative (−), weakly positive (+), moderately positive (++), and strongly positive (+++). The scores of (+), (++), and (+++) were designated as positive expression. The labeling indexes (LIs) for Ki-67, PCNA, and p53 were determined using the formula (number of positive cells/total number of the cells × 100%) by recording at least ten random representative fields (distant from the necrotic areas).25–28
MTDH/AEG-1 and BUC: a meta-analysis
The BUC-related MTDH/AEG-1 microarray and RNA-seq data sets were downloaded from TCGA, GEO, and ArrayExpress. Publications related to the expression of MTDH/AEG-1 in BUC were also searched from PubMed, Google Scholar, Web of Science, EMBASE, Wiley Online Library, Ovid, Science Direct, Cochrane Central Register of Controlled Trials, Chong Qing VIP, LILACS, Chinese CNKI, the China Biology Medicine disc, and Wan Fang. Literature retrieval was performed independently by two investigators. The numbers of true positives (tp), true negatives (tn), false positives (fp), and false negatives (fn) were extracted.
Cell culture and transfection with MTDH/AEG-1 siRNA
The T24, HT1376, and RT4 cell lines were bought from the American Type Culture Collection (ATCC, Manassas, VA, USA). All cells were cultivated in Dulbecco’s modified essential medium (DMEM; Thermo Fisher Scientific, Waltham, MA, USA) complemented with 10% heat-inactivated fetal bovine serum (Thermo Fisher Scientific), 2 mM glutamine, and gentamicin and incubated at 37°C in 5% CO2 in a humidified incubator. Four siRNA plasmids (GenePharma, Shanghai, China) were merged into one siRNA pool (see Table 1 for the sequences of the siRNA plasmids). Four groups were designed: mock control, blank control, negative siRNA-transfected, and siRNA-transfected. The blank control groups were treated only with transfection reagent. A negative siRNA (con77; GenePharma) was added for transfection of the negative siRNA groups. Transfections were carried out using LipoFiterTM (Hanbio, Shanghai, China) following the manufacturer’s instructions. Stable cell lines after transfection were selected by incubating with puromycin (2 µg/mL) for 24 hours.
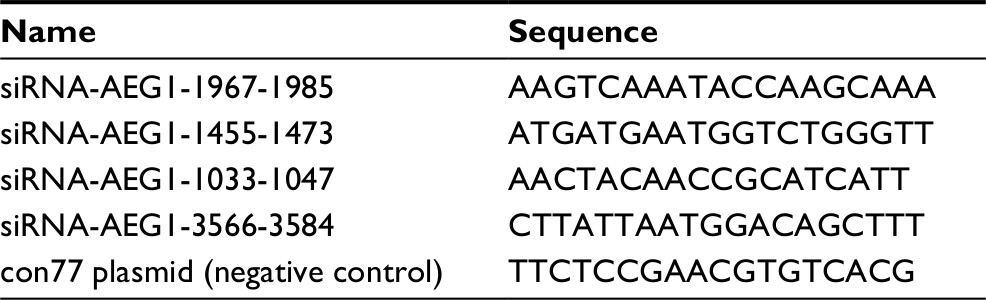 | Table 1 Sequences of MTDH/AEG-1 siRNA Abbreviations: MTDH, metadherin; AEG-1, astrocyte elevated gene-1. |
Cell viability
Fluorimetric detection of resorufin (CellTiter-Blue Cell Viability Assay, G8080; Promega Corporation, Fitchburg, WI, USA) was used to determine cell viability, as described previously.29 A FL600 fluorescence plate reader (Bio-Tek, Winooski, VT, USA) was used for fluorimetry (ex: 560 nm/em: 590 nm).
Cell proliferation
Cell viability was further confirmed using a colorimetric tetrazolium (MTS) assay (CellTiter96 AQueous One Solution Cell Proliferation Assay G3580; Promega Corporation). BUC cells (2.5×10³/well) were seeded into 96-well plates and transfected daily for 0, 48, and 96 hours. The MTS reagents were added, and the plates were cultured at 37°C for 2 hours. The absorbance at 490 nm was determined using a 96-well microplate reader (Scientific Multiskan MK3; Thermo Fisher Scientific, Waltham, MA, USA).29
Cell proliferation was determined with a colony formation assay, as previously reported.30,31 The BUC cells (500/well) were seeded into six-well plates 3 days after siRNA infection. The medium was changed at 3-day intervals. After culturing for 7 days at 37°C, cells were washed with PBS and fixed with 4% paraformaldehyde at room temperature. The number of colonies was counted by light or fluorescence microscopy, as appropriate.32
Cell caspase-3/7 activity
Caspase-3/7 activity was evaluated immediately after the cell viability determination in the same wells using a synthetic rhodamine-labeled caspase-3/7 substrate (Apo-ONE® Homogeneous Caspase-3/7 Assay, G7790; Promega Corporation). After 60 minutes of cultivation at the room temperature, the fluorescence was measured (ex: 499 nm/em: 512 nm) with an FL600 fluorescence plate reader (Bio-Tek). Caspase-3/7 activity was calculated as the fluorescence readings of the treated group/mock control ×100.33
Cell apoptosis
The effects of MTDH/AEG-1 siRNA on apoptosis and morphology in three cell lines (T24, RT4, and HT1376) were measured using Hoechst 33342 (Sigma-Aldrich Co., St Louis, MO, USA) and propidium iodide (PI; Sigma-Aldrich) with double fluorescent chromatin staining. Briefly, after treatment with siRNA, cells were washed with ice-cold PBS, stained for 15 minutes with Hoechst 33342 (1 mg/mL) and PI (1 mg/mL), and then observed under a fluorescence microscope (ZEISS Axiovert 25, Zaventem, Belgium). Apoptosis was recognized by the condensation and fragmentation of nuclear chromatin. The results were determined by measuring the signals from the absolute number of viable cells (Hoechst 33342 positive/PI negative), necrotic cells (PI positive), early apoptotic cells (Hoechst 33342 positive/PI negative, blue fragmentations), late apoptotic cells (Hoechst 33342 positive/PI positive, red fragmentations), and debris. Apoptotic cells were counted in ten different fields under 200× magnification by two independent experimenters.
The potential pathways associated with MTDH/AEG-1
The possible functions and pathways of the genes co-expressed with MTDH/AEG-1 were explored using an open-access resource, Multi Experiment Matrix (MEM, http://biit.cs.ut.ee/mem/index.cgi), and the Affymetrix Gene Chip Human Genome U133 Plus 2.0 Array platform.34 The co-expressed genes indicated by cBioPortal (http://www.cbioportal.org/) were also selected. GO, KEGG, and network analyses were then used to survey the underlying functions and pathways of the co-expressed genes in BUC.35 In this process, the GO and KEGG analyses were conducted using the Database for Annotation, Visualization and Integrated Discovery (DAVID; http://david.abcc.ncifcrf.gov/). The overlapped co-expressed genes were identified using Venn diagrams (http://bioinformatics.psb.ugent.be/webtools/Venn/). A functional network was constructed using Cytoscape (version 3.0, http://cytoscape.org).
Statistical analysis
Statistical analysis was performed using SPSS22.0 software. The expression data in TCGA were log2 transformed. The differences in MTDH/AEG-1 expression between BUC and non-cancer tissues and the clinicopathological parameters were determined using Student’s t-test. Via immunohistochemistry, the Pearson’s χ2 test was used to assess possible correlations between MTDH/AEG-1 and clinicopathological factors. Spearman test was used to evaluate the relationship between MTDH/AEG-1 expression and other markers (DcR3, caspase-3, Bcl-2, VEGF, Ki-67, PCNA, and P53). The Kaplan-Meier and log-rank tests were applied for the survival analysis. A value of P<0.05 (two-sided) was considered statistically significant. All experiments were repeated three times.
STATA 14.0 software (StataCorp LP, College Station, TX, USA) was used for the meta-analysis. Heterogeneity was assessed by the Q and I2 tests, where I2 >50% or P<0.05 was considered significantly heterogeneous. Publication bias was detected by funnel plots and Begg’s rank regression test. A value of P<0.05 was considered to indicate significant publication bias. A continuous variable meta-analysis was also conducted, again using STATA 14.0 software. The potential diagnostic performance of MTDH/AEG-1 in BUC was evaluated using a summary receiver operating characteristic (SROC) curves to calculate the area under the curve (AUC) with 95% CIs.
Results
The expression of MTDH/AEG-1 based on TCGA, GEO, and ArrayExpress
Our investigation of MTDH/AEG-1 expression in BUC using the original data in TCGA revealed higher expression in BUC than in non-cancerous bladder tissues (P<0.001, Figure 1A). Further analysis of MTDH/AEG-1 expression in non-papillary and papillary BUC revealed higher MTDH/AEG-1 expression in non-papillary BUC tissues than in papillary BUC tissues (4.345±0.037 vs 4.090±0.070, P=0.0015). A further exploration of the relationship between MTDH/AEG-1 and the clinicopathological parameters of BUC revealed that higher MTDH/AEG-1 expression was related to age, race, tumor stage, clinical stage, and pathological grade (all P<0.05, Figure 1B–F, Table 2). We also found a value for the AUC for MTDH/AEG-1 of 0.625 (95%CI 0.550–0.699), which indicated a moderate diagnostic value of MTDH/AEG-1 expression for BUC (P=0.066, Figure 1G). No obvious associations were found between MTDH/AEG-1 expression and other clinicopathological features of BUC.
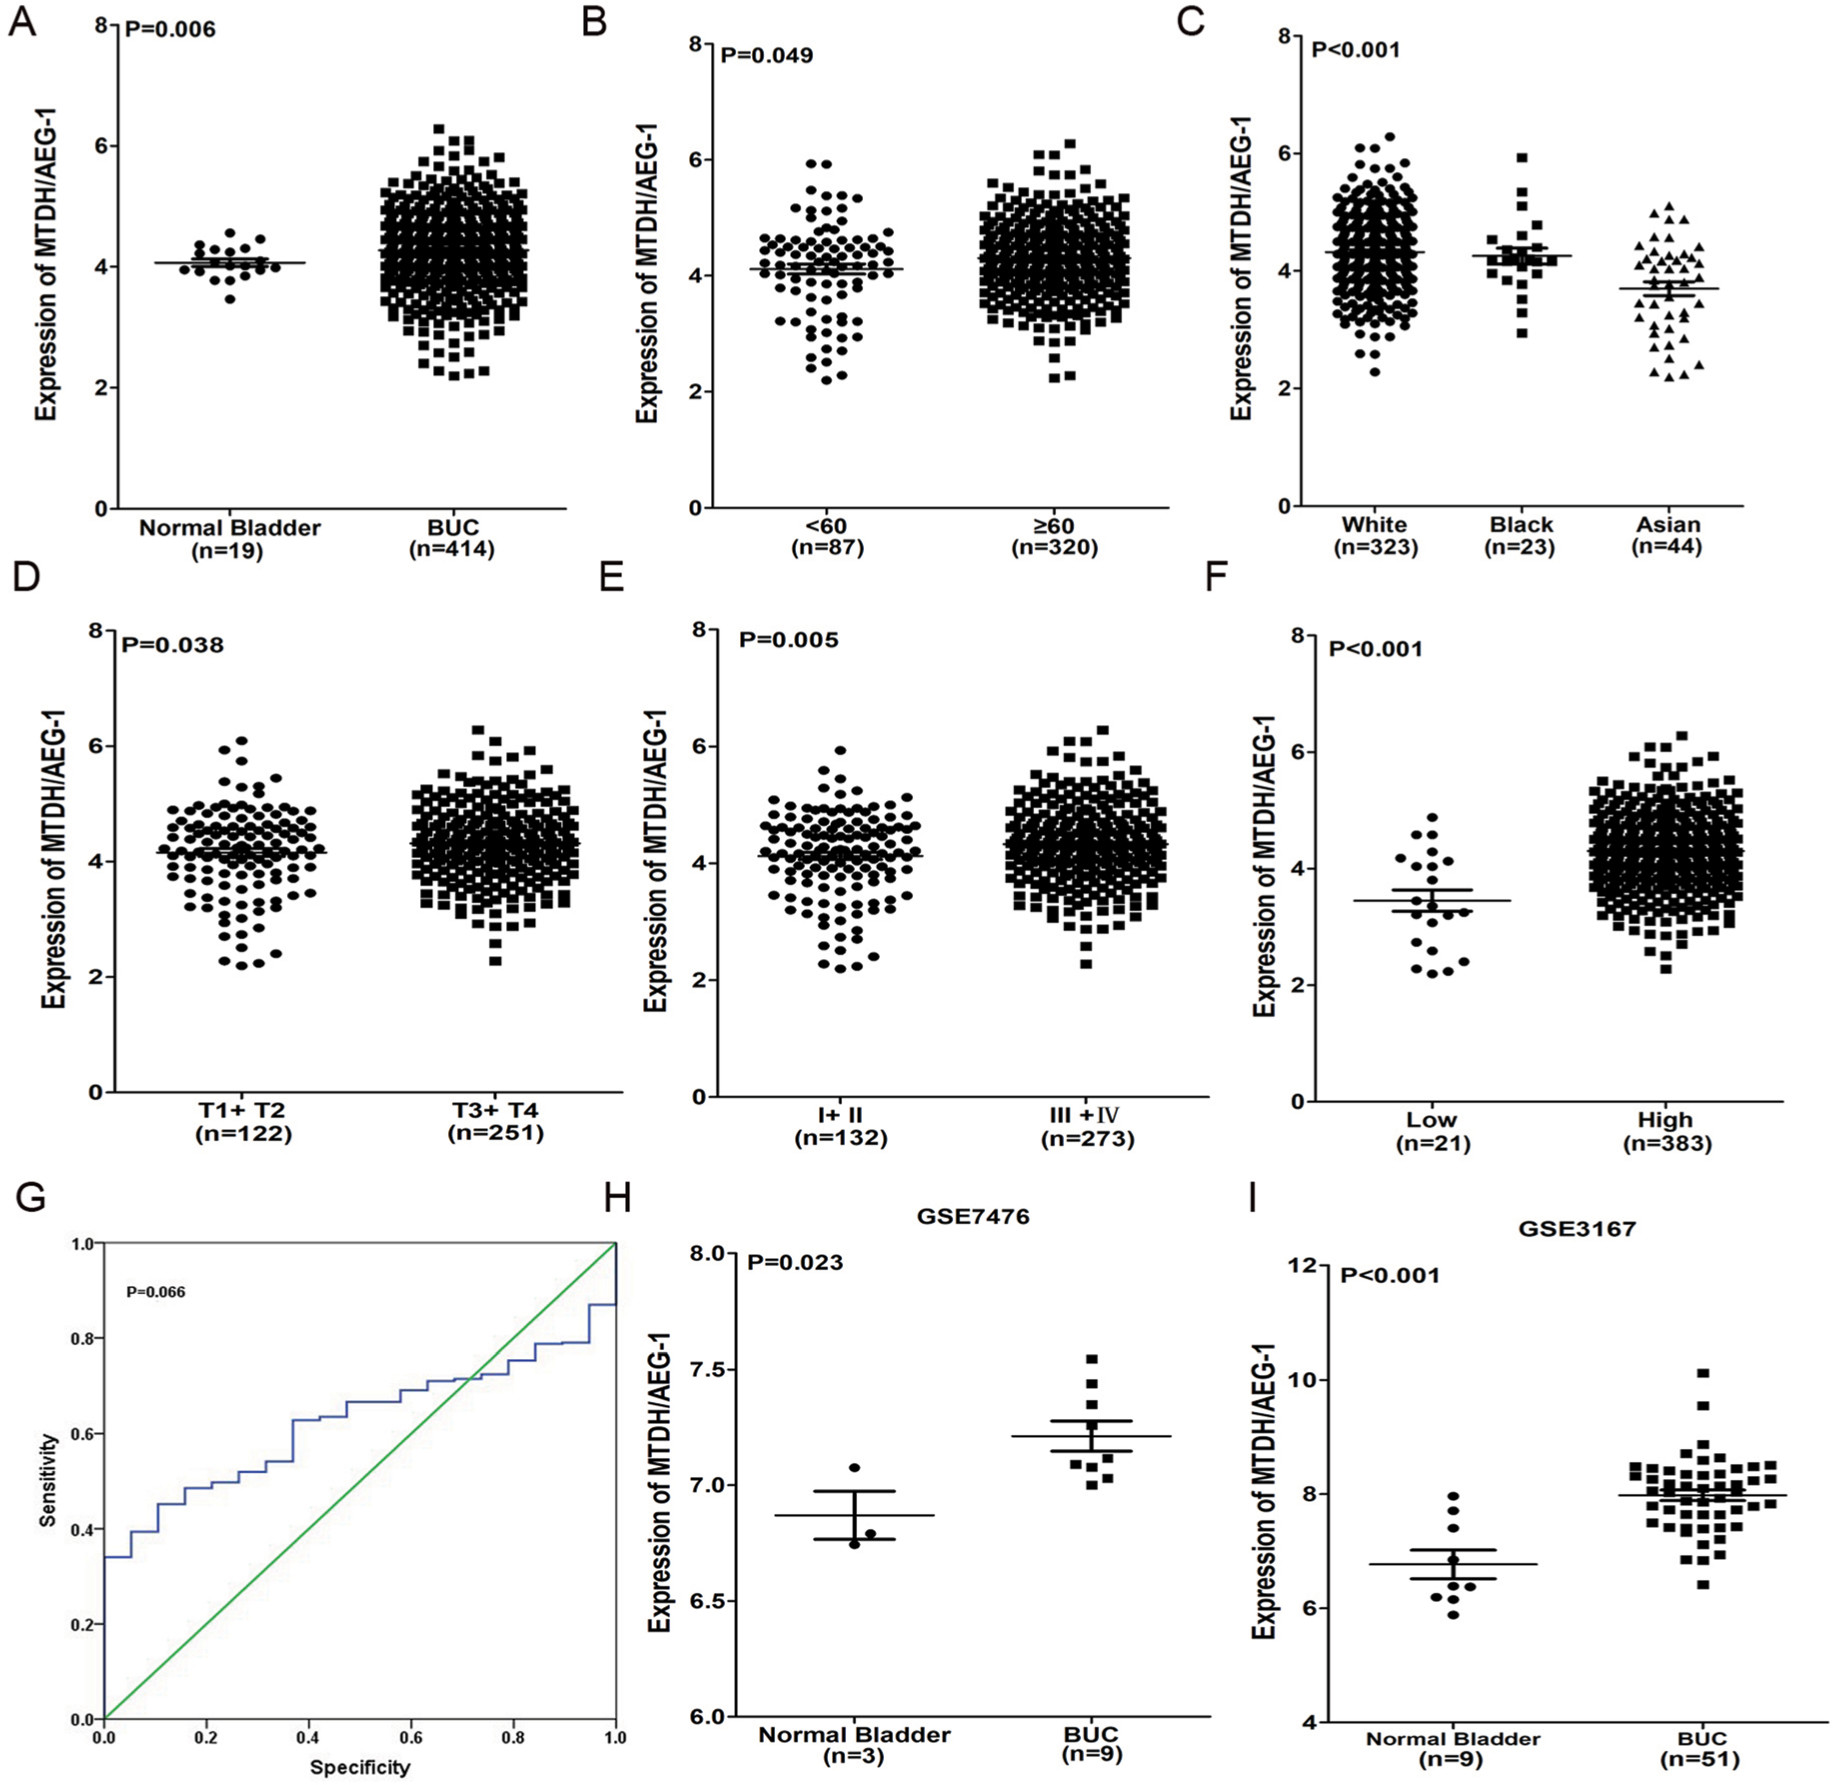 | Figure 1 Clinical significance of MTDH/AEG-1 in BUC based on TCGA and the GEO database. Notes: (A) Differential expression of MTDH/AEG-1 between BUC and non-cancerous bladder tissue based on TCGA. (B) Differential expression of MTDH/AEG-1 in <60 vs ≥60. (C) Differential expression of MTDH/AEG-1 in white vs black vs Asian populations. (D) Differential expression of MTDH/AEG-1 in tumor stage T1+T2 vs T3+T4. (E) Differential expression of MTDH/AEG-1 in stage I+II vs III+IV. (F) Differential expression of MTDH/AEG-1 in grade low vs high. (G) ROC curve for MTDH/AEG-1 in BUC based on TCGA. (H) Differential expression of MTDH/AEG-1 between BUC and non-cancerous bladder tissue based on GSE7476. (I) Differential expression of MTDH/AEG-1 between BUC and non-cancerous bladder tissue based on GSE3167. Abbreviations: MTDH, metadherin; AEG-1, astrocyte elevated gene-1; BUC, bladder urothelial carcinoma; TCGA, The Cancer Genome Atlas; GEO, Gene Expression Omnibus; ROC, receiver operating characteristic. |
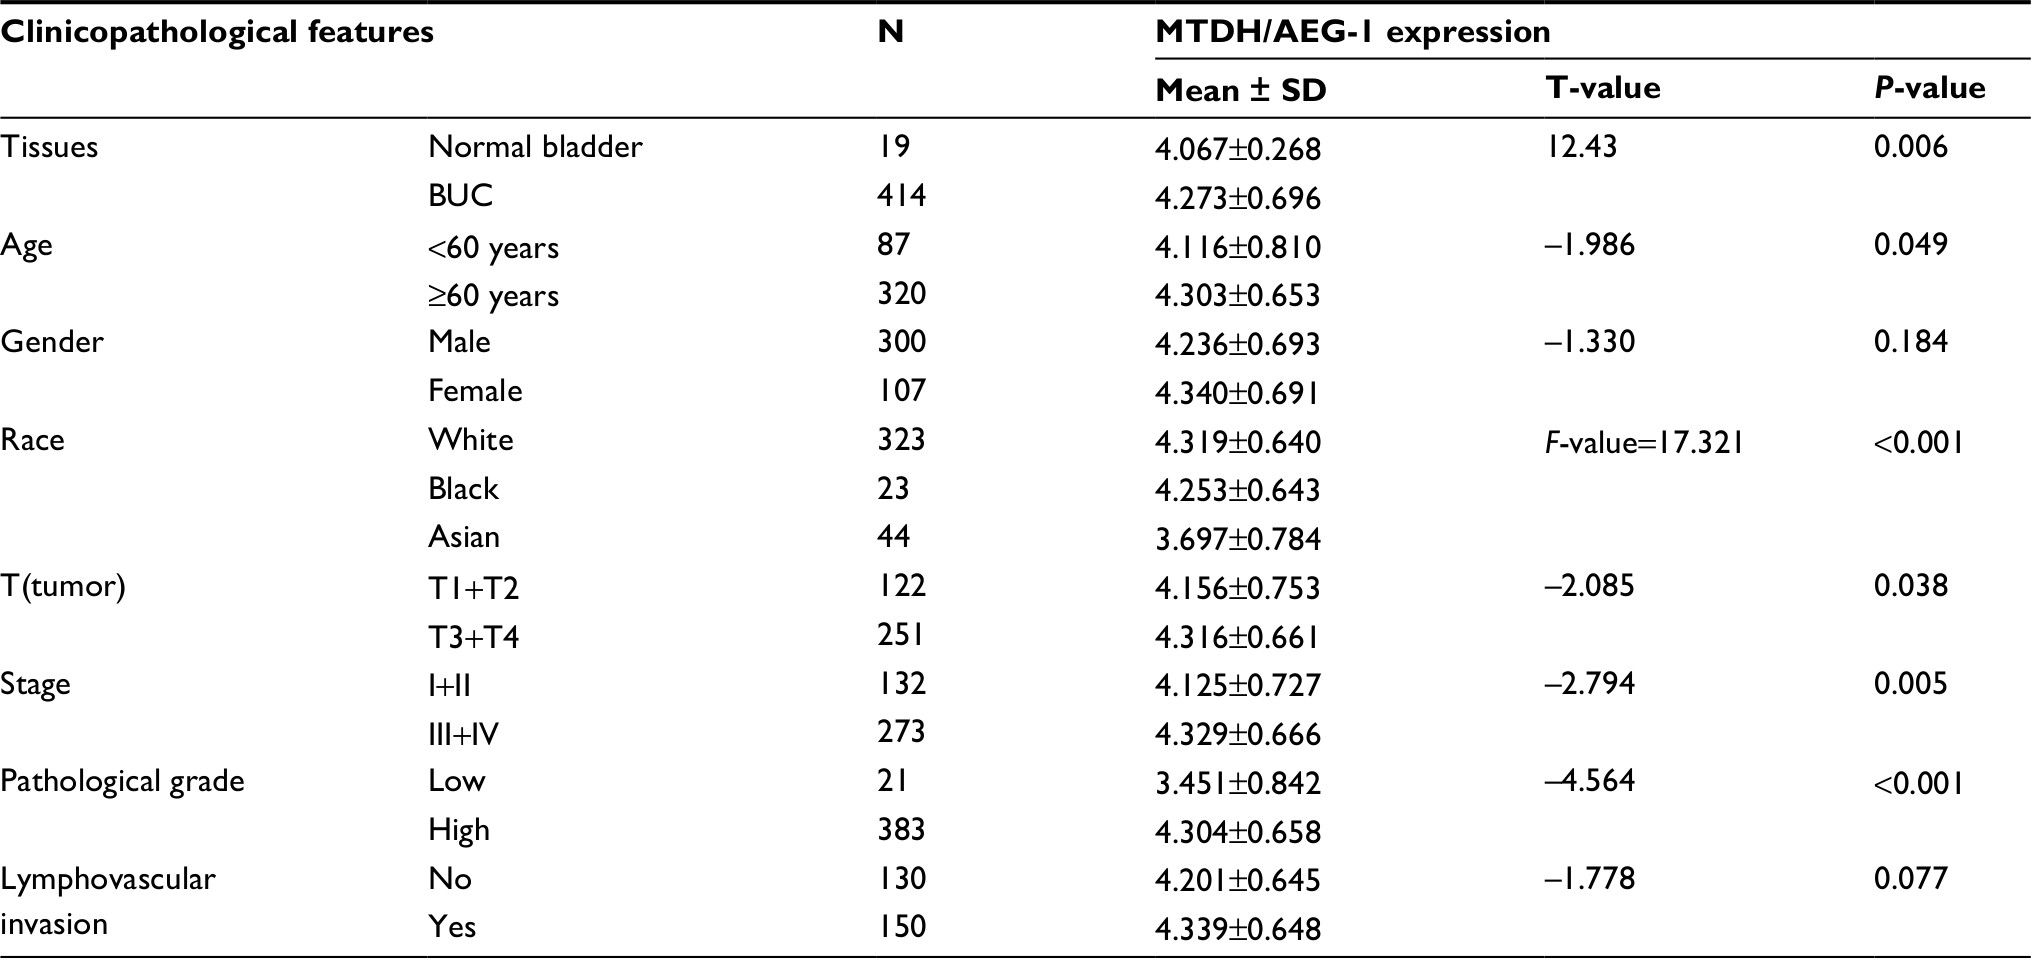 | Table 2 Differential expression of MTDH/AEG-1 in BUC and other clinicopathological parameters based on TCGA Abbreviations: MTDH, metadherin; AEG-1, astrocyte elevated gene-1; BUC, bladder urothelial carcinoma; TCGA, The Cancer Genome Atlas. |
We selected 13 clip datasets (GSE30522, GSE76211, GSE65635, GSE38264, GSE52519, GSE40355, GSE37815, GSE31189, GSE24152, GSE13507, GSE7476, GSE3167, and E-MTAB-1940) to measure the expression of MTDH/AEG-1 according to GEO and ArrayExpress. Comparison of MTDH/AEG-1 expression in BUC and normal bladder using Student’s t-test indicated a clear upregulation of MTDH/AEG-1 expression in BUC in GSE7476 and GSE3167 (Figure 1H and I), whereas no obvious associations were evident in the other datasets.
The expression of MTDH/AEG-1 based on immunohistochemistry
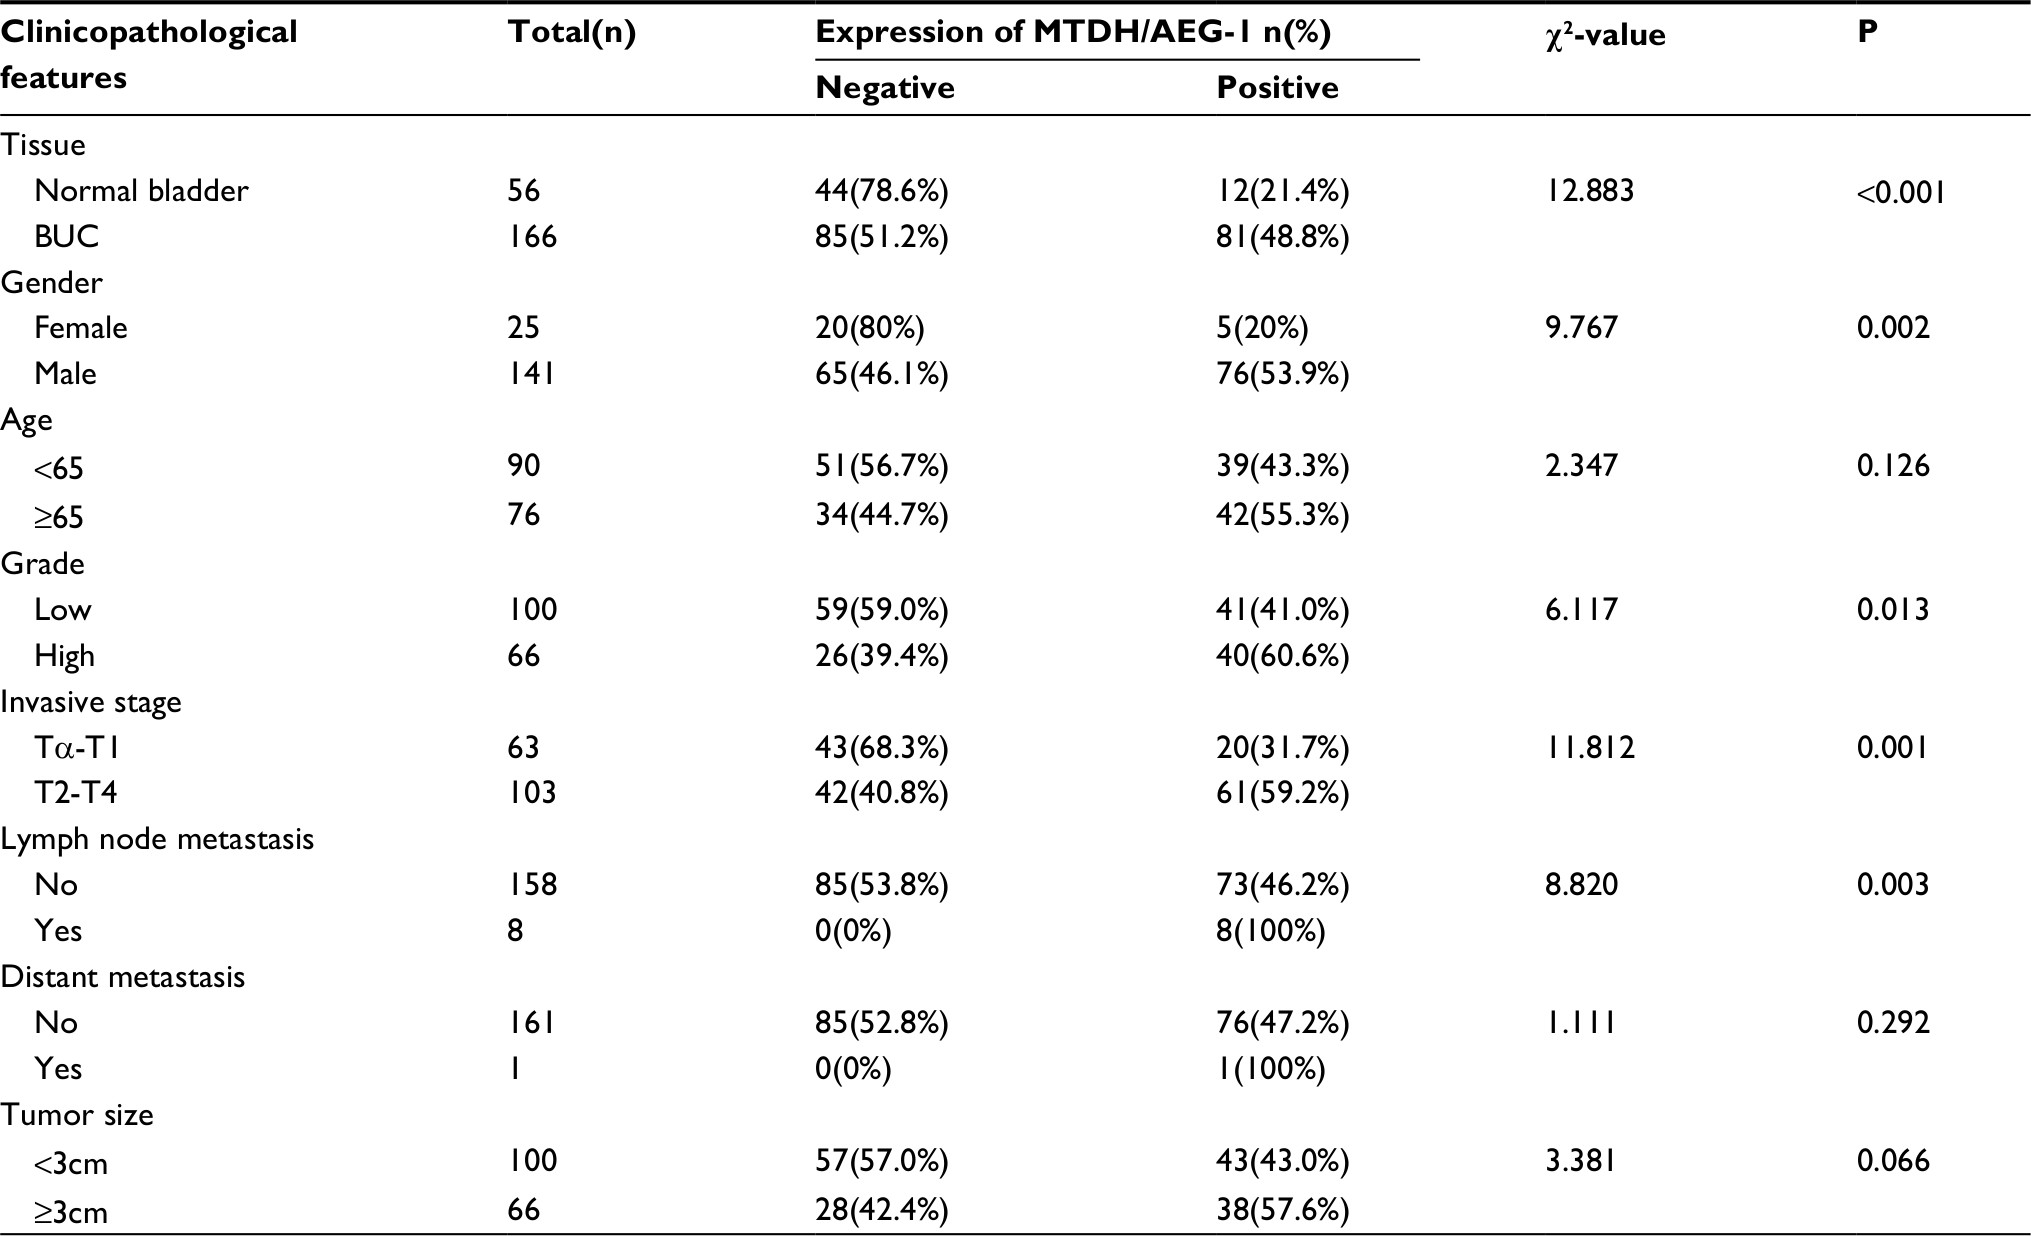
The immunohistochemistry results indicated positive signaling of MTDH/AEG-1 in the cytoplasm and cell nucleus (Figure 2), whereas DcR3, caspase-3, Bcl-2, and VEGF were located in the cytoplasm, and Ki-67, PCNA, and p53 had a nuclear location. Based on the histological types, adenocarcinoma (AD) and squamous cell carcinoma (SCC) were included in our study population, and 42 patients with AD and 16 patients with SCC were identified. Investigation of the relationships between MTDH/AEG-1 expression and these histological types revealed positive MTDH/AEG-1 expression in 26 patients with AD (61.9%) and eleven patients with SCC (68.8%, P=0.628). No significant relationships were noted between MTDH/AEG-1 expression and these histological types. Positive MTDH/AEG-1 expression was also found in 81 of the 166 patients with BUC (48.8%), and this expression was significantly higher than that observed in non-cancerous bladder tissues (21.4%, 12/56, P<0.001, Figure 3). A higher MTDH/AEG-1 expression was also observed in male patients (53.9%, 76/141, P=0.002) or those with high grade differentiation (60.6%, 40/66, P=0.014), invasive stage T2–T4 (59.2%, 61/103, P=0.001), or lymph node metastasis (100%, P=0.003, Figure 3, Table 3). The AUC of MTDH/AEG-1 was 0.637 (95%CI 0.556–0.717), indicating a moderate diagnostic value for MTDH/AEG-1 level in BUC (P=0.002, Figure 4A). Survival was significantly longer for the MTDH/AEG-1-negative group than for the positive group (38.36±1.12 vs 29.15±1.79 months, P=0.014, Figure 4B).
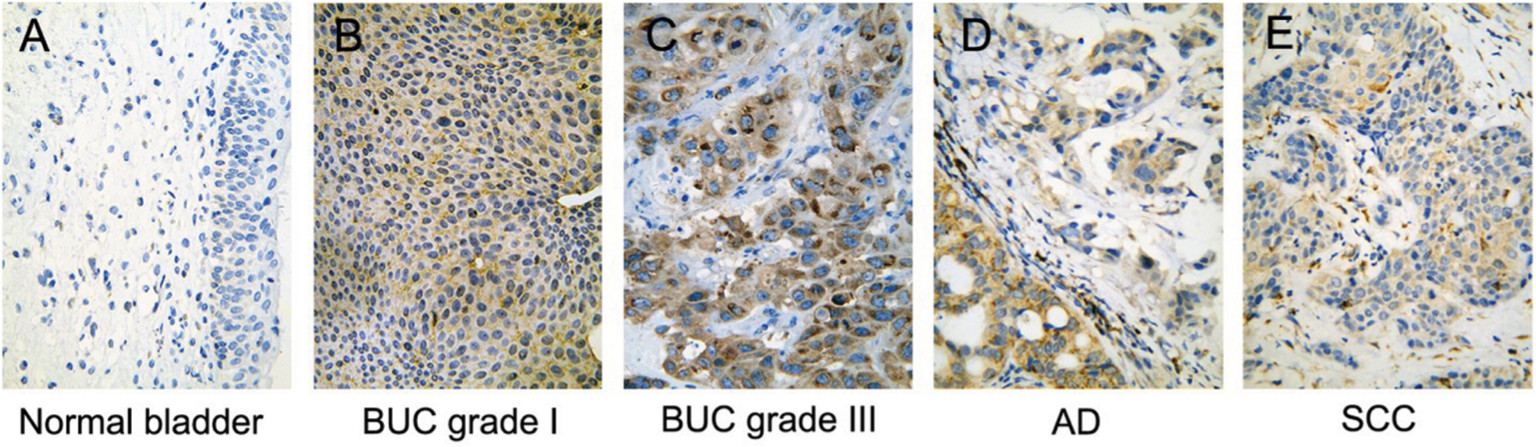 | Figure 2 Immunohistochemical localization of MTDH/AEG-1 expression in bladder tissue (×400). The immunohistochemistry results indicated positive signaling of MTDH/AEG-1 in the cytoplasm and cell nucleus in normal bladder (A), BUC grade I (B), BUC grade III (C), AD (D) and SCC (E). Abbreviations: MTDH, metadherin; AEG-1, astrocyte elevated gene-1; BUC, bladder urothelial carcinoma; AD, adenocarcinoma; SCC, squamous cell carcinoma. |
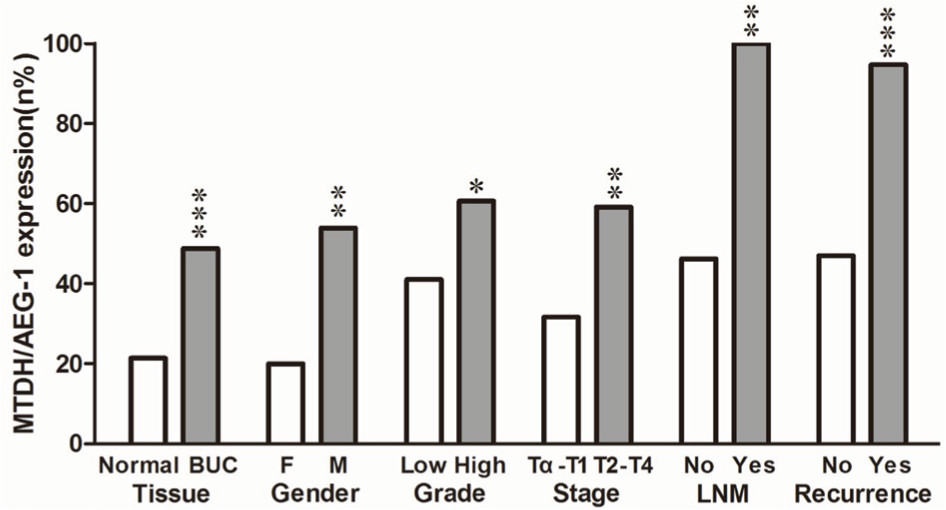 | Figure 3 Relationship between MTDH/AEG-1 expression and clinicopathological features. Notes: Immunohistochemistry was used for detection of MTDH/AEG-1 expression in bladder tissues. Data are expressed as n% for significant parameters. *P<0.05, **P<0.01, ***P<0.001. Abbreviations: MTDH, metadherin; AEG-1, astrocyte elevated gene-1; F, female; M, male; LNM, lymph node metastasis. |
 | Table 3 Relationship between MTDH/AEG-1 expression and clinicopathological features based on immunohistochemistry Abbreviations: MTDH, metadherin; AEG-1, astrocyte elevated gene-1; BUC, bladder urothelial carcinoma. |
 | Figure 4 Clinical significance of MTDH/AEG-1 in BUC based on immunohistochemical data. Notes: (A) ROC curve of MTDH/AEG-1 in BUC; (B) Kaplan-Meier curves of MTDH/AEG-1 expression in BUC. Abbreviations: MTDH, metadherin; AEG-1, astrocyte elevated gene-1; BUC, bladder urothelial carcinoma; mon, month; ROC, receiver operating characteristic. |
Examination of the relationship between MTDH/AEG-1 expression and other markers revealed a significantly higher MTDH/AEG-1 expression in the caspase-3-negative group (66.1%, 72/109) than in the caspase-3-positive group (15.8%, 9/57, P<0.001), whereas the MTDH/AEG-1 expression levels were markedly higher in the DcR3-, Bcl-2-, and VEGF-positive groups than in the respective negative groups (all P<0.001). MTDH/AEG-1 expression was also markedly enhanced in the group with a high Ki-67, PCNA, and p53 LI expression (P<0.001, Figure 5, Table 4). The Spearman test analysis revealed a negative correlation between the MTDH/AEG-1 expression and caspase-3 (r=−0.477, P<0.001), whereas positive correlations were noted between MTDH/AEG-1 expression and Bcl-2 (r=0.339, P<0.001), VEGF (r=0.329, P<0.001), Ki-67 LI (r=0.695, P<0.001), PCNA LI (r=0.724, P<0.001), P53 (r=0.357, P<0.001), and DcR3 (r=0.406, P<0.001).
 | Figure 5 Relationship between MTDH/AEG-1 expression and biomarkers based on immunohistochemical data. Notes: (–) Negative; (+) positive; *P<0.05, **P<0.01, ***P<0.001. Abbreviations: MTDH, metadherin; AEG-1, astrocyte elevated gene-1. |
 | Table 4 Relationship between MTDH/AEG-1 and biomarkers Abbreviations: MTDH, metadherin; AEG-1, astrocyte elevated gene-1. |
MTDH/AEG-1 and BUC: a meta-analysis
The meta-analysis included 976 cases from three sources (12 datasets in GEO [GSE30522, GSE76211, GSE65635, GSE38264, GSE52519, GSE40355, GSE37815, GSE31189, GSE24152, GSE13507, GSE7476, and GSE3167], one data set in ArrayExpress [E-MTAB-1940], and the original data in TCGA). The expression of MTDH/AEG-1 in BUC vs normal tissues was first compared using a fixed-effect model to analyze the standard mean deviation (SMD) and 95% CI. The combined SMD reached 0.21 (0.02, 0.41), indicating an upregulation of MTDH/AEG-1 expression in BUC (P=0.028, Figure 6A). A slightly high heterogeneity was indicated (I2=50.8%, P<0.05) for the SMD, so a random-effects model was tested, giving a combined SMD of 0.30 (–0.01, 0.61) with a steady heterogeneity (I2=50.8%, P=0.06, Figure 6B). A subsequent sensitivity analysis, conducted to determine if the high heterogeneity arose from a certain study, revealed that the pooled SMD was stable (Figure 6C). No significant publication bias was found (P>0.05, Figure 6D).
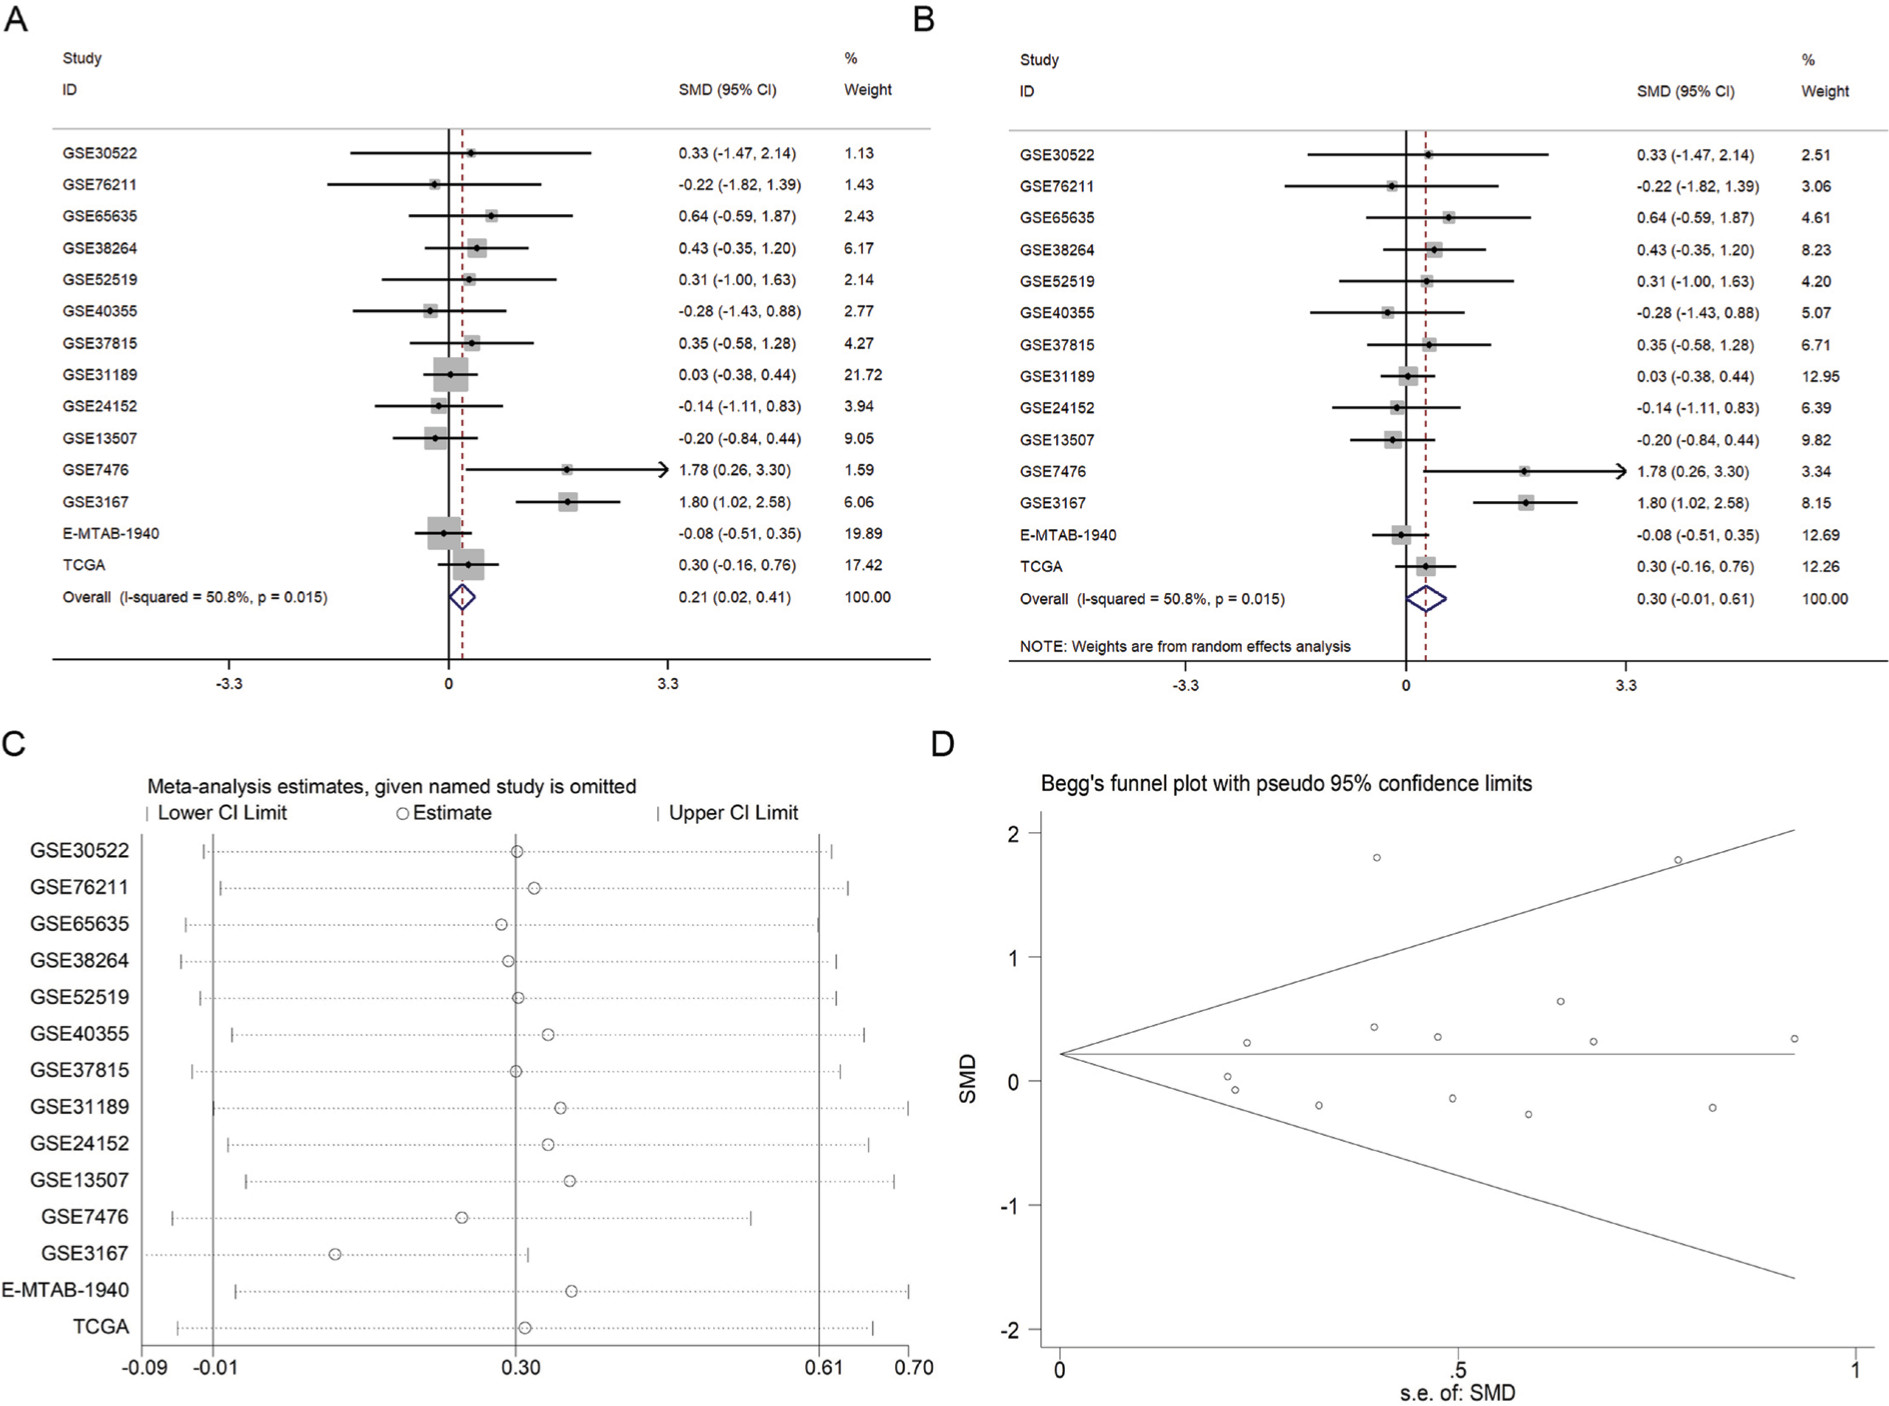 | Figure 6 Expression of MTDH/AEG-1 in BUC and in normal bladder tissues. Notes: (A) Forest plot of datasets evaluating MDTH/AEG-1 expression between BUC and normal control groups (fixed-effects model); (B) Forest plot of datasets evaluating MTDH/AEG-1 expression between BUC and normal control groups (random-effects model); (C) Sensitivity analysis aimed to exclude the main studies at a time; (D) Funnel plot of datasets and no publication bias was found in our investigation. Abbreviations: MTDH, metadherin; AEG-1, astrocyte elevated gene-1; BUC, bladder urothelial carcinoma. |
The diagnostic value of MTDH/AEG-1 in BUC was also investigated using a diagnostic meta-analysis. The AUC of the SROC was 0.79 (0.75–0.82, Figure 7A), with a sensitivity and specificity of 0.54 (95% CI: 0.36–0.72) and 0.90 (95% CI: 0.70–0.97), respectively (Figure 7B). The pooled sensitivity and specificity were assessed to confirm the accuracy of MTDH/AEG-1 for the detection of BUC. The results of the diagnostic meta-analysis confirmed the moderate diagnostic accuracy for MTDH/AEG-1 already indicated by TCGA and the immunohistochemical data. Again, no obvious publication bias was found (P>0.05, Figure 7C).
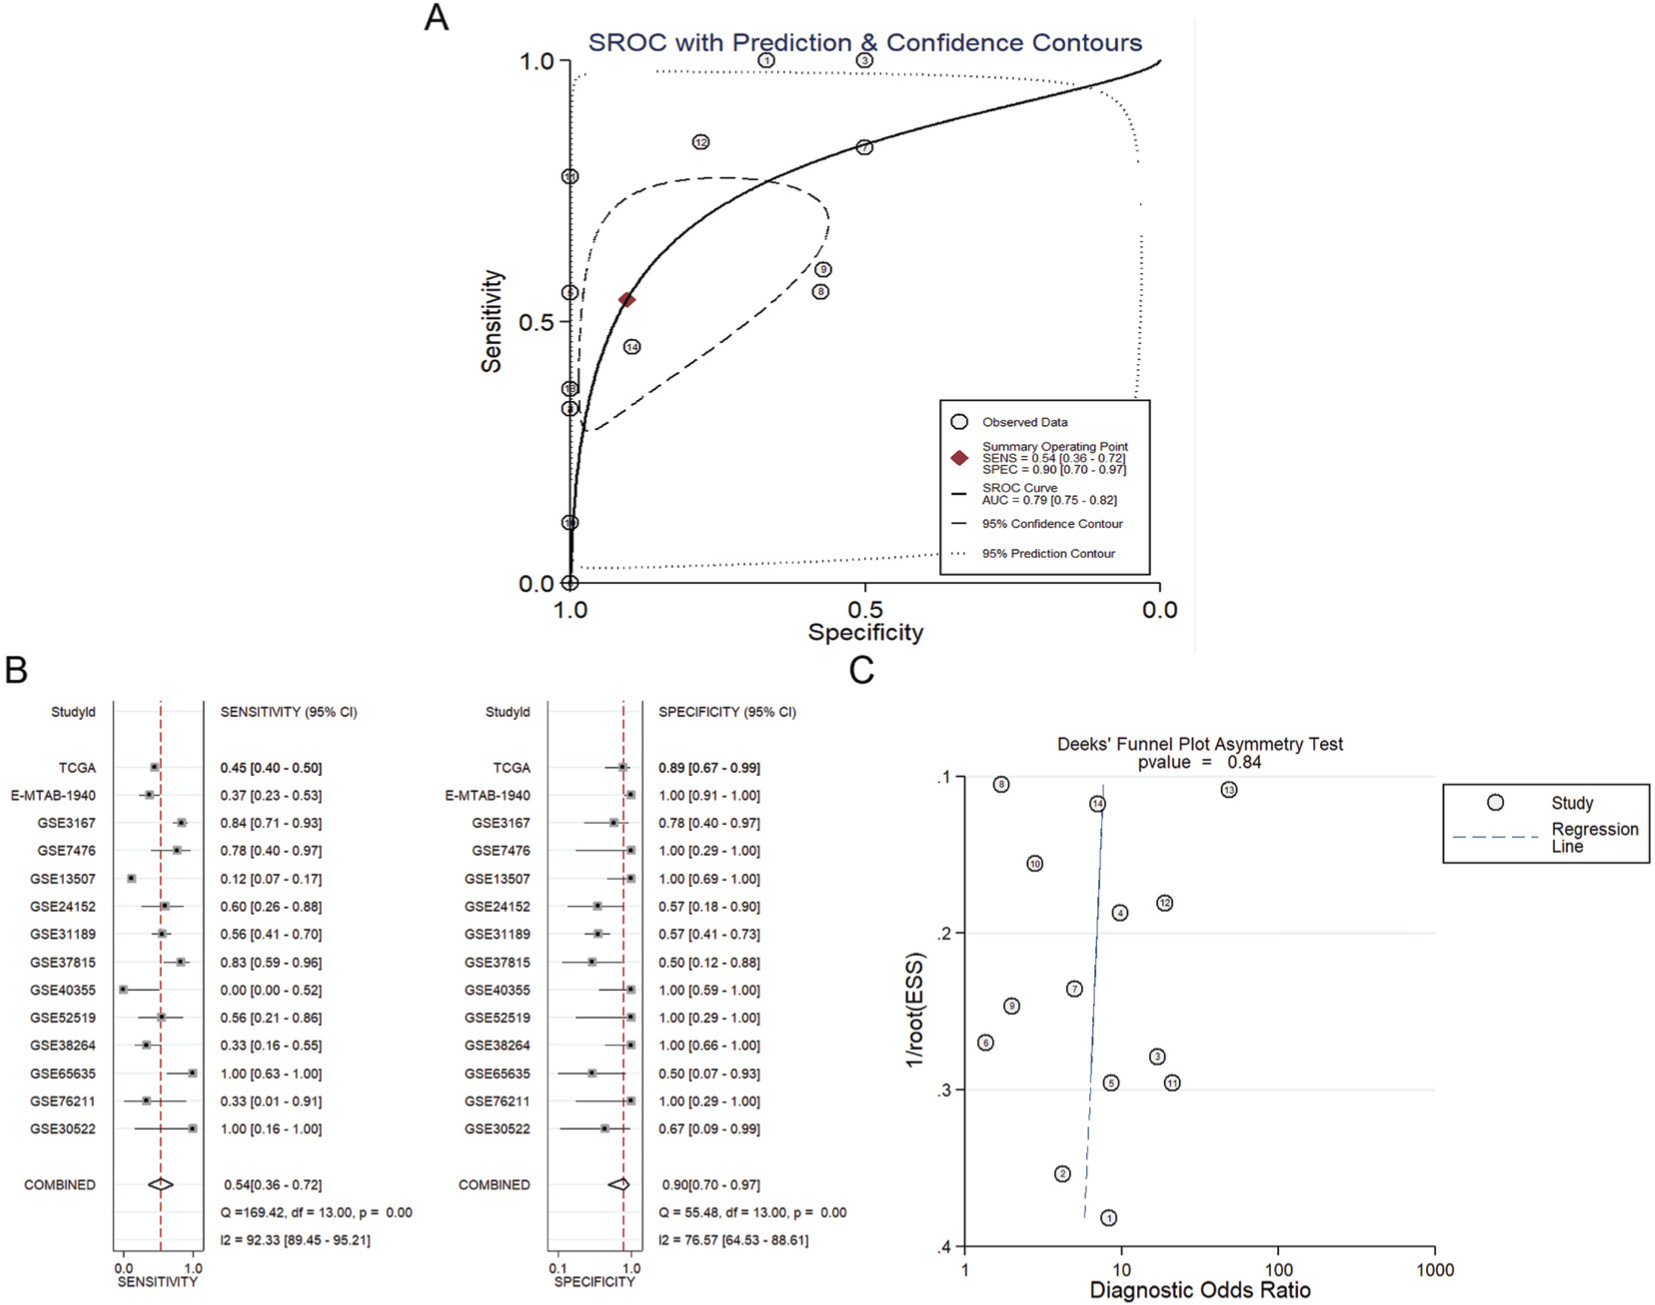 | Figure 7 The diagnostic meta-analysis of MTDH/AEG-1 expression in BUC. Notes: (A) The SROC curve for assessment of the diagnostic accuracy of MTDH/AEG-1 in BUC; (B) The pooled sensitivity and specificity of the included studies; (C) Publication bias. 1/root(ESS) indicates the inverse root of the effective sample sizes. Each circle represents an included study. Abbreviations: MTDH, metadherin; AEG-1, astrocyte elevated gene-1; BUC, bladder urothelial carcinoma; SROC, summary receiver operating characteristic. |
MTDH/AEG-1 expression promoted the viability of BUC cells
In this study, three BUC cell lines (T24, RT4, and HT1376) were cultured and transfected with siRNA. The transfection efficiency was over 80%, and the knockdown efficiency was over 75% (data not shown). The fluorimetric resorufin viability assays showed that the MTDH/AEG-1 siRNA poor group showed a most obvious effect compared with the other single MTDH/AEG-1 siRNA groups (Figure 8A). Cell viability was obviously reduced in all cell lines when compared to the negative MTDH/AEG-1 siRNA group, especially at 96 hours, post-transfection (Figure 8B–D). The MTDH/AEG-1 siRNA had the strongest effect in T24 cells among the three tested cell lines.
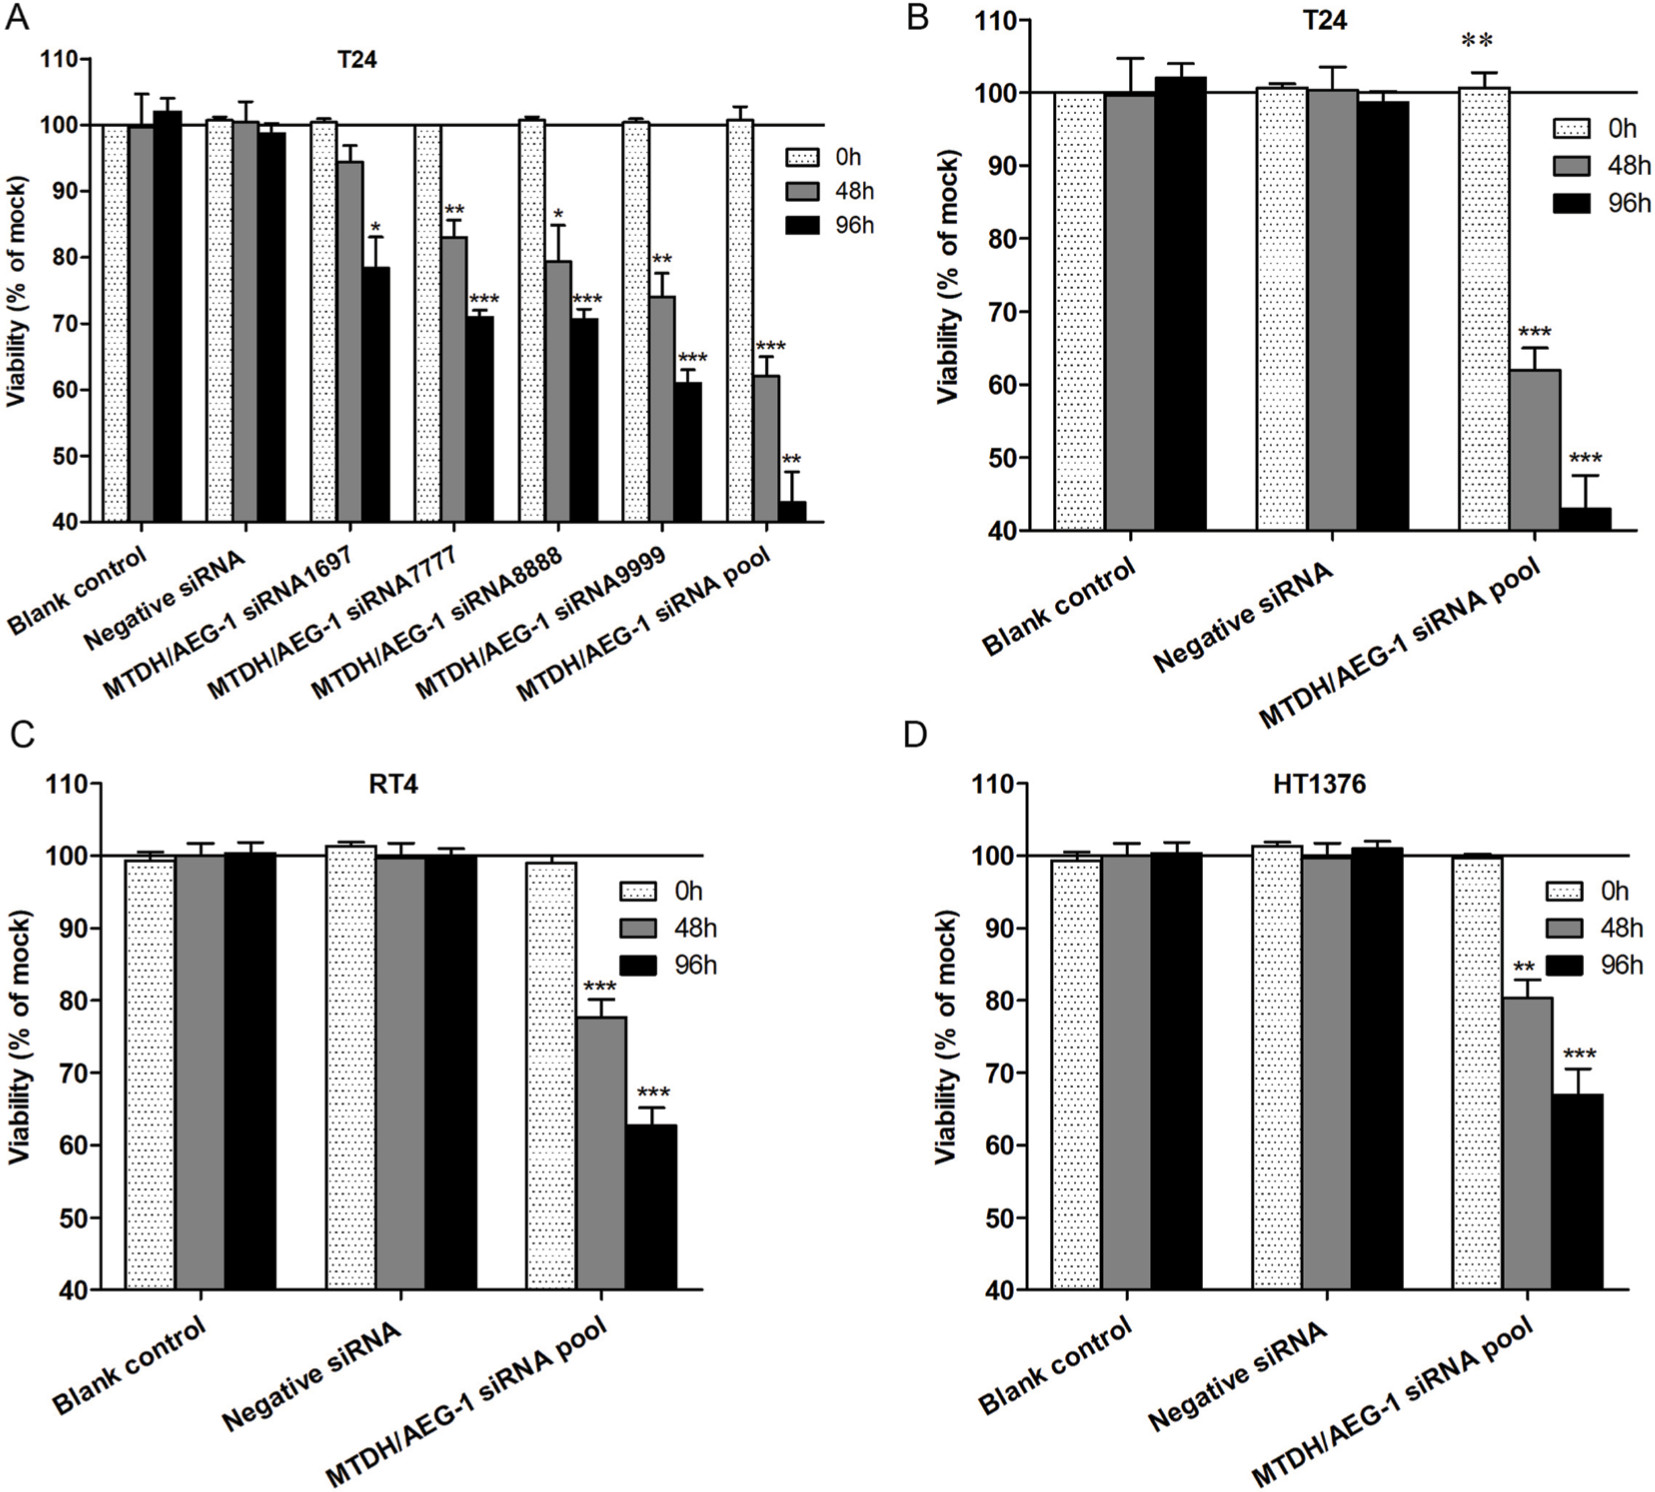 | Figure 8 MTDH/AEG-1 expression promoted viability of BUC cells. Notes: (A) The different effects of MTDH/AEG-1 siRNAs in T24 Cells. cell viability has significantly reduced in T24 (B), RT4 (C), and HT1376 (D) cells when compared to the negative control cells. *P<0.05, **P<0.01, ***P<0.001. Abbreviations: MTDH, metadherin; AEG-1, astrocyte elevated gene-1. |
MTDH/AEG-1 expression promoted cell proliferation in BUC cells
The MTS assays verified the cell viability results. Cell proliferation was significantly reduced after transfection with MTDH/AEG-1 siRNA in all three cell lines when compared to the negative group, especially at 96 hours post-transfection (Figure 9A–C). Transfection with MTDH/AEG-1 siRNA showed the strongest effect in T24 cells among the three cell lines.
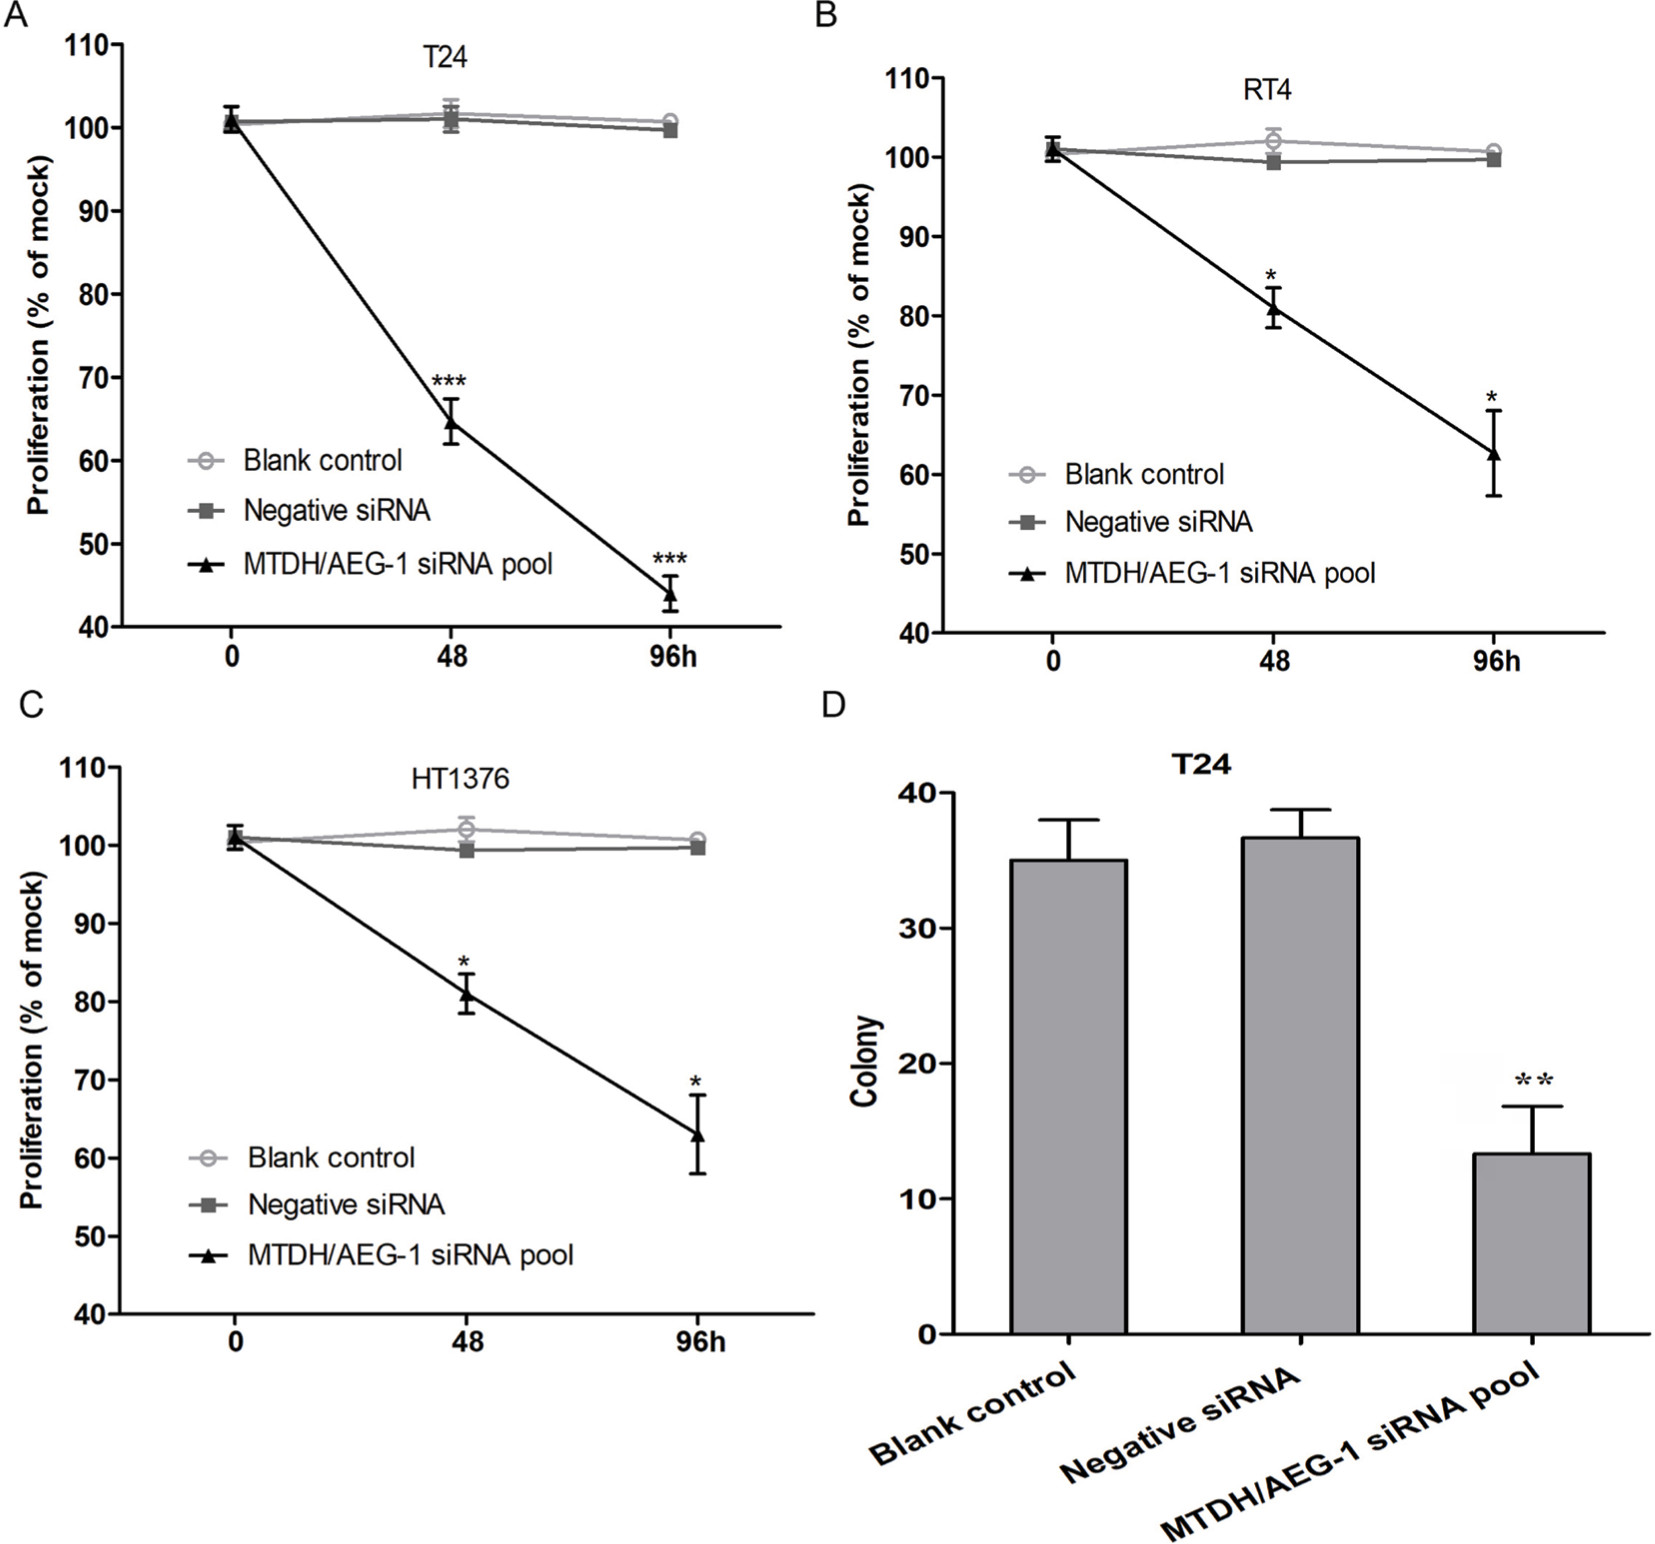 | Figure 9 MTDH/AEG-1 expression promoted proliferation of BUC cells. Notes: Cell proliferation was significantly reduced in T24 (A), RT4 (B), and HT1376 (C) cells when compared to the negative control group. (D) Cell colony formation was significantly reduced in T24 cells compared to the negative control group. *P<0.05, **P<0.01, ***P<0.001. Abbreviations: MTDH, metadherin; AEG-1, astrocyte elevated gene-1; BUC, bladder urothelial carcinoma. |
Tests of proliferation of T24 cells by colony formation assays also indicated significant inhibition, especially in the MTDH/AEG-1 siRNA group (Figure 9D). A group of cells was considered as a colony if the number of cells was more than ten.
Apoptosis induced by MTDH/AEG-1 siRNA
Caspase-3/7 activity was clearly enhanced by transfection with MTDH/AEG-1 siRNA in all three BUC cell lines, especially at 96 hours (Figure 10A–C). Similarly, among the three cell lines, MTDH/AEG-1 siRNA had the most significant influence in the T24 cells. The results of Hoechst 33342 and PI double fluorescent staining indicated a clear increase in apoptosis after transfection with MTDH/AEG-1 siRNA, especially at 96 hours (Figures 10D–10F and 11).
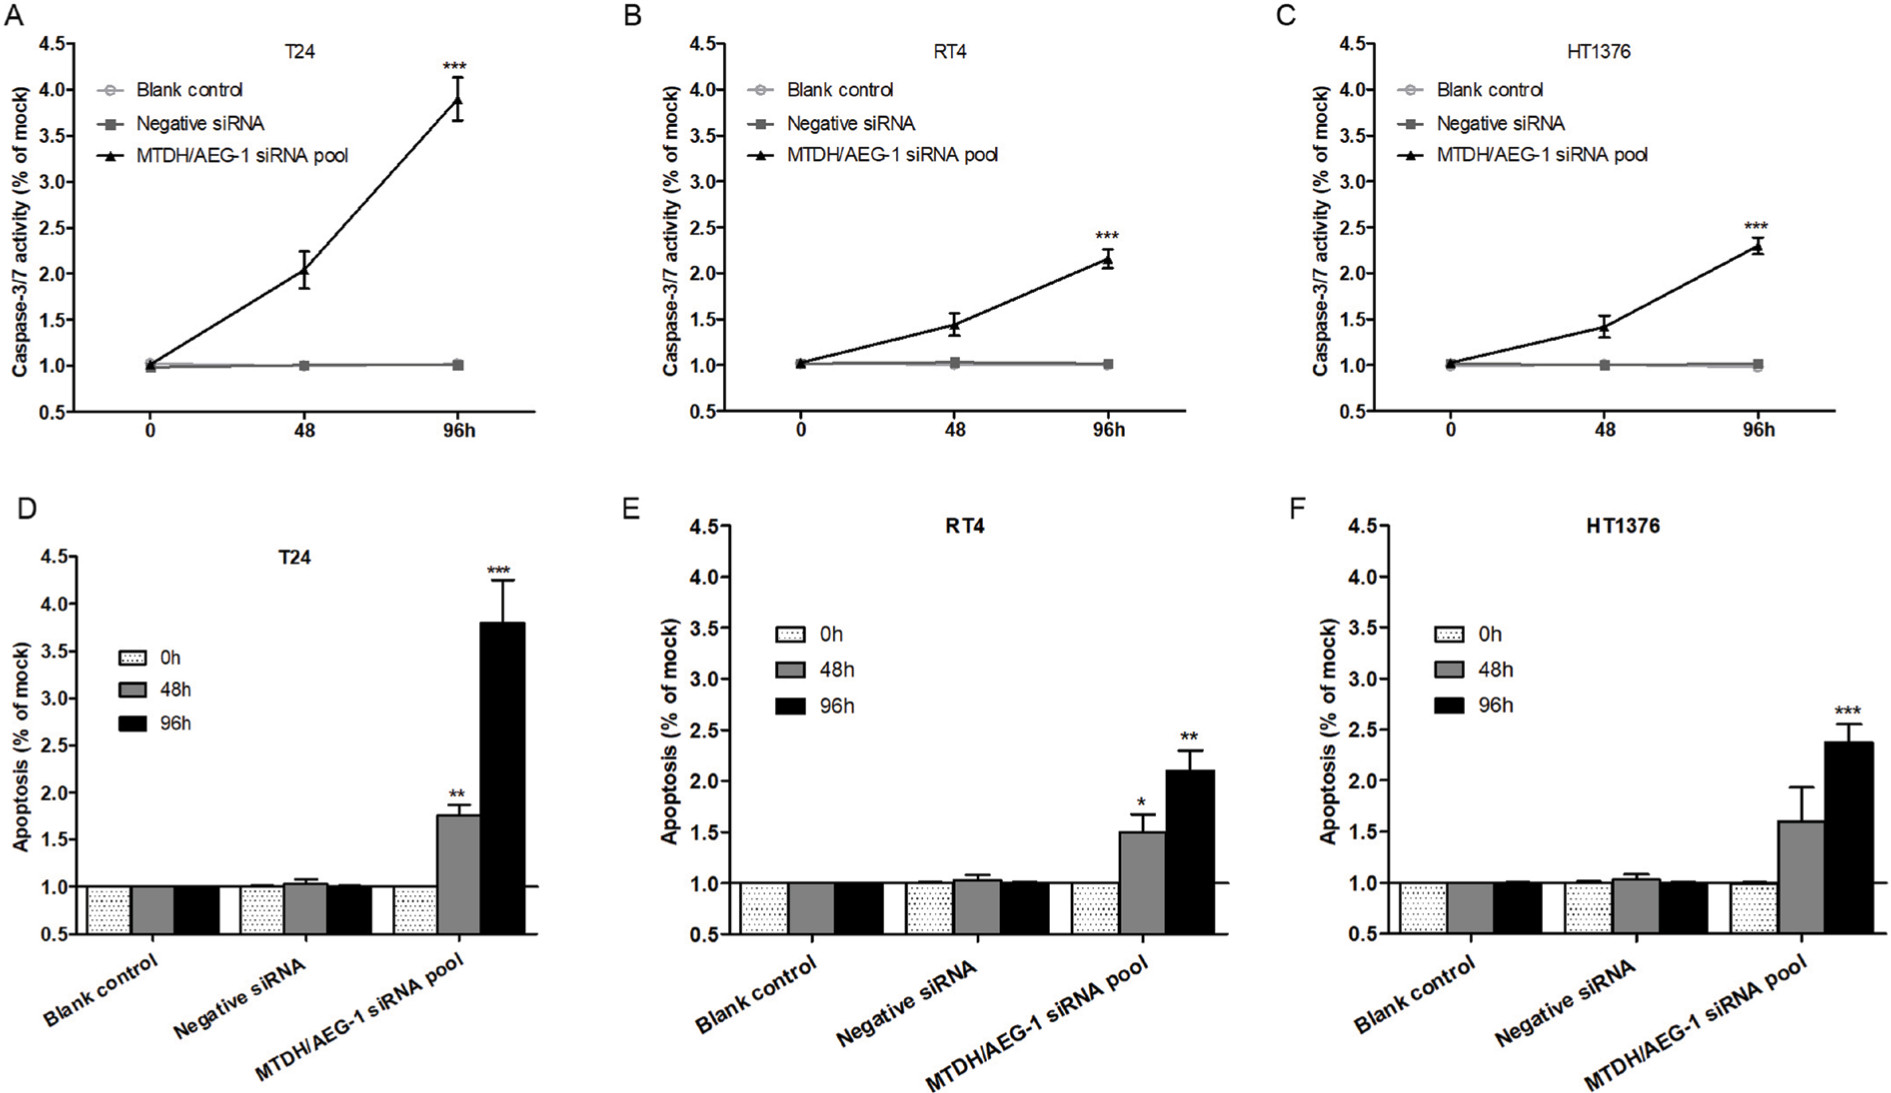 | Figure 10 MTDH/AEG-1-induced cell apoptosis in BUC cells. Notes: The caspase-3/7 activity (T24 [A], RT4 [B], and HT1376 [C]) and cell apoptosis (T24 [D], RT4 [E], and HT1376 [F]) were promoted in cells transfected with MTDH/AEG-1 siRNA when compared to negative controls. *P<0.05, **P<0.01, ***P<0.001. Abbreviations: MTDH, metadherin; AEG-1, astrocyte elevated gene-1; BUC, bladder urothelial carcinoma. |
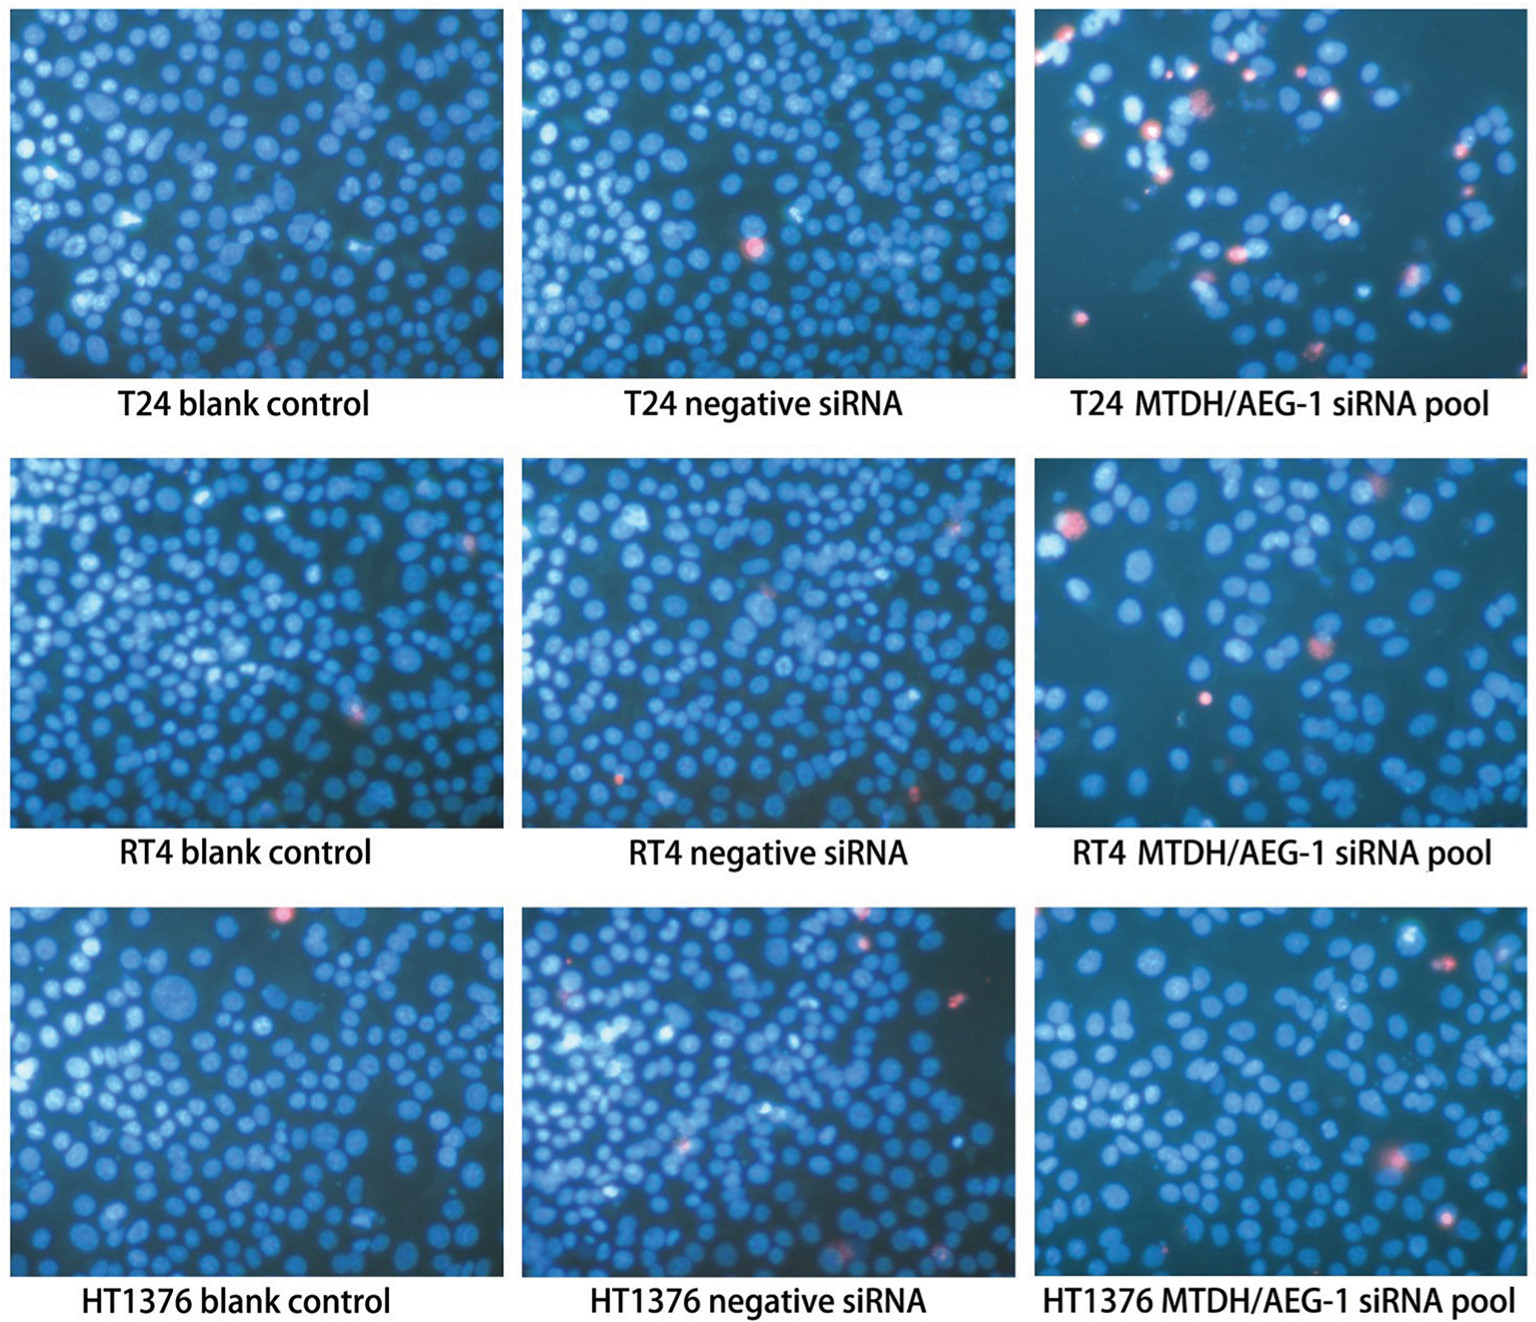 | Figure 11 Fluorescence microscopy images of MTDH/AEG-1-induced cell apoptosis in BUC cells. Abbreviations: MTDH, metadherin; AEG-1, astrocyte elevated gene-1; BUC, bladder urothelial carcinoma. |
The potential pathways associated with MTDH/AEG-1
A search of the top 1,500 genes co-expressed with MTDH/AEG-1 in five different probe sets (212251_AT, 212248_AT, 227277_AT, 212250_AT, and 1559822_S_At) of the MEM database revealed 173 genes that were overlapped by all five probe sets. We subsequently chose 164 co-expressed genes based on cbioportal and MEM and constructed a network using Cytoscape (Figure 12A). GO analysis revealed the most enriched functional terms to be protein transport, RNA binding, and intracellular transport (Table 5, Figure 12B). The genes co-expressed with MTDH/AEG-1 were significantly involved in the insulin signaling pathway (Table 6). Taken together, the GO and KEGG pathway items indicated a possible association between MTDH/AEG-1 expression and the biological mechanism of BUC. However, the actual mechanism requires further proof from functional experiments.
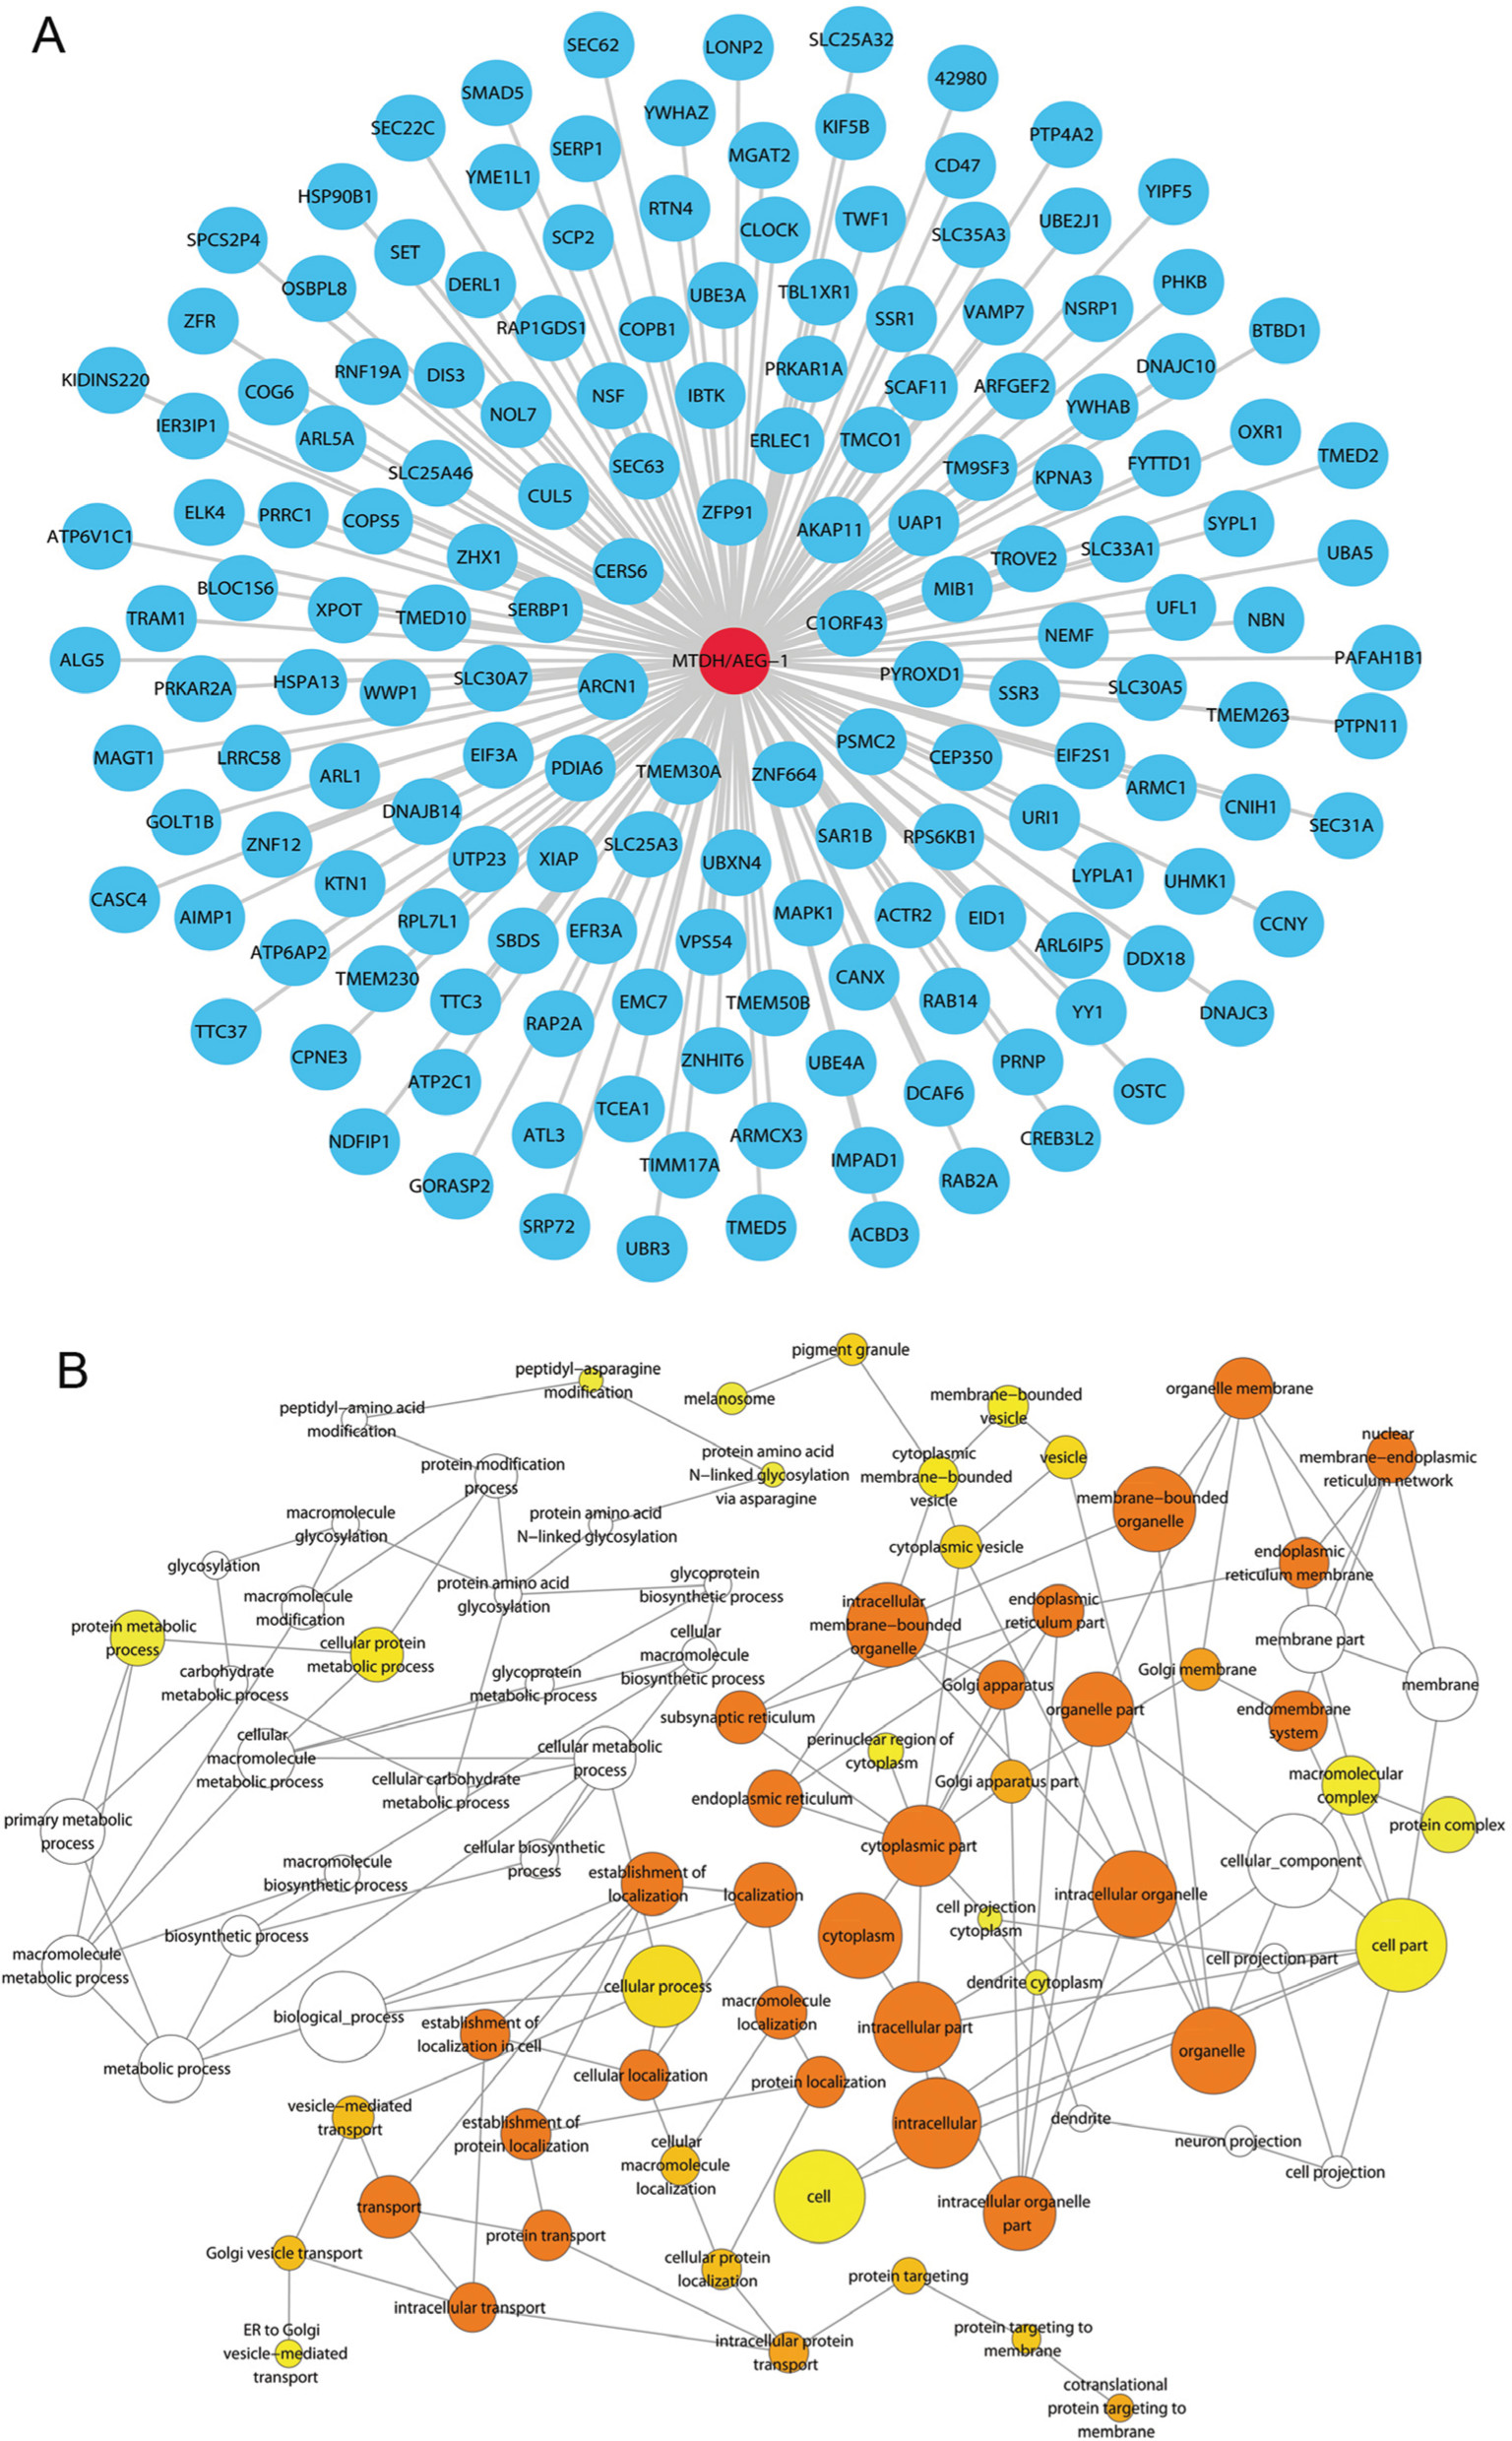 | Figure 12 Genes co-expressed with MTDH/AEG-1 and MTDH/AEG-1-associated biological functions. Notes: (A) The network of 164 genes co-expressed with MTDH/AEG-1. (B) A functional network of GO terms for the co-expressed genes of MTDH/AEG-1 in BUC. Abbreviations: MTDH, metadherin; AEG-1, astrocyte elevated gene-1; BUC, bladder urothelial carcinoma; GO, Gene Ontology. |
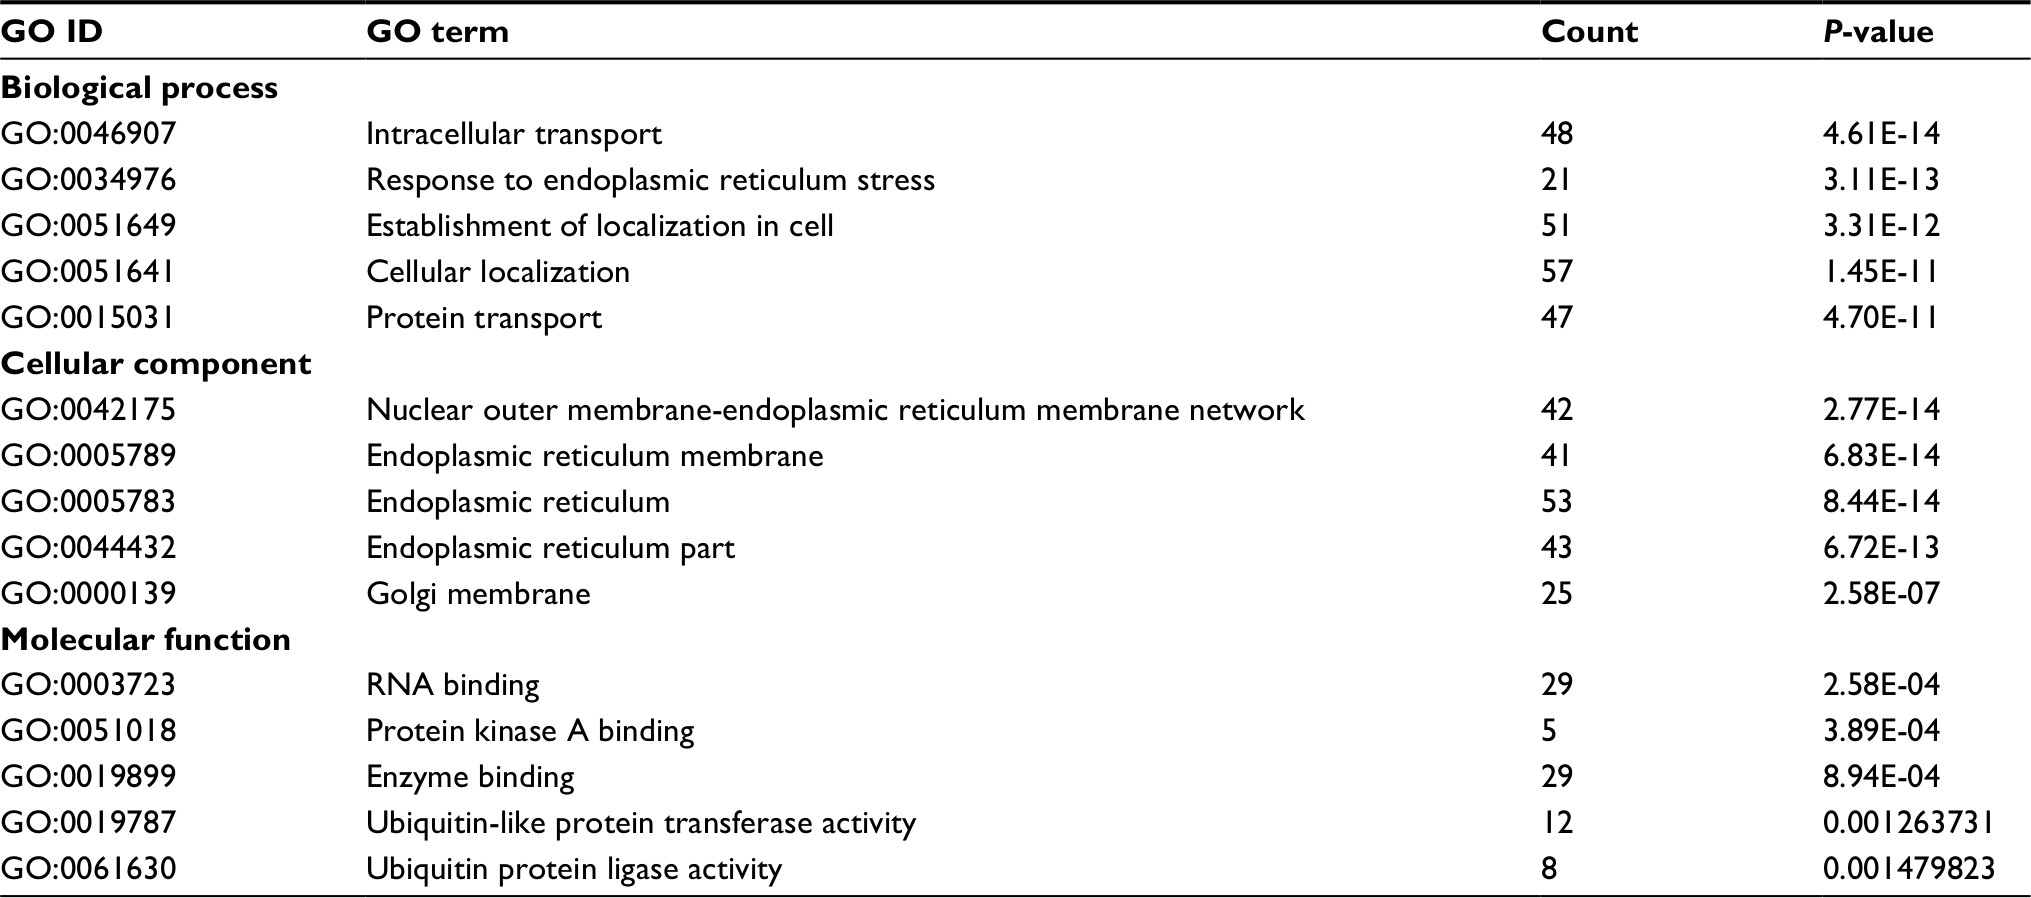 | Table 5 Top 5 GO enrichment terms (BP, CC, and MF) of the genes co-expressed with MTDH/AEG-1 Abbreviations: MTDH, metadherin; AEG-1, astrocyte elevated gene-1; GO, Gene Ontology. |
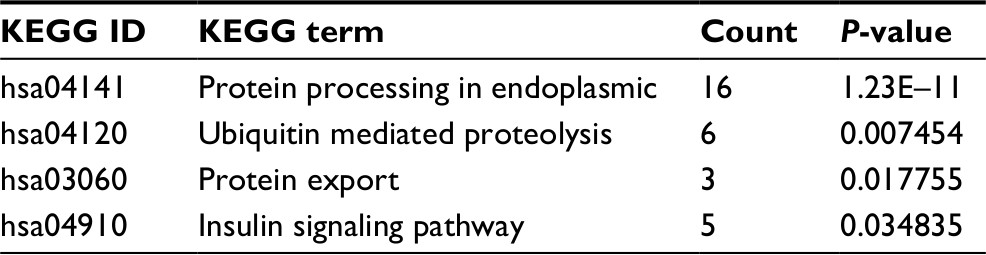 | Table 6 KEGG pathway enrichment analysis of genes co-expressed with MTDH/AEG-1 Abbreviations: KEGG, Kyoto Encyclopedia of Genes and Genomes; MTDH, metadherin; AEG-1, astrocyte elevated gene-1. |
Discussion
Our aim in the present study was to explore MTDH/AEG-1 expression and its clinical significance in BUC, as well as to determine the effect of MTDH/AEG-1 on cell growth and apoptosis of BUC cells. We used the TCGA database to measure the relationship between MTDH/AEG-1 and the clinicopathological parameters of BUC, and we conducted a meta-analysis to investigate the relationship between MTDH/AEG-1 and BUC. We also used immunohistochemistry to detect MTDH/AEG-1 expression in BUC tissues, and conducted different functional experiments in vitro to explore potential associations between MTDH/AEG-1 expressions, viability, proliferation, and apoptosis of BUC cell lines (T24, HT1376, and RT4). The TCGA and immunohistochemical findings indicated a significantly higher MTDH/AEG-1 expression in BUC tissues than in normal bladder tissues, and this higher MTDH/AEG-1 expression was associated with different clinicopathological parameters, such as male sex, tumor grade, and invasive stage. Knockdown of MTDH/AEG-1 expression suppressed cell proliferation and induced apoptosis in BUC cells.
MTDH/AEG-1 is a Ha-Ras-regulated gene located on chromosome 8q22.1.36 Growing evidence supports the potential role of MTDH/AEG-1 in the development and progression of various types of human cancers, including prostate, lung, kidney, breast, liver, and pancreatic cancer,37–41 especially since MTDH/AEG-1 is absent or poorly expressed in normal tissues.8,42 However, a role of MTDH/AEG-1 in BC has not been established yet. To date, a few studies have reported on the relationship between MTDH/AEG-1 expression and BUC. For example, Zhou et al43 used quantitative reverse transcription–polymerase chain reaction (RT-qPCR) and immunohistochemistry to investigate the expression of MTDH/AEG-1 protein in BC tissues and found positive expression in 65% of bladder tumors, but no expression in normal bladder tissues. Similarly, an immunohistochemical study by Yang et al15 revealed higher expression of MTDH/AEG-1 in BC tissues (45%) than in non-cancerous tissues, and they suggested that MTDH/AEG-1 could act as an independent prognostic factor for BC patients. In the present study, we found a significant upregulation of MTDH/AEG-1 in BUC tissues, which was verified via immunohistochemistry, in agreement with the results of Zhou and Yang et al. However, our positive ratio for MTDH/AEG-1 expression of 48.8% (81/166) differed from that reported by Zhou and Yang et al,15,43 which may reflect differences in sample source, sample size, and antibodies. The present study is the first to use TCGA database to research MTDH/AEG-1 expression in BUC, and our analysis using the TCGA database further confirmed our results.
We also applied functional assays to explore possible associations between MTDH/AEG-1 expression and viability, proliferation, and apoptosis in BUC cell lines (T24, HT1376, and RT4). MTDH/AEG-1 expression promoted cell growth and reduced apoptosis of BUC cells, but the exact mechanism by which this occurs remains unclear. MTDH/AEG-1 expression has previously been reported to promote invasion and metastasis through the activation of nuclear factor-κB (NF-κB), interleukin-8, and matrix metalloproteinase-9.37 We examined potential mechanisms of action of MTDH/AEG-1 in BUC by exploring the relationship between the expression of MTDH/AEG-1 and that of seven other common biomarkers: caspase-3, Bcl-2, VEGF, Ki-67, PCNA, p53, and DcR3. Sequential activation of caspase-3 plays a central role in cell apoptosis,44 the Bcl-2 gene can inhibit tumor cell apoptosis,45–47 and VEGF production by cells can stimulate vasculogenesis and angiogenesis.48,49 Ki-67 and PCNA are classical markers of cell proliferation and are routinely used by pathologists,50 whereas p53 is related to DNA repair and apoptosis.47,51 DcR3 is widely expressed in malignant tissues and is related to cell growth and apoptosis.27,52,53 In the current study, we found an inverse correlation between the expression of MTDH/AEG-1 and caspase-3, indicating that higher expression of MTDH/AEG-1 can block apoptosis. We also observed positive relationships between MTDH/AEG-1 and the other markers, suggesting their involvement in the rapid cell growth or angiogenesis associated with BUC.
We further investigated the possible pathways by which MTDH/AEG-1 inhibits apoptosis and promotes proliferation in BUC by examining genes that were co-expressed with MTDH/AEG-1 in cBioPortal and MEM. Subsequent GO and KEGG analyses revealed that the co-expressed genes were involved in insulin signaling pathway, a pathway with known associations with cisplatin resistance, apoptosis, and prognosis of cancers.54–56 We therefore hypothesize that MTDH/AEG-1 could play vital roles in BUC via interaction with the insulin signaling pathway.
In our current study, we evaluated the clinical significance and effects of MTDH/AEG-1 expression in BUC by evaluating immunohistochemistry, RNA-seq, and in vitro data. Our study had several limitations, including using immunohistochemistry, rather than RT-qPCR, as the basis for measurement of MTDH/AEG-1 expression. Our meta-analysis also had limitations, including heterogeneity (high I2 values), which was unavoidable in part because no obvious results could be found in most of the datasets. In addition, no publications were included in the SMD and diagnostic meta-analysis, which might have contributed to the high heterogeneity. We also hypothesized that MTDH/AEG-1 could participate in different biological processes of BUC via insulin signaling pathway based on bioinformatics analysis, but more experiments are needed to verify this hypothesis.
Acknowledgments
The study was supported by the Promoting Project of Basic Capacity for Young and Middle-aged University Teachers in Guangxi (KY2016LX034) and the Medical Excellence Award Funded by the Creative Research Development Grant from the First Affiliated Hospital of Guangxi Medical University. The authors sincerely appreciate the public access to the GEO, Arrayexpress, and TCGA databases.
Disclosure
The authors report no conflicts of interest in this work.
References
Siegel RL, Miller KD, Jemal A. Cancer statistics, 2017. CA Cancer J Clin. 2017;67(1):7–30. | ||
Li HJ, Sun XM, Li ZK, et al. LncRNA UCA1 promotes mitochondrial function of bladder cancer via the MiR-195/ARL2 signaling pathway. Cell Physiol Biochem. 2017;43(6):2548–2561. | ||
Zhi Y, Pan J, Shen W, et al. Ginkgolide B inhibits human bladder cancer cell migration and invasion through microRNA-223-3p. Cell Physiol Biochem. 2016;39(5):1787–1794. | ||
Zhang S, Zhang C, Liu W, et al. MicroRNA-24 upregulation inhibits proliferation, metastasis and induces apoptosis in bladder cancer cells by targeting CARMA3. Int J Oncol. 2015;47(4):1351–1360. | ||
Yang MH, Chu PY, Chen SC, et al. Characterization of ADAM28 as a biomarker of bladder transitional cell carcinomas by urinary proteome analysis. Biochem Biophys Res Commun. 2011;411(4):714–720. | ||
Turan T, Efiloğlu Ö, Günaydin B, et al. Comparative differences between T1a/b and T1e/m as substages in T1 urothelial carcinoma of the bladder. Int Braz J Urol. 2018;44(2):267–272. | ||
Emdad L, Sarkar D, Su ZZ, et al. Activation of the nuclear factor kappaB pathway by astrocyte elevated gene-1: implications for tumor progression and metastasis. Cancer Res. 2006;66(3):1509–1516. | ||
Zhang Y, Li ZY, Hou XX, et al. Clinical significance and effect of AEG-1 on the proliferation, invasion, and migration of NSCLC: a study based on immunohistochemistry, TCGA, bioinformatics, in vitro and in vivo verification. Oncotarget. 2017;8(10):16531–16552. | ||
Gnosa S, Capodanno A, Murthy RV, Jensen LD, Sun XF. AEG-1 knockdown in colon cancer cell lines inhibits radiation-enhanced migration and invasion in vitro and in a novel in vivo zebrafish model. Oncotarget. 2016;7(49):81634–81644. | ||
Park SY, Choi M, Park D, et al. AEG-1 promotes mesenchymal transition through the activation of Rho GTPases in human glioblastoma cells. Oncol Rep. 2016;36(5):2641–2646. | ||
Ren F, Ding H, Huang S, et al. Expression and clinicopathological significance of miR-193a-3p and its potential target astrocyte elevated gene-1 in non-small lung cancer tissues. Cancer Cell Int. 2015;15:80. | ||
Liang X, Li H, Fu D, Chong T, Wang Z, Li Z. MicroRNA-1297 inhibits prostate cancer cell proliferation and invasion by targeting the AEG-1/Wnt signaling pathway. Biochem Biophys Res Commun. 2016;480(2):208–214. | ||
Wang Y, Zhang W, Zhu X, et al. Upregulation of AEG-1 involves in Schwann cell proliferation and migration after sciatic nerve crush. J Mol Neurosci. 2016;60(2):248–257. | ||
Xu S, Gu G, Ni Q, et al. The expression of AEG-1 and Cyclin D1 in human bladder urothelial carcinoma and their clinicopathological significance. Int J Clin Exp Med. 2015;8(11):21222–21228. | ||
Yang G, Zhang L, Lin S, et al. AEG-1 is associated with tumor progression in nonmuscle-invasive bladder cancer. Med Oncol. 2014;31(6):986. | ||
Nikpour M, Emadi-Baygi M, Fischer U, Niegisch G, Schulz WA, Nikpour P. MTDH/AEG-1 contributes to central features of the neoplastic phenotype in bladder cancer. Urol Oncol. 2014;32(5):670–677. | ||
Bornstein S, Schmidt M, Choonoo G, et al. IL-10 and integrin signaling pathways are associated with head and neck cancer progression. BMC Genomics. 2016;17:38. | ||
Li Y, Kang K, Krahn JM, et al. A comprehensive genomic pan-cancer classification using The Cancer Genome Atlas gene expression data. BMC Genomics. 2017;18(1):508. | ||
Zeng JH, Xiong DD, Pang YY, et al. Identification of molecular targets for esophageal carcinoma diagnosis using miRNA-seq and RNA-seq data from The Cancer Genome Atlas: a study of 187 cases. Oncotarget. 2017;8(22):35681–35699. | ||
Li CY, Pang YY, Yang H, et al. Identification of miR-101-3p targets and functional features based on bioinformatics, meta-analysis and experimental verification in hepatocellular carcinoma. Am J Transl Res. 2017;9(5):2088–2105. | ||
Ferreira MJ, Pires-Luís AS, Vieira-Coimbra M, et al. SETDB2 and RIOX2 are differentially expressed among renal cell tumor subtypes, associating with prognosis and metastization. Epigenetics. 2017;12(12):1057–1064. | ||
Zeng Y, Wang T, Liu Y, et al. LncRNA PVT1 as an effective biomarker for cancer diagnosis and detection based on transcriptome data and meta-analysis. Oncotarget. 2017;8(43):75455–75466. | ||
Jankovic-Velickovic L, Stojnev S, Ristic-Petrovic A, et al. Pro- and antiapoptotic markers in upper tract urothelial carcinoma associated with Balkan endemic nephropathy. ScientificWorldJournal. 2011;11:1699–1711. | ||
Jankovic Velickovic L, Hattori T, Stefanovic V. Molecular markers in upper urothelial carcinoma associated to Balkan endemic nephropathy. Aristolochic acid as the major risk factor of the worldwide disease. ScientificWorldJournal. 2009;9:1360–1373. | ||
Chen G, Luo D. Expression of decoy receptor 3 in liver tissue microarrays. Natl Med J India. 2008;21(6):275–278. | ||
Chen G, Rong M, Luo D. TNFRSF6B neutralization antibody inhibits proliferation and induces apoptosis in hepatocellular carcinoma cell. Pathol Res Pract. 2010;206(9):631–641. | ||
Huang S, Chen G, Dang Y, Chen LH. Overexpression of DcR3 and its significance on tumor cell differentiation and proliferation in glioma. ScientificWorldJournal. 2014;2014:605236. | ||
Yang M, Chen G, Dang Y, Luo D. Significance of decoy receptor 3 in sera of hepatocellular carcinoma patients. Ups J Med Sci. 2010;115(4):232–237. | ||
Chen G, Kronenberger P, Umelo IA, Teugels E, de Grève J. Quantification of epidermal growth factor receptor T790M mutant transcripts in lung cancer cells by real-time reverse transcriptase-quantitative polymerase chain reaction. Anal Biochem. 2010;398(2):266–268. | ||
Esparza-López J, Ramos-Elías PA, Castro-Sánchez A, et al. Primary breast cancer cell culture yields intra-tumor heterogeneous subpopulations expressing exclusive patterns of receptor tyrosine kinases. BMC Cancer. 2016;16(1):740. | ||
Gong Z, Lu R, Xie S, et al. Overexpression of pro-gastrin releasing peptide promotes the cell proliferation and progression in small cell lung cancer. Biochem Biophys Res Commun. 2016;479(2):312–318. | ||
Xu M, Wang Y, Chen L, et al. Down-regulation of ribosomal protein S15A mRNA with a short hairpin RNA inhibits human hepatic cancer cell growth in vitro. Gene. 2014;536(1):84–89. | ||
Chen G, Kronenberger P, Teugels E, Umelo IA, De Grève J. Targeting the epidermal growth factor receptor in non-small cell lung cancer cells: the effect of combining RNA interference with tyrosine kinase inhibitors or cetuximab. BMC Med. 2012;10:28. | ||
Adler P, Kolde R, Kull M, et al. Mining for coexpression across hundreds of datasets using novel rank aggregation and visualization methods. Genome Biol. 2009;10(12):R139. | ||
Ashburner M, Ball CA, Blake JA, et al. Gene ontology: tool for the unification of biology. The Gene Ontology Consortium. Nat Genet. 2000;25(1):25–29. | ||
Hu G, Wei Y, Kang Y. The multifaceted role of MTDH/AEG-1 in cancer progression. Clin Cancer Res. 2009;15(18):5615–5620. | ||
Wang Z, Wei YB, Gao YL, Yan B, Yang JR, Guo Q. Metadherin in prostate, bladder, and kidney cancer: a systematic review. Mol Clin Oncol. 2014;2(6):1139–1144. | ||
Xu C, Kong X, Wang H, et al. MTDH mediates estrogen-independent growth and tamoxifen resistance by down-regulating PTEN in MCF-7 breast cancer cells. Cell Physiol Biochem. 2014;33(5):1557–1567. | ||
Robertson CL, Srivastava J, Siddiq A, et al. Genetic deletion of AEG-1 prevents hepatocarcinogenesis. Cancer Res. 2014;74(21):6184–6193. | ||
Yan JW, Lin JS, He XX. The emerging role of miR-375 in cancer. Int J Cancer. 2014;135(5):1011–1018. | ||
Ding Q, Chen Y, Dong S, et al. Astrocyte elevated gene-1 is overexpressed in non-small-cell lung cancer and associated with increased tumour angiogenesis. Interact Cardiovasc Thorac Surg. 2018;26(3):395–401. | ||
Ma Z, Chen Y, Dong S, et al. AEG-1 mRNA expression in non-small cell lung cancer is associated with increased tumor angiogenesis. Pathol Res Pract. 2017;213(10):1257–1263. | ||
Zhou J, Li J, Wang Z, Yin C, Zhang W. Metadherin is a novel prognostic marker for bladder cancer progression and overall patient survival. Asia Pac J Clin Oncol. 2012;8(3):e42–e48. | ||
Cheng Q, Blais MO, Harris GM, Jabbarzadeh E. PLGA-carbon nanotube conjugates for intercellular delivery of caspase-3 into osteosarcoma cells. PLoS One. 2013;8(12):e81947. | ||
Jeon BS, Yoon BI. Altered expression of cellular Bcl-2 in the progression of hamster cholangiocarcinogenesis. ScientificWorldJournal. 2012;2012:385840–6. | ||
Kouri FM, Jensen SA, Stegh AH. The role of Bcl-2 family proteins in therapy responses of malignant astrocytic gliomas: Bcl2L12 and beyond. ScientificWorldJournal. 2012;2012:838916. | ||
Song HY, Deng XH, Yuan GY, et al. Expression of bcl-2 and p53 in induction of esophageal cancer cell apoptosis by ECRG2 in combination with cisplatin. Asian Pac J Cancer Prev. 2014;15(3):1397–1401. | ||
Nakamura I, Zakharia K, Banini BA, et al. Brivanib attenuates hepatic fibrosis in vivo and stellate cell activation in vitro by inhibition of FGF, VEGF and PDGF signaling. PLoS One. 2014;9(4):e92273. | ||
Chuangsuwanich T, Pongpruttipan T, O-Charoenrat P, Komoltri C, Watcharahirun S, Sa-Nguanraksa D. Clinicopathologic features of breast carcinomas classified by biomarkers and correlation with microvessel density and VEGF expression: a study from Thailand. Asian Pac J Cancer Prev. 2014;15(3):1187–1192. | ||
Qiu X, Mei J, Yin J, Wang H, Wang J, Xie M. Correlation analysis between expression of PCNA, Ki-67 and COX-2 and X-ray features in mammography in breast cancer. Oncol Lett. 2017;14(3):2912–2918. | ||
Shin MK, Kim JW. Clinicopathologic and diagnostic significance of p53 protein expression in papillary thyroid carcinoma. Asian Pac J Cancer Prev. 2014;15(5):2341–2344. | ||
Liang C, Xu Y, Li G, et al. Downregulation of DcR3 sensitizes hepatocellular carcinoma cells to TRAIL-induced apoptosis. Onco Targets Ther. 2017;10:417–428. | ||
Hsieh SL, Lin WW. Decoy receptor 3: an endogenous immunomodulator in cancer growth and inflammatory reactions. J Biomed Sci. 2017;24(1):39. | ||
Du J, Shi HR, Ren F, et al. Inhibition of the IGF signaling pathway reverses cisplatin resistance in ovarian cancer cells. BMC Cancer. 2017;17(1):851. | ||
Ochnik AM, Baxter RC. Insulin-like growth factor receptor and sphingosine kinase are prognostic and therapeutic targets in breast cancer. BMC Cancer. 2017;17(1):820. | ||
Zhao T, Bai J, Zou Q, Chen F, Xie Y. Insulin in combination with cisplatin induces the apoptosis of ovarian cancer cells via p53 and JNK activation. Mol Med Rep. 2017;16(6):9095–9101. |
 © 2018 The Author(s). This work is published and licensed by Dove Medical Press Limited. The full terms of this license are available at https://www.dovepress.com/terms.php and incorporate the Creative Commons Attribution - Non Commercial (unported, v3.0) License.
By accessing the work you hereby accept the Terms. Non-commercial uses of the work are permitted without any further permission from Dove Medical Press Limited, provided the work is properly attributed. For permission for commercial use of this work, please see paragraphs 4.2 and 5 of our Terms.
© 2018 The Author(s). This work is published and licensed by Dove Medical Press Limited. The full terms of this license are available at https://www.dovepress.com/terms.php and incorporate the Creative Commons Attribution - Non Commercial (unported, v3.0) License.
By accessing the work you hereby accept the Terms. Non-commercial uses of the work are permitted without any further permission from Dove Medical Press Limited, provided the work is properly attributed. For permission for commercial use of this work, please see paragraphs 4.2 and 5 of our Terms.