")
Back to Journals » Journal of Asthma and Allergy » Volume 12
Clinical profile of predefined asthma phenotypes in a large cohort of UK primary care patients (Clinical Practice Research Datalink)
Authors Nissen F , Douglas IJ, Müllerová H , Pearce N , Bloom CI , Smeeth L, Quint JK
Received 2 August 2018
Accepted for publication 3 November 2018
Published 8 January 2019 Volume 2019:12 Pages 7—19
DOI https://doi.org/10.2147/JAA.S182013
Checked for plagiarism Yes
Review by Single anonymous peer review
Peer reviewer comments 2
Editor who approved publication: Dr Amrita Dosanjh
Francis Nissen,1 Ian J Douglas,1 Hana Müllerová,2 Neil Pearce,1 Chloe I Bloom,3 Liam Smeeth,1 Jennifer K Quint3
1Department of Non-Communicable Disease Epidemiology, London School of Hygiene and Tropical Medicine, London, UK; 2RWD & Epidemiology, GSK R&D, Uxbridge, UK; 3National Heart and Lung Institute, Imperial College, London, UK
Background: Distinct asthma phenotypes have previously been suggested, including benign asthma, atopic asthma and obese non-eosinophilic asthma. This study aims to establish if these phenotypes can be identified using data recorded in primary care clinical records and reports on patient characteristics and exacerbation frequency.
Methods: A population-based cohort study identified 193,999 asthma patients in UK primary care from 2007 to 2017. We used linked primary and secondary care data from the Clinical Practice Research Datalink, Hospital Episode Statistics and Office for National Statistics. Patients were classified into predefined phenotypes or included in an asthma “not otherwise specified” (NOS) group. We used negative binomial regression to calculate the exacerbation rates and adjusted rate ratios. Rate ratios were further stratified by asthma treatment step.
Results: In our cohort, 3.9% of patients were categorized as benign asthma, 28.6% atopic asthma and 4.8% obese non-eosinophilic asthma. About 62.7% of patients were asthma NOS, including asthma NOS without treatment (10.4%), only on short-acting beta agonist (6.1%) and on maintenance treatment (46.2%). Crude severe exacerbation rates per 1,000 person-years were lowest for benign asthma (106.8 [95% CI: 101.2–112.3]) and highest for obese non-eosinophilic asthma (469.0 [451.7–486.2]). Incidence rate ratios for all phenotype groups decreased when stratified by treatment step but remained raised compared to benign asthma.
Conclusion: Established phenotypes can be identified in a general asthma population, although many patients did not fit into the specific phenotypes which we studied. Phenotyping patients and knowledge of asthma treatment step could help anticipate clinical course and therefore could aid clinical management but is only possible in a minority of primary care patients based on current phenotypes and electronic health records (EHRs).
Keywords: asthma, phenotypes, primary health care, electronic health records, epidemiology, phenotyping
Introduction
Asthma is a heterogeneous disease with recognizable clusters called asthma phenotypes.1–4 These phenotypes are defined as the set of observable characteristics of an individual resulting from the interaction of its genotype with the environment.5 Classifying asthma into phenotypes allows to deconstruct the disease into separate identifiable and treatable traits6 and better understand disease progression and response to treatment, further enabling practice of precision medicine.2
There have been multiple studies describing asthma phenotypes,7–17 involving populations with asthma alone or as part of an entity called “obstructive airways disease” together with COPD.18,19 Criteria to distinguish asthma phenotypes include inflammatory profiling based on leukocyte counts (eosinophils, neutrophils and paucigranulocytic), symptom expression, age-of-asthma onset and airflow measurements.20–26 Classification by eosinophil counts has been found to be particularly important due to treatment response.27–29
Haldar et al conducted one of the most impactful studies on clinical asthma phenotypes to date using cluster analysis methodology.7 Among 184 patients managed in primary care, three clusters were found: one group with benign asthma, one group with obese non-eosinophilic asthma and one group with early-onset atopic asthma (Figure 1). Cluster analysis of two further mostly refractory asthma populations managed in secondary care (N=255 total) added an early symptom predominant cluster and an inflammation predominant cluster. Other phenotyping studies using comparable clinical variables found similar phenotypes.9,13,30–32
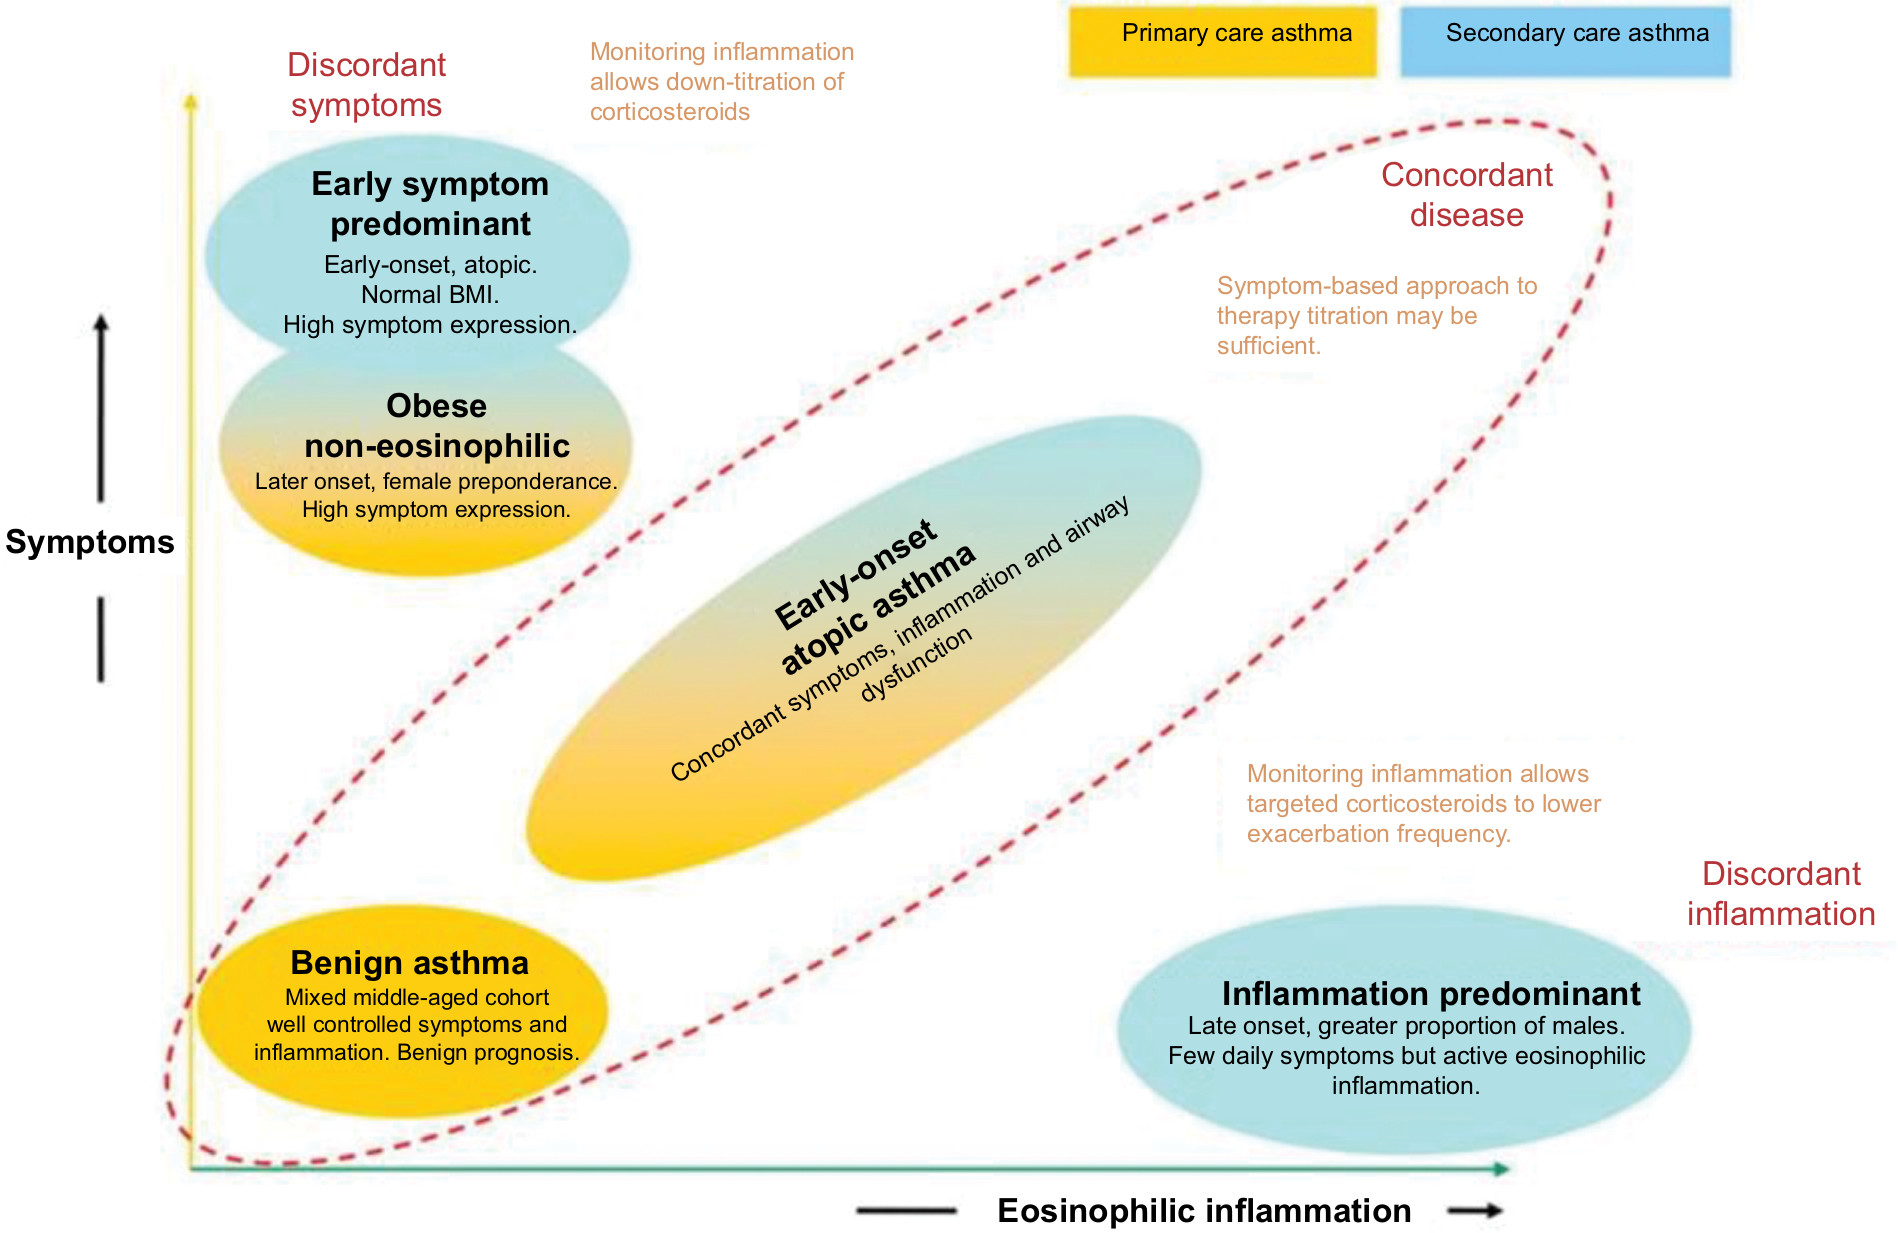 | Figure 1 Asthma phenotypes, based on cluster analysis. Notes: Reprinted with permission of the American Thoracic Society. Copyright© 2018 American Thoracic Society. Haldar P, Pavord ID, Shaw DE, Berry MA, Thomas M, Brightling CE, Wardlaw AJ, Green RH. Cluster analysis and clinical asthma phenotypes. Am J Respir Crit Care Med. 2008;178(3):218–24.7 The American Journal of Respiratory and Critical Care Medicine is an official journal of the American Thoracic Society. |
In this study, we examined if it is possible to identify asthma patients with one of three phenotypes identified in primary care by Haldar et al from electronic health records and report their characteristics and medication use. To accurately classify patients into a phenotype, strict criteria were applied. The exact criteria are described in the “Methods” section. Blood eosinophil tests were used as they are well recorded in Clinical Practice Research Datalink (CPRD), unlike sputum eosinophils.33
We used the CPRD GOLD database to identify asthma patients. To define asthma exacerbations, we also linked to the Hospital Episode Statistics (HES) and Office for National Statistics (ONS) data.
Aim and objectives
To evaluate the extent to which three previously suggested asthma phenotypes (benign asthma, atopic asthma, and obese non-eosinophilic asthma) could be identified using data included in routinely collected electronic health records and to assess the exacerbation frequency, clinical profile and medication use by phenotype.
Methods
Data sources
We used the July 2017 dataset of the CPRD, a large UK primary care database containing anonymized data of people registered with primary care practices from across the UK. CPRD is representative of the UK population with regard to age and sex.34,35 Diagnostic accuracy is high in CPRD, including for asthma and COPD,36–39 and CPRD can be used to identify individuals at risk of recurrent asthma attacks.40,41 Only patients with linkage to Hospital Episodes Statistics (HES) and ONS were considered for inclusion. Linked data are available for patients registered at consenting English practices. This study used only data on patients who were linked to Hospital Episodes Statistics (HES) for all hospital inpatient admissions and emergency visits and ONS for deaths and socioeconomic status through the index of multiple deprivation (IMD).
Study population and follow-up
Adult patients in CPRD (18 years of age or older) with linkage to HES and ONS and a validated asthma Read code between April 2007 and July 2017 in addition to a valid blood eosinophil count, body mass index (BMI) and determinable smoking status were eligible for inclusion.37 Patients entered the cohort at the latest date of: 1 year of follow-up from the practice up-to-standard (UTS) date (contributing research quality data to CPRD); reaching 18 years of age; available linkage and from April 2007 at earliest.
Once all these criteria were fulfilled, participants were assessed during one continuous year to assign them to one of the phenotypes. During this year, their reliever medication (short-acting beta agonist [SABA]) and maintenance treatment prescriptions (refer the “Definitions of covariates” section) were measured. The time point after 1 year when patients were assigned to a phenotype and after which exacerbations were measured was designated as the index date (Figure 2). We used SABA prescription count as proxy for symptom expression,42,43 as asthma symptoms are nonspecific and often not recorded in CPRD. Blood eosinophil counts, routinely recorded in primary care, were used as proxy for sputum eosinophil counts.33,41,44 Patients were assigned their phenotype group on index date, after which severe asthma exacerbations were ascertained and counted. Patients remained in their respective phenotype group and followed up until the earliest date of transfer-out of CPRD practice, last collection date, death or end of study period (01/07/2017).
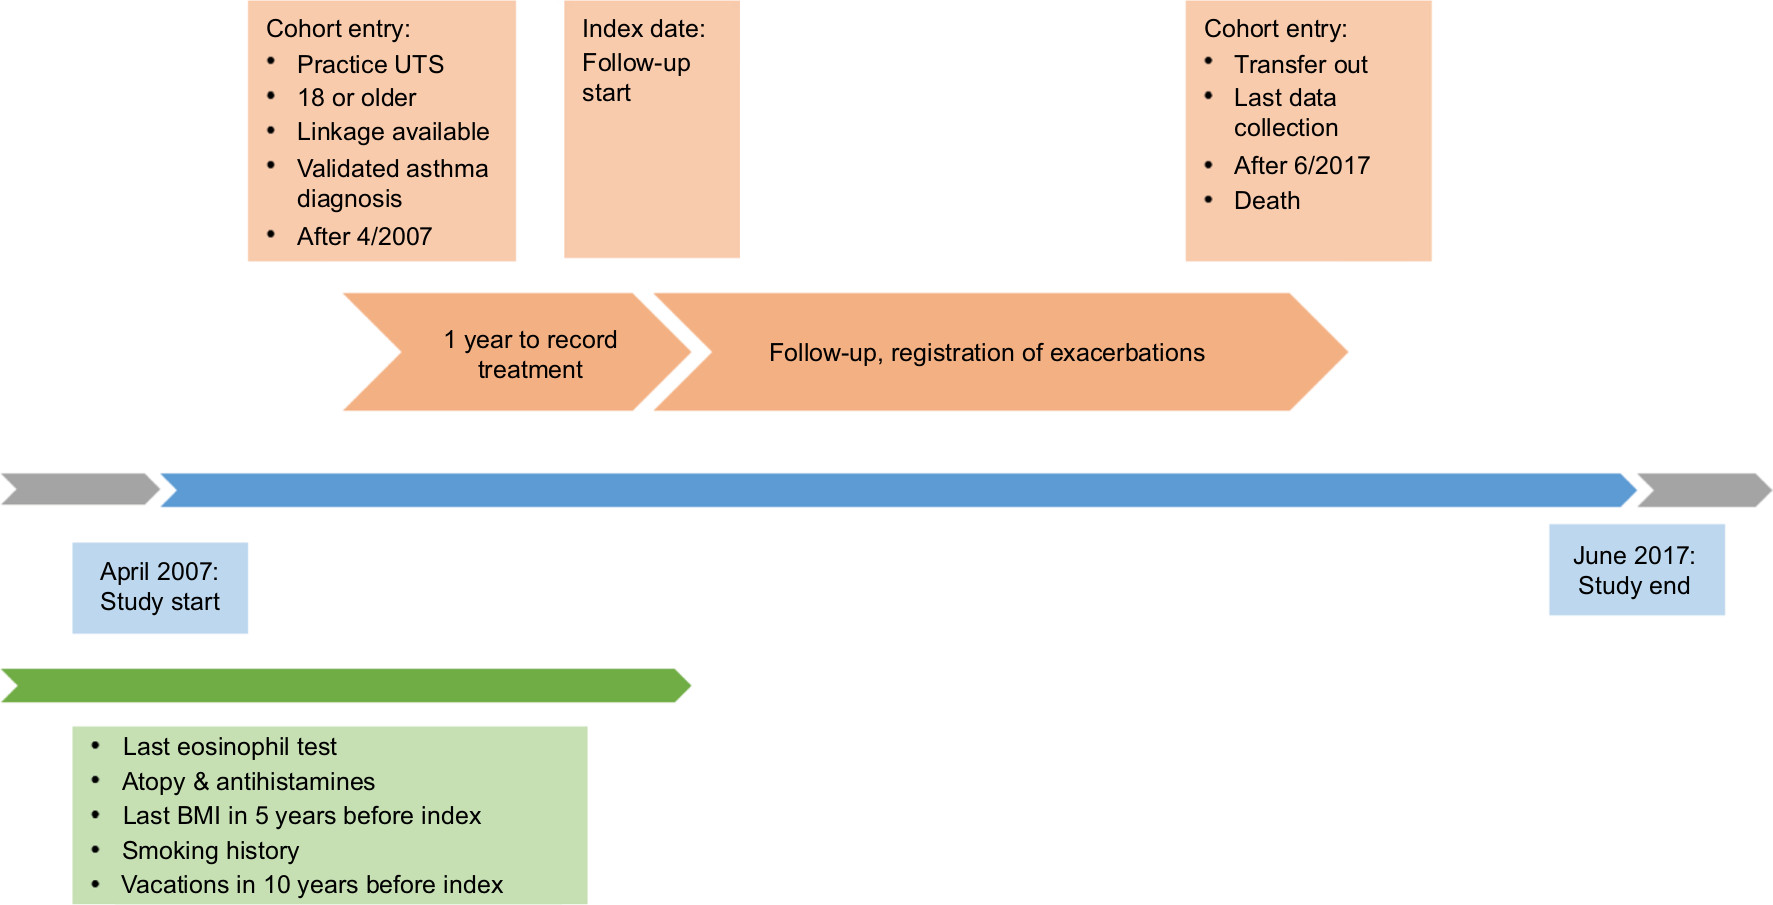 | Figure 2 Cohort timeline. Abbreviations: BMI, body mass index; UTS, up-to-standard. |
Definition of the phenotypes
Each patient was assigned to a single phenotype group on index date based on previously recorded information. Stringent inclusion criteria were used to keep the phenotype groups specific. All code lists for covariates and comorbidities are included in attachment and on Data compass. Patients were only allowed to be classified into a single phenotype. Obese non-eosinophilic asthma held priority over atopic asthma as the former phenotype was deemed more specific. Phenotype groups were defined as follows:
- Benign asthma: low eosinophil counts on the latest blood test from April 2007 onward (<300 cells/µL45,46 and <4% of leukocytes), absence of SABA prescriptions and of severe exacerbations of asthma in the year before index date, and aged 40–60 years at study entry. The term “benign asthma” may not be accurate since even mild and/or under treated patients may have lung inflammation. However, this term was kept as it was used in the cluster analysis7 and to avoid confusion in this paper.
- Atopic asthma: occasional SABA prescriptions (2–4 in year before index date, excluding 23% of patients without SABA prescriptions and 26% with 5+ prescriptions) and ≥1 atopy or ≥2 antihistamine codes ever recorded.
- Obese non-eosinophilic asthma: low eosinophil counts on the last blood count (ie, blood eosinophil levels less than 300 cells/µL and less than 4% of blood leukocytes), female, frequent SABA prescriptions (≥3 prescriptions in year before index date, which corresponds to 42% of patients) and at least one record for BMI >30 in last 5 years before index date.
- Asthma NOS (not otherwise specified): patients who did not fit in previous phenotypes were split into three subgroups: 1) patients without any asthma medication prescriptions, 2) patients only on SABA and 3) patients with at least one maintenance treatment prescription during the 1 year before index date. We described these groups to determine whether they fit other phenotypes described in the literature.
Definition of severe asthma exacerbations
An exacerbation was defined as any of the following: prescription of ≤300 mg oral corticosteroids (OCSs) outside an annual asthma review47 or an accidents & emergencies (A&E) visit, acute hospital visit of <1 day duration, overnight hospitalization or death due to asthma. This corticosteroid dose cutoff was chosen to eliminate chronic OCS use for other conditions than asthma. Exacerbations within 14 days of a previous exacerbation were excluded.
Definition of covariates
Age was defined in 10-year age bands, socioeconomic status was assigned at patient level using the ONS IMD. Smoking status was categorized as current smoker, ex-smoker or never-smoker. Comorbid conditions were determined by Read codes: COPD, atopic dermatitis, GORD (gastro-oesophageal reflux disease), atopy (eczema or rhinitis), anxiety and depression. Influenza and pneumococcal vaccinations during last 10 years were included as covariates. The final model was stratified by disease severity based on the stepwise approach in the 2016 British Thoracic Society/Scottish Intercollegiate Guidelines Network (BTS/SIGN) Asthma Management Guidelines, which includes inhaled corticosteroids (ICS) thresholds.47 Step 1 was defined by the absence of maintenance asthma treatment. Step 2 by regular prescription of low-dose ICS. Step 3 added long-acting beta agonist [(LABA]. Step 4 by medium-dose ICS with or without additional therapies (LABA, theophyllines, leukotriene receptor antagonists or long-acting antimuscarinics). Step 5 was defined by high-dose ICS and step 6 by continuous/frequent use of OCSs.
Data analyses
Baseline characteristics were tabulated for each phenotype. Asthma exacerbation incidence rates and rate ratios were calculated using negative binomial regression with a random effects model and lexis expansion for age. We used negative binomial regression over Poisson regression with overdispersion as it provides a better fit to the distribution of the data.48,49 The minimally adjusted model included age and sex only. The fully adjusted model additionally controlled for smoking status, BMI, socioeconomic status, GORD, pneumococcal and influenza vaccinations, anxiety, depression and COPD. In addition, we stratified incidence rate ratios (IRRs) by severity, defined by prescribed treatment. Stata 15.0 was used for data analysis. Results were displayed using forest plots and a Kaplan–Meier survival plot to display time to first exacerbation.
Results
Background characteristics
Of 323,862 asthma patients with complete linkages and eligible for inclusion, 193,999 (59.9%) had at least 1 year of follow-up and an eosinophil count, BMI value and smoking variables and formed the analysis population (Figure 3). Study participants were followed up for a median of 4.24 years (interquartile range [IQR]: 1.99–6.34); the median age at study entry was 51 years (IQR 37–66). About 65.3% were female and 63.5% were smokers or ex-smokers.
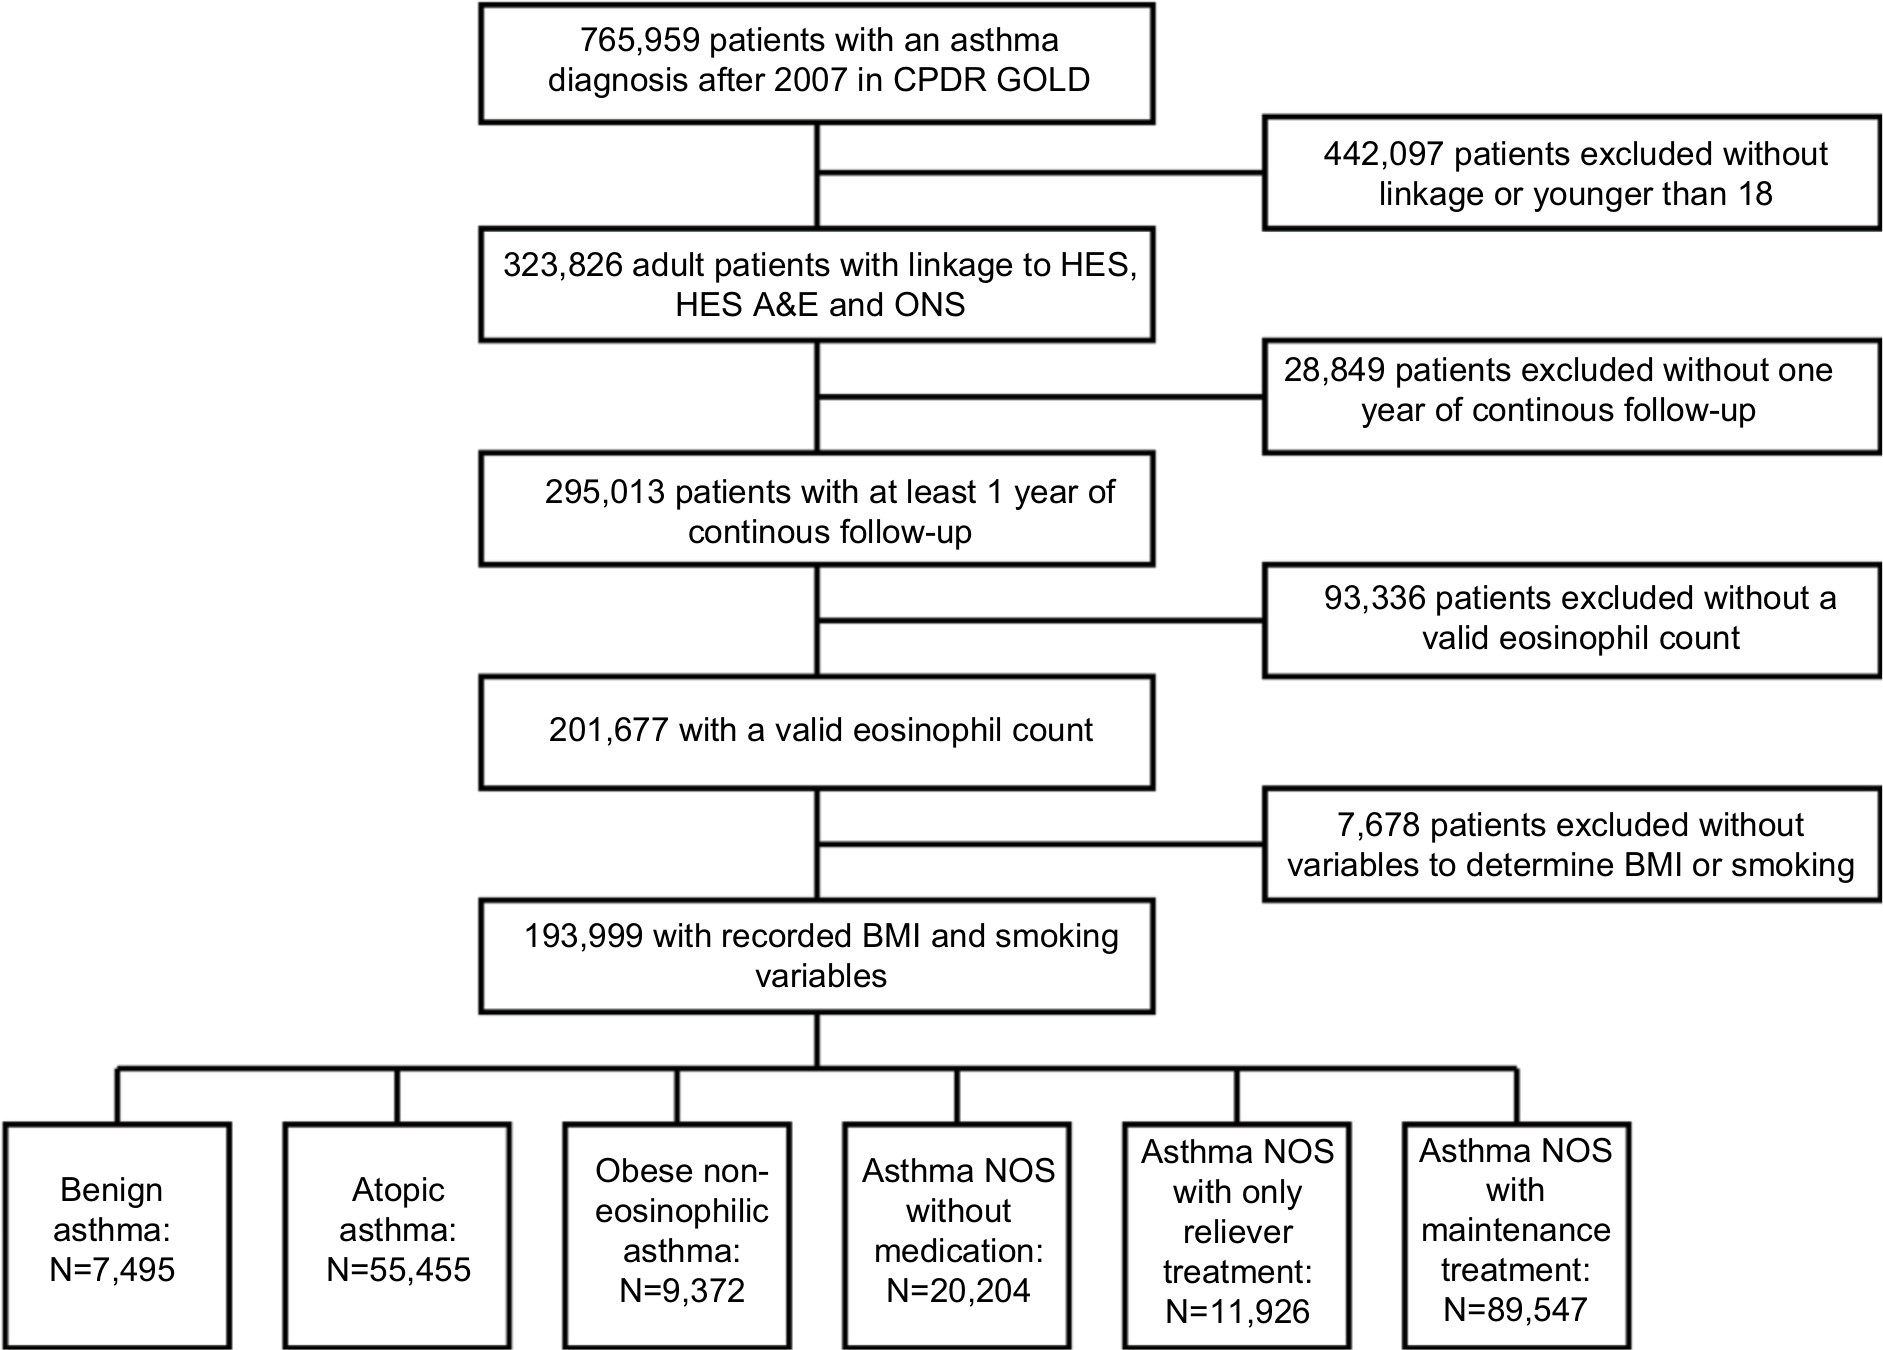 | Figure 3 Flowchart of study eligibility and participation. Abbreviations: BMI, body mass index; CPRD, Clinical Practice Research Datalink; HES, Hospital Episode Statistics; A&E, accidents and emergencies; ONS, Office for National Statistics; NOS, not otherwise specified. |
In this primary care asthma population, 7,495 (3.9%) were classified into the benign asthma group, 55,455 (28.6%) as atopic asthma and 9,372 (4.8%) as obese non-eosinophilic asthma (Table 1). Of the remaining patients classified as asthma NOS, 20,204 (10.4%) did not receive any asthma medication, 11,926 (6.1%) had only SABA prescription codes and 89,547 patients (46.2%) had maintenance treatment in the year before index date.
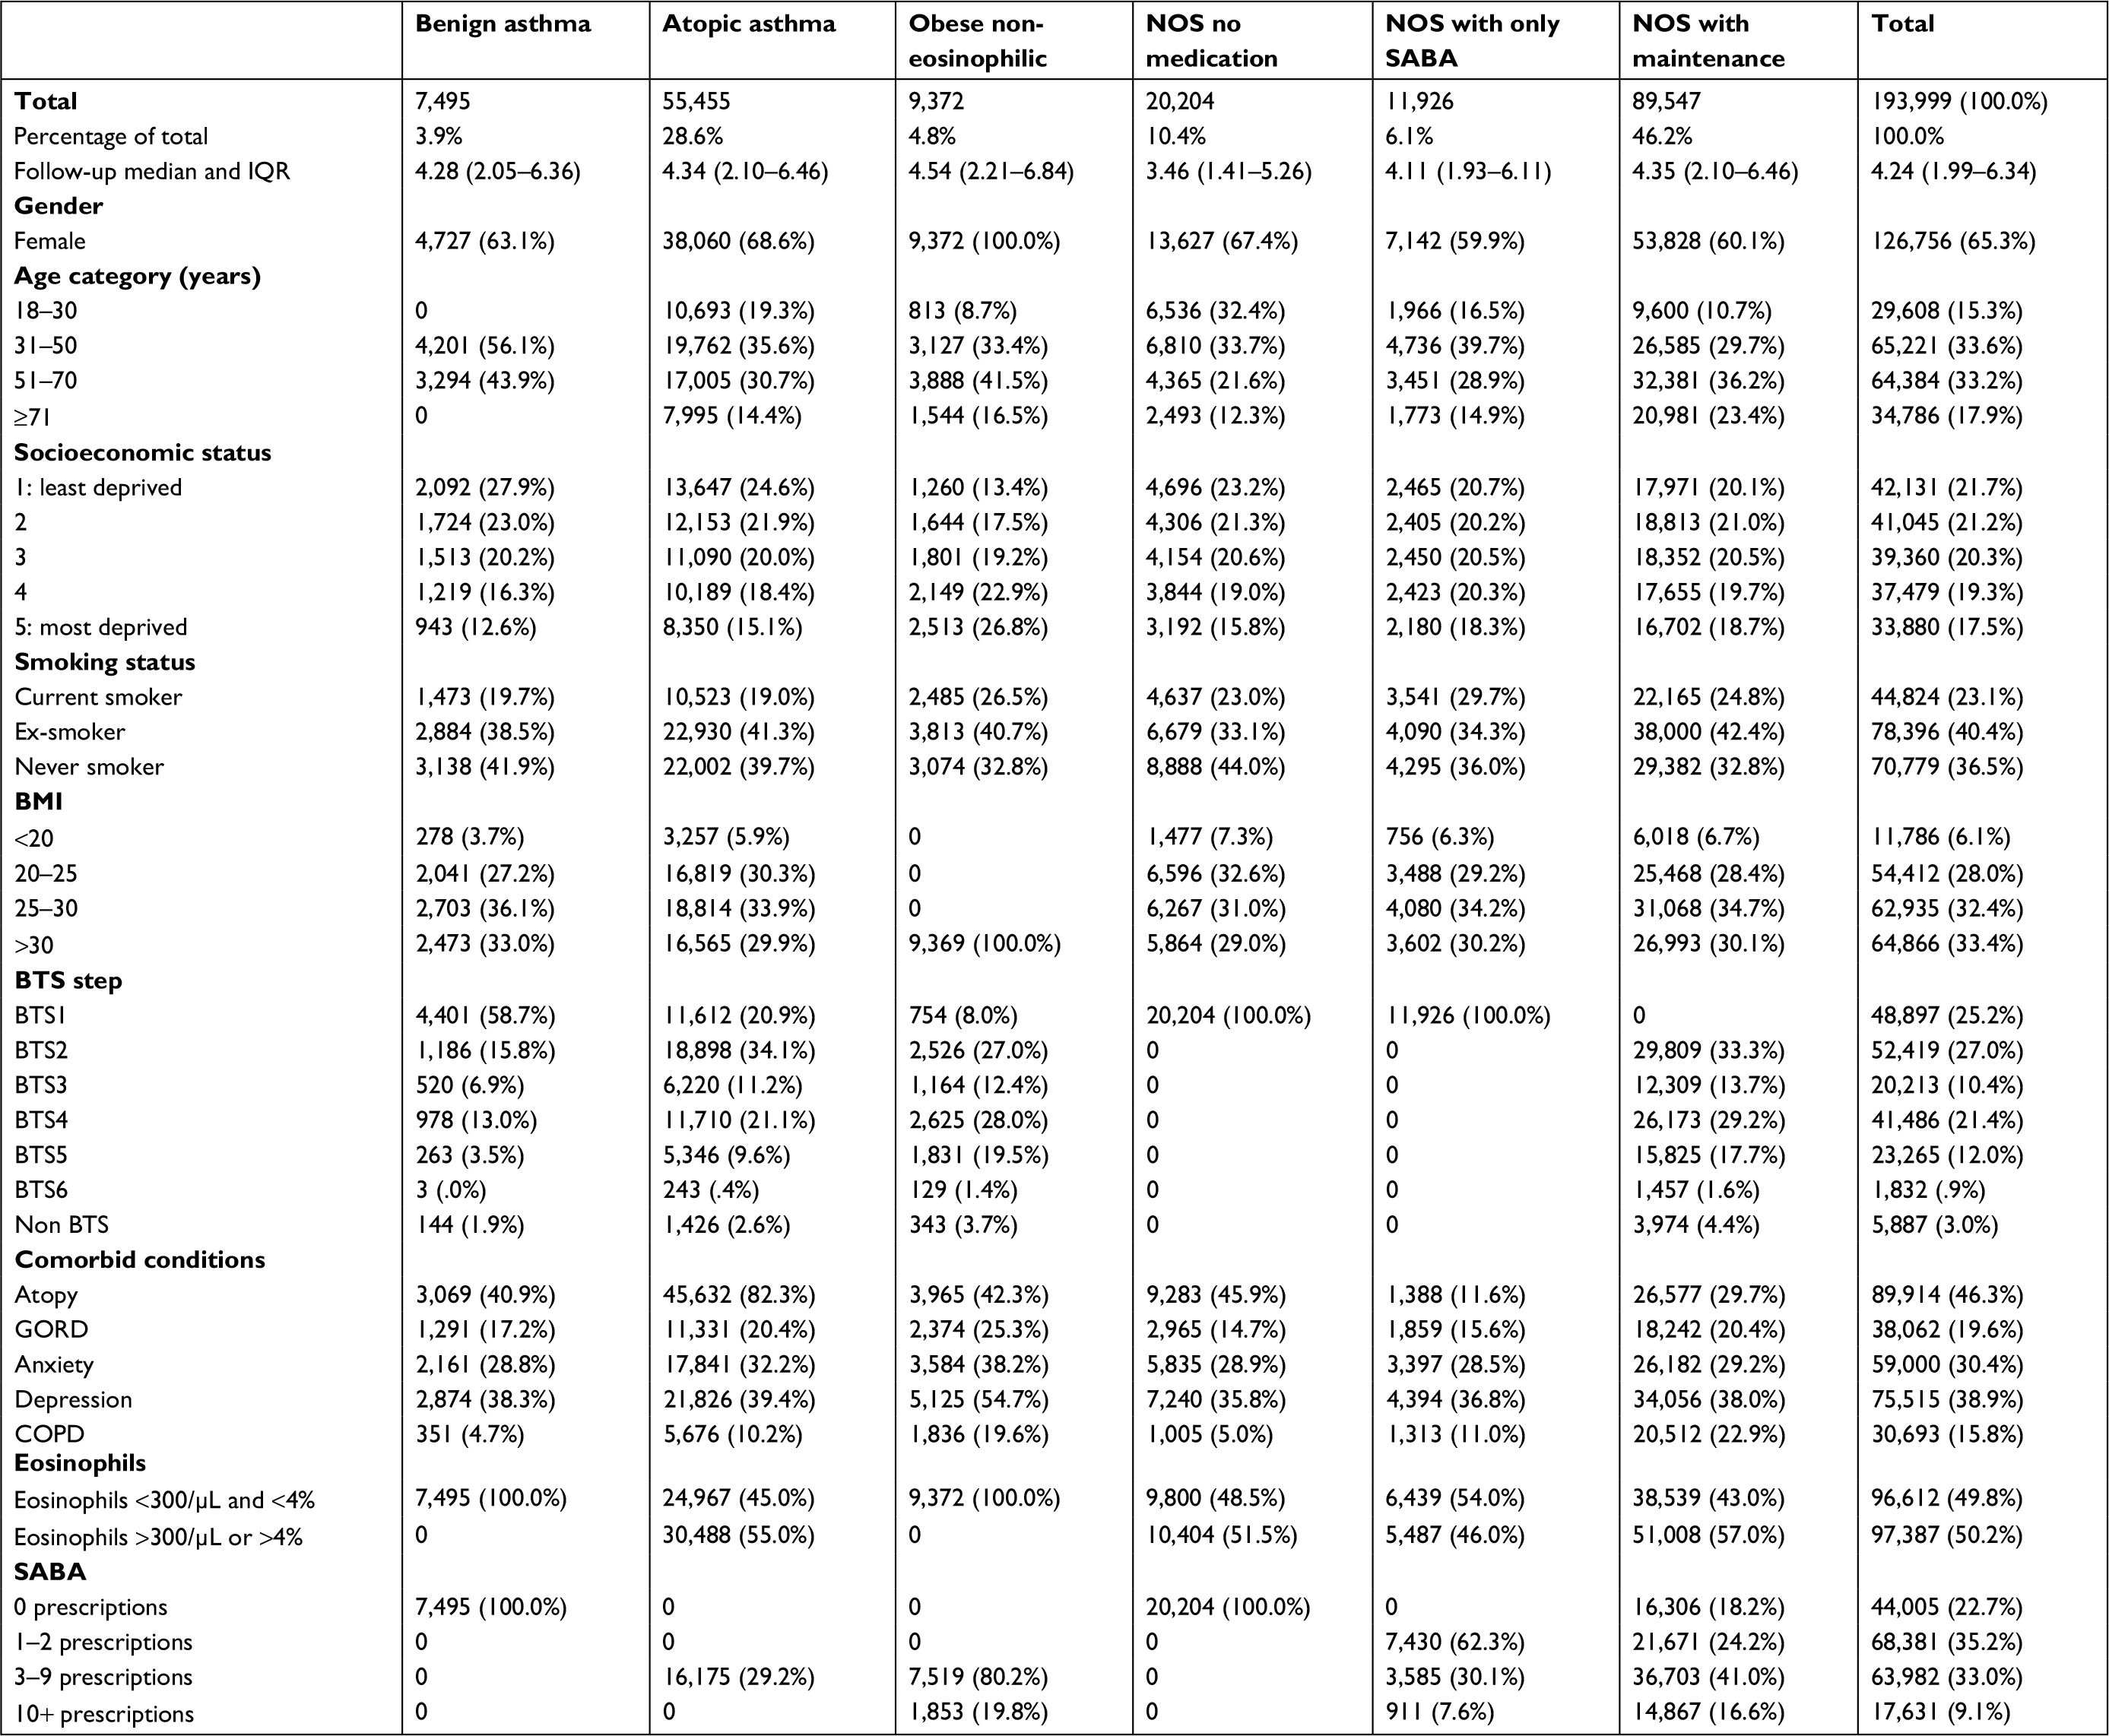 | Table 1 Baseline characteristics of the study population by phenotype Abbreviations: BMI, body mass index; BTS, British Thoracic Society; GORD, gastro-oesophageal reflux disease; NOS, not otherwise specified; SABA, short-acting beta agonist. |
The patient characteristics and total follow-up duration varied between phenotypes. The asthma NOS group with maintenance treatment had the highest mean age on study entry (55 years, SD 18 years). Average BTS step was highest in the same group (mean 3.38), followed by obese non-eosinophilic and atopic asthma (Figure 4). GORD and anxiety were most common in the obese non-eosinophilic group (25.3% and 38.2%, respectively), followed by atopic asthma and asthma NOS with maintenance treatment. Comorbid COPD was most common in the asthma NOS group with maintenance asthma treatment (22.9%). The last available eosinophil count was elevated in 50.2% of all patients and 65.8% were overweight or obese.
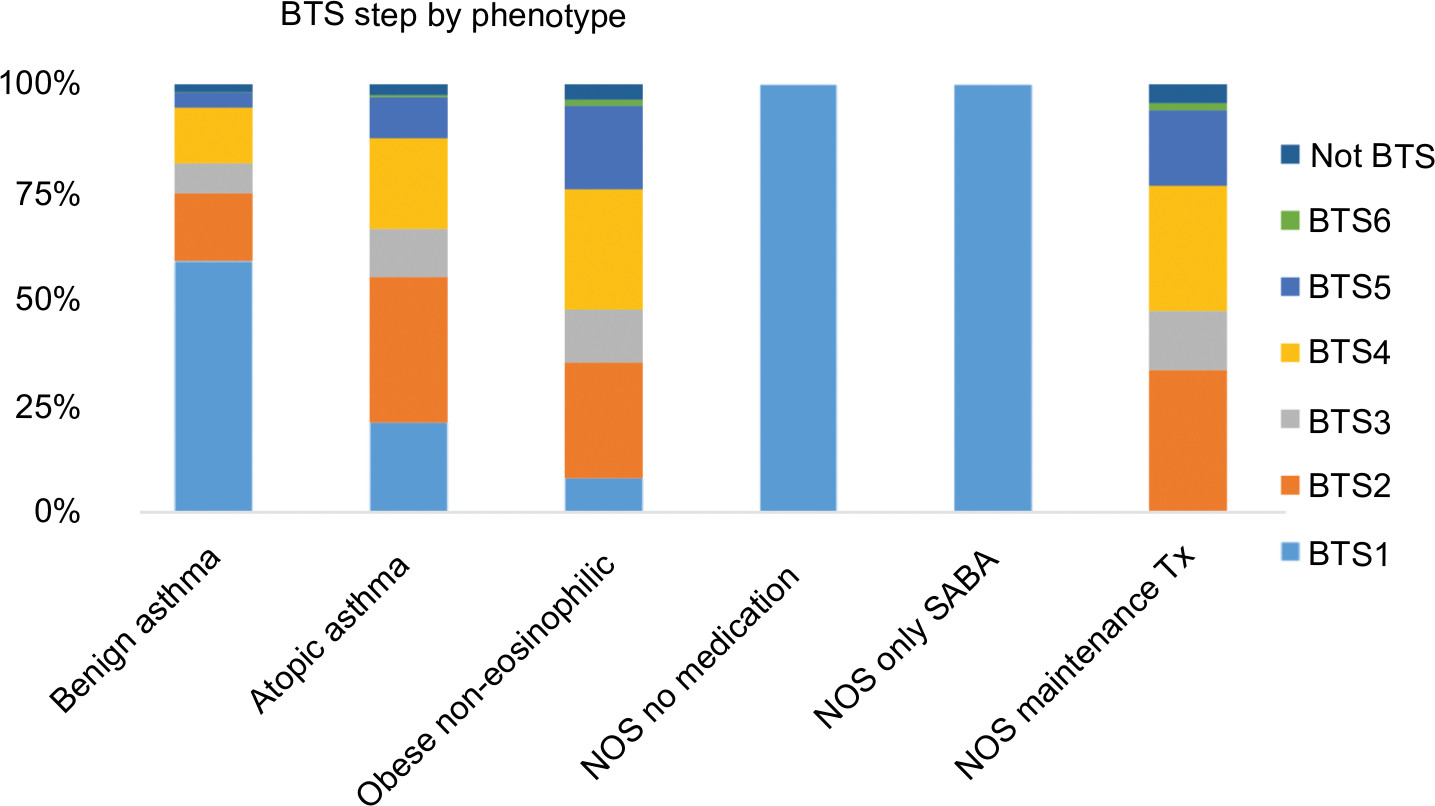 | Figure 4 BTS step by phenotype. Abbreviations: BTS, British Thoracic Society; eos, eosinophilic; NOS, not otherwise specified; SABA, short-acting beta agonist; Tx, treatment. |
Severe exacerbation rates
The study participants were followed for a total of 819,619 years and 258,388 exacerbations were recorded (Table 2). Exacerbation rates (per 1,000 person-years) were highest in the obese non-eosinophilic group and lowest in the benign asthma group. Minimally adjusted exacerbation rates per phenotype were as follows: 116.2 for benign asthma, 286.9 for atopic asthma, 454.9 for obese non-eosinophilic asthma, 148.1 for asthma NOS without medication, 208.6 for asthma with only SABA prescriptions and 389.4 for asthma NOS with maintenance medication.
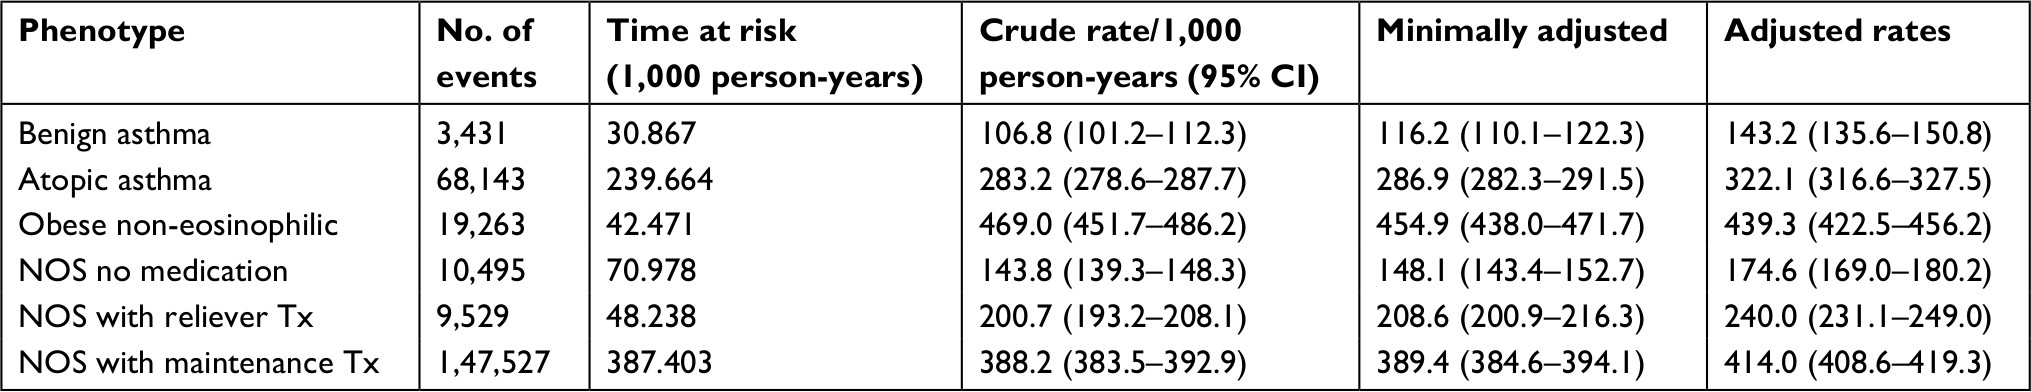 | Table 2 Exacerbation rates by phenotype Notes: Minimally adjusted: adjusted for age and sex. Adjusted rates: adjusted for age, sex, smoking, BMI, IMD, anxiety, depression, COPD, GORD, vaccination status and asthma treatment step. Unless otherwise indicated, values are given as rates (95% CI). Abbreviations: BMI, body mass index; GORD, gastro-oesophageal reflux disease; IMD, index of multiple deprivation; NOS, not otherwise specified; Tx, treatment. |
Fully adjusted exacerbation rates controlling for lifestyle factors and comorbidities show a similar relation between asthma phenotypes with event rates of 143.2 for benign asthma, 322.1 for atopic asthma, 439.3 for obese non-eosinophilic asthma, 174.6 for asthma NOS without medication, 240.0 for asthma NOS with only SABA prescriptions and 414.0 for asthma NOS with maintenance treatment.
Rate ratios
Benign asthma had the lowest rate of exacerbations and was used as reference group for the calculation of IRRs (Figure 5). IRRs (fully adjusted models) for asthma exacerbation were 2.28 (95% CI 2.16–2.41) for those with atopy, 3.11 (95% CI 2.91–3.32) for obese non-eosinophilic asthma, 1.23 (95% CI 1.16–1.31) for asthma NOS without medication, 1.69 (95% CI 1.58–1.80) for asthma NOS with SABA and 2.92 (95% CI 2.77–3.08) for asthma NOS with maintenance treatment. When stratified by BTS treatment step, the IRRs of all phenotypes compared to benign asthma decreased across all steps, but difference in incidence rates between the groups and benign asthma was still notable. Time to first exacerbation analysis showed a pattern comparable with rates derived by negative binomial regression (Figure 6). Shortest median time to exacerbation was observed in the obese non-eosinophilic asthma group, and longest in the benign asthma group. No clinically important interaction between phenotype and age or phenotype and gender was observed. Sensitivity analyses including patients with missing BMI or smoking status found similar results to the main analysis.
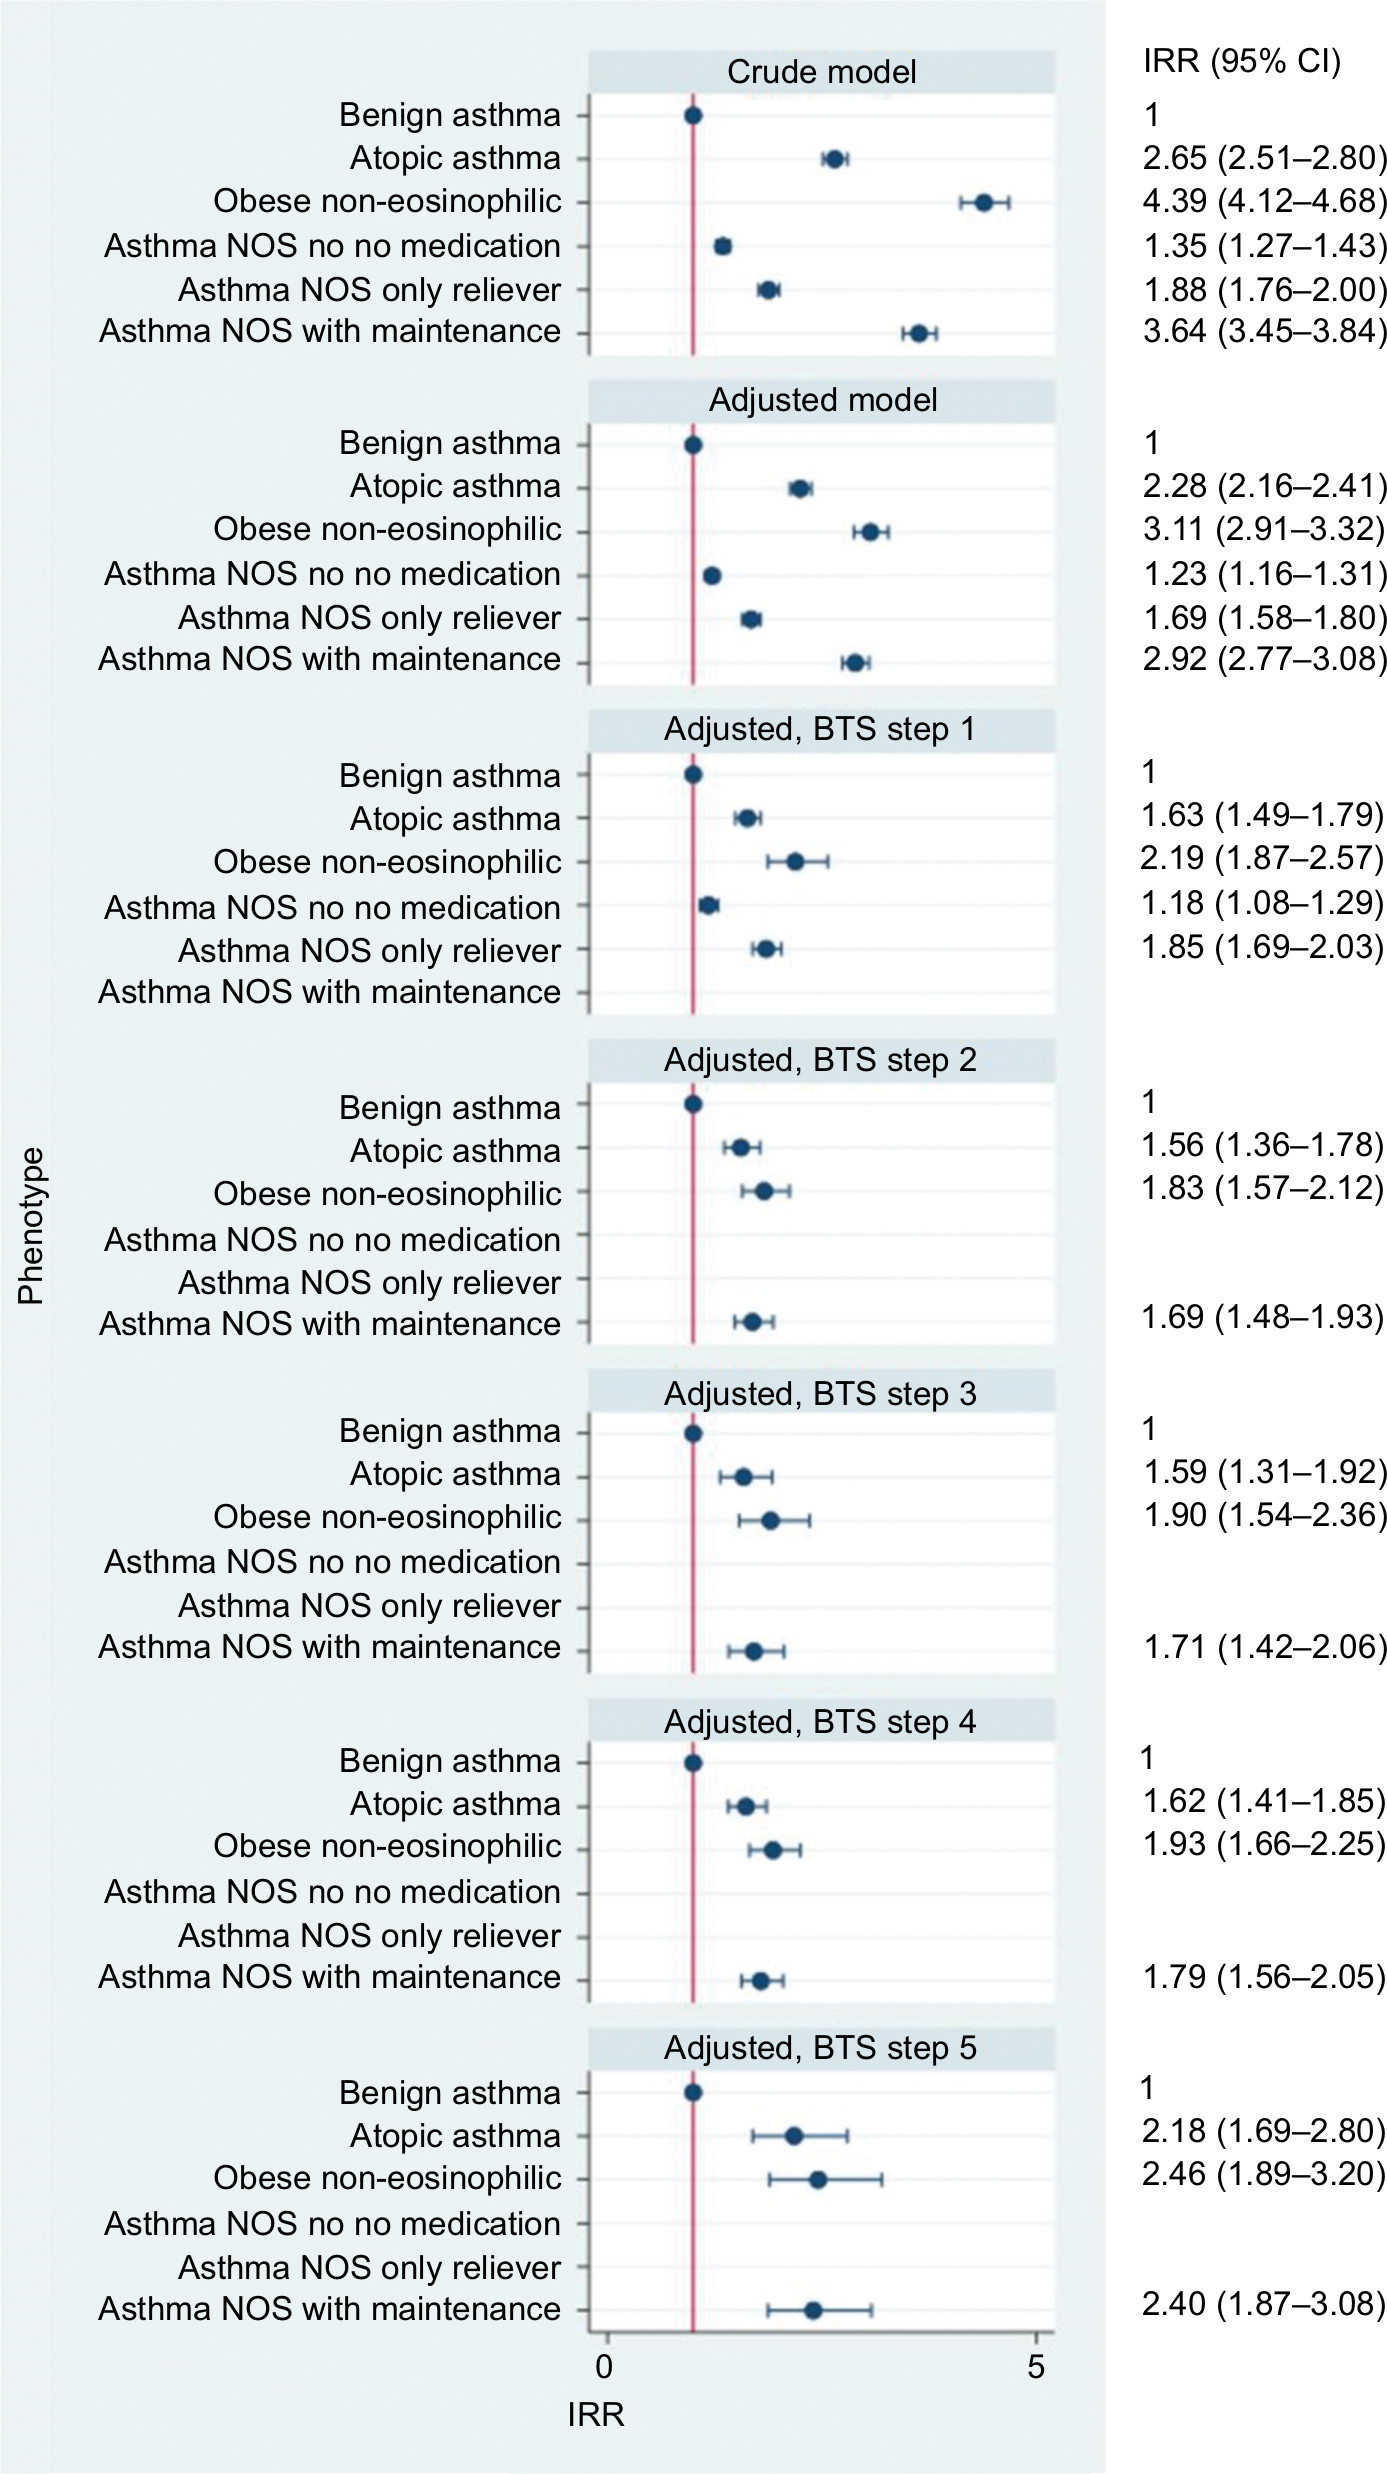 | Figure 5 IRRs, stratified by treatment step. Notes: Adjustment for step 6 resulted in very wide CIs due to low sample size. This made the forest plot unreadable, so this adjustment is not displayed. Abbreviations: BTS, British Thoracic Society; IRR, incidence rate ratio; med; medication; NOS, not otherwise specified. |
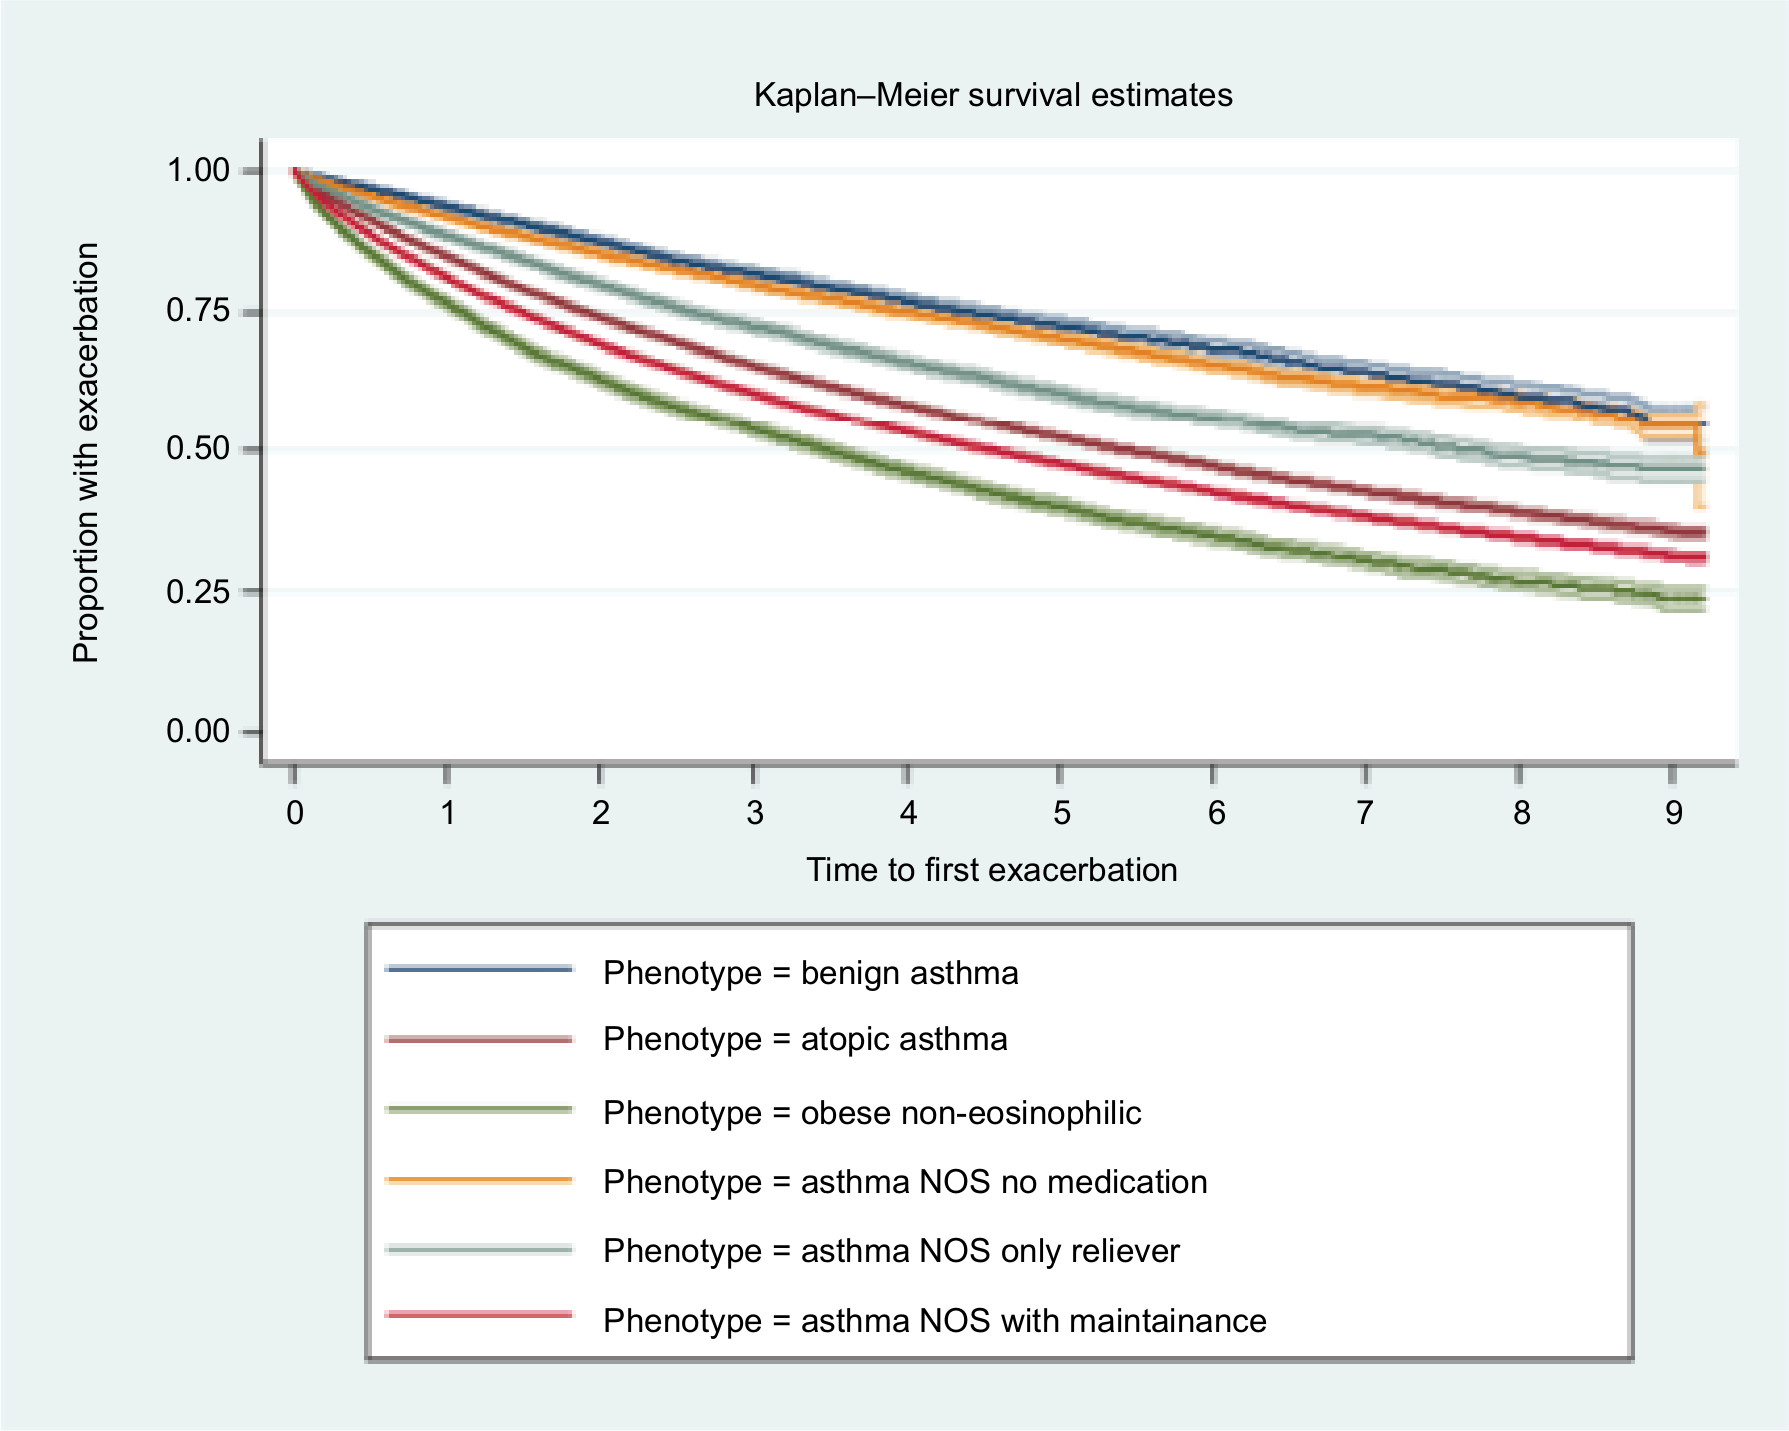 | Figure 6 Time to first exacerbation analysis in years, by phenotype and 95% confidence intervals. Abbreviation: NOS, not otherwise specified. |
Discussion
Summary
In this study on asthma phenotypes in a large general asthma population, we were able to identify patients who fitted three previously suggested phenotypes: benign, early-onset atopic and obese non-eosinophilic asthma. Large electronic health record (EHR) databases may be used to identify cohorts for future study and sub analysis may be considered. Due to strict criteria used to define the three main phenotypes, most patients with asthma (62.7%) were not included in any of the three predefined primary care phenotypes and were categorized as asthma NOS. Patients in the asthma NOS groups partly reflected some of the established phenotypes, for example, inflammation predominant or early symptom predominant phenotypes. For example, in the asthma NOS with maintenance treatment group, 57.0% of patients had high eosinophil counts; possibly indicating some patients with an inflammation predominant phenotype were included in this group. However, these patients also had more SABA prescriptions (and presumably more symptoms) than the total cohort. This group may include undiagnosed COPD patients based on their higher average age and treatment step. There was a higher exacerbation burden in those with obese non-eosinophilic atopic asthma, and a lower exacerbation rate in those with benign asthma compared to the asthma NOS group (with and without medication) in the crude model. These rate differences persisted after adjustment for lifestyle factors and comorbidities. When stratifying the patients by treatment step, differences in incidence rates between phenotypes remained but were decreased. Phenotyping a greater proportion of asthma patients based on their primary care health records could be possible by either constructing different phenotypes or by creating more complete records (for example, more full blood counts). However, this might not be the most efficient way to offer precision medicine to asthma patients. The recently proposed treatable traits strategy6,50 might represent a better conceptual framework toward precision medicine for asthma than phenotyping using primary care EHR at this stage.51,52 This strategy focuses asthma management on single traits that are identifiable and treatable, such as airway inflammation (measured using eosinophil counts) or airflow limitation.6
There are multiple strengths to the current study. The CPRD GOLD is population-based and representative of the population of England34 which allows estimation of asthma phenotype prevalence, and the median length of follow-up is considerable (4.1 years). Further strengths include the detailed methods to define the dependent (exacerbation rate) and independent (phenotype) variable and the inclusion of exacerbations in primary, secondary and emergency care, in addition to asthma deaths. The asthma codes in the CPRD have been validated in a previous validation study using general practitioner (GP) questionnaires.37
Comparison with existing literature
In the past, phenotype categorization was mostly based on variables such as age of onset, severity, reaction to treatment or comorbidities. More recently, cluster analysis of clinical variables including airflow measurements has been used to describe phenotypes. These cluster analyses have all been limited in terms of sample size7,9,15,30,31 or were preselected such as severe asthma populations.53 To the best of our knowledge, this is the first longitudinal study on a general population-wide asthma cohort. As such, it is difficult to draw direct comparisons between this population-based asthma study and previous phenotyping studies.
In the categorization by Haldar et al, the three phenotypes we focused on here were described in a primary care cohort of 184 patients. In this cohort, 96 (52%) patients had benign asthma, 61 (33%) had early-onset atopic asthma and 27 (15%) had obese non-eosinophilic asthma. In addition, two more phenotypes were identified from two separate populations (including a secondary care and a longitudinal study of mostly refractory patients). The early onset symptom predominant phenotype has high symptom expression and a tendency toward overtreatment, while the inflammation-predominant asthma phenotype has a lower symptom expression, but active eosinophilic inflammation. Another well-known categorization of asthma phenotypes was undertaken by Moore et al9 using cluster analysis in the USA Severe Asthma Research Program based on respiratory function and age-of-onset. While this analysis was heavily based on the latter (unfortunately routinely collected electronic records often lack information on age-of-onset), the obese non-eosinophilic asthma and early-onset atopic asthma were also identified. The exacerbation frequency is similar to those of previous studies on asthma exacerbation rates in the UK.40,41 Comparison of exacerbation rates between countries remains difficult without consensus on the definition of asthma.6,54
Limitations
The main limitation of this study is due to the nature of routinely collected data. For example, the CPRD does not hold information on the age of onset, which is one of the defining traits of the early-onset atopic asthma phenotype. Our inability to identify phenotype for a sizable proportion of the population highlights the need for developing phenotypes that can be more readily identified from routine care records, as well as the need for improving routine care records so that important phenotypes can be identified.
Residual confounding remains possible, despite the adjustment for several potential confounders. Misclassification of asthma is possible, but Read codes for asthma have a high positive predictive value (PPV) (86%) in CPRD.37 The exacerbation cutoff of ≤300 mg OCSs might have misclassified some patients. The blood eosinophil cutoff at <300 cells/µL for “eosinophilic asthma” is not absolute, and multiple different eosinophil levels are used in the literature.55–58 Blood eosinophil counts were used as they are a practical alternative to predict sputum eosinophilia and are available in the CPRD GOLD.59–61 Nonetheless, the original phenotypes were constructed using sputum eosinophilia.7 We included only people with full linkage; however, exclusions were at practice level so unlikely to bias estimates. Asthma phenotypes might change over follow-up, but this would remain true even in a cohort study identified in real time. Similarly, we assume eosinophil levels do not change greatly over time. This assumption may not always hold as eosinophil levels are fluid and depend on the level of steroid treatment and inflammation (such as hay fever or recent viral infections). CPRD contains information on only prescriptions of treatments, without information on adherence to those treatments. In the case of SABA prescriptions, not all reliever treatment that was prescribed is necessarily used. BTS guidelines evolve over the years, so the treatment step given might not correspond exactly to the step at the time of prescription. Nonetheless, the BTS 2016 guidelines were used for consistency. SABA prescriptions are an imperfect measure for asthma symptoms, as some practices may prescribe SABA as part of a patient’s repeat prescription, and some symptomatic patients may only use maintenance inhalers.
Conclusion
Primary care asthma phenotypes can be identified from large electronic health care databases, although a large proportion could not be classified. Exacerbation frequencies are lowest in the benign phenotype and highest for the obese non-eosinophilic phenotype. Phenotyping along with the knowledge of asthma treatment step could help anticipate future treatment needs but is only possible in a minority of asthma patients based on current phenotypes and primary care records.
Ethical approval
The protocol for this research was approved by the Independent Scientific Advisory Committee (ISAC) for MHRA Database Research (ISAC protocol 17_152A), the approved protocol was made available during peer review. Generic ethical approval for observational research using the CPRD with approval from ISAC has been granted by a Health Research Authority Research Ethics Committee (East Midlands – Derby, REC reference number 05/MRE04/87). Ethical approval for this study was also obtained from the London School of Hygiene and Tropical Medicine research ethics committee. All code lists for covariates and comorbidities are included in the Supplementary materials and on Data compass (http://datacompass.lshtm.ac.uk/).
Author contributions
All authors contributed to data analysis, drafting and revising the article, gave final approval of the version to be published, and agree to be accountable for all aspects of the work.
Disclosure
FN is funded by a GlaxoSmithKline (GSK) scholarship during his PhD program. IJD is funded by an unrestricted grant from, has consulted for, and holds stock in GSK. HM is an employee of GSK R&D and owns shares of GSK. JKQ’s research group has received funding from The Health Foundation, Medical Research Council, Wellcome Trust, British Lung Foundation, GSK, Insmed, AstraZeneca (AZ), Bayer and Boehringer Ingelheim (BI) for other projects, none of which relate to this work. JKQ has received funds from AZ, GSK, Chiesi, Teva and BI for Advisory board participation or travel. The authors report no other conflicts of interest in this work.
References
Pavord ID. Asthma phenotypes. Semin Respir Crit Care Med. 2012;33(6):645–652. | ||
Chung KF. Asthma phenotyping: a necessity for improved therapeutic precision and new targeted therapies. J Intern Med. 2016;279(2):192–204. | ||
Corren J. Asthma phenotypes and endotypes: an evolving paradigm for classification. Discov Med. 2013;15(83):243–249. | ||
Papi A, Brightling C, Pedersen SE, Reddel HK. Asthma. Lancet. 2018;391(10122):783–800. | ||
Weiner ESC, Simpson JA. The Oxford English Dictionary. Melbourne: Clarendon Press and New York: Oxford University Press; 2004. | ||
Pavord ID, Beasley R, Agusti A, et al. After asthma: redefining airways diseases. Lancet. 2018;391(10118):350–400. | ||
Haldar P, Pavord ID, Shaw DE, et al. Cluster analysis and clinical asthma phenotypes. Am J Respir Crit Care Med. 2008;178(3):218–224. | ||
Boudier A, Curjuric I, Basagaña X, et al. Ten-year follow-up of cluster-based asthma phenotypes in adults. A pooled analysis of three cohorts. Am J Respir Crit Care Med. 2013;188(5):550–560. | ||
Moore WC, Meyers DA, Wenzel SE, et al. Identification of asthma phenotypes using cluster analysis in the Severe Asthma Research Program. Am J Respir Crit Care Med. 2010;181(4):315–323. | ||
Jo KW, Ra SW, Chae EJ, et al. Three phenotypes of obstructive lung disease in the elderly. Int J Tuberc Lung Dis. 2010;14(11):1481–1488. | ||
Soriano JB, Davis KJ, Coleman B, Visick G, Mannino D, Pride NB. The proportional Venn diagram of obstructive lung disease: two approximations from the United States and the United Kingdom. Chest. 2003;124(2):474–481. | ||
Kim TB, Jang AS, Kwon HS, et al. Identification of asthma clusters in two independent Korean adult asthma cohorts. Eur Respir J. 2013;41(6):1308–1314. | ||
Loza MJ, Djukanovic R, Chung KF, et al. Validated and longitudinally stable asthma phenotypes based on cluster analysis of the ADEPT study. Respir Res. 2016;17(1):165. | ||
Heaney LG, Djukanovic R, Woodcock A, et al. Research in progress: Medical Research Council United Kingdom Refractory Asthma Stratification Programme (RASP-UK). Thorax. 2016;71(2):187–189. | ||
Ilmarinen P, Tuomisto LE, Niemelä O, Tommola M, Haanpää J, Kankaanranta H. Cluster Analysis on Longitudinal Data of Patients with Adult-Onset Asthma. J Allergy Clin Immunol Pract. 2017;5(4):967–978. | ||
Wardlaw AJ, Silverman M, Siva R, Pavord ID, Green R. Multi-dimensional phenotyping: towards a new taxonomy for airway disease. Clin Exp Allergy. 2005;35(10):1254–1262. | ||
Garcia-Aymerich J, Gómez FP, Benet M, et al. Identification and prospective validation of clinically relevant chronic obstructive pulmonary disease (COPD) subtypes. Thorax. 2011;66(5):430–437. | ||
Kostikas K, Clemens A, Patalano F. The asthma-COPD overlap syndrome: do we really need another syndrome in the already complex matrix of airway disease? Int J Chron Obstruct Pulmon Dis. 2016;11:1297–1306. | ||
Bonten TN, Kasteleyn MJ, de Mutsert R, et al. Defining asthma-COPD overlap syndrome: a population-based study. Eur Respir J. 2017;49(5):1602008. | ||
Moore WC, Fitzpatrick AM, Li X, et al. Clinical heterogeneity in the severe asthma research program. Ann Am Thorac Soc. 2013;10 Suppl:S118–S124. | ||
Haldar P, Pavord ID. Noneosinophilic asthma: a distinct clinical and pathologic phenotype. J Allergy Clin Immunol. 2007;119(5):1043–1052. | ||
Tan DJ, Walters EH, Perret JL, et al. Age-of-asthma onset as a determinant of different asthma phenotypes in adults: a systematic review and meta-analysis of the literature. Expert Rev Respir Med. 2015;9(1):109–123. | ||
Koczulla AR, Vogelmeier CF, Garn H, Renz H. New concepts in asthma: clinical phenotypes and pathophysiological mechanisms. Drug Discov Today. 2017;22(2):388–396. | ||
Spencer LA, Weller PF. Eosinophils and Th2 immunity: contemporary insights. Immunol Cell Biol. 2010;88(3):250–256. | ||
Brooks CR, van Dalen CJ, Zacharasiewicz A, et al. Absence of airway inflammation in a large proportion of adolescents with asthma. Respirology. 2016;21(3):460–466. | ||
Jones AC, Bosco A. Using network analysis to understand severe asthma phenotypes. Am J Respir Crit Care Med. 2017;195(11):1409–1411. | ||
Green RH, Pavord I. Stability of inflammatory phenotypes in asthma. Thorax. 2012;67(8):665–667. | ||
Pavord ID. Eosinophilic phenotypes of airway disease. Ann Am Thorac Soc. 2013;10 Suppl:S143–S149. | ||
Haughney J, Morice A, Blyth KG, et al. A retrospective cohort study in severe asthma describing commonly measured biomarkers: Eosinophil count and IgE levels. Respir Med. 2018;134:117–123. | ||
Weatherall M, Travers J, Shirtcliffe PM, et al. Distinct clinical phenotypes of airways disease defined by cluster analysis. Eur Respir J. 2009;34(4):812–818. | ||
Sutherland ER, Goleva E, King TS, et al. Cluster analysis of obesity and asthma phenotypes. PLoS One. 2012;7(5):e36631. | ||
Wenzel SE. Asthma phenotypes: the evolution from clinical to molecular approaches. Nat Med. 2012;18(5):716–725. | ||
Carr TF, Zeki AA, Kraft M. Eosinophilic and Noneosinophilic Asthma. Am J Respir Crit Care Med. 2018;197(1):22–37. | ||
Herrett E, Gallagher AM, Bhaskaran K, et al. Data Resource Profile: Clinical Practice Research Datalink (CPRD). Int J Epidemiol. 2015;44(3):827–836. | ||
Williams T, van Staa T, Puri S, Eaton S. Recent advances in the utility and use of the General Practice Research Database as an example of a UK Primary Care Data resource. Ther Adv Drug Saf. 2012;3(2):89–99. | ||
Herrett E, Thomas SL, Schoonen WM, Smeeth L, Hall AJ. Validation and validity of diagnoses in the General Practice Research Database: a systematic review. Br J Clin Pharmacol. 2010;69(1):4–14. | ||
Nissen F, Morales DR, Mullerova H, Smeeth L, Douglas IJ, Quint JK. Validation of asthma recording in the Clinical Practice Research Datalink (CPRD). BMJ Open. 2017;7(8):e017474. | ||
Rothnie KJ, Müllerová H, Hurst JR, et al. Validation of the Recording of Acute Exacerbations of COPD in UK Primary Care Electronic Healthcare Records. PLoS One. 2016;11(3):e0151357. | ||
Quint JK, Müllerova H, Disantostefano RL, et al. Validation of chronic obstructive pulmonary disease recording in the Clinical Practice Research Datalink (CPRD-GOLD. BMJ Open. 2014;4(7):e005540. | ||
Bloom C. I. Exacerbation risk and characterisation of the UK’s asthma population from infants to old age. Thorax. 2017. | ||
Price D, Wilson AM, Chisholm A, et al. Predicting frequent asthma exacerbations using blood eosinophil count and other patient data routinely available in clinical practice. J Asthma Allergy. 2016;9:1–12. | ||
Zeiger RS, Schatz M, Li Q, et al. High blood eosinophil count is a risk factor for future asthma exacerbations in adult persistent asthma. J Allergy Clin Immunol Pract. 2014;2(6):741–750. | ||
Zemedkun K, Woldemichael K, Tefera G. Assessing control of asthma in Jush, Jimma, South West Ethiopia. Ethiop J Health Sci. 2014;24(1):49–58. | ||
Kostikas K, Brindicci C, Patalano F. Blood eosinophils as biomarkers to drive treatment choices in asthma and COPD. Curr Drug Targets. 2018;19(16):1882–1896. | ||
Humbert M, Taillé C, Mala L, et al. Omalizumab effectiveness in patients with severe allergic asthma according to blood eosinophil count: the STELLAIR study. Eur Respir J. 2018;51(5):1702523. | ||
Husereau D, Goodfield J, Leigh R, Borrelli R, Cloutier M, Gendron A. Severe, eosinophilic asthma in primary care in Canada: a longitudinal study of the clinical burden and economic impact based on linked electronic medical record data. Allergy Asthma Clin Immunol. 2018;14:15. | ||
BTS/SIGN. British guideline on the management of asthma [webpage on the Internet]. London: 2016. Available from https://www.brit-thoracic.org.uk/standards-of-care/guidelines/btssign-british-guideline-on-the-management-of-asthma/. Accessed December 27, 2018. | ||
Keene ON, Jones MR, Lane PW, Anderson J. Analysis of exacerbation rates in asthma and chronic obstructive pulmonary disease: example from the TRISTAN study. Pharm Stat. 2007;6(2):89–97. | ||
Keene ON, Calverley PM, Jones PW, Vestbo J, Anderson JA. Statistical analysis of exacerbation rates in COPD: TRISTAN and ISOLDE revisited. Eur Respir J. 2008;32(1):17–24. | ||
Agustí A, Bafadhel M, Beasley R, et al. Precision medicine in airway diseases: moving to clinical practice. Eur Respir J. 2017;50(4):1701655. | ||
Agusti A, Bel E, Thomas M, et al. Treatable traits: toward precision medicine of chronic airway diseases. Eur Respir J. 2016;47(2):410–419. | ||
Pavord ID, Wardlaw AJ. The A to E of airway disease. Clin Exp Allergy. 2010;40(1):62–67. | ||
Lee JH. Identification of subtypes in subjects with mild-to-moderate airflow limitation and its clinical and socioeconomic implications. Int J Chron Obs. Pulmon Dis. 2017;12:1135–1144. | ||
GINA [homepage on the Internet]. Global Strategy for Asthma Management and Prevention 2016. Available from: www.ginasthma.org. 2016. Accessed November 13, 2018. | ||
Nadif R, Siroux V, Oryszczyn MP, et al. Heterogeneity of asthma according to blood inflammatory patterns. Thorax. 2009;64(5):374–380. | ||
Ortega H, Katz L, Gunsoy N, Keene O, Yancey S. Blood eosinophil counts predict treatment response in patients with severe eosinophilic asthma. J Allergy Clin Immunol. 2015;136(3):825–826. | ||
Pavord ID, Korn S, Howarth P, et al. Mepolizumab for severe eosinophilic asthma (DREAM): a multicentre, double-blind, placebo-controlled trial. Lancet. 2012;380(9842):651–659. | ||
Deeks ED. Mepolizumab: A review in eosinophilic asthma. BioDrugs. 2016;30(4):361–370. | ||
Schleich FN, Manise M, Sele J, Henket M, Seidel L, Louis R. Distribution of sputum cellular phenotype in a large asthma cohort: predicting factors for eosinophilic vs neutrophilic inflammation. BMC Pulm Med. 2013;13:11. | ||
Wagener AH, de Nijs SB, Lutter R, et al. External validation of blood eosinophils, FE(NO) and serum periostin as surrogates for sputum eosinophils in asthma. Thorax. 2015;70(2):115–120. | ||
Zhang XY, Simpson JL, Powell H, et al. Full blood count parameters for the detection of asthma inflammatory phenotypes. Clin Exp Allergy. 2014;44(9):1137–1145. |
 © 2019 The Author(s). This work is published and licensed by Dove Medical Press Limited. The full terms of this license are available at https://www.dovepress.com/terms.php and incorporate the Creative Commons Attribution - Non Commercial (unported, v3.0) License.
By accessing the work you hereby accept the Terms. Non-commercial uses of the work are permitted without any further permission from Dove Medical Press Limited, provided the work is properly attributed. For permission for commercial use of this work, please see paragraphs 4.2 and 5 of our Terms.
© 2019 The Author(s). This work is published and licensed by Dove Medical Press Limited. The full terms of this license are available at https://www.dovepress.com/terms.php and incorporate the Creative Commons Attribution - Non Commercial (unported, v3.0) License.
By accessing the work you hereby accept the Terms. Non-commercial uses of the work are permitted without any further permission from Dove Medical Press Limited, provided the work is properly attributed. For permission for commercial use of this work, please see paragraphs 4.2 and 5 of our Terms.