")
Back to Journals » Patient Preference and Adherence » Volume 15
Clinical Inertia and 2-Year Glycaemic Trajectories in Patients with Non-Newly Diagnosed Type 2 Diabetes Mellitus in Primary Care: A Retrospective Cohort Study
Authors An LW, Li XL, Chen LH, Tang H, Yuan Q, Liu YJ, Ji Y, Lu JM
Received 6 July 2021
Accepted for publication 27 October 2021
Published 11 November 2021 Volume 2021:15 Pages 2497—2508
DOI https://doi.org/10.2147/PPA.S328165
Checked for plagiarism Yes
Review by Single anonymous peer review
Peer reviewer comments 2
Editor who approved publication: Dr Naifeng Liu
Ling-Wang An,1 Xiang-Lan Li,1 Lin-Hui Chen,2 Hong Tang,3 Qun Yuan,4 Yan-Jun Liu,5 Yu Ji,6 Ju-Ming Lu1,7
1Department of Endocrinology, Beijing Ruijing Diabetes Hospital, Beijing, 100079, People’s Republic of China; 2Department of Endocrinology, Taiyuan Diabetes Hospital, Taiyuan, 030013, People’s Republic of China; 3Department of Share-Care Center, Chengdu Ruien Diabetes Hospital, Chengdu, 610000, People’s Republic of China; 4Department of Endocrinology, Heilongjiang Ruijing Diabetes Hospital, Harbin, 150009, People’s Republic of China; 5Department of Endocrinology, Lanzhou Ruijing Diabetes Hospital, Lanzhou, 730000, People’s Republic of China; 6Department of Endocrinology, Beijing Aerospace General Hospital, Beijing, 100076, People’s Republic of China; 7Department of Endocrinology, The General Hospital of the People’s Liberation Army, Beijing, 100853, People’s Republic of China
Correspondence: Ju-Ming Lu
Department of Endocrinology, The General Hospital of the People’s Liberation Army, No. 28 of Fuxing Road, Haidian District, Beijing, 100853, People’s Republic of China
Tel +86 10 8822 9999
Email [email protected]
Objective: To analyse diabetes treatment, treatment change and self-management behaviours in association with 2-year glycaemic trajectories in patients with non-newly diagnosed type 2 diabetes mellitus in Chinese primary care.
Methods: This was an observational, multi-centre, longitudinal, retrospective cohort study. Clinical data of 4690 subjects were extracted from electronic medical records, including serial glycated haemoglobin A1c (HbA1c) measurements, antidiabetic medication records and compliance to exercise, diet, medications and self-monitoring of blood glucose (SMBG). Patterns of longitudinal HbA1c trajectories were identified using the percentage of HbA1c measurements < 7.5% from the second available HbA1c measurement. Clinical relevance of the clusters was assessed through multivariable analysis.
Results: Approximately half of the participants demonstrated good glycaemic control; of these, 34.5% demonstrated stable, good control, and 13.7% demonstrated relatively good control. About 16.2% demonstrated moderate control, and 35.6% demonstrated poor control. From the good to poor control groups, the percentage of subjects treated with insulin at baseline and during the follow-up period increased gradually, while the percentage of subjects adhering to exercise, diet, medications and SMBG decreased gradually. Compared with baseline, the adherence to exercise, diet, medications and SMBG improved significantly. Approximately 50% and 26% of subjects in the two poorest control groups, respectively, experienced treatment changes. After multivariable adjustments, baseline HbA1c ≥ 7.5%, HbA1c change ≥− 0.5% from baseline to visit 1, insulin treatment, treatment change, poor adherence to diet, exercise, SMBG during the follow-up period and HbA1c measurements < 3 per year were significantly associated with poorer glycaemic control.
Conclusion: We identified four longitudinal HbA1c trajectories in patients with non-newly diagnosed type 2 diabetes. Even if baseline HbA1c is suboptimal, aggressive treatment changes, good adherence during the follow-up period, ≥ 3 HbA1c measurements per year and reducing HbA1c levels to a certain extent by the first follow-up visit were important for good, stable, long-term glycaemic control.
Keywords: haemoglobin A1c, self-monitoring of blood glucose, diabetes, glycaemic trajectories, glycaemic control
Introduction
The difficulty of managing blood glucose levels lies in long-term blood glucose control, and glycated haemoglobin A1c (HbA1c) is often used to evaluate the effect of this. The serial measurements of HbA1c can form a trajectory that reflects the long‐term glycaemic control of diabetes for each patient. Previous analysis has suggested that HbA1c trajectories can be categorized into several distinct patterns.1 Cumulative glycaemic exposure over time has also been used to categorise HbA1c trajectories.2 The most commonly identified patterns were good, stable glycaemic control found in 56%–82.5% of patients with newly diagnosed type 2 diabetes and in 53.2% of patients with diabetes of a duration ≥3 years.3–6 Patients may benefit from early good glycaemic control and be inclined to develop a long-term good, stable HbA1c trajectory thereafter. In McCoy’s report, 95.5% of patients with stable, controlled diabetes kept a stable HbA1c trajectory during the follow-up period.7 Unstable patterns identified included an increasing HbA1c trend, a decreasing HbA1c trend, stable moderate glycaemic control (eg HbA1c of 7.4%–7.8%) or stable, poor control (eg extremely high but stable HbA1c of 9.4%–10.2%).4–6 All non-stable trajectories were associated with higher incidences of microvascular events.3 In Rozing’s report, an increase in HbA1c levels in the first year after diagnosis were associated with later diabetes-related morbidity and mortality, while an increase in HbA1c levels during the first six years after diagnosis was associated with later (6–19 years) microvascular complications.8 Therefore, it is important to help patients achieve good glycaemic control in the first year after diagnosis or registration and keep it stable subsequently.
Two main reasons for suboptimal glycaemic control were identified in clinical practice: (1) patient non-adherence to prescribed treatment, and (2) clinical or therapeutic inertia, defined as the failure to start therapy or adhere to its intensification and non-intensification when appropriate.9,10 The causes of clinical inertia included three classes of factors: (1) those related to the healthcare professionals (eg failure to set clear goals or to titrate treatment to achieve them); (2) those related to the patients (eg lifestyle factors, emotional or behavioural obstacles); (3) those related to the national healthcare system (eg no clinical guidelines, no disease register or team approach to care).10
There are few Chinese studies exploring the distinct long-term glycaemic trajectories and associated factors in patients with non-newly diagnosed type 2 diabetes in primary care. This retrospective cohort study aimed to investigate two aspects: (1) patterns of HbA1c trajectories shown as cumulative glycaemic exposure, as measured by repeated HbA1c values in follow-up tests ≥12 months after registration/management; (2) risk factors for poor glycaemic control and clinical inertia originating from healthcare professionals (treatment titration) and patients (adherence to healthy diet, activity, self-monitoring of blood glucose [SMBG] and medications).
Materials and Methods
Settings and Data Source
In 2015, Ruijing Diabetes Chain Hospitals (RDCH, five primary care medical institutions in China) promoted a share-care model to improve diabetes management. From 2016, they used a share-care information system to collect and register information of people with diabetes. The demographic and clinical variables recorded in the database included age, gender, ethnicity, marital status, education, occupation, smoking status and alcohol consumption, diabetes type, family history, date of diagnosis, history of hypertension, dyslipidaemia, malignant neoplasms (all types), liver diseases (steatosis, hepatitis, cirrhosis), macrovascular complications (including ischaemic heart disease [angina, acute myocardial infarction, heart failure], stroke, transient ischaemic attack and peripheral arterial disease) and microvascular complications (including diabetic retinopathy, diabetic kidney disease [DKD] and diabetic neuropathy). Body mass index (BMI), blood pressure, blood lipid levels, HbA1c, self-management behaviours and medication information were also collected and recorded after registration. Patients were asked to check these parameters regularly according to Chinese guidelines during the follow-up visits and discuss them with their physicians for appropriate treatment titration. Patients received structured education from a nursing educator or dietitian from the share-care model management.
Study Design
This was an observational, multi-centre, longitudinal, retrospective study based on medical records included in a diabetes share-care system database of the RDCH. All data were aggregated for each person after registration (to form a baseline) and during each follow-up visit. The analysis was based on individuals with a documented onset date of type 2 diabetes and clinical visits after diagnosis and during the follow-up period. This study was conducted in accordance with the Declaration of Helsinki and approved by the ethics committee of Beijing Ruijing Diabetes Hospital. Due to the nature of the study (ie retrospective database searching), patient consent was not required. We confirm that the data used in this article is anonymous or confidential.
Study Population
For the present study, all those with type 2 diabetes aged 30–80 years and ≥30 years at the onset of diabetes were included. The inclusion criteria were: (1) ≥3 recorded HbA1c values during the follow-up period; (2) follow-up duration ≥12 months; (3) disease duration ≥3 years. Patients were excluded from the study if they had a history of type 1 diabetes, gestational diabetes and/or secondary diabetes, malignant tumour, serious liver (alanine aminotransferase ≥3 times normal upper limit) or kidney (estimated glomerular filtration rate <30 mL/min per 1.73 m2) disease, dialysis, diabetic foot ulcer, were blind or had no medical records for baseline HbA1c, creatinine or BMI. The inclusion period extended from 1 January 2016 to 31 December 2019, with a minimum follow-up of 12 months per patient from the inclusion date. The final cohort comprised 4690 adults with non-newly diagnosed type 2 diabetes.
Medication and Diabetes Self-Management Behaviours
Medication information for registration and follow-up visits was obtained. Treatment was categorised as therapy without insulin, therapy with insulin or combinations with oral antidiabetic drugs (such as metformin). Treatment must be adjusted in a timely manner when the blood glucose control is poor. Treatment change was defined as change in any treatment category in any of the follow-up visits compared with the registration day. Lack of change in antidiabetic treatment during the follow-up period was taken as clinical inertia originating from healthcare professionals.
Diabetes self-management behaviour information was collected according to the Chinese version of the diabetes self-care behaviour scale, including diet, exercise, SMBG and medication adherence in the previous seven days.11 Good compliance was defined as following the health professionals’ recommendations ≥5 days per week, including a healthy diet plan, exercise for at least 30 minutes a day, SMBG and use of prescribed antidiabetic medications. Poor adherence to healthy diet, activity, SMBG and the medication regime during the follow-up period was taken as clinical inertia originating from patients.
Longitudinal HbA1c Measurements and Categories
HbA1c measurements were tested with high-performance liquid chromatography and standardized according to the Diabetes Control and Complications Trial.12 Clinical measurements of HbA1c were obtained from the laboratory database from the time of cohort entry to the end of the follow-up period. Beginning with their second available HbA1c measurement, patients were categorized into four groups based on the percentage of HbA1c measurements <7.5%: Group 1 was ≥90% of HbA1c measurements <7.5%; Group 2 was 60%–89% of HbA1c measurements <7.5%; Group 3 was 30%–59% of HbA1c measurements <7.5%; and Group 4 was <30% of HbA1c measurements <7.5%. The frequency of HbA1c measurements per year for each patient was calculated as the total number of HbA1c measurements divided by their total follow-up duration in years.
Statistical Analysis
Patient characteristics were summarised using mean and standard deviation (SD), median and interquartile range (IQR), or number (percentage). Age, diabetes duration, BMI and HbA1c measurements are described by SD and IQR, and other indicators are described by n (%). After the normality test, patient characteristics of the four HbA1c subgroups were compared using the following tests: one‐way analysis of variance tests for continuous variables with a normal distribution; Kruskal–Wallis’ tests for continuous variables with a skewed distribution; and Pearson’s Chi‐squared tests for categorical variables. Multinomial logistic regression models were used to investigate which variables were associated with the respective HbA1c trajectory groups. Results are given as odds ratios with 95% confidence intervals. A two-sided P value of <0.05 was considered as statistically significant. All analyses were performed using SPSS Statistics 22.0.
Results
Patient Characteristics
The final analytic cohort comprised 4690 individuals (median age at cohort entry 61.75 years old; 52.8% male) (Table 1). The median duration of diabetes was 9.58 years (IQR 6.33–14.25 years), and the prevalence of diabetic retinopathy, diabetic kidney disease and neuropathy, as diagnosed,13–15 at recruitment were 17.7%, 13.7% and 55.6%, respectively. The median follow-up time was 24.0 months (IQR 18.0–29.0 months) with 51.2% of subjects followed up for ≥24 months, and the median number of HbA1c measurements was 4 (IQR 3–6).
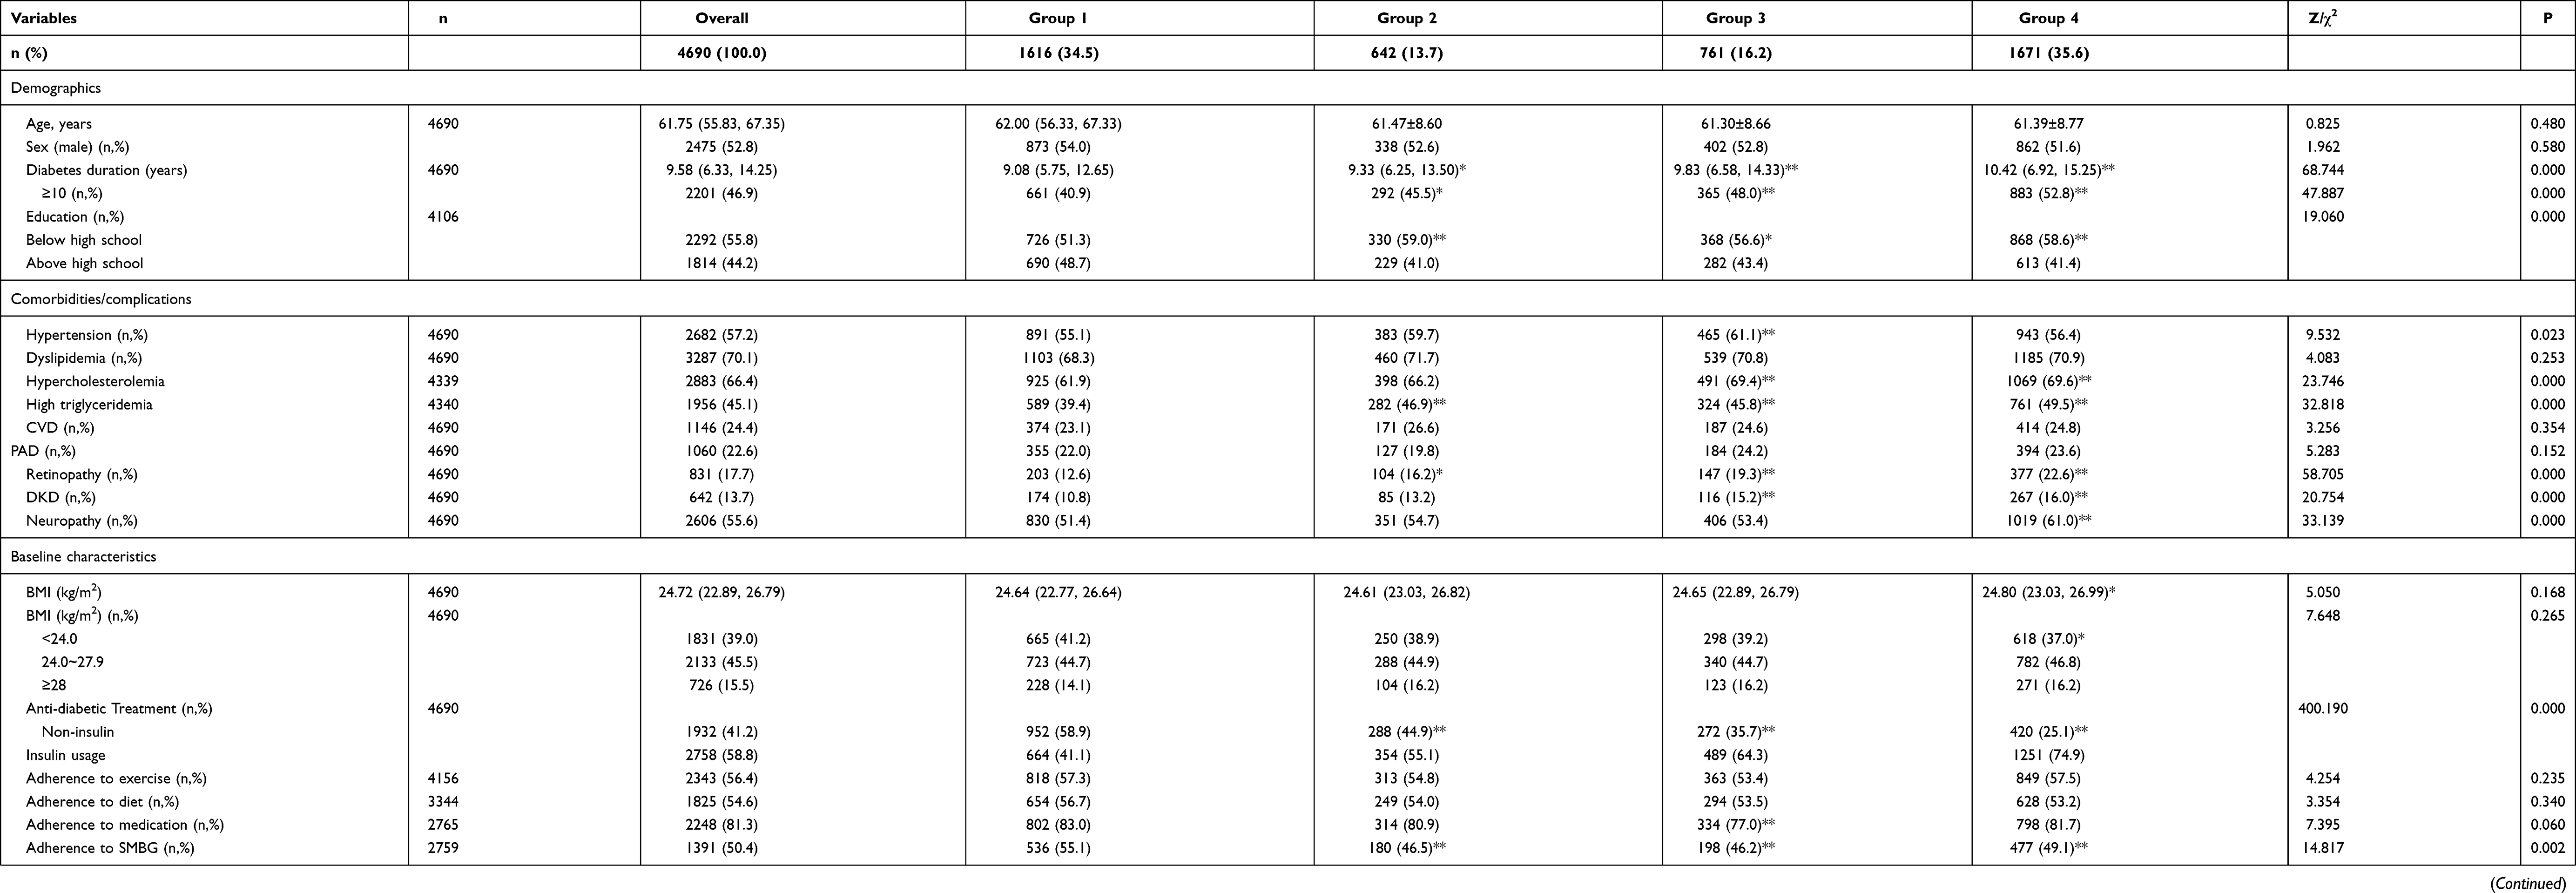 |
Table 1 Demographic and Clinical Characteristics for the Overall Study Population and for the 4 Groups with Different Cumulative Glycaemic Exposures |
HbA1c Trajectories
Based on the longitudinal HbA1c categories, we identified four patterns of HbA1c trajectories (Figure 1, Table 2). The subjects in Group 1 had stable, good HbA1c levels (n=1616, 34.5%) with a median baseline HbA1c of 6.6% and follow-up HbA1c measurements ≤6.50%. The subjects in Group 2 had relatively good HbA1c levels (n=642, 13.7%) with a median baseline HbA1c of 7.1% and follow-up HbA1c measurements ≤7.20%. The subjects in Group 3 had moderately controlled HbA1c levels (n=761, 16.2%) with a median baseline HbA1c of 7.7%, follow-up HbA1c measurements ≤7.60%, and 28.7% of subjects had an HbA1c change ≥−1.0% from baseline to visit 1. The subjects in Group 4 had continuously poor HbA1c levels (n=1671, 35.6%) with a median baseline HbA1c of 8.7%, follow-up HbA1c measurements ≤8.70%, and 20.9% of subjects had an HbA1c change ≥−1.0% from baseline to visit 1.
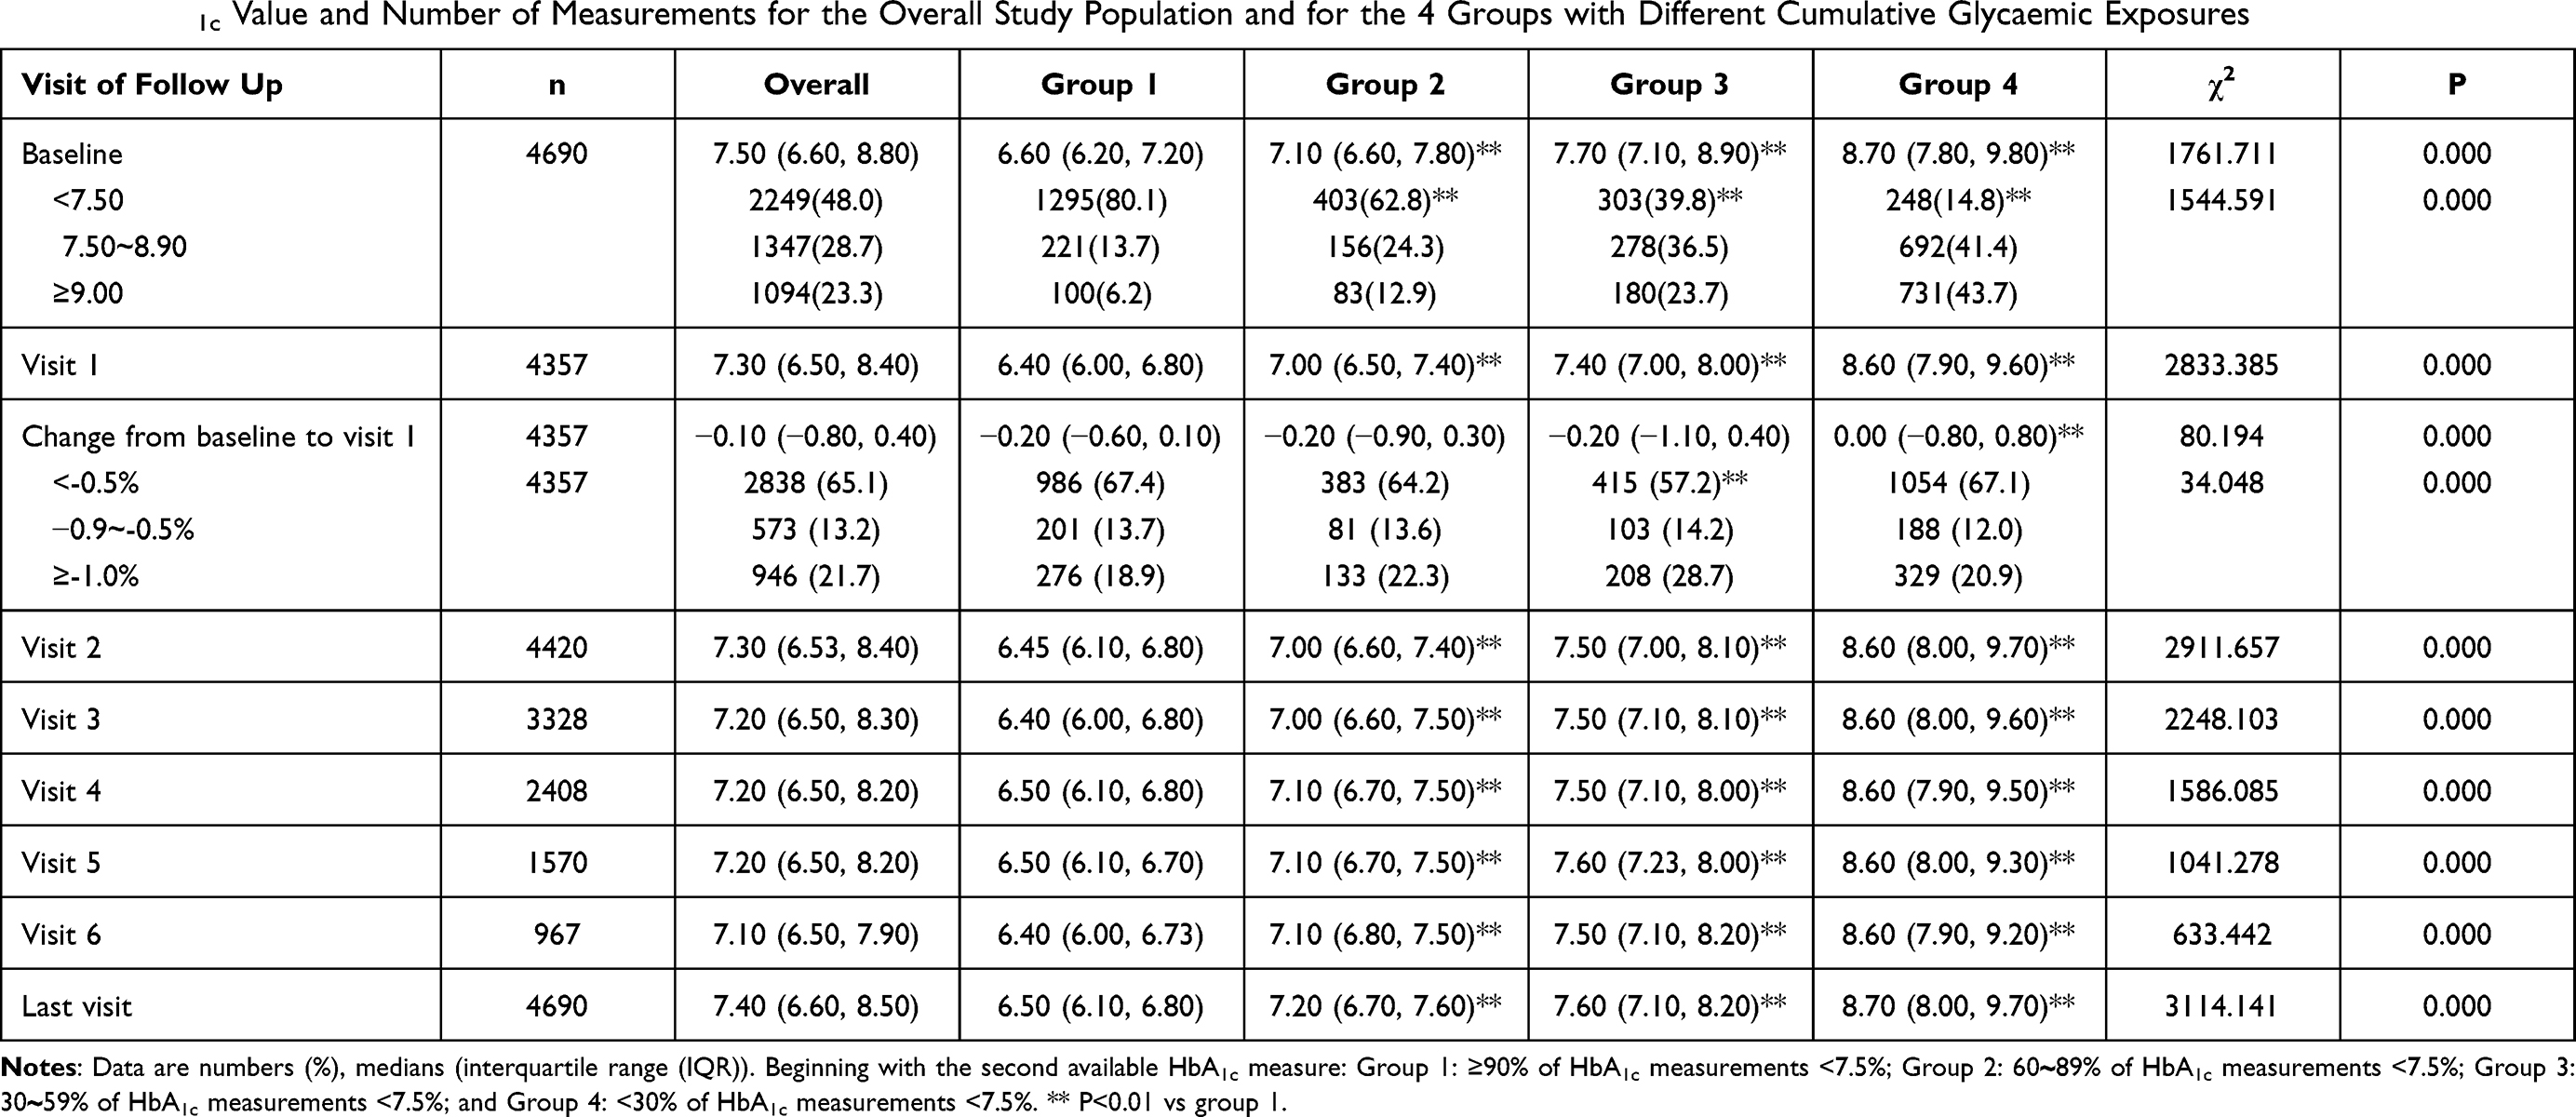 |
Table 2 HbA1c Value and Number of Measurements for the Overall Study Population and for the 4 Groups with Different Cumulative Glycaemic Exposures |
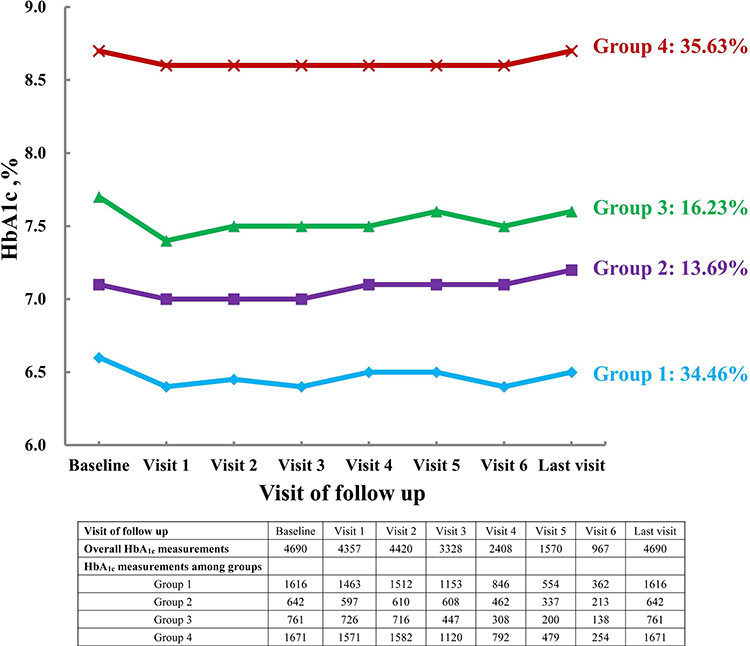 |
Figure 1 Four HbA1c trajectories during the median of 2 years follow up in 4690 subjects with non-newly diagnosed Type 2 diabetes. Blue curve: group 1 with stable good glycaemic control; violet curve: group 2 with relative good glycaemic control; green curve: group 3 with moderate glycaemic control; red curve: group 4 with continuously poor glycaemic control. |
Clinical Inertia
From Group 1 to Group 4, the diabetes duration and percentage of subjects having a diabetes duration ≥10 years and microvascular complications (retinopathy and DKD) increased gradually. Subjects in the three poorer control groups had a lower education level than those in Group 1.
From Group 1 to Group 4, the percentage of subjects treated with insulin at baseline (41.1%–74.9%) and during the follow-up period (39.6%–75.3%) increased gradually, while the percentage of subjects adhering to exercise, diet, medications and SMBG decreased gradually. In Group 1, 59.3% of subjects had unchanged treatment plans. Compared with the baseline, the adherence to exercise, diet, medications and SMBG improved significantly in the overall group and Group 1 to Group 3. Significantly improved adherence to exercise and medications was also found in Group 4. A higher proportion of subjects were managed with the share-care model (51.2%–57.0%) and had changed treatment plans (44.8%–48.8%) in the three poorer control groups than in Group 1. The highest proportion of subjects being followed up ≥24 months (59.3%) and having HbA1c measurements ≥3 times (44.5%) per year was found in Group 2. Compared with Group 1, only 26.3% of subjects checked HbA1c ≥3 times per year in Group 3 and Group 4. (Table 1).
Multinomial Logistic Regression Analysis
Factors related to clinical inertia shown as insulin treatment, treatment change, poor adherence to diet, exercise, SMBG during the follow-up period and <3 HbA1c measurements per year were still significant after multivariable adjustment. Diabetic retinopathy, baseline HbA1c ≥7.5%, insulin treatment and poor adherence to diet during the follow-up period were associated with a higher chance of belonging to the three groups with poorer glycaemic control; while HbA1c change ≥−0.5% from baseline to visit 1 was associated with a lower chance of belonging to these three groups (reference group: Group 1; Table 3). Treatment change and <3 HbA1c measurements per year were associated with a higher chance of belonging to Group 3 or Group 4. Poor adherence to exercise and SMBG were additional factors associated with a higher chance of belonging to Group 4. Education below high school level and poor adherence to SMBG during the follow-up period were associated with a higher chance of belonging to Group 2.
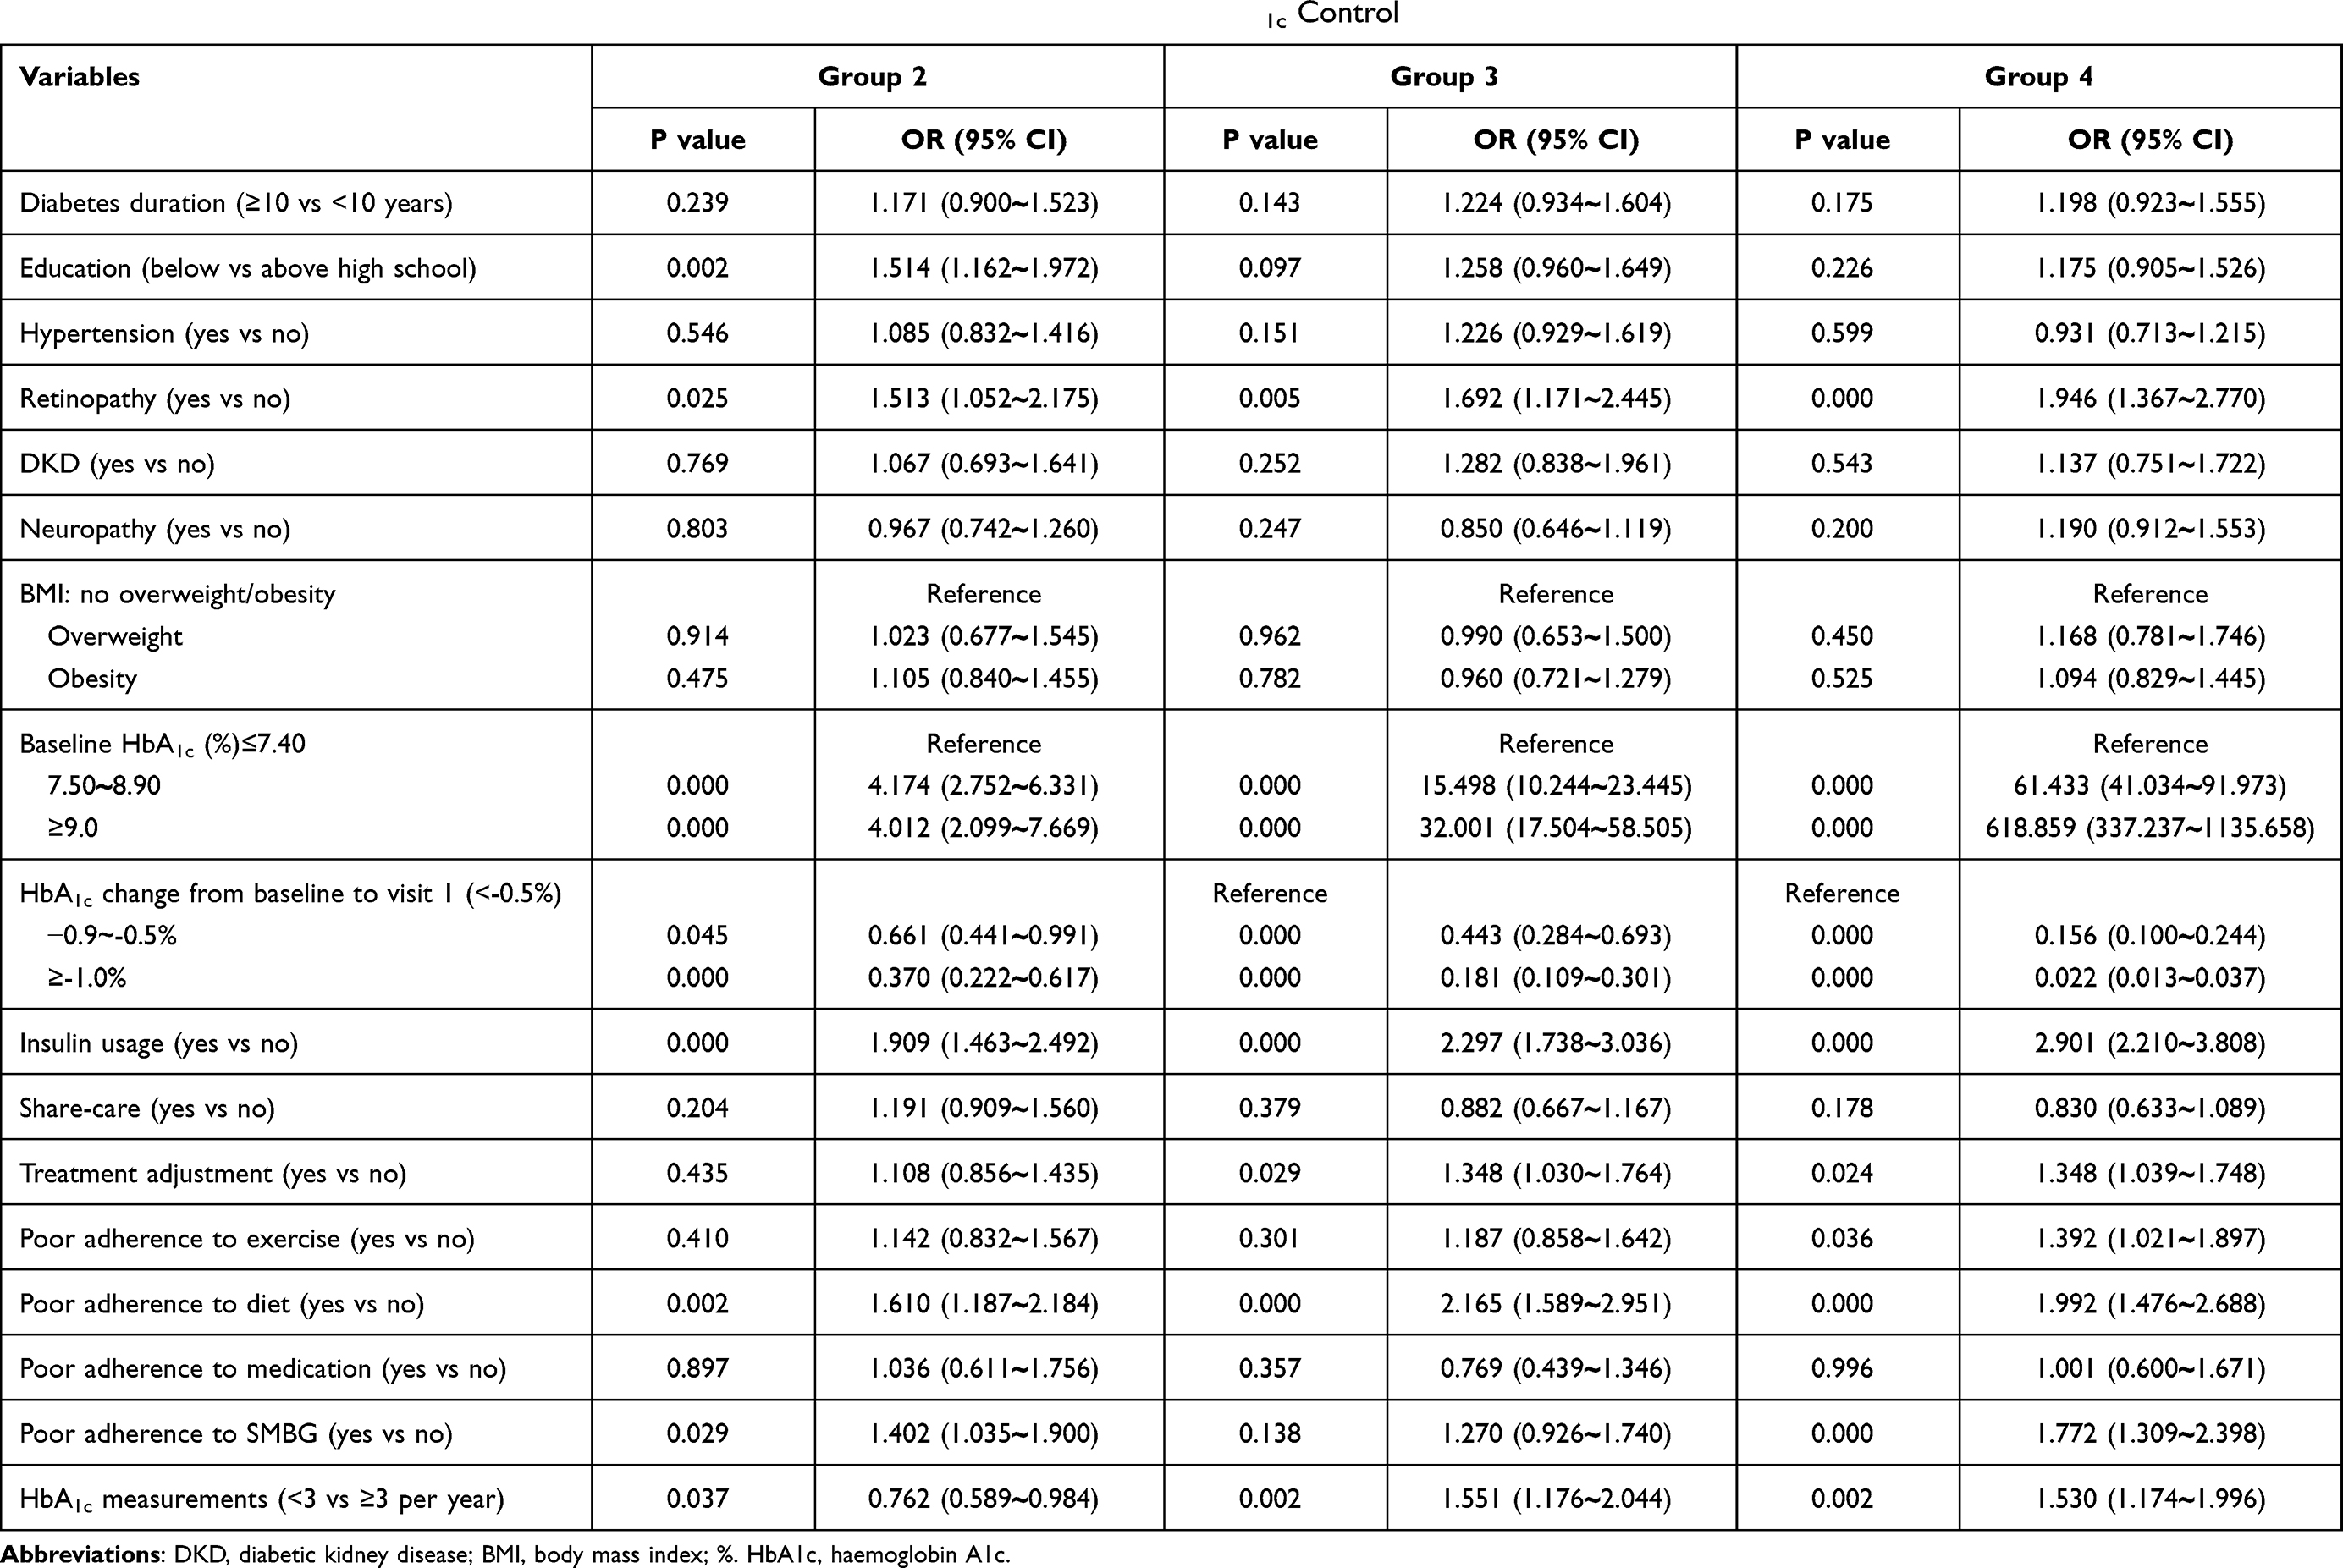 |
Table 3 Multinomial Logistic Regression Analysis Results for the 3 Groups with Less Good HbA1c Control |
Discussion
This longitudinal retrospective study identified four distinct HbA1c trajectories in people with non-newly diagnosed type 2 diabetes in Chinese primary care with two years of serial HbA1c measurements. After management, 48.2% of the study population with median age of 61.75 years and median diabetes duration of 9.58 years demonstrated good glycaemic control, with 34.5% shown as good, stable control and 13.7% as relatively good control. Although 16.2% of the participants exhibited moderate control and 35.6% exhibited poor control, 28.7% and 20.9% of them respectively had an HbA1c decrease ≥−1.0% from the baseline during the follow-up period. This proportion of people attaining good glycaemic control was much lower than that in previous studies of patients with newly diagnosed type 2 diabetes and indicated the difficulty of long-term glycaemic control.3–5 Higher HbA1c measurements at one year were associated with higher baseline HbA1c, higher body weight and low treatment adherence.16 Long diabetes duration was a risk factor for poor glycaemic control and increased the difficulty of reaching the HbA1c target. Distinct HbA1c trajectories in non-newly diagnosed type 2 diabetes have only been reported in one Israeli study,6 in which the largest group (53.2%) showed persistently good glycaemic control with a mean HbA1c of 7.1%, which was similar to that in our study, and a mean duration of 60.8 months, which was much shorter than in our study.
These results show that clinical inertia exists for glycaemic control. Patients would benefit from early good glycaemic control and be inclined to develop long-term stable, good HbA1c trajectory thereafter.3–7 Severe hyperglycaemia could be decreased to the level of good glycaemic control within one year and then kept stable for the subsequent four years.4 In this present analysis, the change of the percentage of subjects having a HbA1c ≥7.50% decreased. Therefore, although baseline HbA1c ≥7.5% was associated with a higher chance of belonging to the poorer glycaemic control groups, an HbA1c change ≥−0.5% from baseline to visit 1, especially ≥−1.0%, was associated with a significantly lower chance of belonging to the poorer glycaemic control groups. This indicated that to attain long-term, good, stable glycaemic control, subjects with poor glycaemic control should be managed to reduce their HbA1c levels to a certain extent by the follow-up visit after registration.
We found significantly more participants were treated with insulin and managed with the share-care model in the three poorer glycaemic control groups. The proportion of patients treated with insulin, managed with the share-care model and had treatment changes in the stable, good group was significantly lower than that in the poorest control group. After multivariable adjustment, insulin treatment and treatment change were still associated with a higher chance of belonging to the two poorest control groups, indicating that intensified management of glycaemic control already existed. The results were similar to Luo’s study.5 Ordinary people often have no awareness of diabetes and think that they do not have it, which leads them to ignore the disease and makes it more difficult to manage.17 Appropriate treatment titration and adherence to medications and self-management behaviour were two important factors related to glycaemic control and clinical inertia. Medications, especially insulin treatment, were associated with glycaemic change from severe hyperglycaemia to good glycaemic control.4 That is the reason why insulin treatment was most prevalent in the groups with poorer control, and the addition of multiple insulin injections was the most common intensification.5 In the present analysis, a lack of change in antidiabetic treatment during the follow-up period was taken as clinical inertia originating from healthcare professionals; and poor adherence to healthy diet, activity, SMBG and medications during the follow-up period was taken as clinical inertia originating from patients.
Some patients still had poor glycaemic control despite being treated with insulin and having changes in treatment. Nonresponse or nonadherence were accepted as the important risk factors. The improved HbA1c control was usually found accompanied by significantly increased self‐care behaviour adherence scores of healthy diet, physical activity and SMBG.18,19 Exercise can improve insulin resistance and HbA1c control, given enough intensity and time.20,21 SMBG is a necessary means of diabetes management, and with effective communication between healthcare professionals and patients, SMBG can become an effective diabetes self-management tool.22 The SMBG schema could be adopted and reviewed before proceeding to the next therapeutic drug step..23
We demonstrated the importance of adherence to diabetes self-management behaviours in this analysis. Compared with the baseline, adherence to exercise, diet, medications and SMBG improved significantly. After multivariable adjustment, poor adherence to diet, exercise and SMBG were still significant risk factors for poor glycaemic control. The importance of adherence to diet was persistently significant for all poor control groups, even after multivariable adjustment. The proportion of subjects being adherent to diet increased during the follow-up period for participants overall, and increased from the poorest control group to the stable, good control group, which was similar to Salinero-Fort’s report (55.7%–74.2%).24 With intensified management, free medications, free visits with clinicians, aggressive titration of medications and >90% adherence to medications, 68.2% of participants with a mean diabetes duration >10 years reached the target of HbA1c <8.0% in the standard glycaemia therapy group of the Action to Control Cardiovascular Risk in Diabetes (ACCORD) trial.25 In this study, 64.4% of subjects with a median diabetes duration of 9.58 years had ≥30% of HbA1c measurements <7.5% during all follow-up periods, with a median HbA1c of <6.50% in Group 1, <7.20% in Group 2 and <7.60% in Group 3, which demonstrated a similar glycaemic control to the ACCORD trial. The present study also demonstrated the possibility of practical intensified management, treatment titration and adherence to self-management behaviours in the real world.
Regularity of measuring HbA1c is another factor related to clinical inertia. Both the frequency of HbA1c measurements and the frequency of medication intensification were associated with a higher chance of reaching the HbA1c target.26 The greatest annual change of HbA1c occurred between 6 months and 2 years after diagnosis over 10 years of follow-up in a UK study.27 More frequent monitoring of HbA1c and adjustment of glucose-lowering drugs may be essential to prevent the decline of glycaemic control. Low frequency of testing and over-testing of HbA1c in people with type 2 diabetes was commonly found in primary care. In the present analysis, the percentage of overall participants who had a frequency of HbA1c measurements ≥2 and ≥3 per year were 72.5% and 32.2%, respectively, similar to that of a German study (74% ≥2 per year).28 According to international guidance, ≥3 HbA1c tests per year among adults with controlled type 2 diabetes might be over-testing; one test per year was associated with lower likelihoods of achieving the HbA1c target.29,30 The optimal HbA1c testing frequency required to maximise the downward trajectory in HbA1c was found to be four times per year, particularly in those with suboptimal HbA1c and initial HbA1c of ≥7%.31 In the present analysis, the percentage of participants who had ≥3 HbA1c measurements per year was significantly higher than that in Group 3 and Group 4, and <3 HbA1c measurements per year was a significant risk factor for belonging to poorer glycaemic control groups. These findings provided objective evidence that a low HbA1c monitoring frequency was associated with a significant detrimental effect on diabetes control. The importance of HbA1c monitoring frequency needs to be further emphasised in diabetes management.
A strength of the present study is the large number of people with non-newly diagnosed type 2 diabetes in Chinese primary care. Our study has several limitations. First, this was a multi-centre study, and HbA1c was not measured in the same central laboratory. Second, the limitation of using the percentage of HbA1c measurements <7.5% to categorise HbA1c trajectories is worth noting. It is a simplified reflection of the longitudinal HbA1c profiles showing an aspect in general. However, individual HbA1c trajectories may be much more diverse and complicated, and the model may not be able to capture all these different individual patterns. Third, the analysis of medication in this study was based on patients’ medication records registered on the share-care information system rather than being imported from prescribed medication records and was incomplete. The dose change of medications was not considered, and there may be an underestimation of the treatment change effect. Fourth, although the information on diet, exercise, medication and SMBG was collected according to the Chinese version of the diabetes self-care behaviour scale, the definition of good compliance was adjusted and simplified. Fifth, because of the long study period, patients did not pay enough attention to follow-up procedures and some subjects were lost. Finally, information on complications and comorbidities was assessed based on self‐reported history and records of physician diagnosis at the time of recruitment, and therefore may not be accurate, though this was usual practice.
In conclusion, four distinct patterns of longitudinal HbA1c trajectories were identified in participants with non-newly diagnosed type 2 diabetes using the percentage of HbA1c measurements <7.5% in Chinese primary care with two years of serial HbA1c measurements. Approximately half of the participants showed good glycaemic control. The intensified management, treatment titration and improved adherence to self-management behaviours in the real world are practical. Despite a higher percentage of subjects being treated with insulin in the poorer control groups, the percentage of subjects being adherent to exercise, diet, medications and SMBG was lower, together with a lower frequency of HbA1c tests per year. Aggressive treatment changes, good adherence during the follow-up period, ≥3 HbA1c measurements per year and reducing the HbA1c level to a certain extent by the first follow-up visit are important for good, stable, long-term glycaemic control.
Author Contributions
All authors made a significant contribution to the work reported, whether that is in the conception, study design, execution, acquisition of data, analysis and interpretation, or in all these areas; took part in drafting, revising or critically reviewing the article; gave final approval of the version to be published; have agreed on the journal to which the article has been submitted; and agree to be accountable for all aspects of the work.
Funding
Beijing Fengtai District Health System Project Approval 2017-81.
Disclosure
The authors declare that there is no conflict of interest associated with this manuscript.
References
1. Luo M, Tan KHX, Tan CS, Lim WY, Tai ES, Venkataraman K. Longitudinal trends in HbA1c patterns and association with outcomes: a systematic review. Diabetes Metab Res Rev. 2018;34(6):e3015. doi:10.1002/dmrr.3015
2. Lacy ME, Gilsanz P, Karter AJ, Quesenberry CP, Pletcher MJ, Whitmer RA. Long-term Glycemic Control and Dementia Risk in Type 1 Diabetes. Diabetes Care. 2018;41(11):2339–2345. doi:10.2337/dc18-0073
3. Laiteerapong N, Karter AJ, Moffet HH, et al. Ten-year hemoglobin A1c trajectories and outcomes in type 2 diabetes mellitus: the Diabetes & Aging Study. J Diabetes Complications. 2017;31(1):94–100. doi:10.1016/j.jdiacomp.2016.07.023
4. Rathmann W, Schwandt A, Hermann JM, et al. DPV Initiative. Distinct trajectories of HbA(1c) in newly diagnosed Type 2 diabetes from the DPV registry using a longitudinal group-based modelling approach. Diabet Med. 2019;36(11):1468–1477. doi:10.1111/dme.14103
5. Luo M, Tan CS, Lim WY, et al. Association of diabetes treatment with long-term glycemic patterns in patients with type 2 diabetes mellitus: a prospective cohort study. Diabetes Metab Res Rev. 2019;35(4):e3122. doi:10.1002/dmrr.3122
6. Karpati T, Leventer-Roberts M, Feldman B, Cohen-Stavi C, Raz I, Balicer R. Patient clusters based on HbA1c trajectories: a step toward individualized medicine in type 2 diabetes. PLoS One. 2018;13(11):e0207096. doi:10.1371/journal.pone.0207096
7. McCoy RG, Ngufor C, Van Houten HK, Caffo B, Shah ND. Trajectories of Glycemic Change in a National Cohort of Adults With Previously Controlled Type 2 Diabetes. Med Care. 2017;55(11):956–964. doi:10.1097/MLR.0000000000000807
8. Rozing MP, Møller A, Aabenhus R, Siersma V, Rasmussen K, Køster-Rasmussen R. Changes in HbA1c during the first six years after the diagnosis of Type 2 diabetes mellitus predict long-term microvascular outcomes. PLoS One. 2019;14(11):e0225230. doi:10.1371/journal.pone.0225230
9. Khunti K, Gomes MB, Pocock S, et al. Therapeutic inertia in the treatment of hyperglycaemia in patients with type 2 diabetes: a systematic review. Diabetes Obes Metab. 2018;20(2):427–437. doi:10.1111/dom.13088
10. Andreozzi F, Candido R, Corrao S, et al. Clinical inertia is the enemy of therapeutic success in the management of diabetes and its complications: a narrative literature review. Diabetol Metab Syndr. 2020;7(12):52. doi:10.1186/s13098-020-00559-7
11. Chen YY, Peng MG. The validity and reliability of a Chinese version of the diabetes self-care activities questionnaire. Chine J Practical Nursing. 2011;27(14):60–62.
12. American Diabetes Association; European Association for the Study of Diabetes; International Federation of Clinical Chemistry and Laboratory Medicine; International Diabetes Federation. Consensus statement on the worldwide standardisation of the HbA1c measurement. Diabetologia. 2007;50:2042–2043. doi:10.1007/s00125-007-0789-7
13. Looker HC, Nyangoma SO, Cromie D, et al. Diabetic retinopathy at diagnosis of type 2 diabetes in Scotland. Diabetologia. 2012;55(9):2335–2342. doi:10.1007/s00125-012-2596-z. Epub 2012 Jun 12. PMID: 22688348; PMCID: PMC3411303.
14. McGrath K, Edi R. Diabetic Kidney Disease: diagnosis, Treatment, and Prevention. Am Fam Physician. 2019;99(12):751–759. PMID: 31194487.
15. Selvarajah D, Kar D, Khunti K, et al. Diabetic peripheral neuropathy: advances in diagnosis and strategies for screening and early intervention. Lancet Diabetes Endocrinol. 2019;7(12):938–948. doi:10.1016/S2213-8587(19)30081-6. Epub 2019 Oct 14. PMID: 31624024.
16. Pathiraja NP, Colman PG, Wentworth JM. Glycaemic trajectory and predictors of suboptimal glycaemic control in people with type 2 diabetes. Intern Med J. 2020;50(11):1415–1418. doi:10.1111/imj.15059. PMID: 33215839.
17. Cicero AFG, Fogacci F, Tocci G, et al. Awareness of major cardiovascular risk factors and its relationship with markers of vascular aging: data from the Brisighella Heart Study. Nutr Metab Cardiovasc Dis. 2020;30(6):907–914. doi:10.1016/j.numecd.2020.03.005. Epub 2020 Mar 16. PMID: 32249143.
18. Ji H, Chen R, Huang Y, Li WQ, Shi CH, Zhou J. Effect of simulation education and case management on glycemic control in type 2 diabetes. Diabetes Metab Res Rev. 2019;35(3):e3112. doi:10.1002/dmrr.3112
19. Weinstock RS, Braffett BH, McGuigan P, et al.; TODAY Study Group. Self-Monitoring of Blood Glucose in Youth-Onset Type 2 Diabetes: results From the TODAY Study. Diabetes Care. 2019;42(5):903–909. doi:10.2337/dc18-1854.
20. Balducci S, D’Errico V, Haxhi J, et al. Italian Diabetes and Exercise Study 2 (IDES-_2) Investigators. Effect of a Behavioral Intervention Strategy for Adoption and Maintenance of a Physically Active Lifestyle: the Italian Diabetes and Exercise Study 2 (IDES_2): a Randomized Controlled Trial. Diabetes Care. 2017;40(11):1444–1452. doi:10.2337/dc17-0594
21. Fayehun AF, Olowookere OO, Ogunbode AM, Adetunji AA, Esan A. Walking prescription of 10 000 steps per day in patients with type 2 diabetes mellitus: a randomised trial in Nigerian general practice [J]. Br J Gen Pract. 2018;68(667):e139–e145. doi:10.3399/bjgp18X694613
22. Chinese Diabetes Society. Chinese guideline for clinical application of blood glucose monitoring (2015 Edition). Chin J Diabetes Mellitus. 2015;7(10):603–613.
23. Madeo B, Diazzi C, Granata ARM, et al. Effect of a standard schema of self-monitoring blood glucose in patients with poorly controlled, non-insulin-treated type 2 diabetes mellitus: a controlled longitudinal study. J Popul Ther Clin Pharmacol. 2020;27(S Pt 2):e1–e11. doi:10.15586/jptcp.v27iSP2.680. PMID: 32757545.
24. Salinero-Fort MA, Carrillo-de E, Arrieta-Blanco FJ, et al. Effectiveness of PRECEDE model for health education on changes and level of control of HbA1c, blood pressure, lipids, and body mass index in patients with type 2 diabetes mellitus. BMC Public Health. 2011;11:267. doi:10.1186/1471-2458-11-267
25. Drake TC, Hsu FC, Hire D, et al. Factors associated with failure to achieve a glycated haemoglobin target of <8.0% in the Action to Control Cardiovascular Risk in Diabetes (ACCORD) trial. Diabetes Obes Metab. 2016;18(1):92–95.
26. Turchin A, Goldberg SI, Breydo E, Shubina M, Einbinder JS. Copy/paste documentation of lifestyle counseling and glycemic control in patients with diabetes: true to form? Arch Intern Med. 2011;171:1393–1394. doi:10.1001/archinternmed.2011.219
27. Lind M, Pivodic A, Cea-Soriano L, Nerman O, Pehrsson NG, Garcia-Rodriguez LA. Changes in HbA1c and frequency of measuring HbA1c and adjusting glucose-lowering medications in the 10 years following diagnosis of type 2 diabetes: a population-based study in the UK. Diabetologia. 2014;57(8):1586–1594. doi:10.1007/s00125-014-3250-8
28. Kostev K, Jacob L, Lucas A, Rathmann W. Low annual frequency of HbA(1c) testing in people with Type 2 diabetes in primary care practices in Germany. Diabet Med. 2018;35(2):249–254. doi:10.1111/dme.13556
29. McCoy RG, Van Houten HK, Ross JS, Caffo B, Shah ND. HbA1c overtesting and overtreatment among US adults with controlled type 2 diabetes, 2001-13: observational population based study. BMJ. 2015;351:h6138. doi:10.1136/bmj.h6138
30. Duff CJ, Solis-Trapala I, Driskell OJ, et al. The frequency of testing for glycated haemoglobin, HbA1c, is linked to the probability of achieving target levels in patients with suboptimally controlled diabetes mellitus. Clin Chem Lab Med. 2018;57(2):296–304. doi:10.1515/cclm-2018-0503
31. Driskell OJ, Holland D, Waldron JL, et al. Reduced testing frequency for glycated hemoglobin, HbA1c, is associated with deteriorating diabetes control. Diabetes Care. 2014;37(10):2731–2737. doi:10.2337/dc14-0297
 © 2021 The Author(s). This work is published and licensed by Dove Medical Press Limited. The full terms of this license are available at https://www.dovepress.com/terms.php and incorporate the Creative Commons Attribution - Non Commercial (unported, v3.0) License.
By accessing the work you hereby accept the Terms. Non-commercial uses of the work are permitted without any further permission from Dove Medical Press Limited, provided the work is properly attributed. For permission for commercial use of this work, please see paragraphs 4.2 and 5 of our Terms.
© 2021 The Author(s). This work is published and licensed by Dove Medical Press Limited. The full terms of this license are available at https://www.dovepress.com/terms.php and incorporate the Creative Commons Attribution - Non Commercial (unported, v3.0) License.
By accessing the work you hereby accept the Terms. Non-commercial uses of the work are permitted without any further permission from Dove Medical Press Limited, provided the work is properly attributed. For permission for commercial use of this work, please see paragraphs 4.2 and 5 of our Terms.