")
Back to Journals » International Journal of General Medicine » Volume 15
Clinical Impact of 11q13.3 Amplification on Immune Cell Infiltration and Prognosis in Breast Cancer
Authors Zhou R , Zhu X, Peng Y, Zhong L, Peng L, Yang B, Meng Y, Chen X, Lu Y
Received 8 February 2022
Accepted for publication 1 April 2022
Published 14 April 2022 Volume 2022:15 Pages 4037—4052
DOI https://doi.org/10.2147/IJGM.S360177
Checked for plagiarism Yes
Review by Single anonymous peer review
Peer reviewer comments 2
Editor who approved publication: Dr Scott Fraser
Renyu Zhou,1 Xiaoxi Zhu,2 Yulong Peng,1 Lijuan Zhong,1 Lilin Peng,1 Bo Yang,1 Yuhua Meng,3 Xuanzhao Chen,4 Yuanzhi Lu1,4
1Department of Pathology, First Affiliated Hospital of Jinan University, Guangzhou, 510630, People’s Republic of China; 2Department of Oncology, First Affiliated Hospital of Jinan University, Guangzhou, 510630, People’s Republic of China; 3Department of Pathology, Shunde Hospital, Southern Medical University (The First People’s Hospital of Shunde), Foshan, 528300, People’s Republic of China; 4The Center of Pathological Diagnosis and Research, Affiliated Hospital of Guangdong Medical University, Zhanjiang, 524023, People’s Republic of China
Correspondence: Yuanzhi Lu, Tel +86-20 38688984, Email [email protected]
Introduction: Amplification of the 11q13.3 locus has been observed in various tumors. This study sought to determine the correlation of gene amplification at the 11q13.3 locus with the immune status and survival of breast cancer.
Methods: Amplification of the 11q13.3 locus was characterized by analyzing a publicly available database from the cBioPortal platform (TCGA). The correlation of amplified genes with immune cell infiltration in breast cancer was further analyzed using the TIMER2.0 platform. Immunohistochemical staining was used to determine the expression levels of Cyclin D1 (CCND1), Fas-associated death domain (FADD) and P53 in 156 clinical breast cancer samples.
Results: This study revealed that amplification of the 11q13.3 amplicon in breast cancer is likely more frequently detected in luminal B breast cancer. Moreover, high expression or amplification of CCND1, fibroblast growth factor 3 (FGF3), fibroblast growth factor 4 (FGF4), fibroblast growth factor 19 (FGF19) and FADD was inversely correlated with the abundance of CD4+ T cells and dendritic cell infiltration in breast cancer (P < 0.05). Data analysis also demonstrated that high expression of CCND1, FGF4 and FADD mRNA levels was closely correlated with shorter recurrence-free survival (RFS) in patients with breast cancer (P < 0.05). The results of immunohistochemical staining from clinical samples further confirmed that high expression of CCND1 and FADD was frequently detected in luminal B and high-grade breast cancer with shorter metastasis-free survival times (P < 0.05).
Conclusion: This study demonstrated that coamplification of genes located on the 11q13.3 amplicon is frequently detected in luminal B subtype breast cancer and is closely associated with worse survival in patients with breast cancer. Moreover, coamplification of the CCND1-FGF locus might decrease antitumor immune activity in breast cancer, indicating that coamplification of the 11q13.3 amplicon is likely to be a key determinant of therapeutic resistance and accelerate the aggressive evolution of breast cancer.
Keywords: breast cancer, chromosomal amplification, 11q13.3 amplicon, prognosis, immune microenvironment
Introduction
Breast cancer (BC) is a malignant tumor with a high incidence in women worldwide, threatening women’s health and lives, and it has become the “first killer” that endangers women’s health.1 Its incidence is accelerating globally and tends to be detected younger.2–4 Early studies based on the results of mRNA profiling divided breast cancer into five intrinsic subtypes: luminal A, luminal B, HER2-enriched, basal cell-like and normal breast-like subtypes.5 Clinically, immunohistochemical detection of ER, PR, HER2 and Ki67 can roughly distinguish the intrinsic subtypes of breast cancer and guide adjuvant therapy with anti-endocrine or targeting regimens such as chemotherapy plus tamoxifen or fulvestrant for ER+/PR+ breast cancer and trastuzumab or pertuzumab for HER2-enriched subtypes of breast cancer. However, approximately 30–40% of breast cancer patients develop primary and/or acquired drug-resistant recurrence and ultimately metastasis to bones, lungs, liver and brain. It has been demonstrated that different oncogenic driver alterations may contribute to recurrence or metastasis in different subtypes of breast cancer, highlighting that driver mutations of PIK3CA (phosphatidylinositol-4,5-bisphosphate 3-kinase catalytic subunit alpha), ESR1 (estrogen receptor 1), AKT1 (AKT serine/threonine kinase 1) and GATA3 (GATA binding protein 3) as well as inactivation of PTEN (phosphatase and tensin homolog) and NF1 (neurofibromin 1) are frequently present in metastatic hormone receptor (HR)-positive breast cancer.6,7 Additionally, amplification of FGFR1 (fibroblast growth factor receptor 1), PAK1 (p21 (RAC1) activated kinase 1), MYC, CCND1 and GNAS (GNAS complex locus) is more common in the intrinsic luminal subtype of breast cancer with a metastatic phenotype.6 Amplification of GNAS, FOXA1 (forkhead box A1), MYC, RARA (retinoic acid receptor alpha), and CCND1 and mutations of NF1 and TP53 are markedly enriched in the HER2+ subtype of breast cancer.6 Notably, mutations of NF1, PTEN, TP53 and amplification of MYC and EGFR (epidermal growth factor receptor) are the most common genomic features of metastatic triple negative breast cancer (TNBC),6,8 and somatic biallelic loss-of-function mutations in genes involved in homologous recombination DNA repair are also frequently detected in TNBC.6,7,9 These data indicate that coamplification of oncogenes such as MYC and CCND1 and inactivation of tumor suppressor genes such as TP53, BRCA1/2, and PTEN through hotspot mutations are the critical determinants that drive clonal evolution and heterogeneity during the progression of breast cancer.
The significance of chromosomal amplification in cancer initiation and progression has been implied by recent discovery of a low frequency of copy number variations (CNVs) in normal tissues but a high incidence of CNVs in tumor tissues.10,11 Indeed, increasing evidence has also shown that therapeutic exposure, such as chemotherapy or targeting therapy, may drive genomic evolution and chromosome instability, such as chromothripsis, chromoanasynthesis, chromoplexy and kataegis in cancer cells due to the dysfunction of cell cycle checkpoints and DNA damage repair pathways.12,13 Focal chromosomal amplification and complicated somatic structural variation of chromosomes are more frequently detected in recurrent or metastatic breast cancer,14–17 and amplification of MYC at the 8q24.1 locus has been found to be closely related to disastrously clinical outcomes in patients with breast cancer. In addition to 8q24.1, several chromosomal amplifications have been found in the late stage of breast cancer, including chromosomes 4, 7, 11 and 17. These genomic alterations usually contain the coamplification and overexpression of multiple genes in the locus, such as CCND1, FGF3, FGF4, and EMSY on 11q13. However, the mechanisms underlying chromosomal amplification and the clinical significance of the coamplification of related genes are not completely clear. Therefore, in this study, we focused on the clinicopathologically predictive values of coamplification of genes at 11q13.3 by mining a published database (TCGA). We further validated the expression levels of related genes in clinical samples by performing immunohistochemical staining and analyzed the relationship between the gene expression levels and clinicopathological features and the survival prognosis of breast cancer patients. The results from this study will further confirm and provide novel biomarkers and potential targets for the clinical prognosis and therapy of breast cancer patients.
Materials and Methods
cBioPortal
All amplifications in genes on 11q13.3 originated from The Cancer Genome Atlas breast carcinoma database (TCGA, www.cancer.gov/about-nci/organization/ccg/research/structural-genomics/tcga). Data are listed in the cBioCancer Genomics Portal (cBioPortal, http://www.cbioportal.org), which is a site for analysis of large-scale genomics databases.18 We correlated genomic data and other sources with patients’ clinical characteristics and survival outcomes from TCGA.19 Copy number alteration analysis was performed with the GISTIC (Genomic Identification of Significant Targets in Cancer) algorithm.20 mRNA expression grids were constructed and normalized using the RSEM algorithm in cBioPortal.21 Otherwise, clinicopathologic characteristics of breast cancer were collected from the METABRIC cohort.22 The French INSERM study and the metastatic breast cancer project study in cBioPortal, which are two genomic studies of metastatic breast cancer, were used to evaluate the frequency of amplifications of the genes on chromosome 11q13.3.23
Timer2.0
Spearman correlation analysis was performed on the driver genes using the TIMER2.0 website (timer.cistrome.org). The Spearman rank correlation coefficient was used to determine ρ (Rho and P values were used as criteria) to analyze the correlation between the common amplified genes in the 11q13.3 locus in breast cancer and immune cells in the immune microenvironment.24
Kaplan-Meier Plotter
Breast cancer patient survival analyses based on the mRNA expression level of each amplicon gene were examined in data derived from the online publicly available website Kaplan-Meier Plotter (www.kmplot.com).25 The cutoff points of each amplified gene sample and nonamplified sample were set in the quartile with the higher amplification value.
Immunohistochemistry
We enrolled 156 patients with non-special-type breast invasive ductal carcinoma who were surgically treated and diagnosed with breast invasive ductal carcinoma in the Department of Clinical Pathology at the First Affiliated Hospital of Jinan University from January 2013 to May 2019 and excluded those with distant metastases at the beginning of retreatment. All samples and clinical information used in this study was approved by the Institutional Review Boards (IRB) of the First Affiliated Hospital of Jinan University. Molecular types were determined based on the results of IHC and FISH in the postoperative pathological data. Postoperative patients received recommended adjuvant treatment according to the molecular classification with reference to National Comprehensive Cancer Network (NCCN) guidelines. Immunohistochemistry staining was performed to analyze the protein expression of CCND1, P53 and FADD in tumor tissue specimens. CCND1 (#2978S, 1:50 dilution) and P53 (#2527S, 1:100 dilution) antibodies were purchased from Cell Signaling Technology, and FADD (#ab108601, 1:100 dilution) was purchased from Abcam. All specimens were analyzed by using the EnVision two-step method and immunohistochemical sections were evaluated by two pathologists independently. The positive range percentage criteria were as follows: no positive expression in the tumor region (0 points), positive expression region ≤ 10% (1 point), positive expression region 11 – 50% (2 points), and positive expression region > 50% (3 points). Scoring system of staining intensity: uncolored, (0 points); light yellow, (1 point); yellow, (2 points); brown, (3 points).26
Statistical Analysis
The experimental data were analyzed by SPSS 28.0 statistical software (IBM). The correlation analysis between the expression levels and the clinicopathological parameters of breast cancer patients was tested by using the chi-square test. The chi-square test of multiple comparisons readjusted the test levels based on the number of comparisons. Spearman rank correlation analysis was used to analyze the correlation between the expression of CCND1, FADD and P53 protein. Kaplan-Meier analysis was used to generate survival curves for the postoperative metastasis-free survival period, and the Log rank test was used for survival analysis. P<0.05 was considered statistically significant.
Results
The Distribution of Chromosome 11q13.3 Amplification Across All Cancers
Coamplification of several chromosomes in different types of cancers has been reported, and the long arm of the chromosome 11q13 locus, including multiple genes, is one of the most frequently amplified loci (Supplementary Tables 1&2). To identify amplification of the 11q13 locus in pancancers, we conducted an investigation by performing analysis of the TCGA database. As shown in Figure 1 and Supplementary Table 2, we found that approximately 23.9% of head and neck squamous cell carcinomas, 14.6% of breast invasive carcinomas and 13.9% of lung squamous cell carcinomas harbored 11q13.3 locus amplification. The 11q13.3 locus amplification was relatively low in other types of tumors (Figure 1), and only 4.5% of hepatocellular carcinomas had this kind of amplification (Figure 1, Supplementary Table 2).
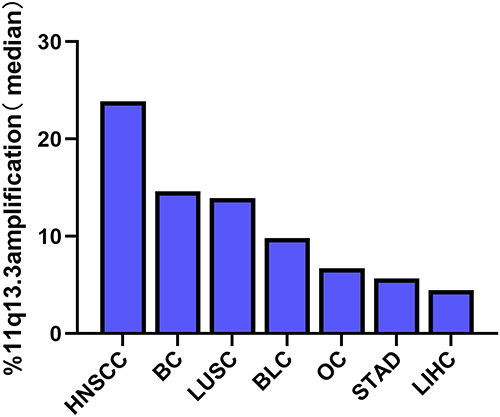 |
Figure 1 Percentage of the 11q13.3 amplicon expression in common types of cancer. Data are from The Cancer Genome Atlas (TCGA) studies. Abbreviations: HNSCC, head and neck squamous cell carcinoma; BC, breast invasive carcinomas; LUSC, lung squamous cell carcinoma; BLC, bladder urothelial carcinoma; OC, ovarian carcinoma; STAD, stomach adenocarcinoma; LIHC, liver hepatocellular carcinoma. |
Early studies have revealed that the amplicon of 11q13-11q14 contains more than 50 genes in this locus with several potential drivers (Supplementary Table 1).16 Regarding amplification and expression of individual genes at this locus in breast cancer, we found that the amplified frequencies of CCND1, LTO1, FGF19, FGF4 and FGF3 were 16.4%, 16.4%, 15.9%, 15.7% and 15.6% in TCGA, respectively, while other genes at the 11q13.3 locus were basically amplified at 10%. Compared with TCGA study, the amplification frequency was generally similar in METABRIC studies (Supplementary Table 3). Similarly, we further confirmed the similar trends of 11q13.3 amplification in breast cancer in The Metastatic Breast Cancer Project and INSERM metastatic breast cancer study cohorts, and the frequency of gene amplification at the 11q13.3 locus appeared to be higher in metastatic breast cancer (Supplementary Table 4).
Association of 11q13 Amplification with Clinical Significance in Breast Cancer
To gain insights into the clinical significance of 11q13 amplification in breast cancer, we further investigated the influence of potentially amplified driver genes at 11q13 on the clinicopathological features of breast cancer. As indicated in Figure 2A and B, a group of genes was found to be coamplified with CCND1, a critical gene encoded the protein involved in the regulation of G1 cell cycle transition. This group of genes included FGF19, FGF3, FGF4, ANO1, MYEOV, FADD, PPFIA1, CTTN and SHANK2. Similarly, several other genes, including CLNS1A, AQP11, RSF1, AAMDC, GDPD4, INTS4, CAPN5 and OMP, are frequently coamplified with PAK1 in this locus in breast cancer. To further determine the correlation of gene amplification with mRNA levels of individual gene at this locus in breast cancer, the mRNA expression levels of these genes were normalized by RSEM algorithm and clustered in cBioPortal, and data are shown in Figure 3A; several genes, including CCND1, LTO1, PAK1, MRGPRF, and MRPL21 were expressed at low levels or were marginally detectable in breast cancer. In contrast to CCND1 and PAK1, amplification and/or high expression of FADD were associated with the cooccurrence of several genes in breast cancer, including FGF19, ANO1, PPFIA1, CTTN, SHANK2, TPCN2, IGHMBP2, TESMIN, EMSY and THAP12 (Figure 3A). Moreover, gene enrichment and pathway analysis indicated that these amplified gene sets are mainly involved in the regulation of the cell cycle and apoptosis (Figure 3B). Intriguingly, amplification of the 11q13 amplicon was more frequently detected in the luminal B subtype (ER+/HER-2−/high proliferation index) of invasive breast carcinoma with a higher histological grade (Supplementary Table 5).
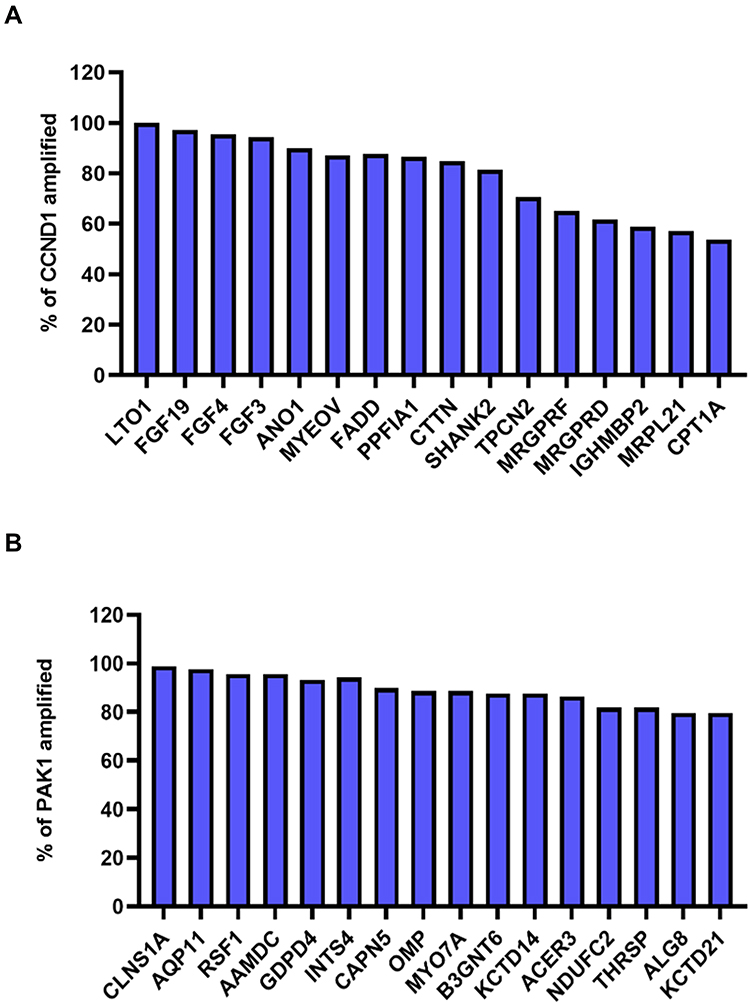 |
Figure 2 (A) Coamplification of genes on chromosome 11q13.3 with CCND1. Coamplification of genes with CCND1 is usually detected in breast cancer including FGF19, FGF3, FGF4, ANO1, MYEOV, FADD, PPFIA1, CTTN and SHANK2. (B) In TCGA breast cancer study, when PAK1 was amplified, CLNS1A, AQP11, RSF1, AAMDC, GDPD4, INTS4, CAPN5, OMP and other genes all showed higher frequency of coamplification. |
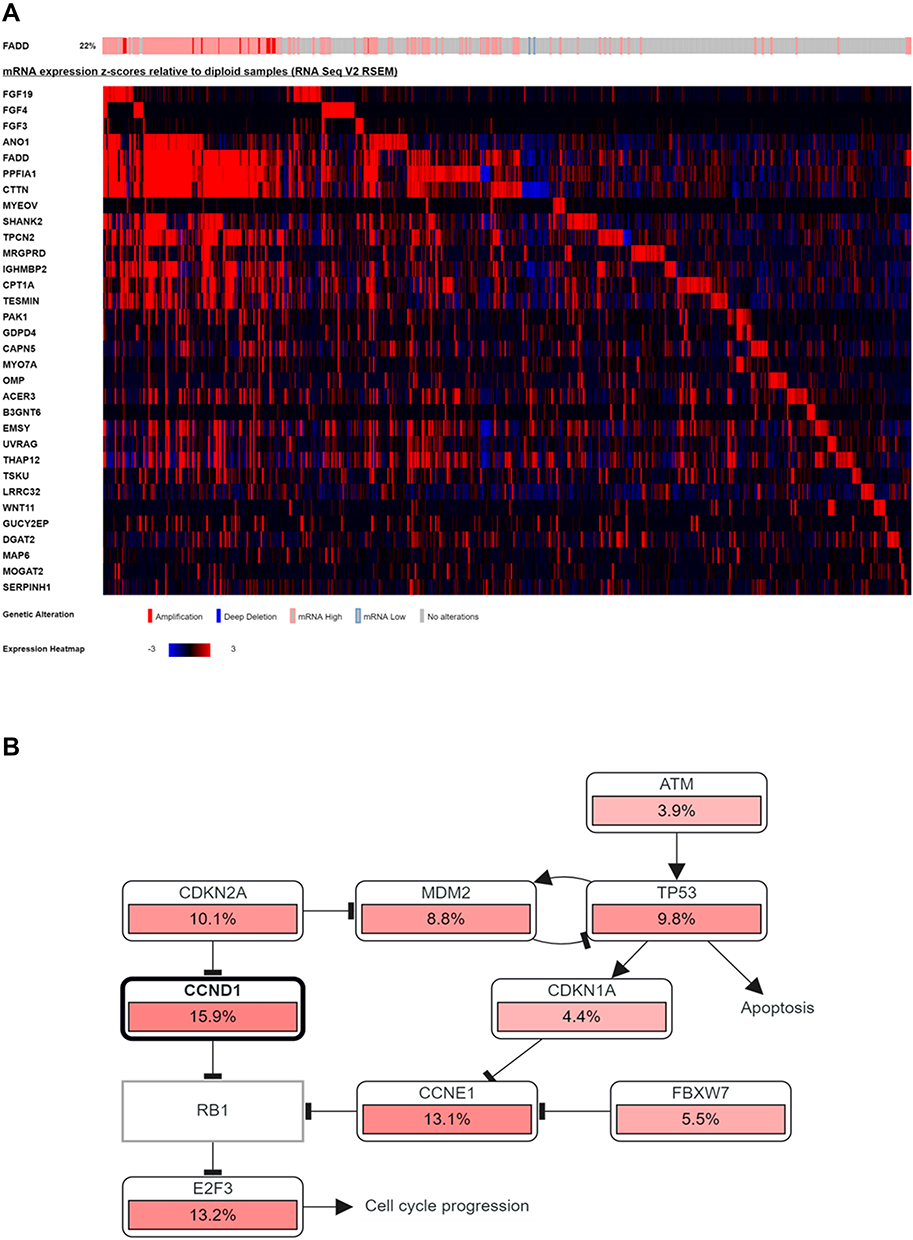 |
Figure 3 mRNA expression of amplicon genes in cases with FADD amplification (as a marker of amplicon presence). In the right side of the grid, cases with deletion of the amplicon or normal expression are shown for comparison (A). CCND1 and TP53 are involved in cell cycle regulation, and both negatively regulate RB1 (B). |
Amplification and/or Overexpression of CCND1 and FADD Inform(s) Poor Prognosis of Breast Cancer
It has also been reported by several research groups that amplification of the 11q13 amplicon may reduce the disease-free survival (DFS) time in patients with breast cancer,16 and amplification of the 11q13.3 amplicon is more frequently detected in high-grade breast cancer, indicating that overexpression of genes at this locus may confer poor clinical outcomes for breast cancer patients. To determine the prognostic value of the amplification of the 11q13.3 amplicon in breast cancer patients, we conducted survival curve analysis of breast cancer patients by Kaplan-Meier Plotter. The results showed that compared with the patients with low mRNA levels, breast cancer patients with higher mRNA levels of CCND1, FGF4 and FADD (the upper quartile in the cohort) had shorter recurrence-free survival (RFS). Importantly, overexpression of CCND1 and FADD was closely correlated with worse prognosis in ER-positive breast cancer than in ER-negative breast cancer (Figure 4).
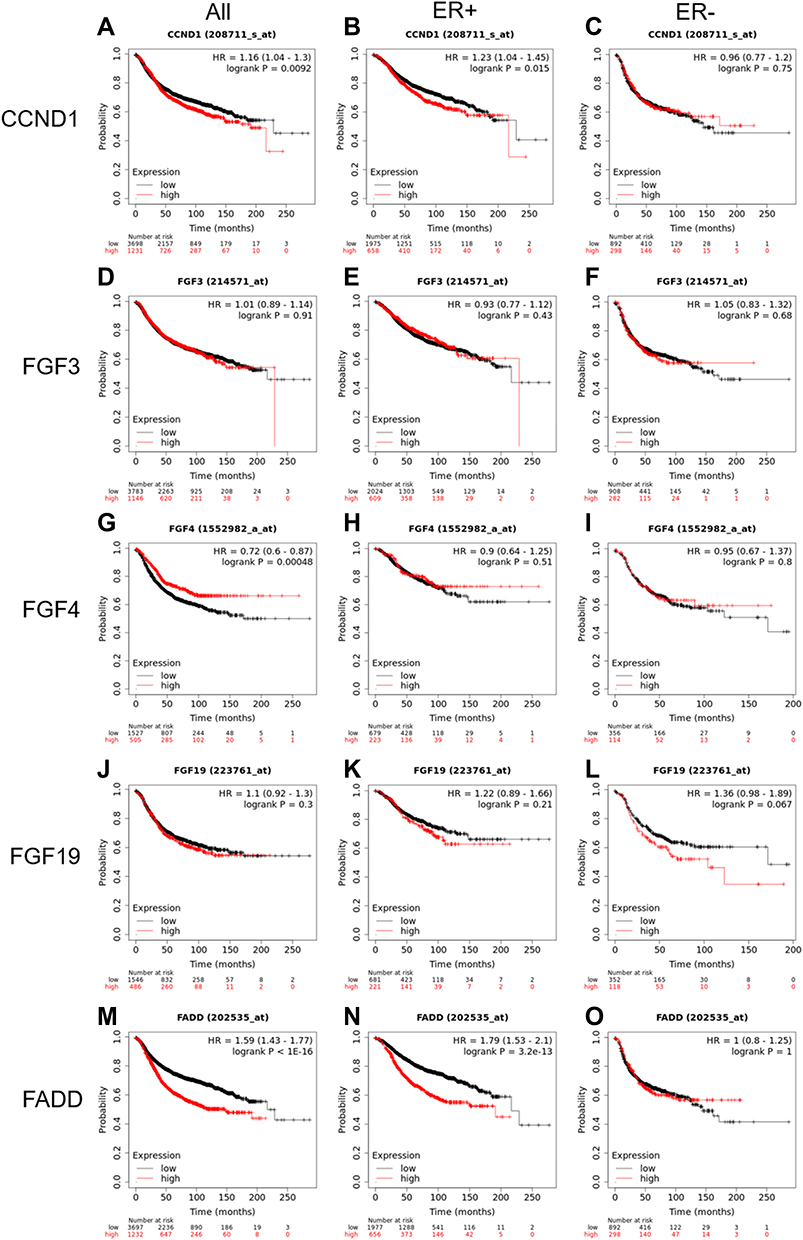 |
Figure 4 Recurrence-free survival in patients with lower mRNA expression compared with patients with higher CCND1, FGF3, FGF4, FGF19 and FADD mRNA expression. (A, D, G, J and M) All breast cancer subtypes; (B, E, H, K and N) ER (estrogen receptor) positive breast cancer; (C, F, I, L and O) in ER negative breast cancer. |
The Correlation of Amplified Genes at the 11q13.3 Locus with Infiltration of Immune Cell Subtypes in Breast Cancer
To determine the correlation between common amplified genes at 11q13.3 and the infiltration of immune cell subtypes in the microenvironment of breast cancer, we conducted an online analysis of published data using TIMER2.0 tools with Spearman correlation analysis of driver genes, and the Spearman rank correlation coefficient was determined by the ρ (rho) and P value. As shown in Figure 5, high expression or amplification of CCND1, FGF3, FGF4, FGF19 and FADD was negatively correlated with the abundance of CD4+ T cells and dendritic cell infiltration in breast cancer (P < 0.05) (Figure 5, Supplementary Table 6).
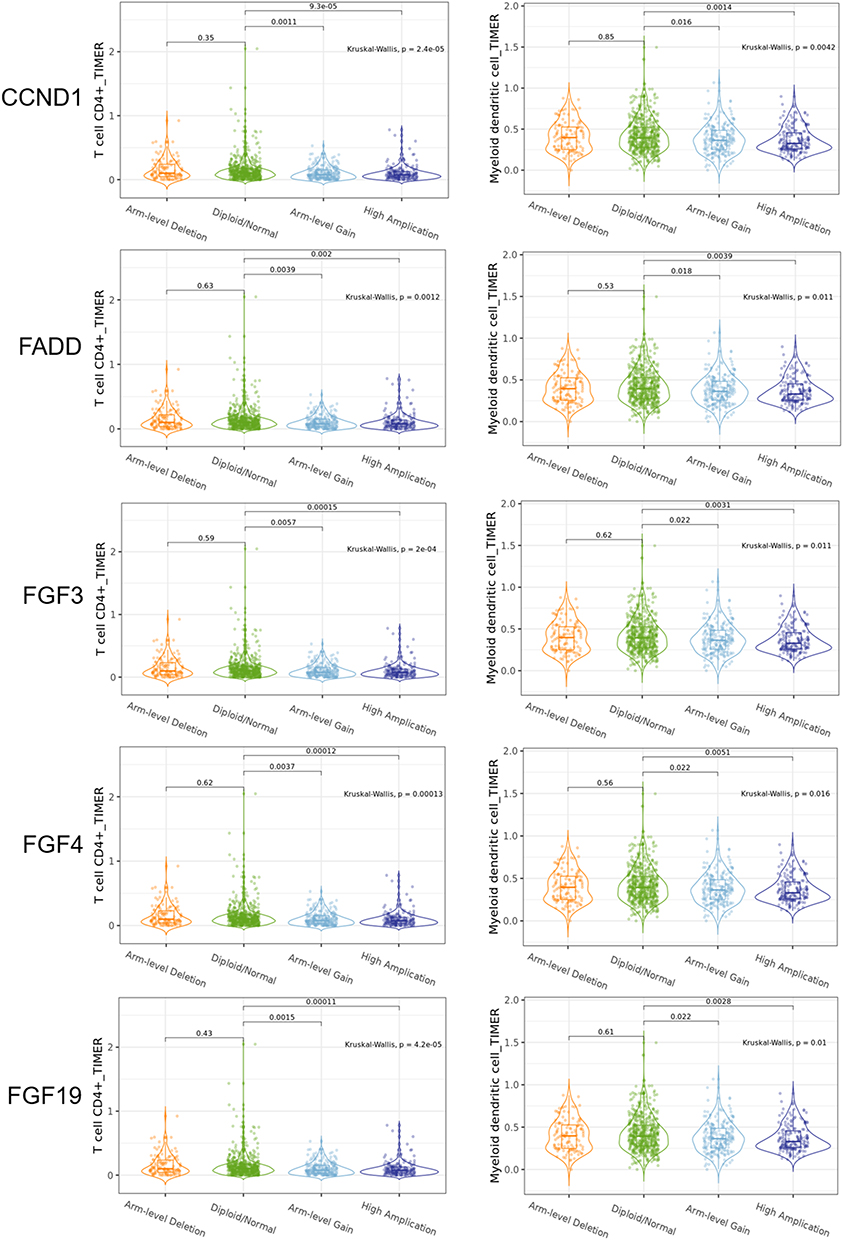 |
Figure 5 CCND1, FGF3, FGF4, FGF19 and FADD amplification was found in CD4+T cell and dendritic cell infiltration in the breast cancer. |
Validation of the Protein Levels of FADD, CCND1 and P53 in Clinical Samples
To verify the results derived from the investigation of published databases, 156 breast cancer tissue samples with completed clinical data and data masking were collected, and all experiments were approved by the Institutional Review Boards of the First Affiliated Hospital of Jinan University. Immunohistochemical staining was conducted following a standard operation procedure in our clinical laboratory. The clinical information of the 156 samples is shown in Table 1. Among the 156 samples, 26 were luminal A type, 51 were luminal B type, 42 were TNBC type, and 37 were Her-2 overexpression type (Table 1). The expression ratio of FADD, CCND1 and P53 were 85.26% (133/156), 34.62% (54/156), and 63.46% (99/156), respectively (Figure 6). Among these, the expression level of CCND1 was closely correlated with breast cancer molecular subtype and showed statistical significance (χ2 = 11.195 P = 0.011) (Table 2). Notably, the expression of CCND1 in luminal B subtype breast cancer is higher than that in TNBC subtype (P < 0.0071) (χ2 = 7.560 P = 0.006). Similarly, the expression level of CCND1 was closely correlated with breast cancer histological grade and showed statistical significance (χ2 = 8.594 P = 0.014) (Table 2), and the expression of CCND1 in Grade 3 was higher than that in Grade 2 (P < 0.0125) (χ2 = 8.600 P = 0.003) (Table 3). Moreover, the expression level of FADD was related to the molecular subtype of breast cancer, and the difference was statistically significant (χ2 = 15.303 P = 0.001) (Table 2); especially the expression of FADD in Her-2- enriched subtype is also higher than that in TNBC (P <0.0071) (χ2 = 11.998 P = 0.001) (Table 4). In addition, it was shown that a slightly positive correlation was seen between the expression of FADD and CCND1 (r = 0.331, P < 0.000) in the analyzed samples; but no significant correlation was found between the expression of FADD and P53 (r = 0.136, P = 0.091), as well as between CCND1 and P53 expression (r = 0.020, P = 0.807) (Table 5). Metastasis-free survival (MFS), the time period from the beginning of surgery for breast cancer patients to the observation of distant metastasis of the tumor, was used to follow up survival of patients. In this study, the follow-up time period was 25 to 82 months, the median follow-up time was 52 months, 23 patients had metastasis, and 1 patient was lost to follow-up. According to the Kaplan-Meier method of survival analysis, the Log rank test was used to analyze CCND1 (χ2 = 4.404 P = 0.036) (Figure 7A), P53 (χ2 = 5.365 P = 0.021) (Figure 7B), and FADD (χ2 = 3.925 P = 0.048) (Figure 7C). As shown in the figures, the difference in metastasis-free survival between the ER+ CCND1-positive group and the ER+ CCND1-negative group was statistically significant (χ2 = 4.074 P = 0.044) (Figure 7D).
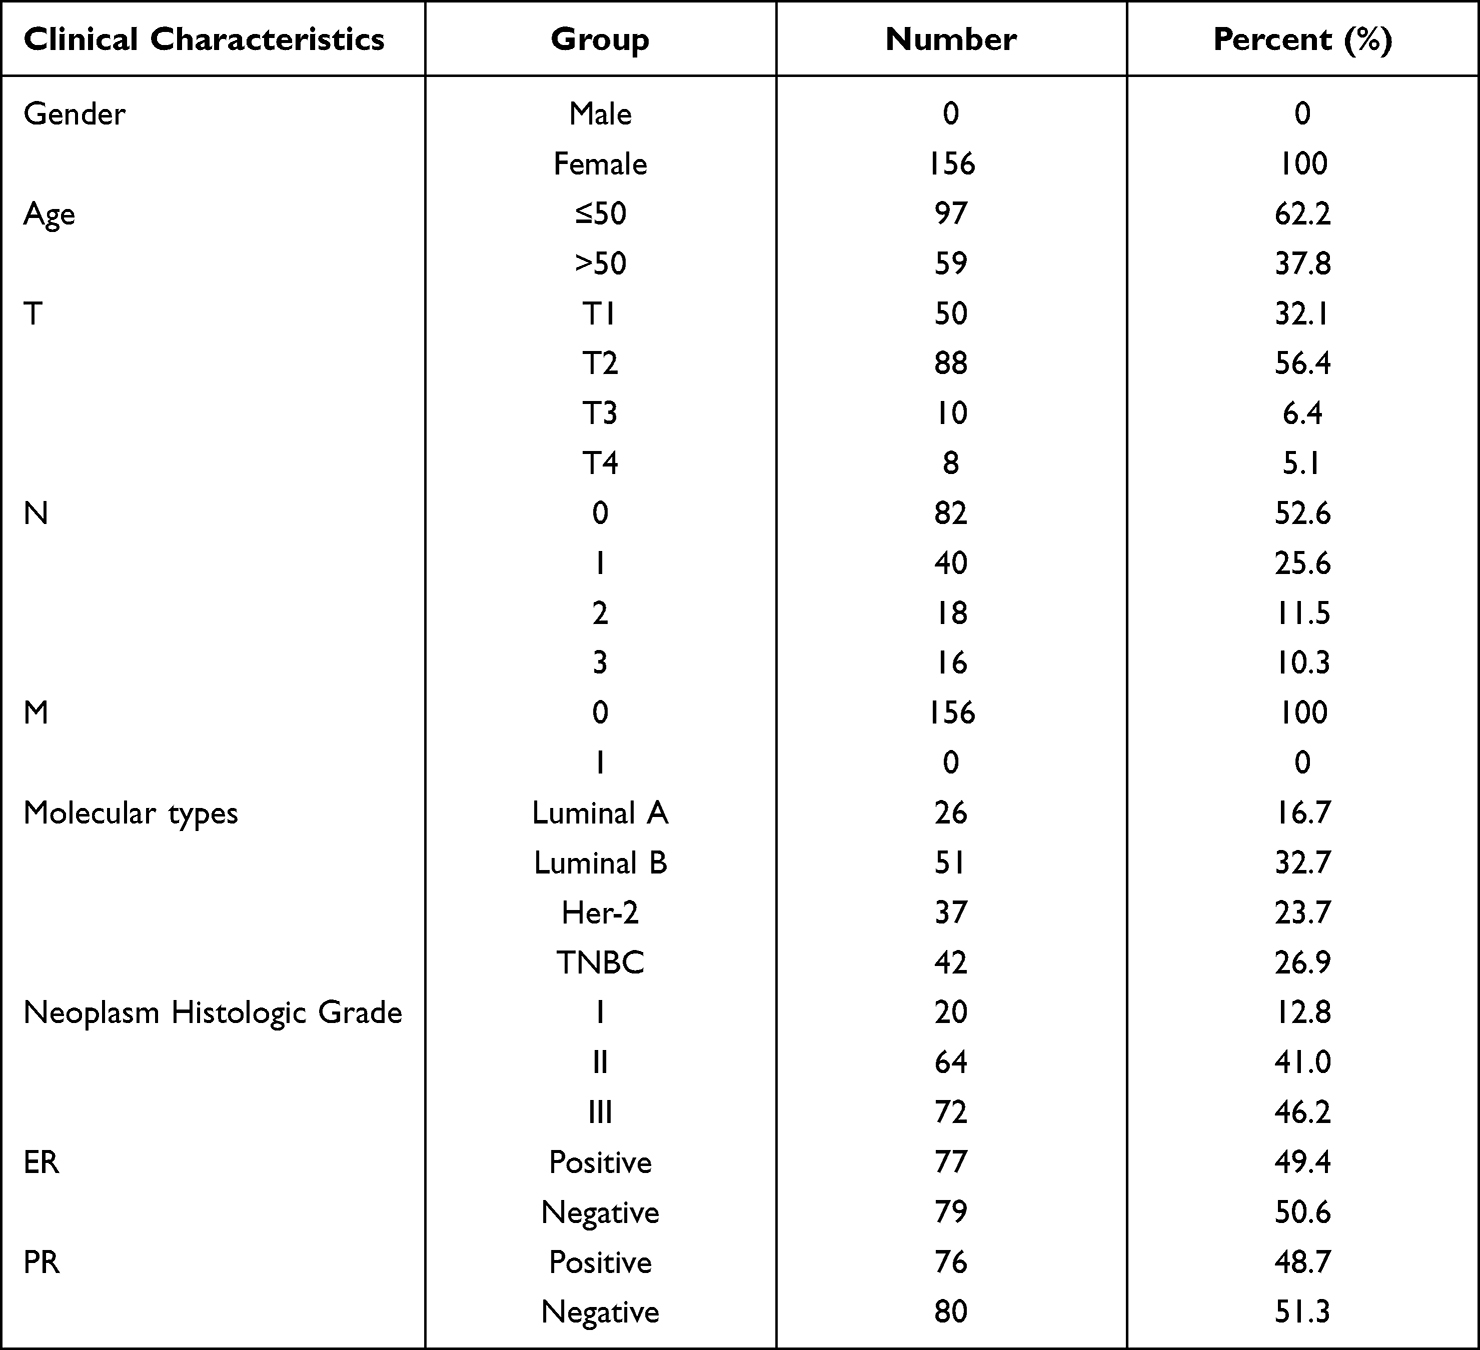 |
Table 1 Analysis of Clinical Case Characteristics of 156 Patients at the Time of Their First Cancer Diagnosis |
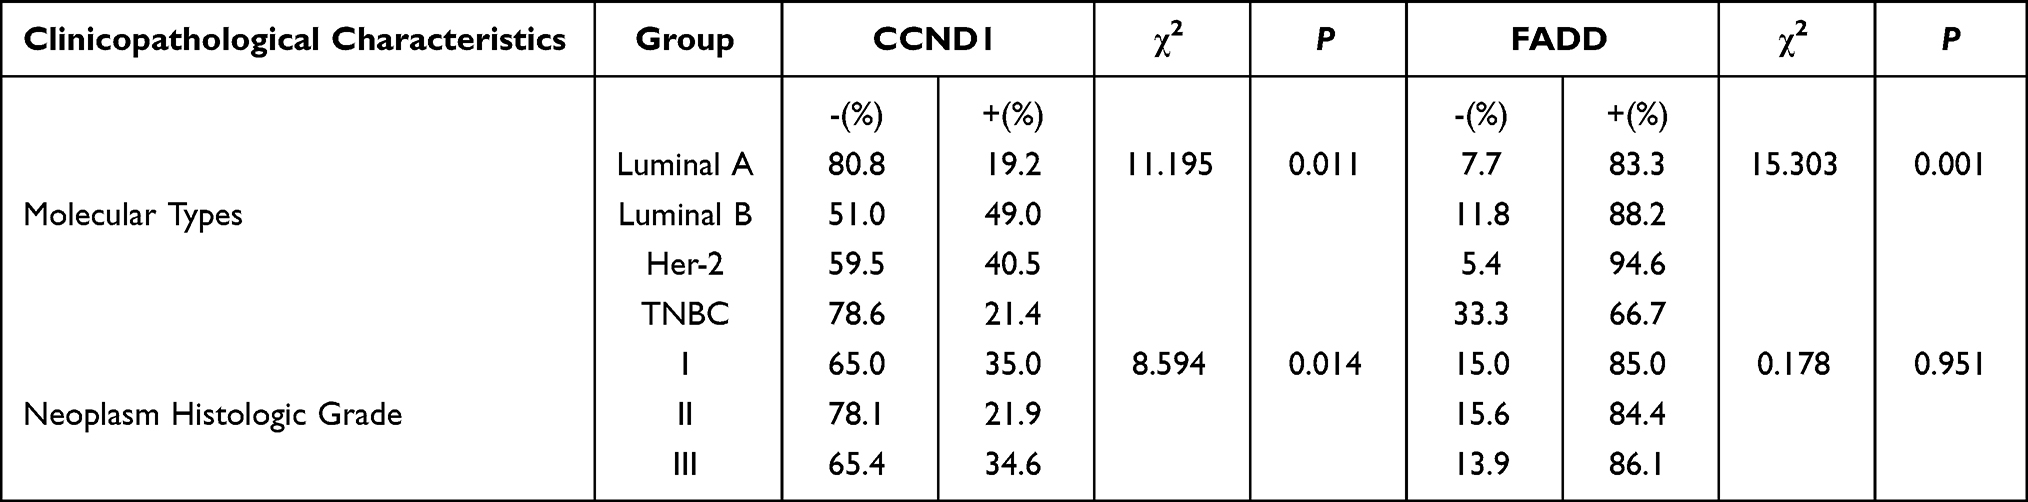 |
Table 2 The Relationship Between CCND1, FADD Expression and Molecular Type and Histological Grade |
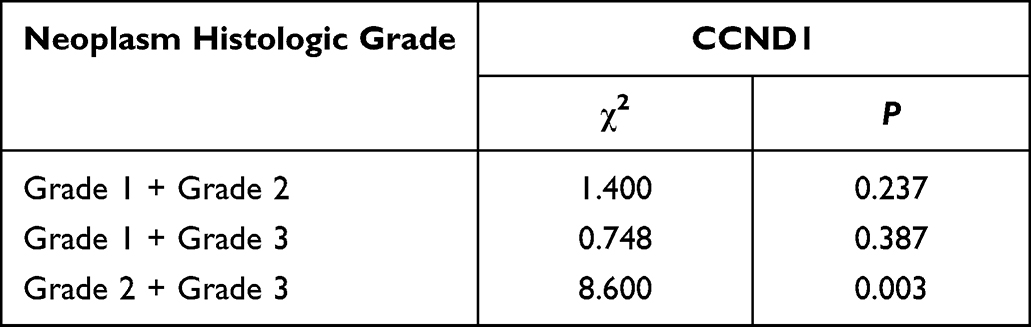 |
Table 3 The Relationship Between CCND1 Protein Expression and Histological Grade |
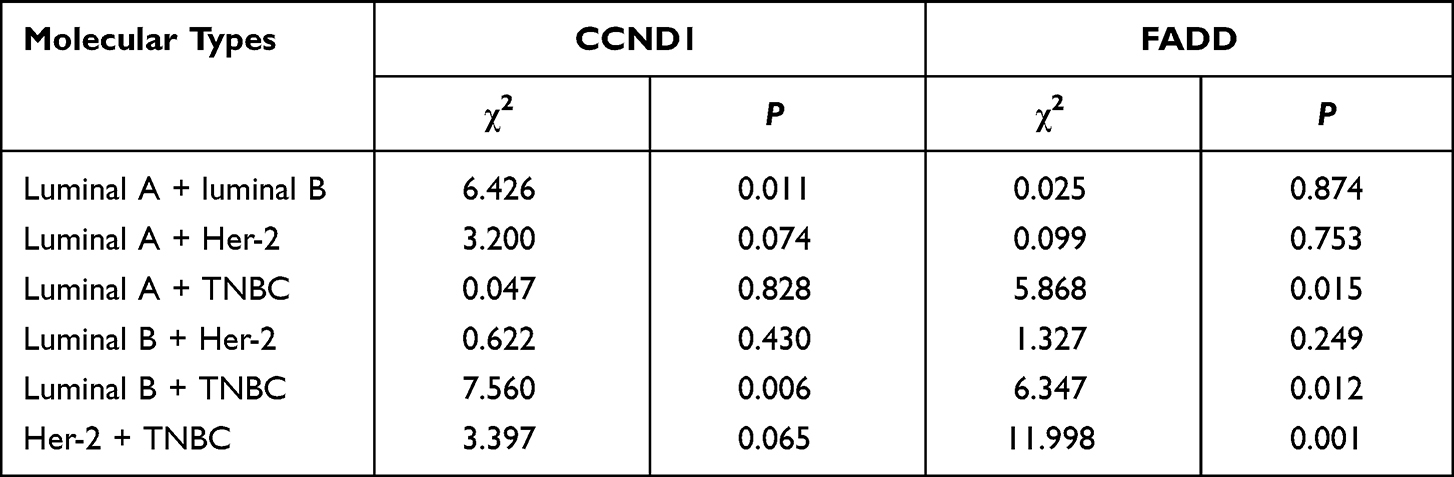 |
Table 4 The Relationship Between Expression of CCND1 Protein and FADD Protein and Molecular Subtype |
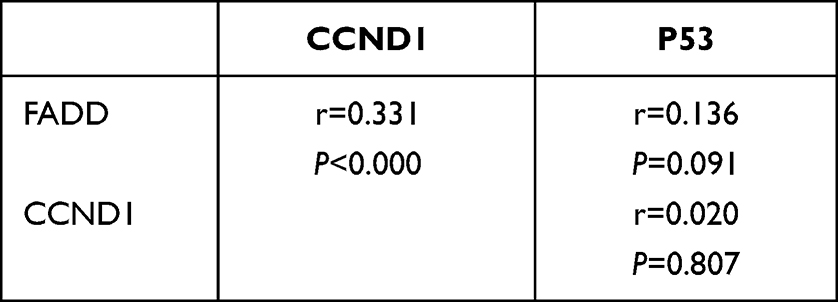 |
Table 5 Correlation Analysis of CCND1, FADD, P53 Expression |
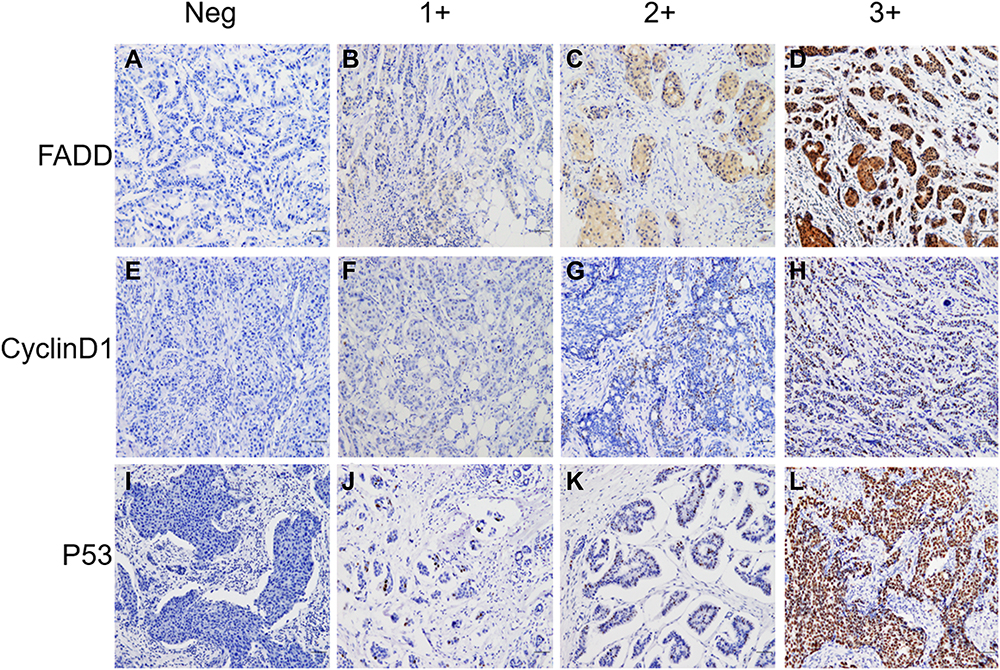 |
Figure 6 The expression of FADD in breast cancer, tumor cells were negative expression (A), tumor cells were weak expression (B and C), and tumor cells were strongly positive (D). The expression of CCND1 in breast cancer, tumor cells were negative expression (E), tumor cells were weak expression (F and G), and tumor cells were strongly positive (H). The expression of P53 in breast cancer, tumor cells were negative expression (I), tumor cells were weak expression (J and K), and tumor cells were strongly positive (L). (×100 scl bar=100μm). |
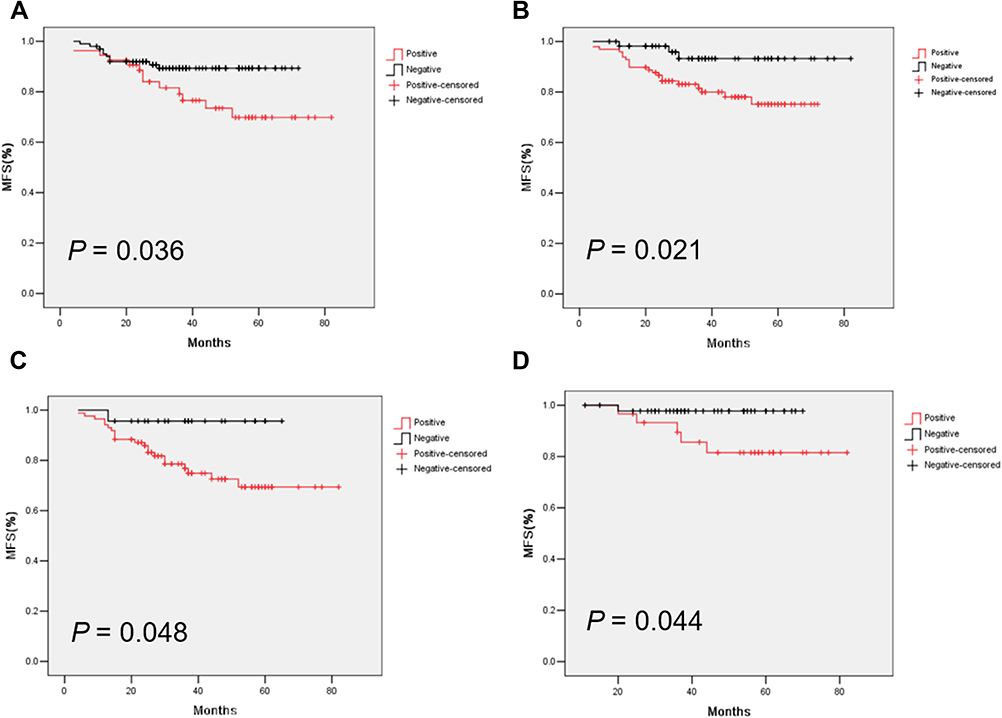 |
Figure 7 Metastasis-free survival curves of CCND1 (A), P53 (B), FADD (C), metastasis-free survival in CCND1 positive and CCND1 negative patients with ER positive breast cancer (D). |
Discussion
In this study, we have determined that amplification of the 11q13.3 locus is more frequently detected in recurrent and metastatic breast cancer according to bioinformatics analysis of several published databases of clinical cohorts, especially in grade 3, luminal B, ER+ breast invasive carcinoma with poor prognosis. In addition, amplification of 11q13.3 occurs at high frequencies in lung squamous cell carcinoma, head and neck squamous cell carcinoma, urothelial carcinoma, gastric adenocarcinoma and ovarian cancer. Early studies have reported that there are four distinct core amplicons within the 11q13 locus that contain more than 50 genes, and these genes can be amplified independently or coamplified during the development of tumors.16 Several genes in this region have been identified as putative oncogenes and coamplified in breast cancer, and CCND1 is the most extensively investigated gene of this locus, which has been reported to be amplified with other genes, such as PAK1, LTO1, FADD, FGF19, FGF4 and FGF3. Indeed, CCND1 is one of the important partners of cyclin-dependent kinase 4/6 (CDK4/6) that regulates the entry and transition of the G1 cell cycle upon stimulation of environmental proliferative signaling. Binding CCND1 to CDK4/6 activates the kinase and releases the transcription factor E2F from the protein complex via phosphorylation and degradation of retinoblastoma protein (RB). Free E2F transcription factors consequently promote the transcription of genes that are required for S phase of the cell cycle, including cyclin E, cyclin A and CDK2. Further activation of cyclin E-CDK2 and the cyclin A-CDK2 complex completes the transition from G1 to S phase.27 Therefore, CCND1 is considered an oncogene, and its product may serve as a driver of cell proliferation, angiogenesis, and resistance to chemotherapy and radiotherapy.28 It has been reported that amplification of CCND1 alone or with PAK1 indicates a reduced recurrence-free survival of patients with ER-positive breast cancer.29,30 However, CCND1 amplification alone was unable to predict the response to tamoxifen treatment in these patients, while coamplification of CCND1 with PAK1 showed decreased benefit from the drug,29 indicating that amplification of CCND1 alone may not be an independent predictor of tamoxifen resistance, and functional correlation with other genes might accelerate the progression of breast cancer. This notion has been implied by previous studies showing that amplification or overexpression of FADD with CCND1 is closely related to breast cancer axillary lymph node metastasis.31,32 Similarly, coamplification of CTTN and CCND1 is closely correlated with the poor prognosis of head and neck squamous cell carcinoma.33 Our current study also confirmed that overexpression of the CCND1 and FADD genes are critical indicators of the clinical outcome of breast cancer (Figure 7).
Accordingly, FGF3, FGF4, and FGF19, constituting a gene set located at the 11q13.3 locus that is frequently coamplified with CCND1, were also confirmed in our study. FGF3, FGF4, and FGF19 are the critical ligands of the FGFR1-4 receptor family on the surface of tumor cells. Binding FGF3, FGF4, and FGF19 to the corresponding receptor FGFR1-4 activates downstream mitogen-activated protein kinases (MAPKs)/extracellular signal-regulated kinases 1 and 2 (ERK1/2) and the phosphoinositide-3 kinase/Akt serine/threonine kinase (PI3K/Akt) pathway.34 Hyperactivation of these two signaling pathways plays a pivotal role in cell proliferation, survival, migration, differentiation and inhibition of apoptosis, which may confer drug resistance, recurrence and metastasis in cancers,35 indicating that the FGF/FGFR axis is an important sustained signaling pathway for cancer progression. It has been reported that FGFR1, FGFR2 or FGFR3 amplifications or FGFR2 mutations were detected in approximately 40% of recurrent breast cancer cases36–38 and approximately 8–15% of primary breast cancer cases.39,40 Aberrant activation of the FGF/FGFR pathway has been confirmed to confer broad resistance to ER, PI3K, and CDK4/6 inhibitors in ER+ breast cancer, and the resistant phenotypes can be reversed by FGFR inhibitors, suggesting that the combination of FGFR inhibitors with ER or other inhibitors might overcome resistance in patients with ER(+)/FGFR1(+) metastatic breast cancer.36–38
Importantly, the coevolution of cancer cells with stromal components has been recognized as a hallmark of solid tumors.41 To obtain further insights into the impacts of intrinsic cancer cell evolution with gene amplification on the stromal microenvironment, particularly alterations in the immune microenvironment, we further analyzed the correlation of 11q13.3 amplification with the infiltration of immune cells in breast cancer from the published TIMER2.0 database. The data showed that high expression or amplification of CCND1, FGF3, FGF4, FGF19 and FADD was negatively correlated with the abundance of CD4+ T cells and dendritic cell infiltration in breast cancer. However, no significant correlation of these amplicon genes with CD8+ T cell, NKT and B cell infiltration was found based on the dataset analysis. The results indicated that amplification of the 11q13.3 amplicon might decrease antitumor activity during the development and progression of breast cancer. Recent studies have suggested that cancers with CCND1 amplification hijack immune cells and promote the establishment of an immunosuppressive microenvironment through immune cell exclusion and exhaustion of immune cells.42 The immunosuppressive niche and exhaustion of immune cells may abolish the clinical effect of immune checkpoint inhibitors (ICIs), such as PD-1 inhibitors pembrolizumab (KEYTRUDA) and nivolumab (OPDIVO), and the PD-L1 inhibitors atezolizumab (TECENTRIQ) and durvalumab (imfinzi). These hijacked actions are usually attributed to aberrant activation of multiple oncogenic signaling pathways, including the epithelial mesenchymal transition (EMT) core program, hypoxia signaling, transforming growth factor (TGF)-β signaling, tumor necrosis factor (TNF)-α signaling via nuclear factor (NF)-κB, MYC targets, KRAS and phosphoinositide 3-kinase (PI3K)/AKT/mammalian target of rapamycin (mTOR) signaling, the p53 pathway and so on.42 Indeed, as mentioned above, the CCND1-FGF locus contains FGF3, FGF4, and FGF19 genes, which are frequently coamplified in several types of tumors, implying that crosstalk between abnormal regulation of the cell cycle machinery and hyperactivation of the MAPK/ERK1/2 and PI3K/AKT pathways may reprogram the tumor microenvironment. Previous studies have also shown that VEGFA has direct or indirect effects on components of the immune system, including inhibition of DC maturation and CD8+ T cell proliferation, affecting ICAM1 to inhibit NK cell and T cell trafficking, resulting in immunosuppression.43 Importantly, several lines of evidence have suggested that CCND1 may play a crucial role in the maintenance of VEGF expression and may be useful for targeting both cancer cells and the microenvironment of tumor vessels.44 Similarly, FADD, another gene located at the 11q13.3 locus, was found to be frequently amplified in breast cancer from the current database analysis and overexpressed in clinically validated samples with poor prognosis. FADD is an adaptor molecule for death receptor-mediated apoptosis with a pivotal role in cancer and inflammation that may contribute to the response to immunotherapy.45–47 Therefore, coamplification of CCND1, FGF3, FGF4, FGF19 and FADD in the 11q13.3 amplicon is likely to be a potential biomarker gene set for the prediction of responses to immune checkpoint inhibitors (ICIs) and other cancer treatment regimens.
Taken together, we have demonstrated that coamplification of genes located on the 11q13.3 amplicon is frequently detected in luminal B subtype breast cancer and closely associated with worse survival in patients with breast cancer. Moreover, coamplification of the CCND1-FGF locus might decrease antitumor immune activity via possibly promoting the establishment of an immunosuppressive microenvironment in breast cancer, indicating that coamplification of genes at the 11q13.3 amplicon is likely to be a key determinant for therapeutic resistance and accelerate the aggressive evolution of breast cancer. However, the potential mechanisms underlying the generation of 11q13.3 locus amplification under therapeutic stress and the impact of coevolution of cancer cells harboring gene amplification with stroma on treatment resistance have not been fully unveiled. Further experiments are ongoing to elucidate these alterations and the underlying mechanisms.
Conclusions
This study demonstrated that coamplification of genes located on the 11q13.3 amplicon is frequently detected in luminal B subtype breast cancer and is closely associated with worse survival in patients with breast cancer. Moreover, coamplification of the CCND1-FGF locus might decrease antitumor immune activity in breast cancer, indicating that coamplification of the 11q13.3 amplicon is likely to be a key determinant of therapeutic resistance and accelerate the aggressive evolution of breast cancer. Targeting genes located on this amplicon may be a novel strategy to overcome drug resistance in breast cancer.
Data Sharing Statement
The datasets for this study can be found in the online repositories. The names of the repository/repositories and accession number(s) can be found in the article/supplementary materials.
Ethics Approval and Informed Consent
The study was approved by the IRB of the First Affiliated Hospital of Jinan University. Permit numbers: KY-2021-105. All procedures performed in the present study were in accordance with the principles outlined in the 1964 Helsinki Declaration and its later amendments. Data were retrieved from online databases, and tissue samples were collected from the Department of Clinical Pathology at the First Affiliated Hospital of Jinan University, and confidentiality and anonymity were assured as no personal identifiers were used.
Acknowledgments
The authors would like to thank all publicly available data used in the present study.
Author Contributions
All authors made substantial contributions to conception and design, acquisition of data, or analysis and interpretation of data; took part in drafting the article or revising it critically for important intellectual content; agreed to submit to the current journal; gave final approval of the version to be published; and agree to be accountable for all aspects of the work.
Funding
This study was supported by a grant from the National Natural Science Foundation of China (Grant No. 81572606).
Disclosure
The authors declare no conflicts of interest in this work.
References
1. Sung H, Ferlay J, Siegel RL, et al. Global cancer statistics 2020: GLOBOCAN estimates of incidence and mortality worldwide for 36 cancers in 185 countries. CA Cancer J Clin. 2021;71(3):209–249. PMID: 33538338. doi: 10.3322/caac.21660
2. Chen W, Zheng R, Baade PD, et al. Cancer statistics in China, 2015. CA Cancer J Clin. 2016;66(2):115–132. doi:10.3322/caac.21338
3. DeSantis CE, Siegel RL, Sauer AG, et al. Cancer statistics for African Americans, 2016: progress and opportunities in reducing racial disparities. CA Cancer J Clin. 2016;66(4):290–308. doi:10.3322/caac.21340
4. Bray F, Ferlay J, Soerjomataram I, Siegel RL, Torre LA, Jemal A. Global cancer statistics 2018: GLOBOCAN estimates of incidence and mortality worldwide for 36 cancers in 185 countries. CA Cancer J Clin. 2018;68(6):394–424. doi:10.3322/caac.21492
5. Perou CM, Sorlie T, Eisen MB, et al. Molecular portraits of human breast tumours. Nature. 2000;406(6797):747–752. doi:10.1038/35021093
6. Razavi P, Chang MT, Xu G, et al. The genomic landscape of endocrine-resistant advanced breast cancers. Cancer Cell. 2018;34(3):427–38.e6. doi:10.1016/j.ccell.2018.08.008
7. Bertucci F, Ng CKY, Patsouris A, et al. Genomic characterization of metastatic breast cancers. Nature. 2019;569(7757):560–564. doi:10.1038/s41586-019-1056-z
8. Jiang YZ, Ma D, Suo C, et al. Genomic and transcriptomic landscape of triple-negative breast cancers: subtypes and treatment strategies. Cancer Cell. 2019;35(3):428–40.e5. doi:10.1016/j.ccell.2019.02.001
9. Bareche Y, Venet D, Ignatiadis M, Aftimos P, Sotiriou C. Unravelling triple-negative breast cancer molecular heterogeneity using an integrative multiomic analysis. Ann Oncol. 2018;29(4):895–902. doi:10.1093/annonc/mdy024
10. Li R, Du Y, Chen Z, et al. Macroscopic somatic clonal expansion in morphologically normal human urothelium. Science. 2020;370(6512):82–89. doi:10.1126/science.aba7300
11. Lee-Six H, Olafsson S, Ellis P, et al. The landscape of somatic mutation in normal colorectal epithelial cells. Nature. 2019;574(7779):532–537. doi:10.1038/s41586-019-1672-7
12. Shoshani O, Brunner SF, Yaeger R, et al. Chromothripsis drives the evolution of gene amplification in cancer. Nature. 2021;591(7848):137–141. doi:10.1038/s41586-019-1672-7
13. Maciejowski J, Li Y, Bosco N, Campbell PJ, de Lange T. Chromothripsis and Kataegis induced by telomere crisis. Cell. 2015;163(7):1641–1654. doi:10.1016/j.cell.2015.11.054
14. Loibl S, Treue D, Budczies J, et al. Mutational diversity and therapy response in breast cancer: a sequencing analysis in the neoadjuvant GeparSepto trial. Clin Cancer Res. 2019;25(13):3986–3995. doi:10.1158/1078-0432
15. Bernard-Pierrot I, Gruel N, Stransky N, et al. Characterization of the recurrent 8p11-12 amplicon identifies PPAPDC1B, a phosphatase protein, as a new therapeutic target in breast cancer. Cancer Res. 2008;68(17):7165. doi:10.1158/0008-5472
16. Wilkerson PM, Reis-Filho JS. The 11q13-q14 amplicon: clinicopathological correlations and potential drivers. Genes Chromosomes Cancer. 2013;52(4):333–355. doi:10.1002/gcc.22037
17. Voutsadakis IA. Chromosome 17 centromere amplification and chromosomal instability (CIN) in breast cancer: pathogenic and therapeutic implications. Neoplasma. 2019;66(6):859–869. doi:10.4149/neo_2019_190309N203
18. Gao J, Aksoy B, Dogrusoz U, et al. Integrative analysis of complex cancer genomics and clinical profiles using the cBioPortal. Sci Signal. 2013;6(269):pl1. doi:10.1126/scisignal.2004088
19. Cancer Genome Atlas N. Comprehensive molecular portraits of human breast tumours. Nature. 2012;490(7418):61–70. doi:10.1038/nature11412.
20. Taylor AM, Shih J, Ha G, et al. Genomic and functional approaches to understanding cancer aneuploidy. Cancer Cell. 2018;33(4):676–89.e3. doi:10.1016/j.ccell.2018.03.007
21. Dewey CN, Li B. RSEM: accurate transcript quantification from RNA-Seq data with or without a reference genome. BMC Bioinform. 2011;12(1):323. doi:10.1186/1471-2105-12-323
22. Curtis C, Shah SP, Chin SF, et al. The genomic and transcriptomic architecture of 2000 breast tumours reveals novel subgroups. Nature. 2012;486(7403):346–352. doi:10.1038/nature10983
23. Lefebvre C, Bachelot T, Filleron T, et al. Mutational profile of metastatic breast cancers: a retrospective analysis. PLoS Med. 2016;13(12):e1002201. doi:10.1371/journal.pmed.1002201
24. Li T, Fu J, Zeng Z, et al. TIMER2.0 for analysis of tumor-infiltrating immune cells. Nucleic Acids Res. 2020;48(W1):W509–W14. doi:10.1093/nar/gkaa407
25. Sun CC, Li SJ, Hu W, et al. Comprehensive analysis of the expression and prognosis for E2Fs in human breast cancer. Mol Ther. 2019;27(6):1153–1165. doi:10.1016/j.ymthe.2019.03.019
26. Zhong Y, Yang S, Wang W, et al. The interaction of Lin28A/Rho associated coiled-coil containing protein kinase2 accelerates the malignancy of ovarian cancer. Oncogene. 2019;38(9):1381–1397. doi:10.1038/s41388-018-0512-9
27. Dickson C, Fantl V, Gillett C, et al. Amplification of chromosome band 11q13 and a role for cyclin D1 in human breast cancer. Cancer Lett. 1995;90(1):43–50. doi:10.1016/0304-3835(94)03676-a
28. Musgrove E, Caldon CE, Barraclough J, Stone A, Sutherland RL. Cyclin D as a therapeutic target in cancer. Nat Rev Cancer. 2011;11(8):558–572. doi:10.1038/nrc3090
29. Bostner J, Ahnstrom Waltersson M, Fornander T, Skoog L, Nordenskjold B, Stal O. Amplification of CCND1 and PAK1 as predictors of recurrence and tamoxifen resistance in postmenopausal breast cancer. Oncogene. 2007;26(49):6997–7005. doi:10.1038/sj.onc.1210506
30. Jirstrom K, Stendahl M, Ryden L, et al. Adverse effect of adjuvant tamoxifen in premenopausal breast cancer with cyclin D1 gene amplification. Cancer Res. 2005;65(17):8009–8016. doi:10.1158/0008-5472.CAN-05-0746
31. Callegari CC, Cavalli IJ, Lima RS, et al. Copy number and expression analysis of FOSL1, GSTP1, NTSR1, FADD and CCND1 genes in primary breast tumors with axillary lymph node metastasis. Cancer Genet. 2016;209(7–8):331–339. doi:10.1016/j.cancergen.2016.06.003
32. Marin-Rubio JL, Vela-Martin L, Fernandez-Piqueras J, Villa-Morales M. FADD in cancer: mechanisms of altered expression and function, and clinical implications. Cancers. 2019;11(10):1462. doi:10.3390/cancers11101462
33. Wang J, Chen X, Tian Y, et al. Six-gene signature for predicting survival in patients with head and neck squamous cell carcinoma. Aging. 2020;12(1):767–783. doi:10.18632/aging.102655
34. Baird K, Davis S, Antonescu CR. Gene expression profiling of human sarcomas: insights into sarcoma biology. Cancer Res. 2005;65(20):9226–9235. doi:10.1158/0008-5472.CAN-05-1699
35. Chen S, Qiu Y, Guo P, Pu T, Feng Y, Bu H. FGFR1 and HER1 or HER2 co-amplification in breast cancer indicate poor prognosis. Oncol Lett. 2018;15(6):8206–8214. doi:10.3892/ol.2018.8423
36. Drago JZ, Formisano L, Juric D, et al. FGFR1 amplification mediates endocrine resistance but retains TORC sensitivity in metastatic hormone receptor-positive (HR(+)) breast cancer. Clin Cancer Res. 2019;25(21):6443–6451. doi:10.1158/1078-0432.CCR-19-0138
37. Mao P, Cohen O, Kowalski KJ, et al. Acquired FGFR and FGF alterations confer resistance to Estrogen Receptor (ER) targeted therapy in ER(+) metastatic breast cancer. Clin Cancer Res. 2020;26(22):5974–5989. doi:10.1158/1078-0432.CCR-19-3958
38. Formisano L, Lu Y, Servetto A, et al. Aberrant FGFR signaling mediates resistance to CDK4/6 inhibitors in ER+ breast cancer. Nat Commun. 2019;10(1):1373. doi:10.1038/s41467-019-09068-2
39. Andre F, Job B, Dessen P, et al. Molecular characterization of breast cancer with high-resolution oligonucleotide comparative genomic hybridization array. Clin Cancer Res. 2009;15(2):441–451. doi:10.1158/1078-0432.CCR-08-1791
40. Reis-Filho JS, Simpson PT, Turner NC, Lambros MB, Ashworth A. FGFR1 emerges as a potential therapeutic target for lobular breast carcinomas. Clin Cancer Res. 2006;12(22):6652. doi:10.1158/1078-0432.CCR-06-1164
41. Kalluri R, Zeisberg M. Fibroblasts in cancer. Nat Rev Cancer. 2006;6(5):392–401. doi:10.1038/nrc1877
42. Chen Y, Huang Y, Gao X, et al. CCND1 amplification contributes to immunosuppression and is associated with a poor prognosis to immune checkpoint inhibitors in solid tumors. Front Immunol. 2020;11:1620. doi:10.3389/fimmu.2020.01620
43. Khan KA, Kerbel RS. Improving immunotherapy outcomes with anti-angiogenic treatments and vice versa. Nat Rev Clin Oncol. 2018;15(5):310–324. doi:10.1038/nrclinonc.2018.9
44. Yasui M, Yamamoto H, Ngan CY, et al. Antisense to cyclin D1 inhibits vascular endothelial growth factor-stimulated growth of vascular endothelial cells: implication of tumor vascularization. Clin Cancer Res. 2006;12(15):4720–4729. doi:10.1158/1078-0432.CCR-05-1213
45. Tummers B, Mari L, Guy CS, et al. Caspase-8-dependent inflammatory responses are controlled by its adaptor, FADD, and necroptosis. Immunity. 2020;52(6):994–1006.e8. doi:10.1016/j.immuni.2020.04.010
46. Mouasni S, Tourneur L. FADD at the Crossroads between cancer and inflammation. Trends Immunol. 2018;39(12):1036–1053. doi:10.1016/j.it.2018.10.005
47. Razeghian E, Suksatan W, Sulaiman Rahman H, et al. Harnessing TRAIL-induced apoptosis pathway for cancer immunotherapy and associated challenges. Front Immunol. 2021;12:699746. doi:10.3389/fimmu.2021.699746
 © 2022 The Author(s). This work is published and licensed by Dove Medical Press Limited. The full terms of this license are available at https://www.dovepress.com/terms.php and incorporate the Creative Commons Attribution - Non Commercial (unported, v3.0) License.
By accessing the work you hereby accept the Terms. Non-commercial uses of the work are permitted without any further permission from Dove Medical Press Limited, provided the work is properly attributed. For permission for commercial use of this work, please see paragraphs 4.2 and 5 of our Terms.
© 2022 The Author(s). This work is published and licensed by Dove Medical Press Limited. The full terms of this license are available at https://www.dovepress.com/terms.php and incorporate the Creative Commons Attribution - Non Commercial (unported, v3.0) License.
By accessing the work you hereby accept the Terms. Non-commercial uses of the work are permitted without any further permission from Dove Medical Press Limited, provided the work is properly attributed. For permission for commercial use of this work, please see paragraphs 4.2 and 5 of our Terms.