")
Back to Journals » International Journal of Chronic Obstructive Pulmonary Disease » Volume 14
Clinical features of three-dimensional computed tomography-based radiologic phenotypes of chronic obstructive pulmonary disease
Authors Karayama M, Inui N, Yasui H, Kono M, Hozumi H , Suzuki Y , Furuhashi K, Hashimoto D, Enomoto N, Fujisawa T , Nakamura Y, Watanabe H, Suda T
Received 1 March 2019
Accepted for publication 30 May 2019
Published 24 June 2019 Volume 2019:14 Pages 1333—1342
DOI https://doi.org/10.2147/COPD.S207267
Checked for plagiarism Yes
Review by Single anonymous peer review
Peer reviewer comments 2
Editor who approved publication: Dr Richard Russell
Masato Karayama,1 Naoki Inui,1,2 Hideki Yasui,1 Masato Kono,1 Hironao Hozumi,1 Yuzo Suzuki,1 Kazuki Furuhashi,1 Dai Hashimoto,1 Noriyuki Enomoto,1 Tomoyuki Fujisawa,1 Yutaro Nakamura,1 Hiroshi Watanabe,2 Takafumi Suda1
1Second Division, Department of Internal Medicine, Hamamatsu University School of Medicine, Hamamatsu 431-3192, Japan; 2Department of Clinical Pharmacology and Therapeutics, Hamamatsu University School of Medicine, Hamamatsu 431-3192, Japan
Purpose: The diagnosis and severity of chronic obstructive pulmonary disease (COPD) are defined by airflow limitation using spirometry. However, COPD has diverse clinical features, and several phenotypes based on non-spirometric data have been investigated. To identify novel phenotypes of COPD using radiologic data obtained by three-dimensional computed tomography (3D-CT).
Patients and methods: The inner luminal area and wall thickness of third- to sixth-generation bronchi and the percentage of the low-attenuation area (less than −950 HU) of the lungs were measured using 3D-CT in patients with COPD. Using the radiologic data, hierarchical clustering was performed. Respiratory reactance and resistance were measured to evaluate functional differences among the clusters.
Results: Four clusters were identified among 167 patients with COPD: Cluster I, mild emphysema with severe airway changes, severe airflow limitation, and high exacerbation risk; Cluster II, mild emphysema with moderate airway changes, mild airflow limitation, and mild dyspnea; Cluster III, severe emphysema with moderate airway changes, severe airflow limitation, and increased dyspnea; and Cluster IV, moderate emphysema with mild airway changes, mild airflow limitation, low exacerbation risk, and mild dyspnea. Cluster I had the highest respiratory resistance among the four clusters. Clusters I and III had higher respiratory reactance than Clusters II and IV.
Conclusions: The 3D-CT-based radiologic phenotypes were associated with the clinical features of COPD. Measurement of respiratory resistance and reactance may help to identify phenotypic differences.
Keywords: airway, chronic obstructive pulmonary disease, clustering analysis, emphysema, phenotype, three-dimensional computed tomography
Introduction
The diagnosis and severity of chronic obstructive pulmonary disease (COPD) are based on airflow limitation as assessed by spirometry.1 However, COPD has complex and heterogeneous features and is not fully evaluable by spirometry alone. Assessment of non-spirometric data is also important for the management of COPD. For example, combined assessment of clinical factors such as body mass index (BMI), airflow limitation, dyspnea, and exercise capacity demonstrated a better predictive capability for the prognosis of COPD compared with assessment of the severity of airflow limitation alone.2 The current guideline emphasizes the importance of combined clinical assessment with symptoms and exacerbation risk, independent from the severity of airflow limitation.1
Phenotyping is valuable approach by which to understand the diverse features of various diseases. Cluster analysis, which groups subjects by their differences and similarities, has recently been used instead of binary classification (eg, “pink puffers vs blue bloaters” or “emphysema vs chronic bronchitis”) for the phenotyping of COPD. Clinical phenotypes identified by cluster analysis have demonstrated distinct differences in the clinical outcomes of patients with COPD.3–6
However, little is known about the radiologic phenotypes of COPD. Radiologic data provide important information about the clinical features of COPD. Emphysema and airway changes, two representative characteristics of computed tomography (CT) images in patients with COPD, are associated with airflow limitation, symptoms, and exacerbation.7–10 Previous studies of radiologic phenotypes of COPD were based on the traditional model of emphysema and chronic bronchitis; these studies therefore ignored mixed and/or intermediate phenotypes.10,11
In the current study, we aimed to identify novel radiologic phenotypes to understand the diverse features of COPD. We performed three-dimensional CT (3D-CT) analysis to evaluate complex structures of emphysema and bronchial airway changes that cannot be adequately evaluated by horizontal images of conventional CT. Using the radiological data obtained by 3D-CT, we performed a cluster analysis instead of a binary classification using a specific cutoff value to explore the radiologic phenotypes of COPD. We then clarified the clinical characteristics of the phenotypes. In addition, we evaluated respiratory resistance and reactance to reveal the differences in respiratory mechanics among the phenotypes.
Patients and methods
Patients
Clinically stable patients with COPD that satisfied the Global Initiative for Chronic Obstructive Lung disease (GOLD) definition,1 prospectively underwent chest CT, spirometry, and measurements of respiratory resistance and reactance. “Clinically stable patients” were defined as those with no requirement for a treatment change, no respiratory tract infection, and no exacerbation 4 weeks before study enrollment. Exacerbation was defined as worsening of respiratory symptoms that required additional treatments with short-acting bronchodilators plus antibiotics and/or oral corticosteroids.1 In addition, patients who received long-term oxygen therapy and those with diffuse pulmonary diseases, neuromuscular diseases, congenital anomalies of the lungs, or a history of thoracic surgery were excluded.
This study was conducted in accordance with the ethical standards of the Declaration of Helsinki. The study protocol was approved by the Institutional Review Board of Hamamatsu University School of Medicine (Hamamatsu, Japan). All patients provided written informed consent to be included in the study.
3D-CT analysis of lungs
Detailed information regarding 3D-CT of the lungs is described elsewhere.12–14 In brief, 3D-CT images of the lungs were reconstructed from multidetector-row computed tomography images (Aquilion 64; Toshiba Medical Systems, Tokyo, Japan) obtained in the supine position at the full-inspiration breath-hold using image analysis software (SYNAPSE VINCENT; Fujifilm, Tokyo, Japan). The wall thickness (WT, mm) and inner luminal area (Ai, mm2) of four levels of bronchi (third- to sixth-generation bronchi) in six airways that originated from six segmental bronchi (B1, B2, B3, B8, B9, and B10) in the right lung were automatically computed using the image analysis software. The airway measurements are expressed as the mean of the six airways adjusted by body surface area (BSA) (Ai/BSA and WT/√BSA, respectively). The percentage of the low-attenuation area (%LAA) (less than −950 HU) in the total lung area was also calculated using the software.
Measurement of respiratory resistance and reactance
Detailed information on measurement of respiratory resistance and reactance are described elsewhere.13,14 In brief, respiratory resistance and reactance were measured using a forced oscillation device (MostGraph-01; Chest M.I., Tokyo, Japan) according to standard recommendations.15,16 The following indices of respiratory resistance and reactance were measured during tidal breathing: respiratory resistance at 5 Hz (R5) and 20 Hz (R20), the difference between R5 and R20 (R5−R20), reactance at 5 Hz (X5, which had a negative value for higher reactance), resonant frequency (Fres; where the reactance crosses zero and the elastic and inertial forces are equal and opposite in magnitude), and the low-frequency reactance area (ALX; the integral of reactance from 5 Hz to Fres). Each index is expressed as the average value of the inspiratory and expiratory phases. Respiratory resistance and reactance were measured before spirometry to avoid the effect of forced breathing and on the same day as chest CT.
Statistical analyses
A hierarchical clustering method was performed using Ai/BSA and WT/√BSA of the third- to six-generation bronchi and %LAA to identify radiological clusters of the lungs in patients with COPD. The number of clusters was determined according to a scree plot of the distances between the clusters in a dendrogram of hierarchical clustering. At the point at which the scree plot rises up sharply, the clusters have enough distance between them, which means that the clusters have different characteristics (
Results
Patient characteristics
One hundred sixty-seven patients with COPD were evaluated (Table 1). More than 90% of the patients were male, and more than 50% of the patients were ≥70 years old. Thirty-three (19.8%) patients had a severe or very severe airflow limitation according to the GOLD definition. Seventy-three (43.7%) patients had a modified Medical Research Council (mMRC) dyspnea scale score of >2. Thirty-eight (22.8%) patients had a history of exacerbations within the previous year. Seven (4.2%) patients experienced more than two exacerbations, and nine (5.4%) patients required hospital admission due to exacerbation. Thirty-four (20.4%) patients received single-bronchodilator therapy with a long-acting muscarinic antagonist (LAMA) or a long-acting beta-2 agonist (LABA), and 47 (28.1%) received both a LABA and LAMA. Thirty-six (23.4%) patients received an inhaled corticosteroid in combination with a LAMA and/or LABA.
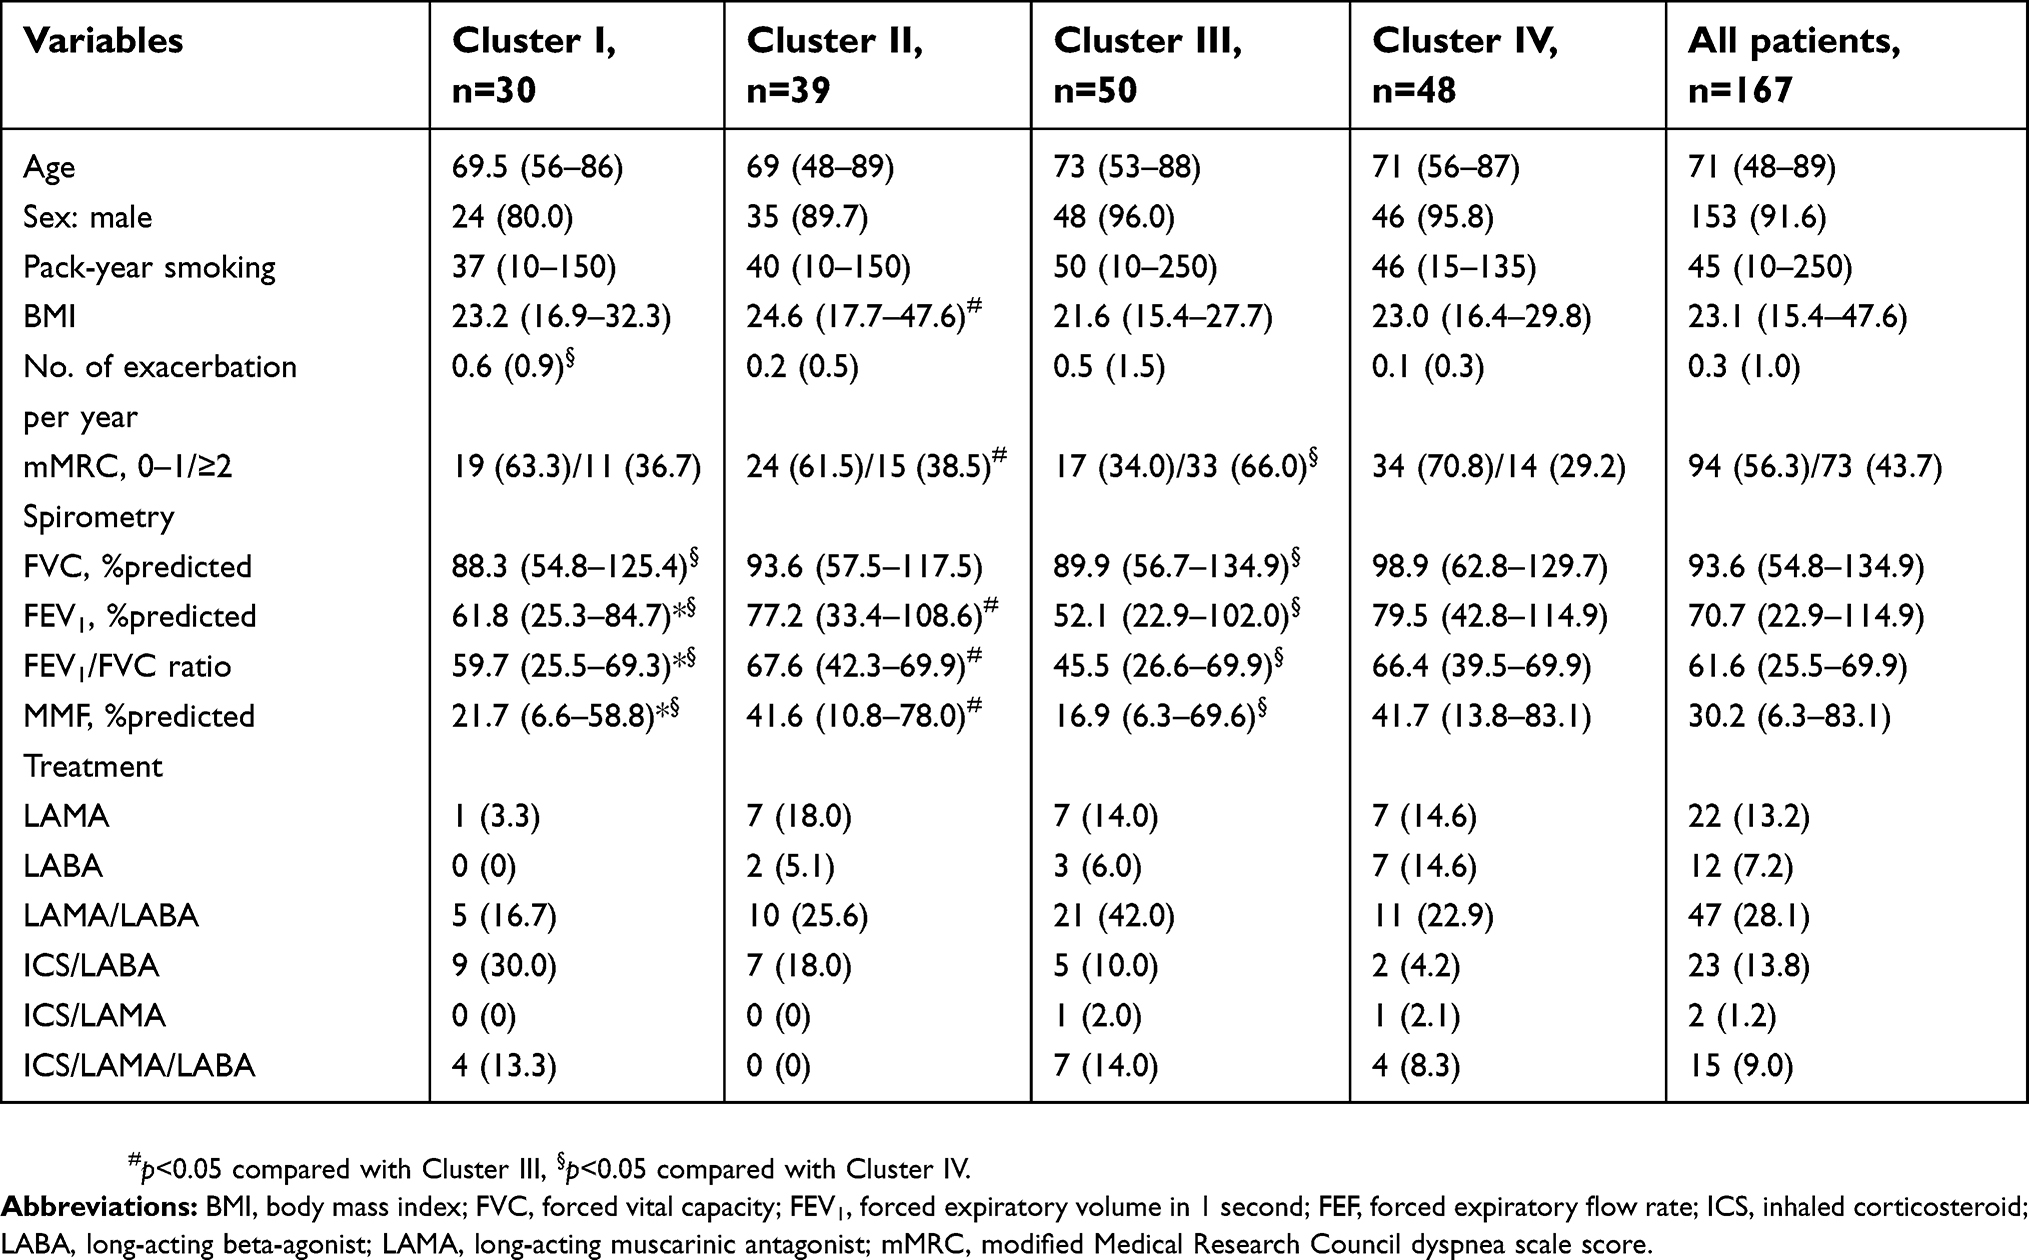 | Table 1 Patient characteristics |
Cluster analysis for 3D-CT of the lungs
A cluster analysis was performed using 3D-CT data, and four clusters were selected for this study (
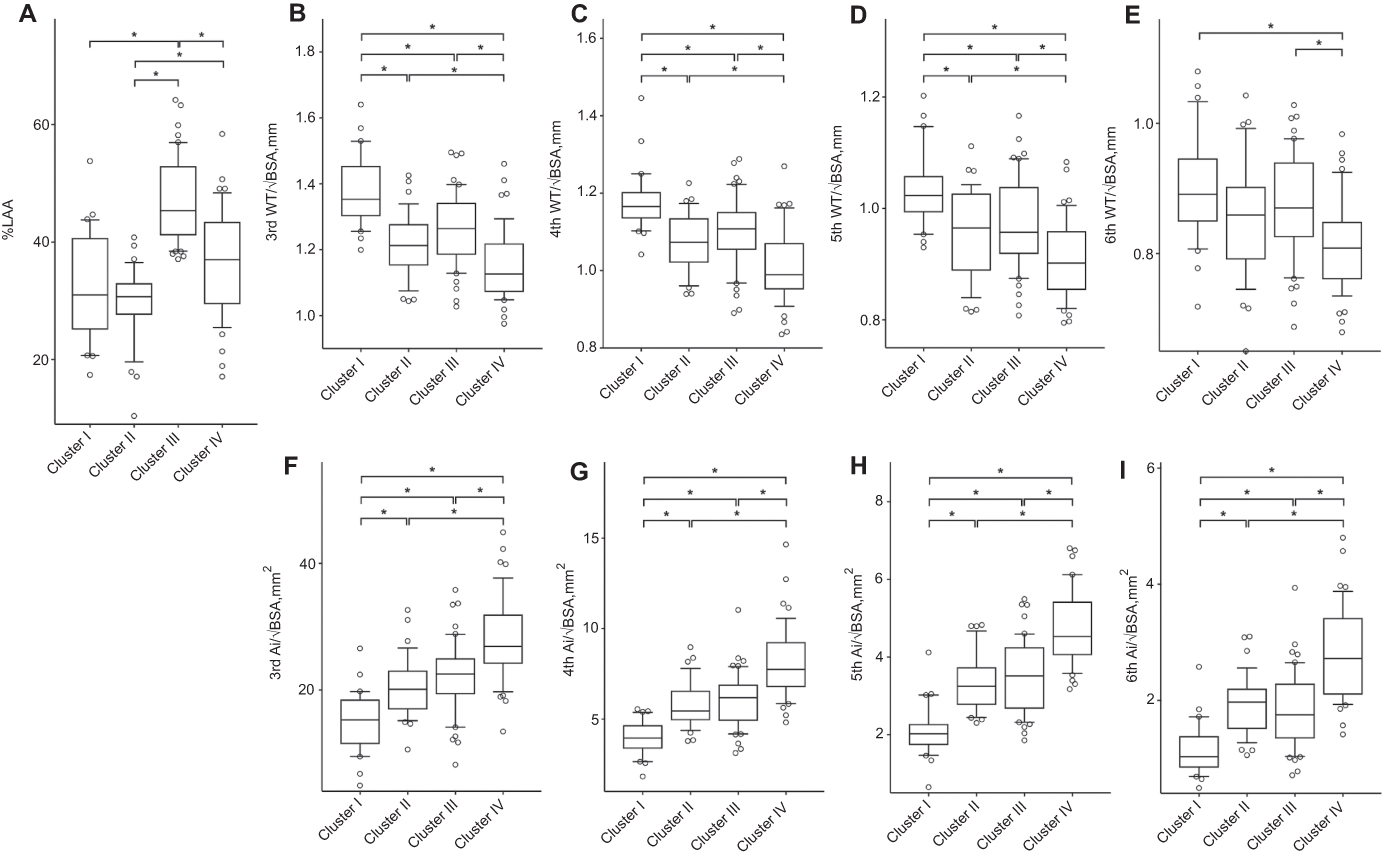 | Figure 1 Radiologic features of the four clusters. (A) Percentage of low-attenuation area (%LAA) (less than −950 HU) in the total lung area. (B–E) Wall thickness (WT, mm) adjusted by body surface area (WT/√BSA) of the third-, fourth-, fifth-, and sixth-generation bronchi, respectively. (F–I) Inner luminal area adjusted by body surface area (Ai/BSA) of the third-, fourth-, fifth-, and sixth-generation bronchi, respectively. Horizontal lines, boxes, error bars, and circles represent the median, 25th and 75th percentiles, 10th and 90th percentiles, and data apart from the 10th and 90th percentiles, respectively. *p<0.05. |
Clinical characteristics of the four clusters
All four clusters were comparable with respect to age, sex, and smoking history (Table 1). Cluster III had the lowest BMI, and it was significantly lower than that in Cluster II (p<0.001). Clusters I and III had a significantly lower percent predicted forced expiratory volume in 1 second (FEV1) than Clusters II and IV (p<0.001 for both). As a result, Clusters I and III had a larger proportion of patients with severe airflow limitation according to the GOLD definition than did Cluster II (p=0.003 and p<0.001, respectively) and Cluster IV (p<0.001 and p<0.001, respectively) (Figure 2A). The mean number of exacerbations within the previous year was 0.6, 0.2, 0.5, and 0.1 in Cluster I, II, III, and IV, respectively. Cluster I had significantly more frequent exacerbations than Cluster IV (p=0.023). The severity of dyspnea according to the mMRC dyspnea scale score was significantly greater in Cluster III than in Clusters II (p=0.018) and IV (p<0.001). With respect to the ABCD assessment of symptoms and risk of exacerbation established by GOLD,1 Cluster III had significantly different demographics than Clusters I (p=0.044) and IV (p=0.006) (Figure 2B).
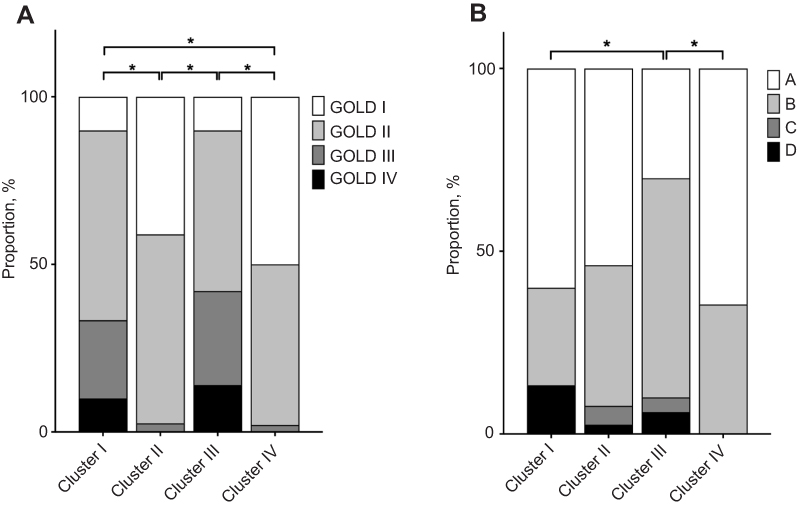 | Figure 2 Risk assessments of global initiative for chronic obstructive lung disease in the four clusters. (A) Severity of airflow limitation. (B) ABCD assessment of symptoms/risk of exacerbation. *p<0.05. |
Comparison of respiratory resistance and reactance among the four clusters
The respiratory resistance and reactance measurements are shown in Figure 3 and
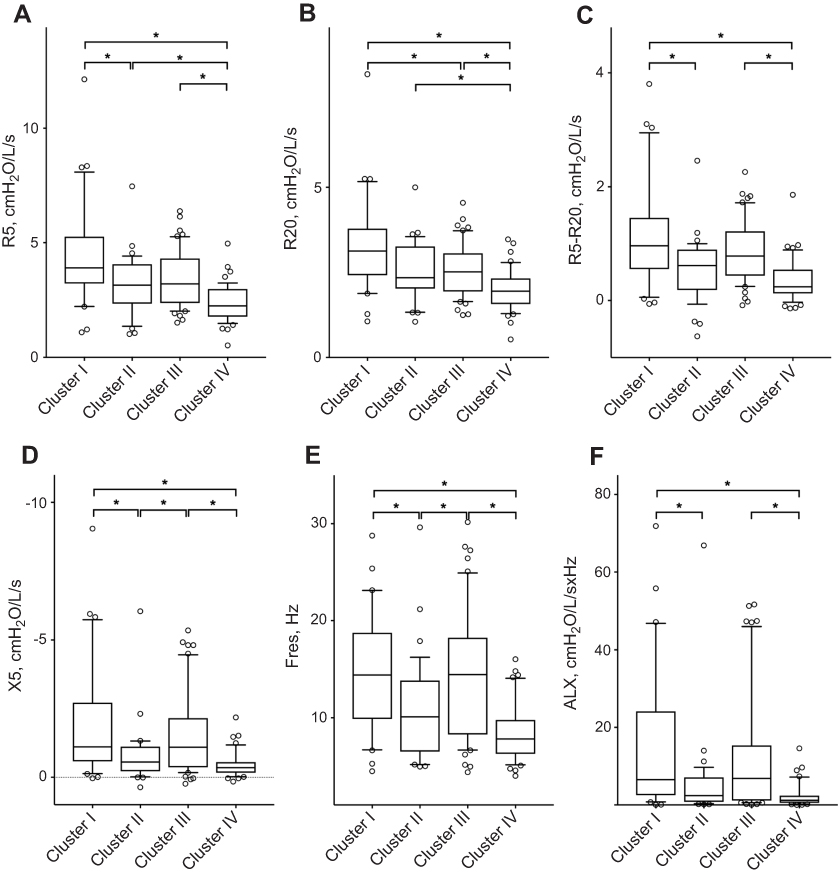 | Figure 3 Respiratory resistance and reactance of the four clusters. (A) Respiratory resistance at 5 Hz (R5). (B) Respiratory resistance at 20 Hz (R20). (C) Difference between R5 and R20. (D) Respiratory reactance at 5 Hz (X5). (E) Resonant frequency (Fres). (F) Low-frequency reactance area (ALX). Horizontal lines, boxes, error bars, and circles represent the median, 25th and 75th percentiles, 10th and 90th percentiles, and data apart from the 10th and 90th percentiles, respectively. *p<0.05. |
Discussion
The current study identified four radiologic phenotypes of COPD based on the degree of emphysema and airway changes: Cluster I, mild emphysema with severe airway changes, severe airflow limitation, and high exacerbation risk; Cluster II: mild emphysema with moderate airway changes, mild airflow limitation, and mild dyspnea; Cluster III, severe emphysema with moderate airway changes, severe airflow limitation, and increased dyspnea; and Cluster IV, moderate emphysema with mild airway changes, mild airflow limitation, low exacerbation risk, and mild dyspnea. Cluster I demonstrated the highest respiratory resistance among the four clusters, and Clusters I and III demonstrated higher respiratory resistance and reactance than Clusters II and IV. Our data indicate that radiologic phenotypes correspond to the clinical features of COPD and that measurement of respiratory resistance and reactance help to identify radiologic differences.
Airway changes and emphysema are not mutually exclusive characteristics. Even Clusters III and IV, which had emphysema-dominant features, demonstrated modest airway changes. In a previous study that divided patients into two radiologic phenotypes (emphysema- vs airway-predominant COPD) using a cutoff value, only 7.5 and 17.4% of the patients were respectively classified into each phenotype.10 Thus, the remaining 75% of the patients, who had characteristics of both emphysema- and airway-predominant COPD (or neither), were unclassified. Additionally, binary classification using a single cutoff value (eg, dominant vs non-dominant) would ignore patients with COPD of intermediate severity. The cluster analysis in the current study identified the radiologic phenotypes that had a mixture of a variable degree of emphysema and airway changes; these phenotypes may better reflect real-world patients.
Clusters I and II may correspond to the airway-dominant (or chronic bronchitis) phenotype in the traditional classification. Previous studies evaluated only patients with severe airway changes as having the airway-dominant phenotype; thus, patients with mild to moderate airway changes were excluded from the analyses.10,11 In the current study, the two airway-dominant clusters shared a common feature of having less emphysema, but they had distinct differences in that Cluster I had a greater degree of airway changes and thus more severe airflow limitation than Cluster II. Airway changes are essential pathological features of COPD, as is emphysema.17,18 Although the morphological airway parameters were obtained by CT measurement of central bronchi, the values were correlated with the pathological findings and are therefore considered surrogate markers for airway remodeling.19–21 Airway narrowing in CT is reportedly correlated with airflow limitation in patients with COPD,7,8,22–25 as found in the current study (
In contrast, Clusters III and IV may correspond to the emphysema phenotype in the traditional classification. In particular, Cluster III demonstrated severe emphysema, a low BMI, and severe airflow limitation. Emphysema is associated with respiratory symptoms in patients with COPD,26 as well as with airflow limitation.8,27–29 Actually, both %LAA and wall thickening were correlated with dyspnea in the current study (
Clusters I and III may be the most clinically important phenotypes. According to the severity of airflow limitation, GOLD I consisted mostly of Clusters II and IV, whereas GOLD III and IV consisted mostly of Clusters I and III (
Respiratory resistance and reactance are correlated with airway narrowing in patients with COPD and asthma.13,14 Additionally, respiratory reactance is correlated with the extent of emphysema.13 Given the correlations between lung morphology and respiratory resistance/reactance, Cluster I had the most severe airway narrowing and therefore demonstrated the highest resistance and reactance, and Cluster III had the most severe emphysema and the moderate airway narrowing and therefore demonstrated the highest reactance and moderate resistance. The clinical significance of each resistance component (R5, R20, and R5-R20) and reactance component (X5, Fres, and ALX) and the relationship of each with pulmonary morphology remain incompletely understood. Although these properties of respiratory resistance and reactance may contribute to identification of the morphological phenotypes of COPD, further studies are needed to establish the clinical utility of this measurement. Conversely, respiratory resistance and reactance can detect subtle changes in airway function even more sensitively than conventional spirometry.33–35 measurement of respiratory resistance and reactance is simple and noninvasive, requiring only quiet tidal breathing; in contrast, conventional spirometry requires a forced expiratory maneuver. Measurement of respiratory resistance and reactance is applicable to patients unable to perform spirometry; thus, it may also be advantageous in clinical practice.
This study had three main limitations. First, this was a cross-sectional study, and differences in long-term outcomes (such as the overall survival time or annual decline in FEV1) among the clusters were unknown. A longitudinal observation is required to validate the clinical significance of the clusters. Second, limited radiological data were applied for the clustering of COPD. COPD has several radiologic features other than those evaluated in this study, such as the distributional pattern or heterogeneity of emphysema,36 longitudinal shape irregularity of the airway lumen,37 and dynamic changes in the airway between inspiration and expiration.7 These radiologic features may help to identify other novel phenotypes. Third, the numbers of clusters also affected the results. The scree plot also indicated that three or five clusters were candidates; therefore, these clusters were prescreened before the final analysis. If we had employed three clusters, Clusters II and III would have been merged into one cluster exhibiting moderate airway changes and variable degrees of emphysema. Instead, Clusters II and III had distinctly different characteristics; therefore, we separated them into two different clusters. Alternatively, if we had employed five clusters, Cluster III would have been split into two new clusters with emphysema of comparable severity but different degrees of airway changes. Although these two new clusters might provide additional information, they comprised small numbers of patients (not enough to reach statistical significance); thus, they were grouped into one cluster. Our study raises the prospect of radiologic phenotypes of COPD but does not provide the final form of the phenotypes. The optimal factors for phenotyping and numbers of clusters should be further investigated.
Conclusions
The present clustering analysis using airway changes and emphysema on 3D-CT images identified four radiologic phenotypes of COPD that demonstrated distinct clinical characteristics. Additionally, respiratory resistance and reactance may be useful to distinguish the radiological phenotypes of COPD.
Abbreviation list
Ai, airway inner luminal area; ALX, low-frequency reactance area; BSA, body surface area; CT, computed tomography; COPD, chronic obstructive pulmonary disease; FEV1, forced expiratory volume in 1 second; Fres, resonant frequency; GOLD, Global Initiative for Chronic Obstructive Lung disease; LABA, long-acting beta-agonist; LAMA, long-acting muscarinic antagonist; mMRC, modified Medical Research Council dyspnea scale score; R5, respiratory resistance at 5 Hz; R20, respiratory resistance at 20 Hz; R5−R20, difference between respiratory resistance at 5 Hz and 20 Hz; WT, airway wall thickness; X5, respiratory reactance at 5 Hz; %LAA, percentage of low attenuation area; 3D-CT, three-dimensional computed tomography.
Acknowledgments
We thank Angela Morben, from Edanz Group, for editing the draft of this manuscript. This research did not receive any specific grant from funding agencies in the public, commercial, or not-for-profit sectors.
Disclosure
Hiroshi Watanabe reports grants from Japan Agency for Medical Research and Development (AMED), and consulting and lectures fees from Nippon Shinyaku and Acterion. He also received lecture fees from Bayer and Pfizer, outside the submitted work. The authors report no other conflicts of interest in this work.
References
1.
2. Celli BR, Cote CG, Marin JM, et al. The body-mass index, airflow obstruction, dyspnea, and exercise capacity index in chronic obstructive pulmonary disease. N Engl J Med. 2004;350(10):1005–1012. doi:10.1056/NEJMoa021322
3. Burgel PR, Paillasseur JL, Caillaud D, et al. Clinical COPD phenotypes: a novel approach using principal component and cluster analyses. Eur Respir J. 2010;36(3):531–539. doi:10.1183/09031936.00175109
4. Burgel PRG, Roche N, Paillasseur JL, et al. Clinical COPD phenotypes identified by cluster analysis: validation with mortality. Eur Respir J. 2012;40(2):495–496. doi:10.1183/09031936.00228511
5. Toraldo DM, de Nuccio F, Gaballo A, Nicolardi G. Use of cluster analysis to describe desaturator phenotypes in COPD: correlations between pulmonary function tests and nocturnal oxygen desaturation. Int J COPD. 2011;6(1):551–561. doi:10.2147/COPD.S25383
6. Rennard SI, Locantore N, Delafont B, et al. Identification of five chronic obstructive pulmonary disease subgroups with different prognoses in the ECLIPSE cohort using cluster analysis. Ann Am Thorac Soc. 2015;12(3):303–312. doi:10.1513/AnnalsATS.201403-125OC
7. Matsuoka S, Kurihara Y, Yagihashi K, Hoshino M, Nakajima Y. Airway dimensions at inspiratory and expiratory multisection CT in chronic obstructive pulmonary disease: correlation with airflow limitation. Radiology. 2008;248(3):1042–1049. doi:10.1148/radiol.2491071650
8. Nakano Y, Muro S, Sakai H, et al. Computed tomographic measurements of airway dimensions and emphysema in smokers correlation with lung function. Am J Respir Crit Care Med. 2000;162(3I):1102–1108. doi:10.1164/ajrccm.162.3.9907120
9. Grydeland TB, Thorsen E, Dirksen A, et al. Quantitative CT measures of emphysema and airway wall thickness are related to D(L)CO. Respir Med. 2011;105(3):343–351. doi:10.1016/j.rmed.2010.10.018
10. Han MK, Kazerooni EA, Lynch DA, et al. Chronic obstructive pulmonary disease exacerbations in the COPDGene study : associated radiologic phenotypes. Radiology. 2011;261(1):274–282. doi:10.1148/radiol.11110173/-/DC1
11. Mohamed Hoesein FAA, Schmidt M, Mets OM, et al. Discriminating dominant computed tomography phenotypes in smokers without or with mild COPD. Respir Med. 2014;108(1):136–143. doi:10.1016/j.rmed.2013.08.014
12. Nishimoto K, Karayama M, Inui N, et al. Relationship between fraction of exhaled nitric oxide and airway morphology assessed by three-dimensional CT analysis in asthma. Sci Rep. 2017;7(1):1–8. doi:10.1038/s41598-017-10504-w
13. Karayama M, Inui N, Mori K, et al. Respiratory impedance is correlated with morphological changes in the lungs on three-dimensional CT in patients with COPD. Sci Rep. 2017;7:41709. doi:10.1038/srep41709
14. Karayama M, Inui N, Mori K, et al. Respiratory impedance is correlated with airway narrowing in asthma using three-dimensional computed tomography. Clin Exp Allergy. 2018;48(3):278–287. doi:10.1111/cea.13083
15. Oostveen E, MacLeod D, Lorino H, et al. The forced oscillation technique in clinical practice: methodology, recommendations and future developments. Eur Respir J. 2003;22(6):1026–1041. doi:10.1183/09031936.03.00089403
16. Mori K, Shirai T, Mikamo M, et al. Colored 3-dimensional analyses of respiratory resistance and reactance in COPD and asthma. Copd. 2011;8(6):456–463. doi:10.3109/15412555.2011.626818
17. Hogg JC, Chu F, Utokaparch S, et al. The nature of small-airway obstruction in chronic obstructive pulmonary disease. N Engl J Med. 2004;350(26):2645–2653. doi:10.1056/NEJMoa1212772
18. McDonough JE, Yuan R, Suzuki M, et al. Small-airway obstruction and emphysema in chronic obstructive pulmonary disease. N Engl J Med. 2011;365(17):1567–1575. doi:10.1056/NEJMoa1306494
19. de Blic J, Tillie-Leblond I, Emond S, Mahut B, Duy TLD, Scheinmann P. High-resolution computed tomography scan and airway remodeling in children with severe asthma. J Allergy Clin Immunol. 2005;116(4):750–754. doi:10.1016/j.jaci.2005.07.009
20. Aysola RS, Hoffman EA, Gierada D, et al. Airway remodeling measured by multidetector CT is increased in severe asthma and correlates with pathology. Chest. 2008;134(6):1183–1191. doi:10.1378/chest.07-2779
21. Kasahara K, Shiba K, Ozawa T, Okuda K, Adachi M. Correlation between the bronchial subepithelial layer and whole airway wall thickness in patients with asthma. Thorax. 2002;57(3):242–246. doi:10.1136/thorax.57.3.242
22. Ohara T, Hirai T, Sato S, et al. Comparison of airway dimensions in different anatomic locations on chest CT in patients with COPD. Respirology. 2006;11(5):579–585. doi:10.1111/j.1440-1843.2006.00899.x
23. Berger P, Perot V, Desbarats P, Tunon-de-Lara JM, Marthan R, Laurent F. Airway wall thickness in cigarette smokers: quantitative thin-section CT assessment. Radiology. 2005;235(3):1055–1064. doi:10.1148/radiol.2353040121
24. Hasegawa M, Nasuhara Y, Onodera Y, et al. Airflow limitation and airway dimensions in chronic obstructive pulmonary disease. Am J Respir Crit Care Med. 2006;173(12):1309–1315. doi:10.1164/rccm.200601-037OC
25. Yamashiro T, Matsuoka S, Estépar RSJ, et al. Quantitative assessment of bronchial wall attenuation with thin-section CT: an indicator of airflow limitation in chronic obstructive pulmonary disease. AJR Am J Roentgenol. 2010;195(2):363–369. doi:10.2214/AJR.09.3653
26. Grydeland TB, Dirksen A, Coxson HO, et al. Quantitative computed tomography measures of emphysema and airway wall thickness are related to respiratory symptoms. Am J Respir Crit Care Med. 2010;181(4):353–359. doi:10.1164/rccm.200907-1008OC
27. Pauls S, Gulkin D, Feuerlein S, et al. Assessment of COPD severity by computed tomography: correlation with lung functional testing. Clin Imaging. 2010;34(3):172–178. doi:10.1016/j.clinimag.2009.05.004
28. Aziz ZA, Wells AU, Desai SR, et al. Functional impairment in emphysema: contribution of airway abnormalities and distribution of parenchymal disease. Am J Roentgenol. 2005;185(6):1509–1515. doi:10.2214/AJR.04.1578
29. Cerveri I, Dore R, Corsico A, et al. Assessment of emphysema in COPD: a functional and radiologic study. Chest. 2004;125(5):1714–1718. doi:10.1378/chest.125.5.1714
30. Hurst JR, Vestbo J, Anzueto A, et al. Susceptibility to exacerbation in chronic obstructive pulmonary disease. N Eng J Med. 2010;363(12):1128–1138. doi:10.1056/NEJMoa0909883
31. Jairam PM, van der Graaf Y, Lammers J-WJ, Mali WPTM, de Jong PA. Incidental findings on chest CT imaging are associated with increased COPD exacerbations and mortality. Thorax. 2015;70(8):725–731. doi:10.1136/thoraxjnl-2014-206160
32. Tatsumi K, Kasahara Y, Kurosu K, Tanabe N, Takiguchi Y, Kuriyama T. Clinical phenotypes of COPD: results of a Japanese epidemiological survey. Respirology. 2004;9(3):331–336. doi:10.1111/j.1440-1843.2004.00611.x
33. Mansur AH, Manney S, Ayres JG. Methacholine-induced asthma symptoms correlate with impulse oscillometry but not spirometry. Respir Med. 2008;102(1):42–49. doi:10.1016/j.rmed.2007.08.007
34. Takeda T, Oga T, Niimi A, et al. Relationship between small airway function and health status, dyspnea and disease control in asthma. Respiration. 2010;80(2):120–126. doi:10.1159/000242113
35. Komarow HD, Skinner J, Young M, et al. A study of the use of impulse oscillometry in the evaluation of children with asthma: analysis of lung parameters, order effect, and utility compared with spirometry. Pediatr Pulmonol. 2012;47(1):18–26. doi:10.1002/ppul.21507.A
36. Boueiz A, Chang Y, Cho MH, et al. Lobar emphysema distribution is associated with 5-year radiological disease progression. Chest. 2018;153(1):65–76. doi:10.1016/j.chest.2017.09.022
37. Oguma T, Hirai T, Fukui M, et al. Longitudinal shape irregularity of airway lumen assessed by CT in patients with bronchial asthma and COPD. Thorax. 2015;70(8):719–724. doi:10.1136/thoraxjnl-2014-206651
 © 2019 The Author(s). This work is published and licensed by Dove Medical Press Limited. The full terms of this license are available at https://www.dovepress.com/terms.php and incorporate the Creative Commons Attribution - Non Commercial (unported, v3.0) License.
By accessing the work you hereby accept the Terms. Non-commercial uses of the work are permitted without any further permission from Dove Medical Press Limited, provided the work is properly attributed. For permission for commercial use of this work, please see paragraphs 4.2 and 5 of our Terms.
© 2019 The Author(s). This work is published and licensed by Dove Medical Press Limited. The full terms of this license are available at https://www.dovepress.com/terms.php and incorporate the Creative Commons Attribution - Non Commercial (unported, v3.0) License.
By accessing the work you hereby accept the Terms. Non-commercial uses of the work are permitted without any further permission from Dove Medical Press Limited, provided the work is properly attributed. For permission for commercial use of this work, please see paragraphs 4.2 and 5 of our Terms.