")
Back to Journals » Clinical Ophthalmology » Volume 10
Clinical and imaging evaluation of the response to intravenous steroids in patients with Graves’ orbitopathy and analysis on who requires additional therapy
Authors Tsirouki T, Bargiota A, Tigas S , Vasileiou A, Kapsalaki E, Giotaki Z, Asproudis I, Tsatsoulis A, Koukoulis G, Tsironi EE
Received 31 July 2016
Accepted for publication 24 August 2016
Published 17 November 2016 Volume 2016:10 Pages 2277—2289
DOI https://doi.org/10.2147/OPTH.S118555
Checked for plagiarism Yes
Review by Single anonymous peer review
Peer reviewer comments 2
Editor who approved publication: Dr Scott Fraser
Theodora Tsirouki,1 Alexandra Bargiota,2 Stelios Tigas,3 Agathi Vasileiou,2 Eftichia Kapsalaki,4 Zoe Giotaki,3 Ioannis Asproudis,5 Agathokles Tsatsoulis,3 Georgios Koukoulis,2 Evangelia E Tsironi1
1Department of Ophthalmology, University Hospital of Larissa, Larissa, 2Department of Endocrinology, University Hospital of Larissa, Larissa, 3Department of Endocrinology, University Hospital of Ioannina, Ioannina, 4Department of Diagnostic Radiology, University Hospital of Larissa, Larissa, 5Department of Ophthalmology, University Hospital of Ioannina, Ioannina, Greece
Objective: The aim of this study was to evaluate the safety and efficacy of an individualized steroid regimen in patients with moderate-to-severe Graves’ orbitopathy (GO) by monitoring clinical and imaging parameters.
Methods: In total, 47 patients with active, moderate-to-severe GO were enrolled in this study. All the patients received the proposed treatment regimen by European Group on GO of 4.5 g of intravenous (IV) methylprednisolone for 12 weeks. At the end of the IV treatment, patients with persistent active GO (Group 1) who were assessed by clinical examination and orbital imaging with short tau inversion recovery-sequence magnetic resonance imaging (STIR MRI) received additional treatment with oral prednisolone, and those with inactive GO (Group 2) received no further treatment.
Results: Of the 42 patients who completed the study, 22 (52.4%) patients formed Group 1 and 20 (47.6%) patients Group 2. At the 12th week, the overall response to IV treatment was 76.2%, and clinical activity score (CAS) improvement was 69%. At the 24th week, the overall response was 92.8%, and CAS improvement was 97.6%, without statistically significant difference in CAS and total eye score between these two groups (P=0.157 and P=0.856, respectively). Ophthalmic manifestations were improved, being absent or minimal in 78.6% of patients at the 24th week follow-up. Recurrence of disease activity occurred in 9.5% of patients up to 24 weeks after the completion of treatment, and major adverse events occurred in 6.4% of patients.
Conclusion: In patients with moderate-to-severe GO, IV steroid treatment, followed by oral treatment, when needed, is an effective regimen with low rates of adverse events and recurrences. STIR MRI is a significant tool for recognizing patients who need additional steroid treatment.
Keywords: Graves’ orbitopathy, magnetic resonance imaging, MRI, glucocorticoids
Introduction
Graves’ orbitopathy (GO) is an autoimmune disorder of the orbit, which is closely related to Graves’ disease (GD).1 Ophthalmic manifestations are present in 25%–50% of patients with GD, and the majority of patients with GO have already presented or are anticipated to experience Graves’ hyperthyroidism.1,2 GO has an annual incidence rate of 16 women and 3 men per 100,000, principally affecting patients aged between 30 and 60 years old.1 Although it is a self-limiting disease, 5% of patients have sight-threatening disease manifestations.2
Clinical assessment and treatment of GO remain a riddle for physicians of varied specialties.3–5 Several clinical studies, over the last 60 years, have attempted to identify specific clinical and imaging parameters, sensitive enough to predict the progression of GO.5,6 However, a standardized clinical and imaging protocol for GO evaluation is lacking.
Various clinical scores were used for the assessment of the activity and severity of GO. The clinical activity score (CAS) was proposed in 1989 for the evaluation of GO activity.7,8 The modified NOSPECS (No clinical signs or symptoms, Only signs, Soft tissue involvement, Proptosis, Extraocular muscle involvement, Corneal involvement, Sight loss due to optic nerve compression) classification and total eye score (TES) have been proposed for the assessment of GO severity.4,9 Despite their undisputed usefulness, a limitation of these scores is that they are subjective and relatively nonspecific, as they are based on clinical examination.8 In clinical practice, when more objective measurements are required, they are provided by magnetic resonance imaging (MRI), which is considered the most useful imaging technique for the evaluation of GO.10 Specifically, short tau inversion recovery-sequence (STIR) MRI assesses the activity of GO, as it detects signs of inflammation and edema in the orbital tissues.11
In addition, treatment of GO also remains a challenging issue. Randomized trials and meta-analyses have established intravenous (IV) glucocorticoids (GCs) as the treatment of choice for active, moderate-to-severe GO.4,12–15 The most accepted dosage regimen that is currently in use, proposed by the European Group on GO (EUGOGO), is a 4.5 g cumulative dose of IV methylprednisolone (MP), administered in 12 weekly infusions.4 However, an optimal treatment regimen providing effectiveness with minimal side effects and recurrences has not yet been established.4,6,16,17
The aim of the present study was to evaluate the effectiveness and safety of an individualized treatment regimen consisting of a 12-week IV GC protocol, followed by oral GCs when needed, in patients with active, moderate-to-severe GO. Activity of GO was defined by the combination of clinical and imaging parameters.
Patients and methods
Patients
In total, 47 patients with untreated, active, moderate-to-severe GO were enrolled in the present study, according to the EUGOGO consensus statement.5 The patients were examined between March 2009 and March 2015 at the Department of Endocrinology and Department of Ophthalmology in either the University Hospital of Larissa or in the University Hospital of Ioannina (Greece). This study was approved by the Ethics Committee of the University Hospital of Larissa, Greece, and all the patients included in this study signed an informed consent form.
Exclusion criteria were orbital disorders not related to GO and any form of strabismus present (ie, paralytic, comitant, or restrictive, caused by conditions other than GO). Patients with contraindications to steroid treatment were also excluded from this study.
Study design
All the patients were subjected to complete ophthalmological examination and evaluated with CAS, NOSPECS, and TES before the initiation of IV GC treatment (baseline) and at 6, 12, and 24 weeks. They also had an orbital STIR MRI at baseline, 12 weeks, and 24 weeks. A Quality-of-Life (QoL) questionnaire was filled out by all the patients at baseline, 12 weeks, and 24 weeks.
All the patients received an IV cumulative dose of 4.5 g of MP within a period of 12 weeks as recommended by the EUGOGO,4 that is, a course of 0.5 g of MP once weekly for 6 weeks followed by 0.25 g once weekly for 6 additional weeks. At the end of the IV treatment, patients with persistent active disease on clinical examination (CAS) or orbital imaging (STIR MRI) received additional GC treatment with oral prednisolone 30 mg daily, with a tapering period of 12 weeks (Group 1). Patients with inactive GO at the end of IV treatment received no further treatment (Group 2). All the patients who completed the treatment regimen were subjected to complete ophthalmological evaluation every 6 weeks, until 24 weeks after the end of treatment.
Patients with active GD received anti-thyroid medications in order to reach and maintain euthyroidism. Before initiation of IV treatment, patients with active hepatitis and tuberculosis had to be excluded from this study. All patients underwent blood tests for serum-free thyroxine (T4), free triiodothyronine (T3), thyroid-stimulating hormone (TSH), and anti-thyroid antibodies (ie, TRAb, anti- thyroglobulin, and anti-thyroperoxidase) at baseline and at regular intervals, according to their thyroid function status. Liver enzymes, blood glucose, and renal parameters were evaluated every 4 weeks during treatment. Smokers were assisted to quit smoking.
Ophthalmological examination
All the patients included in the study had a complete ophthalmological examination by the same ophthalmologist in each hospital. Soft tissue involvement, proptosis, corneal involvement, and eye muscle involvement were recorded. Severity of signs was graded with 0 (absent), 1 (minimal), 2 (moderate), or 3 (marked). The Color Atlas was used as a helpful tool for the identification of the grading.18 Visual acuity, diplopia, and optic discs were assessed. Activity of GO was estimated by using the CAS,7,8 and severity of GO was evaluated by using the NOSPECS classification and its arithmetic expression, TES.3,5,9
Response to treatment during follow-up was defined as follows: change in CAS by at least two points was considered significant, and change of any of the NOSPECS signs by at least two grades was considered significant. For the assessment of the overall response to GC treatment, the definition of Bartalena et al was used, according to which improvement in at least two major criteria and one minor criterion is considered important. Major criteria include proptosis, diplopia, CAS, and visual acuity, and minor criteria are the soft tissue changes and self-assessment evaluation.19
MRI
MRI of the orbits included sagittal T1, axial and coronal T1 (repetition time [TR]: 813 ms, echo time [TE]: 12 ms, field of view [FOV]: 16×16, matrix: 320×256) and T2 (TR: 3,700 ms, TE: 100 ms, FOV: 16×16, matrix: 320×256) images. The MRI was performed on a 3T MRI scanner (HDxt GE scanner; GE Medical Systems, Waukesha, WI, USA). Axial images were obtained parallel to the optic nerve, and coronal images were obtained perpendicular to them. All images were obtained with slice thickness of 3 mm and 0.3 mm gap. Coronal STIR images (TR: 6,200 ms, TE: 46 ms, FOV: 16×16, matrix: 320×256) were also provided, in order to detect the presence of intramuscular edema.
QoL
QoL was evaluated using a disease-specific GO-QoL questionnaire proposed by EUGOGO, translated and validated in Greek. It included 16 questions that evaluate the performance of everyday activities in patients with GO: 8 questions referred to limitations in practicing usual activities, and the remaining 8 questions referred to the psychosocial limitations attributable to changes in appearance. Subsequently, for simplicity, questions were separated into two categories: those of visual function and those of psychosocial life. Patients completed the questionnaires based on their personal opinion over the course of the disease. Specifically, they graded convenience and desire in performing the reported activities, with higher scores expressing better QoL.
Statistical analysis
Statistical analysis was conducted by using Statistical Package for Social Sciences Version 17 (SPSS Inc., Chicago, IL, USA). Baseline characteristics of the two groups were expressed as mean ± standard deviation or as counts and percentages, as appropriate. Comparisons between categorical data were done by using Fisher’s exact test for independent samples and by using McNemar’s test for dependent samples. Differences between continuous independent variables were tested using Mann–Whitney U-test. Comparison of measurements among dependent variables, over ≥3 time points, was done by one-way repeated measures analysis of variance with Bonferroni correction applied. The level of statistical significance was set at P<0.05.
Results
Patients
In total, 47 patients with active, moderate-to-severe GO were enrolled in this study. They constituted of 18% of the total number of patients with GO (261), examined from March 2009 until March 2015 in the two centers. Table 1 depicts demographic characteristics of all the patients, and age of these patients ranged from 32 to 81 years, with a mean age of 58.40±13.2 years. Of the 47 patients, 45 (95.8%) patients had a history of GD or were currently being treated for GD, 1 (2.1%) had no history or current thyroid dysfunction, and 1 (2.1%) had autoimmune hypothyroidism.
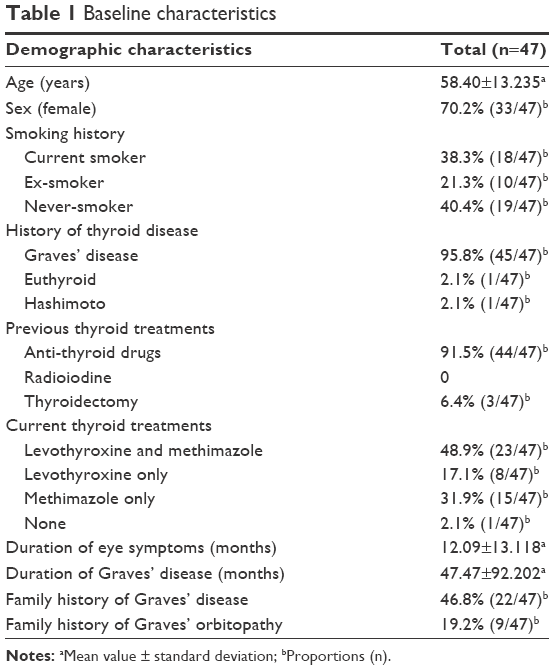 | Table 1 Baseline characteristics |
Of the 47 patients, 5 (10.6%) patients discontinued the IV GC treatment: 2 of them required urgent orbital decompression due to sight-threatening signs, and 3 patients presented major adverse events. The remaining 42 patients (89.4%) completed the IV GC treatment protocol. At the 12th week, of the 42 patients, 22 patients (52.4%; Group 1) had active GO as defined by clinical or imaging evaluation, and therefore, they received further oral treatment. The remaining 20 patients (47.6%; Group 2) had inactive disease and received no further treatment.
Clinical results
Overall response to GC treatment was observed in 32 (76.2%) of 42 patients at the 12th week and in 39 (92.8%) of 42 patients at the 24th week.
CAS
A significant improvement in CAS was observed during the treatment period. The mean CAS decreased from 6.05±1.2 at baseline to 2.67±1.8 at the 12th week and 1.21±1.4 at the 24th week (P<0.001; Table S1; Figure 1A). At the 12th week, improvement in CAS was observed in 29 (69%) of 42 patients (P=0.001) and at the 24th week in 41 (97.6%) of 42 patients (P<0.001; Table S2).
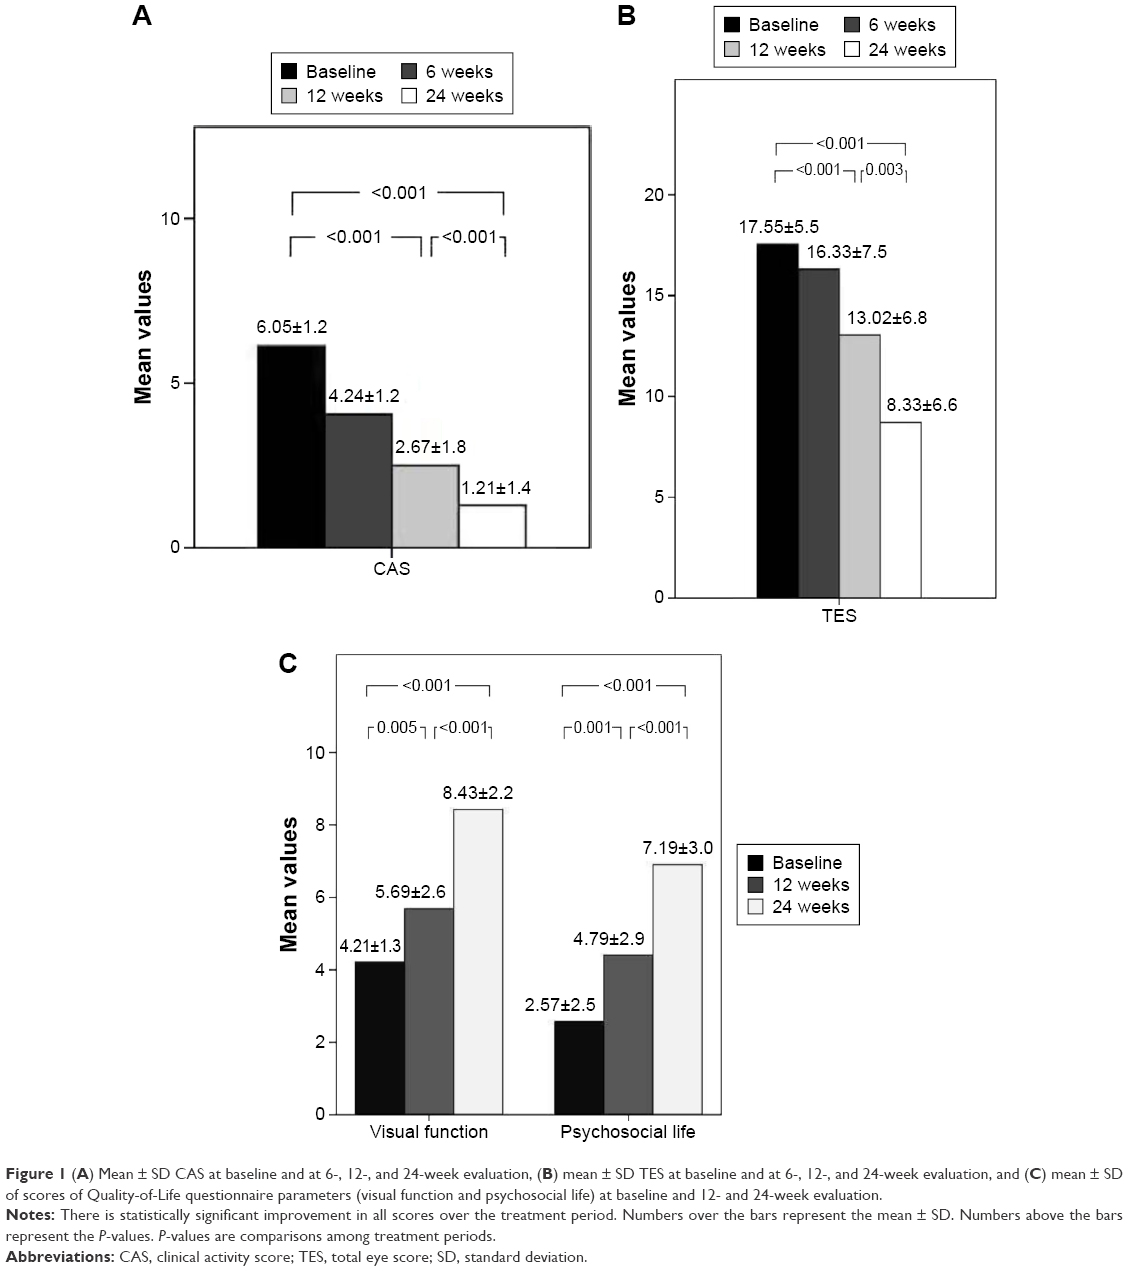 | Figure 1 (A) Mean ± SD CAS at baseline and at 6-, 12-, and 24-week evaluation, (B) mean ± SD TES at baseline and at 6-, 12-, and 24-week evaluation, and (C) mean ± SD of scores of Quality-of-Life questionnaire parameters (visual function and psychosocial life) at baseline and 12- and 24-week evaluation. |
TES
TES was significantly improved with treatment (P<0.001; Table S1; Figure 1B). Specifically, improvement in TES was observed in 28 (66.7%) of 42 patients at the 12th week (P=0.004) and in 38 (90.5%) of 42 patients at the 24th week (P=0.002). A deterioration of TES at the 12th week was evident in 7 (16.7%) of 42 patients, 6 (14.3%) of whom presented improvement after receiving the oral steroid regimen, at the 24th week (Table S2).
QoL
Tables S1 and S2, and Figure 1C present QoL results. At baseline, QoL parameters were low, expressing a significant influence of QoL in both visual function and psychosocial life. Mean ± SD QoL visual function improved from 4.21±1.3 at baseline to 5.69±2.6 at the 12th week (P=0.005) and to 8.43±2.2 at the 24th week (P<0.001). Mean ± SD QoL psychosocial life improved from 2.57±2.5 at baseline to 4.79±2.9 at the 12th week (P=0.001) and 7.19±3.0 (P<0.001), all demonstrating significant improvement at both the 12th and 24th weeks (Table S1). At the 12th week, 28 (66.7%) of 42 patients had improvement in the QoL – visual function and 23 (54.8%) of 42 patients had improvement in the QoL – psychosocial life. At the 24th week, the number of patients presenting improvement reached 38 of 42 patients in the QoL-visual function and 36 of 42 patients in the QoL-psychosocial life component (90.5% and 85.7% respectively; Table S2).
Ophthalmic evaluation
At baseline visit, soft tissue signs were present in 42 (100%)of 42 patients, exophthalmos in 35 patients (83.3%), ocular motility dysfunction in 36 patients (85.7%), and corneal involvement in 22 (52.4%) of patients. At the end of the 24th week, the aforementioned features were either minimal or absent in the majority of treated patients (90.5%, 83.3%, 78.6%, and 100% of patients respectively; Table S3). The improvement in clinical signs over time was significant at the 24th week, as depicted in Figure 2.
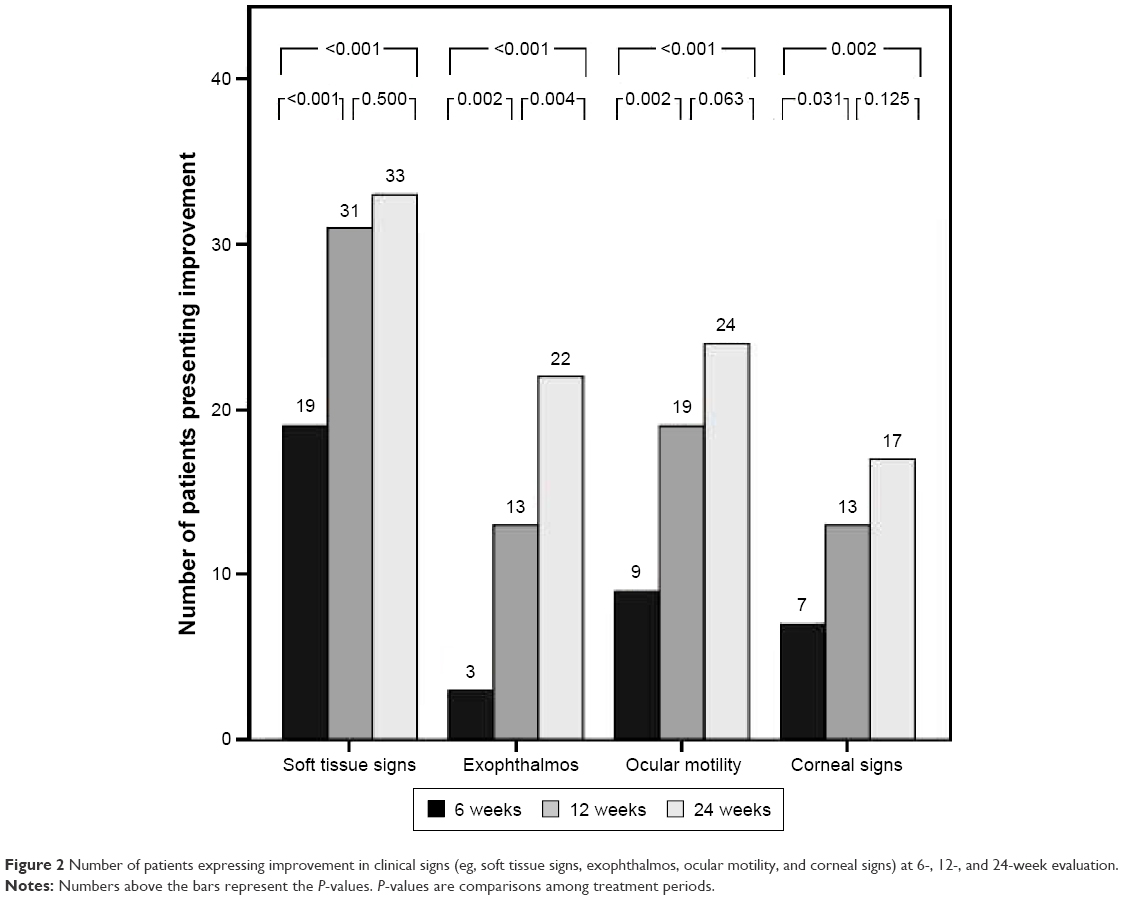 | Figure 2 Number of patients expressing improvement in clinical signs (eg, soft tissue signs, exophthalmos, ocular motility, and corneal signs) at 6-, 12-, and 24-week evaluation. |
Administration of additional oral steroids and comparison between the two groups
Oral steroids were administered at patients who continued to present active GO at the end of IV treatment (at the 12th week). At that point, as it is expected, CAS was significantly higher in Group 1 (P=0.002). At the 24th week, CAS did not present statistically significant difference between the two groups (P=0.157; Table S4; Figure 3A). For both the groups, statistically significant reduction in CAS was observed at the 12th and 24th weeks (P<0.001).
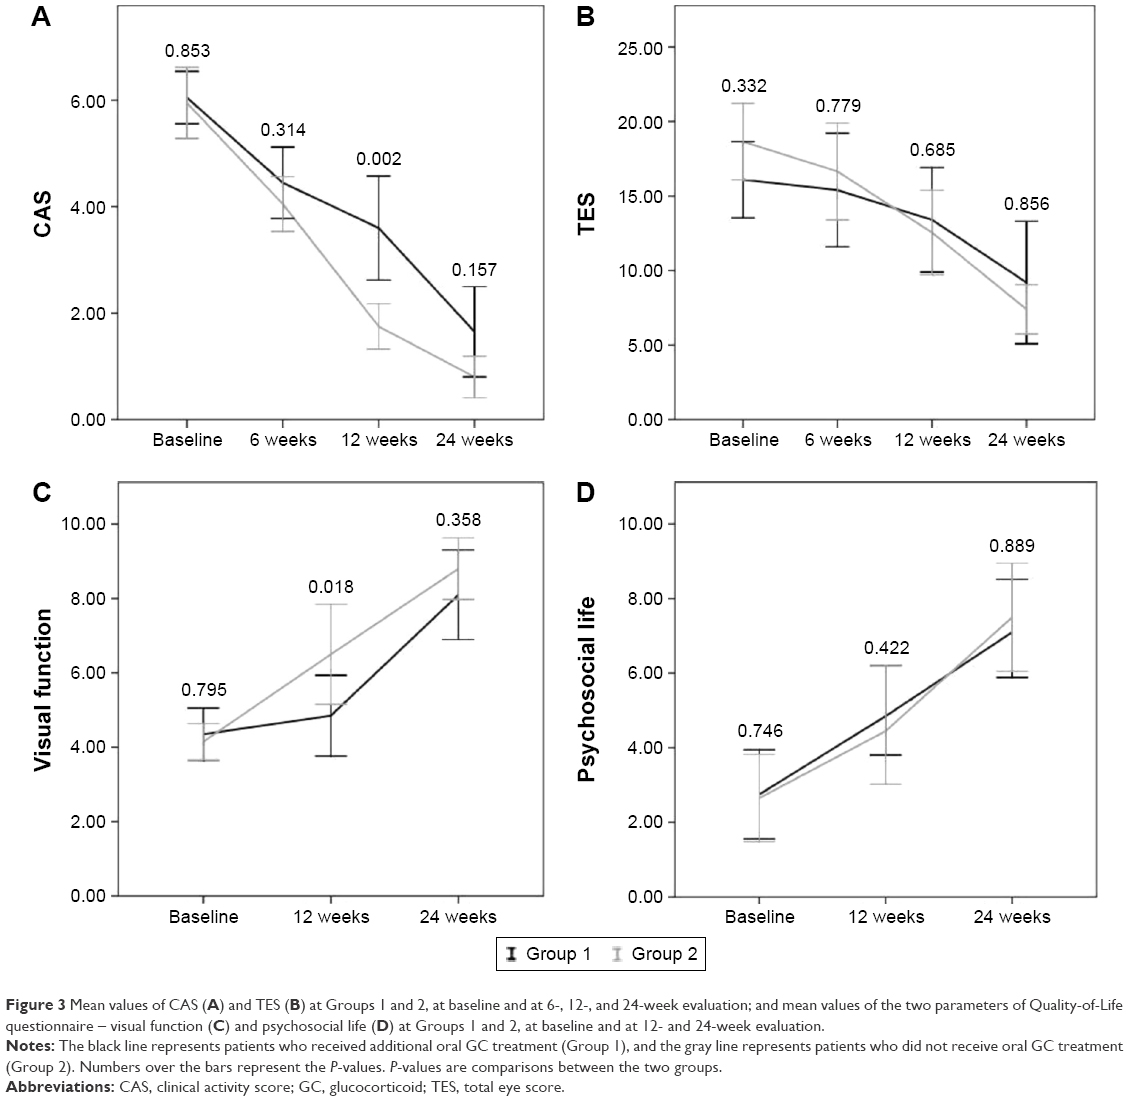 | Figure 3 Mean values of CAS (A) and TES (B) at Groups 1 and 2, at baseline and at 6-, 12-, and 24-week evaluation; and mean values of the two parameters of Quality-of-Life questionnaire – visual function (C) and psychosocial life (D) at Groups 1 and 2, at baseline and at 12- and 24-week evaluation. |
Mean TES did not present statistically significant difference between the two groups neither at the 12th week nor at the 24th week (P=0.685 and P=0.856, respectively; Table S4; Figure 3B). For Group 1, statistically significant improvement in TES was not observed at the 12th week (P=0.185), but it was observed at the 24th week (P=0.001). For Group 2, statistically significant decrease in TES was observed at the 12th and 24th weeks (P<0.001 and P=0.001, respectively).
Table S4 and Figure 3C and D show the comparison of the components of QoL between the two groups. For Group 1, statistically significant increase in visual function – QoL was not observed at the 12th week (P=0.429), but it was observed at the 24th week (P<0.001). For Group 2, statistically significant improvement in visual function-QoL was observed at the 12th and 24th weeks (P=0.003 and P<0.001, respectively). As far as psychosocial life-QoL is concerned, both the groups had a significant improvement at the 24th week (Group 1: P<0.001; Group 2: P<0.001).
Demographic characteristics, smoking habits, disease duration, and family history did not present statistically significant difference between Groups 1 and 2 (Table 2).
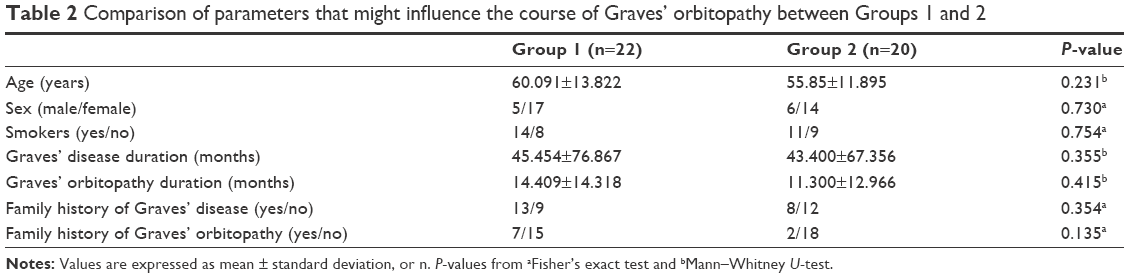 | Table 2 Comparison of parameters that might influence the course of Graves’ orbitopathy between Groups 1 and 2 |
MRI
At the end of the IV treatment (12 weeks), STIR MRI demonstrated that 22 of the 42 patients presented persisting active inflammation. At that point, CAS revealed activity in 16 of 42 patients, all of which presented activity with the MRI. Patients with active GO at 12 weeks, ascertained by MRI or clinical examination, formed Group 1 (22 patients). At 24 weeks, STIR MRI and CAS demonstrated active GO in 1 of the 42 patients who completed the study.
Surgery
Urgent orbital decompression surgery was performed in 2 (4.2%) of 47 patients, due to accelerating dysthyroid optic neuropathy (DON), early at the treatment period (before the 6th week of treatment). A type of rehabilitative surgery was performed in 3 (7.1%) of the 42 patients who received treatment after they had completed the full treatment scheme (Table 3).
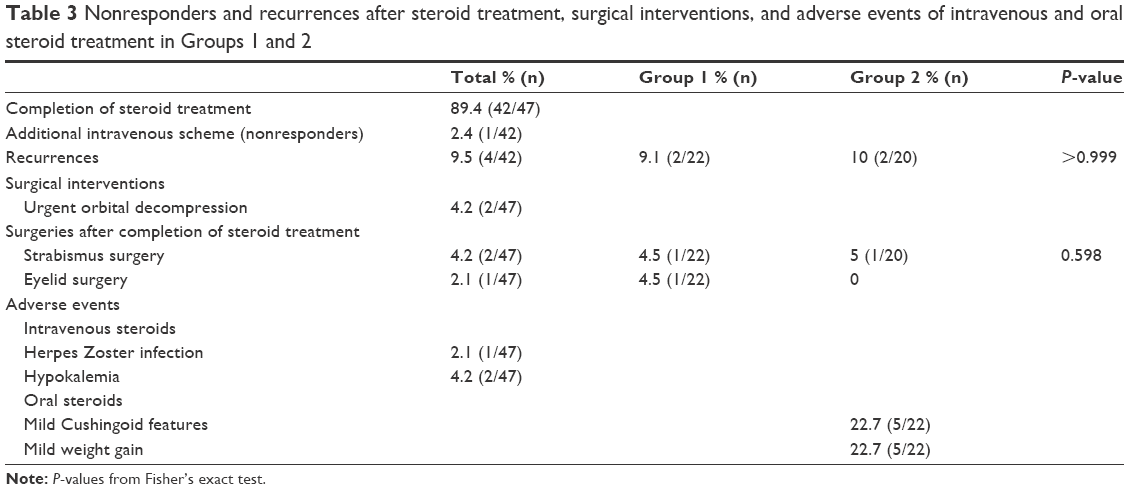 | Table 3 Nonresponders and recurrences after steroid treatment, surgical interventions, and adverse events of intravenous and oral steroid treatment in Groups 1 and 2 |
Recurrence
In total, 4 of the 42 patients had recurrence of GO up to 24 weeks after the completion of treatment (Table 3). The recurrence rate did not present a significant difference between the two groups (P>0.999).
Nonresponders
As mentioned previously, 2 (4.2%) of the initial 47 patients presented accelerating DON, although they were under treatment with IV GCs (Table 3). These patients were withdrawn from the treatment protocol before completing 6 weeks of treatment. In addition, at the 24th week, 1 patient (2.4%) presented aggravated GO and was subjected to additional IV GC treatment, after which the patient improved.
Adverse events
IV GC treatment had to be discontinued in 3 of 47 patients due to adverse events: 1 patient had Herpes Zoster infection, and 2 developed severe electrolyte disturbances. Mild adverse events occurred during oral GC treatment (Table 3).
Discussion
GCs have been the most common therapeutic option for active, moderate-to-severe GO with the IV administration being more effective and safe compared to the oral.12,13,20–24 The broadly accepted dosage regimen, recommended by EUGOGO, consists of a 4.5 g cumulative dose of IV MP. However, certain patients do not respond to treatment at all, some patients have persistent active disease, or some may relapse after the completion of therapy, although they had an initial positive responce.4,6,13 The current study suggested that the introduction of an additional oral GC regimen in specific patients enhances the therapeutic result. This personalized regimen seems to be effective and relatively safe and improves QoL. In addition, in this study, STIR MRI was an essential tool for the evaluation of GO activity, apart from clinical assessment.
At the end of the IV GC treatment, the overall response observed in the present study is consistent with previous reports that have used the same 12-week IV MP treatment scheme. The latter show an overall response rate of 35%–80% and CAS improvement of 64.1%–83%.6,13,14,25,26 Nevertheless, with the addition of oral GC treatment in the present study, for patients with persistent active disease, the overall response rate and the CAS improvement increased remarkably, reaching 92.8% and 97.6% of patients, respectively.
Clinical evaluation of GO activity by using the CAS is a useful method, but it lacks accuracy and objectivity. Mourits et al defined specificity and sensitivity of clinical evaluation of activity of GO, with the use of CAS. They estimated specificity of 86% and sensitivity of 55%, showing that CAS alone could not detect active GO adequately.8,27,28 Therefore, an imaging technique could supplement the clinical data allowing a more accurate assessment of disease activity.10,27,29–32 STIR MRI is the method of choice for orbital imaging in GO. It is reliable in detecting active inflammation of orbital tissues in GO.11,33–39 STIR MRI is essential for supporting clinical diagnosis of GO, identifying disease phase and severity, assessing indication for treatment, and following response to treatment.38 Recently, numerous studies have demonstrated that STIR MRI establishes activity of GO with more sensibility and reproducibility than CAS alone.11,38,39 Specifically, they found that patients with low CAS could have remarkable inflammation of the extraocular muscles in the STIR MRI, a phenomenon similar to that demonstrated in the present study. Thus, combining clinical CAS with orbital STIR MRI could improve accuracy in detecting GO activity and is of great clinical importance.11,38,39
Relapse rate observed in the present study was 9.5%, which is lower compared to 21% and 43% of recurrences observed in previous studies.6,26 Bartalena et al conclude that recurrence of GO after the initial improvement, even for patients who received large doses of GCs (7.5 g of MP in 12 weeks), is probably caused by the abrupt steroid withdrawal, and proposes oral GC tapering, although the evidence for this until now was lacking.6 In the present study, oral GC tapering treatment was continued in patients with persistent active disease after the IV steroid treatment, and it was believed that this resulted in the lower observed relapse rate.
A lower rate of side effects was observed in the present study, compared to other studies that analyze steroid treatment for GO.6,13,21 The relatively low dose of oral GCs that has been used in a reducing manner resulted in only minor side effects, such as mild weight gain and subtle Cushingoid features. Severe adverse events, which led to interruption of IV GC treatment, were present at 6.4% of the patients, a smaller percentage compared to that of previous studies15–17 and similar to that observed in the study by Bartalena et al.6
The lack of response to GC therapy is an important issue in the management of patients with GO. Previous studies reported a varying nonresponse rate between 8% and 65% at the end of the specific 12-week IV GC regimen, possibly due to the variety of criteria used by each study for the evaluation of response to treatment.6,13,21,25,26 In the studies by Bartalena et al6 and Zhu et al,25 the clinical parameters of NOSPECS and CAS were used for the evaluation of response to treatment, similarly to the present study. However, in addition to the clinical parameters, the MRI findings were used to evaluate response to treatment, for a more objective evaluation. Bartalena et al reported 6% of patients developing DON during the first 12 weeks, and an additional 6% of patients developing DON between the 12th and 24th weeks. Zhu et al reported that 7.7% of patients received a second run of therapy within 6 months of the IV treatment.6,25 Nonresponse rate in the present study was lower (4.2%), and these patients developed accelerating DON during the first 6 weeks of IV steroids and required urgent orbital decompression. Aggravation of GO after 24 weeks of treatment was diagnosed in an additional 2.4% of the patients, but no DON was present, and they all improved after an additional IV GC scheme.
QoL is a useful tool for assessing response to therapy. In the present cohort, at the end of the IV treatment, patients in the group of persistent active disease presented low QoL scores, supporting the necessity for further treatment. After the 24th week of treatment, QoL scores were similar in both the groups. The aggregate of the patients in the present study presented a marked improvement in both aspects of QoL questionnaires at the end of treatment (visual component, 90.5%; and psychosocial component, 85.7%). Both the percentages were higher compared to previous studies (48%–81%), which could be explained by the fact that in the present study, the overall response rate is higher, with fewer relapses and side effects.6,13,21
Previous studies have indicated that the demographic factors, smoking, age, and sex might have a significant role in the response to steroid treatment in patients with GO.4,6,38,40 In the present study no such factors were found to affect the response to treatment and the clinical course of the disease in the two groups. Bartalena et al also found no effect of baseline characteristics such as age, sex, smoking history, and duration of GO.6 Kahaly et al,13 on the other hand, reported that patients with GO aged <50 years and female patients respond better to IV and oral steroids, also that heavy smokers presented deterioration in their treatment. However, they did not compare the influence of the above factors between the different study groups.13
A limitation of the present study was the relatively small number of patients enrolled, but the strict inclusion criteria and the low incidence of the disease made it extremely difficult to include more patients over a reasonable time period. Another limitation is that patients who had additional treatment with oral GCs have not been chosen randomly. This would have posed an ethical dilemma as patients with active disease could not be left without any treatment. Finally, the continuous improvement in GO signs (eg, CAS, TES, and QoL score) in Group 2, after the termination of IV GC treatment, could also be considered a limitation of the present study. It is well accepted that IV steroids in patients with GO continue to produce positive results for a time period after the treatment is complete.41 This fact is associated with the known tendency of GO to improve spontaneously.42 However, there is no way to predict in which patients the positive response will continue and which patients will relapse.41 Hence, the indicator for additional oral GC treatment used in the present study was persisting activity of GO at the end of IV GC treatment, recognized with the use of clinical and imaging parameters. The favorable results of the present study, combining high efficacy and low relapse rates, suggest that the decision in the treatment regimen was rather positive. However, additional studies are mandatory for a definitive conclusion, preferably, using a personalized therapeutic approach.
Our findings suggest that a combination of IV GC administration, followed by oral steroid treatment in selected patients, offers satisfactory effectiveness with relatively low rates of adverse events and recurrences. Close clinical monitoring and STIR MRI help to reveal those patients who need additional oral GC treatment. Such a demanding treatment and follow-ups, given also the scarcity of the disease, should be administered in specialized centers with appropriate expertise and input of multidisciplinary teams.
Acknowledgments
There are no grants or fellowship supports. All the authors fulfilled the authorship criteria and have approved the final version of this manuscript.
Disclosure
The authors report no conflicts of interest in this work.
References
Bartley GB. The epidemiologic characteristics and clinical course of ophthalmopathy associated with autoimmune thyroid disease in Olmsted County, Minesota. Trans Am Ophthalmol Soc. 1994;92:477–588. | ||
Perros P, Crombie AL, Kendall-Taylor P. Natural history of thyroid associated ophthalmopathy. Clin Endocrinol (Oxf). 1995;42(1):45–50. | ||
Prummel MF, Bakker A, Wiersinga WM, et al. Multi-center study on the characteristics and treatment strategies of patients with Graves’ orbitopathy: the first European Group on Graves’ Orbitopathy experience. Eur J Endocrinol. 2003;148(5):491–495. | ||
Bartalena L, Baldeschi L, Boboridis K, et al. The 2016 European Thyroid Association/European Group on Graves’ Orbitopathy Guidelines for the Management of Graves’ Orbitopathy. Eur Thyroid J. 2016;5(1):9–26. | ||
Bartalena L, Baldeschi L, Dickinson A, et al. Consensus statement of the European Group on Graves’ orbitopathy (EUGOGO) on management of GO. Eur J Endocrinol. 2008;158(3):273–285. | ||
Bartalena L, Krassas GE, Wiersinga W, et al. European Group on Graves’ orbitopathy. Efficacy and safety of three different cumulative doses of intravenous methylprednisolone for moderate to severe and active Graves’ orbitopathy. J Clin Endocrinol Metab. 2012;97(12):4454–4463. | ||
Mourits MP, Koornneef L, Wiersinga WM, Prummel MF, Berghout A, van der Gaag R. Clinical criteria for the assessment of disease activity in Graves’ ophthalmopathy: a novel approach. Br J Ophthalmol. 1989;73(8):639–644. | ||
Mourits MP, Prummel MF, Wiersinga WM, Koornneef L. Clinical activity score as a guide in the management of patients with Graves’ ophthalmopathy. Clin Endocrinol (Oxf). 1997;47(1):9–14. | ||
Werner SC. Modification of the classification of the eye changes of Graves’ disease. Am J Ophthalmol. 1977;83(5):725–727. | ||
El-Kaissi S, Wall JR. Determinants of extraocular muscle volume in patients with Graves’ disease. J Thyroid Res. 2012;2012:368536. | ||
Higashiyama T, Nishida Y, Morino K, et al. Use of MRI signal intensity of extraocular muscles to evaluate methylprednisolone pulse therapy in thyroid-associated ophthalmopathy. Jpn J Ophthalmol. 2015;59(2): 124–130. | ||
Marcocci C, Bartalena L, Tanda ML, et al. Comparison of the effectiveness and tolerability of intravenous or oral glucocorticoids associated with orbital radiotherapy in the management of severe Graves’ ophthalmopathy: results of a prospective, single-blind, randomized study. J Clin Endocrinol Metab. 2001;86(8):3562–3567. | ||
Kahaly GJ, Pitz S, Hommel G, Dittmar M. Randomized, single blind trial of intravenous versus oral steroid monotherapy in Graves’ orbitopathy. J Clin Endocrinol Metab. 2005;90(9):5234–5240. Epub 2005 Jul 5. | ||
Zang S, Ponto KA, Kahaly GJ. Clinical review: intravenous glucocorticoids for Graves’ orbitopathy: efficacy and morbidity. J Clin Endocrinol Metab. 2011;96(2):320–332. | ||
Stan MN, Garrity JA, Bahn RS. The evaluation and treatment of Graves’ ophthalmopathy. Med Clin North Am. 2012;96(2):311–328. | ||
Bahn R. High-dose intravenous glucocorticoid therapy for Graves’ ophthalmopathy: where are we now? Thyroid. 2012;22(1):1–2. | ||
Wiersinga WM. Graves’ orbitopathy: management of difficult cases. Indian J Endocrinol Metab. 2012;16(Suppl 2):S150–S152. | ||
Dickinson AJ, Perros P. Controversies in the clinical evaluation of active thyroid-associated orbitopathy: use of a detailed protocol with comparative photographs for objective assessment. Clin Endocrinol (Oxf). 2001;55(3):283–303. | ||
Bartalena L, Marcocci C, Bogazzi F, et al. Relation between therapy for hyperthyroidism and the course of Graves’ ophthalmopathy. N Engl J Med. 1998;338(2):73–78. | ||
Prummel MF, Mourits MP, Berghout A, et al. Prednisone and cyclosporine in the treatment of severe Graves’ ophthalmopathy. N Engl J Med. 1989;321(20):1353–1359. | ||
Aktaran S, Akarsu E, Erbağci I, Araz M, Okumuş S, Kartal M. Comparison of intravenous methylprednisolone therapy vs. oral methylprednisolone therapy in patients with Graves’ ophthalmopathy. Int J Clin Pract. 2007;61(1):45–51. | ||
van Geest RJ, Sasim IV, Koppeschaar HP, et al. Methylprednisolone pulse therapy for patients with moderately severe Graves’ orbitopathy: a prospective, randomized, placebo-controlled study. Eur J Endocrinol. 2008;158(2):229–237. | ||
Marcocci C, Watt T, Altea MA, et al; European Group of Graves’ Orbitopathy. Fatal and non-fatal adverse events of glucocorticoid therapy for Graves’ orbitopathy: a questionnaire survey among members of the European Thyroid Association. Eur J Endocrinol. 2012;166(2):247–253. | ||
Kahaly GJ, Petrak F, Hardt J, Pitz S, Egle UT. Psychosocial morbidity of Graves’ orbitopathy. Clin Endocrinol (Oxf). 2005;63(4):395–402. | ||
Zhu W, Ye L, Shen L, et al. A prospective, randomized trial of intravenous glucocorticoids therapy with different protocols for patients with Graves’ ophthalmopathy. J Clin Endocrinol Metab. 2014;99(6):1999–2007. | ||
Sánchez-Ortiga R, Moreno-Pérez O, González Sánchez V, et al. Treatment of Graves’ ophthalmopathy with high-dose intravenous methylprednisolone: a comparison of two dosing regimens. Endocrinol Nutr. 2009;56(3):118–122. | ||
Tachibana S, Murakami T, Noguchi H, et al. Orbital magnetic resonance imaging combined with clinical activity score can improve the sensitivity of detection of disease activity and prediction of response to immunosuppressive therapy for Graves’ ophthalmopathy. Endocr J. 2010;57(10):853–861. | ||
Stiebel-Kalish H, Robenshtok E, Hasanreisoglu M, Ezrachi D, Shimon I, Leibovici L. Treatment modalities for Graves’ ophthalmopathy: systematic review and meta-analysis. J Clin Endocrinol Metab. 2009;94(8):2708–2716. | ||
Kirsch EC, Kaim AH, De Oliveira MG, von Arx G. Correlation of signal intensity ratio on orbital MRI-TIRM and clinical activity score as a possible predictor of therapy response in Graves’ orbitopathy – a pilot study at 1.5 T. Neuroradiology. 2010;52(2):91–97. | ||
Jiang H, Wang Z, Xian J, Li J, Chen Q, Ai L. Evaluation of rectus extraocular muscles using dynamic contrast-enhanced MR imaging in patients with Graves’ ophthalmopathy for assessment of disease activity. Acta Radiol. 2012;53(1):87–94. | ||
Hiromatsu Y, Kojima K, Ishisaka N, et al. Role of magnetic resonance imaging in thyroid-associated ophthalmopathy: its predictive value for therapeutic outcome of immunosuppressive therapy. Thyroid. 1992;2(4):299–305. | ||
Ohnishi T, Noguchi S, Murakami N, et al. Extraocular muscles in Graves ophthalmopathy: usefulness of T2 relaxation time measurements. Radiology. 1994;190(3):857–862. | ||
Hoh HB, Laitt RD, Wakeley C, et al. The STIR sequence MRI in the assessment of extraocular muscles in thyroid eye disease. Eye (Lond). 1994;8(Pt 5):506–510. | ||
Kahaly GJ. Imaging in thyroid-associated orbitopathy. Eur J Endocrinol. 2001;145(2):107–118. | ||
Mayer E, Herdman G, Burnett C, Kabala J, Goddard P, Potts MJ. Serial STIR magnetic resonance imaging correlates with clinical score of activity in thyroid disease. Eye (Lond). 2001;15(Pt 3):313–318. | ||
Mayer EJ, Fox DL, Herdman G, et al. Signal intensity, clinical activity and cross-sectional areas on MRI scans in thyroid eye disease. Eur J Radiol. 2005;56(1):20–24. | ||
Rodríguez-González N, Pérez-Rico C, López-Para Giménez R, et al. Short-tau inversion-recovery (STIR) sequence magnetic resonance imaging evaluation of orbital structures in Graves’ orbitopathy. Arch Soc Esp Oftalmol. 2011;86(11):351–357. | ||
Tortora F, Cirillo M, Ferrara M, et al. Disease activity in Graves’ ophthalmopathy: diagnosis with orbital MR imaging and correlation with clinical score. Neuroradiol J. 2013;26(5):555–564. Epub 2013 Nov 7. | ||
Tortora F, Prudente M, Cirillo M, et al. Diagnostic accuracy of short-time inversion recovery sequence in Graves’ Ophthalmopathy before and after prednisone treatment. Neuroradiology. 2014;56(5):353–361. | ||
Bartalena L. Prevention of Graves’ ophthalmopathy. Best Pract Res Clin Endocrinol Metab. 2012;26(3):371–379. | ||
Leo M, Mautone T, Ionni I, et al. Variables affecting the long term outcome of Graves’ orbitopathy following high dose intravenous glucocorticoid pulse therapy in patients not treated with orbital radiotherapy. Endocr Pract. Epub 2016 Jun 30. | ||
Bartley GB. Rundle and his curve. Arch Ophthalmol. 2011;129:356–358. |
Supplementary materials
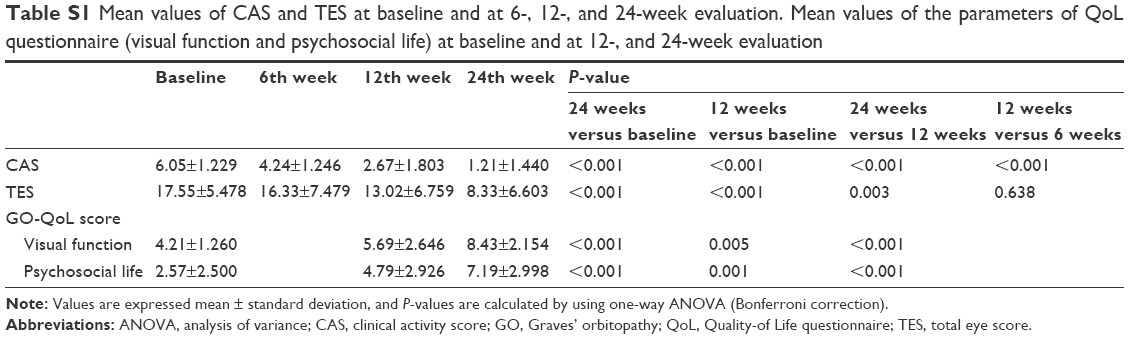 | Table S1 Mean values of CAS and TES at baseline and at 6-, 12-, and 24-week evaluation. Mean values of the parameters of QoL questionnaire (visual function and psychosocial life) at baseline and at 12-, and 24-week evaluation |
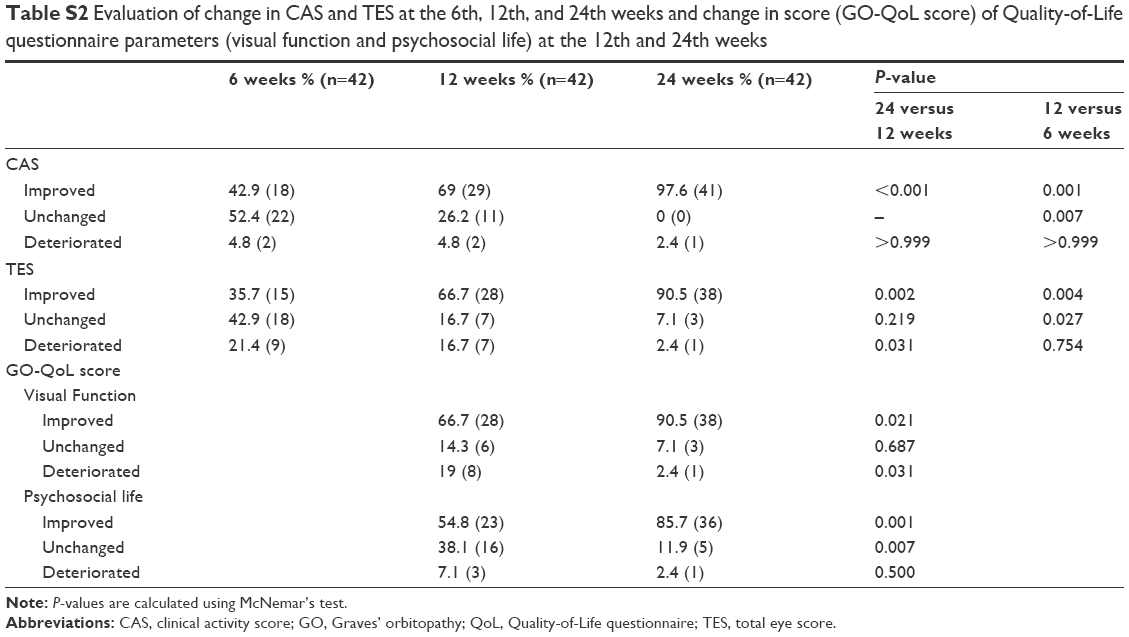 | Table S2 Evaluation of change in CAS and TES at the 6th, 12th, and 24th weeks and change in score (GO-QoL score) of Quality-of-Life questionnaire parameters (visual function and psychosocial life) at the 12th and 24th weeks |
 | Table S3 Features of ophthalmic evaluation (soft tissue signs, exophthalmos, ocular motility, and corneal signs) at baseline and at 6-, 12- and 24-week evaluation |
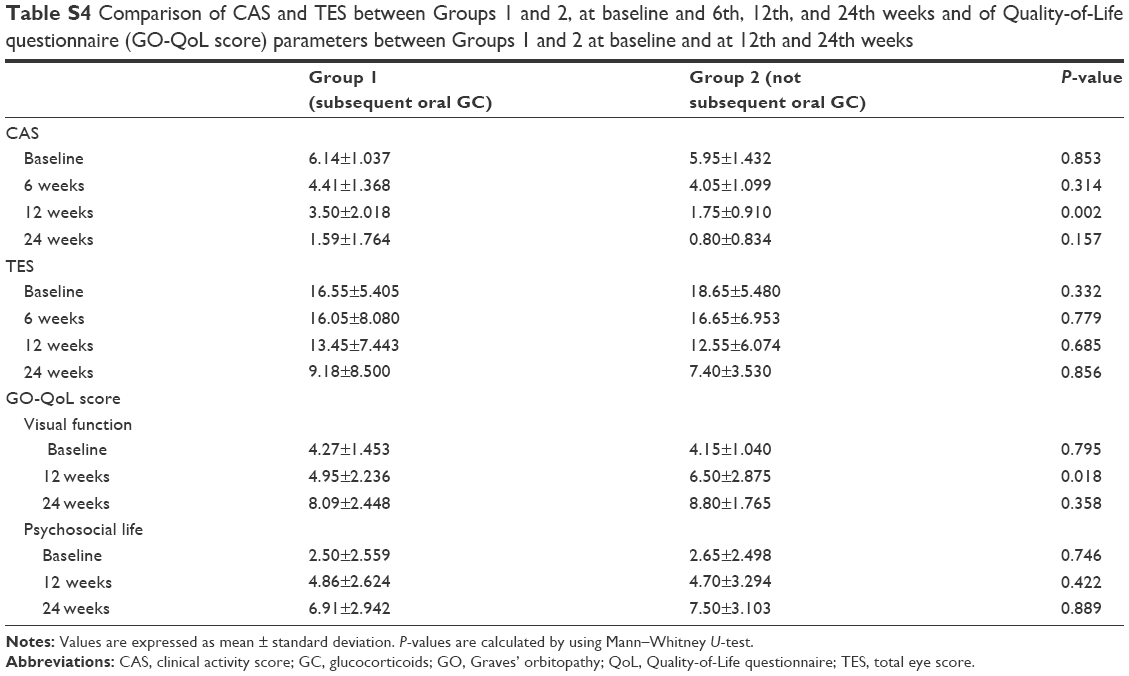 | Table S4 Comparison of CAS and TES between Groups 1 and 2, at baseline and 6th, 12th, and 24th weeks and of Quality-of-Life questionnaire (GO-QoL score) parameters between Groups 1 and 2 at baseline and at 12th and 24th weeks |
 © 2016 The Author(s). This work is published and licensed by Dove Medical Press Limited. The full terms of this license are available at https://www.dovepress.com/terms.php and incorporate the Creative Commons Attribution - Non Commercial (unported, v3.0) License.
By accessing the work you hereby accept the Terms. Non-commercial uses of the work are permitted without any further permission from Dove Medical Press Limited, provided the work is properly attributed. For permission for commercial use of this work, please see paragraphs 4.2 and 5 of our Terms.
© 2016 The Author(s). This work is published and licensed by Dove Medical Press Limited. The full terms of this license are available at https://www.dovepress.com/terms.php and incorporate the Creative Commons Attribution - Non Commercial (unported, v3.0) License.
By accessing the work you hereby accept the Terms. Non-commercial uses of the work are permitted without any further permission from Dove Medical Press Limited, provided the work is properly attributed. For permission for commercial use of this work, please see paragraphs 4.2 and 5 of our Terms.