")
Back to Journals » ClinicoEconomics and Outcomes Research » Volume 10
Clinical and economic outcomes of a "high-touch" clinical management program for intravenous immunoglobulin therapy
Authors Zhu J, Kirkham HS , Ayer G , Chen CC, Wade RL, Karkare SU, Robson CH , Orange JS
Received 26 May 2017
Accepted for publication 4 September 2017
Published 19 December 2017 Volume 2018:10 Pages 1—12
DOI https://doi.org/10.2147/CEOR.S142239
Checked for plagiarism Yes
Review by Single anonymous peer review
Peer reviewer comments 3
Editor who approved publication: Professor Giorgio Colombo
Julia Zhu,1 Heather S Kirkham,1 Gretchen Ayer,2 Chi-Chang Chen,3 Rolin L Wade,3 Swapna U Karkare,4 Chester H Robson,1 Jordan S Orange5
1Walgreens, Deerfield, 2Option Care, Bannockburn, IL, 3Quintiles IMS, Plymouth Meeting, PA, 4Quintiles IMS, Deerfield, IL, 5Baylor College of Medicine, Texas Children’s Hospital, Houston, TX, USA
Objective: To compare clinical and economic outcomes of patients who received intravenous immunoglobulin (IVIG) therapies and were managed by a clinical management program vs the outcomes of matched controls using administrative claim data.
Methods: This retrospective cohort study used the PharMetrics Plus™ claim database between September 1, 2011 and June 30, 2014. Patients in the intervention group were from a “high-touch” IVIG clinical management program administered by a home infusion specialty pharmacy. A greedy propensity score matching algorithm was used to identify a control group from non-program patients. Generalized estimating equation models were employed to evaluate differences between cohorts who were followed for 1 year.
Results: Clinical outcomes were measured as infections and infusion-related adverse events. The proportion of patients who had serious bacterial infections was significantly lower (4.13% vs 7.75%, P=0.049) in the intervention group (n=242) compared to the control group (n=968). Other clinical outcomes assessed were not different between cohorts (P>0.050). The economic outcomes were measured as healthcare costs. The annual adjusted mean total health care costs of patients in the program were $26,522 lower compared to matched controls, representing a 20% lower cost ($109,476 vs $135,998, P=0.002). A major contribution to this difference ($17,269) was IVIG-related total outpatient cost (intervention vs control groups: $64,080 vs $81,349, P=0.001).
Conclusion: The patients in this high-touch IVIG clinical management program appeared to have comparable infections or adverse event rates and significantly lower total health costs compared to their matched controls.
Keywords: immunoglobulin, intravenous, management program, clinical outcomes, economic outcomes
Introduction
Intravenous immunoglobulin (IVIG) has been widely used as an antibody replacement or an “immunomodulatory agent” for indications in hematology, neurology, immunology, rheumatology, dermatology, nephrology, and ophthalmology.1,2 While the clinical indications for using IVIG are expanding,3–6 its administration may lead to considerable side effects and potential adverse events (AEs).3 In addition, IVIG is expensive and thus requires judicious utilization. The annual cost of IVIG treatment has been estimated to exceed US$30,000 per patient depending on dosing, indications, and length of therapy.7–10 Given the overall potential burden of Ig costs, considerations for cost containment are essential.
Clinical outcomes
IVIG has been licensed by the US Food and Drug Administration for prevention of infection in various immunodeficiency diseases that cause susceptibility to recurrent, severe, or usual infections.3,4 Infection rates were chosen as one of the primary clinical outcome measures for our study. AEs were also included, since IVIG administration often results in mild AEs and more rarely in severe AEs, though its safety profile is well established.11–15
Infections
In the US, about 25–30% of IVIG grams are used for the treatment of primary immunodeficiency disorder (PID), which is characterized by recurrent infections. Common variable immunodeficiency is the most common type of PID.16–18 While there is extensive experience with the efficacy of IVIG in common variable immunodeficiency and related PID, there are increasing options for providing therapy, including dose, frequency, and site of care. IVIG therapy dose and residual “trough” IgG levels have been in aggregate correlated with infectious outcomes,19–21 and current practice tends to focus upon individualizing the dosing approach to any given patient.
Adverse events
AEs are common in IVIG therapy. They can be classified as mild (eg, headache, flushing, shivering, itching, urticaria, anxiety, dizziness), moderate (eg, chest pain, wheezing, blood pressure fluctuations, mild reactions becoming worse), or severe (eg, severe headache, aseptic meningitis, renal dysfunction, anaphylaxis, thromboembolic event, moderate reaction persisting or becoming worse) reactions.19–23 A number of studies in the US and other countries have examined the incidence of IVIG-related AEs.3,19–21,23–27 The incidence rates varied widely across studies (21.4–44% of patients; 2.4–12.8% of infusions).3,19–21,23–27 The majority of AEs reported were mild (non-severe).3,19,24 Most mild reactions were able to be reversed by slowing or stopping the infusion for 15–30 minutes.3 Severe AEs were rare: 0–1.3% of infusions or 0–3.6% of treatment courses.19,21,23 Headache was reported as the most common type of AE in some studies,23,25 and patients who received premedication had significantly reduced incidence of AEs (18.2% vs 29.3%, P=0.02).24
Economic outcomes
Few studies have examined economic outcomes associated with Ig therapy, despite the increasing focus on management of health care cost.10,28,29 One study in the US found that the annual costs of IVIG therapies for treating chronic inflammatory demyelinating polyneuropathy and multifocal motor neuropathy were >$50,000 per patient,10 and annual mean costs for treating a cohort of mucous membrane pemphigoid, ocular cicatricial pemphigoid, bullous pemphigoid, and pemphigus vulgaris patients with IVIG were $65,190 ($37,271–$118,232) in another US study.29 Ig drug costs have been identified as the main cost drivers of IVIG therapy in several studies from various countries (Canada, Italy, and Germany).28,30–32
Ig clinical management
Given the current focus on evidence-based medicine and health care cost containment, appropriate clinical management to assure the safe and effective administration of IVIG products is desirable. Accordingly, a “high-touch” clinical management program for patients with IVIG therapy was developed by a US home infusion and specialty pharmacy. The program provided IVIG infusion in a patient’s home or at ambulatory infusion suites. It consisted of a comprehensive care model that included a pre-infusion risk assessment by a pharmacist, infusion monitoring by an Ig-specialized registered nurse (RN), regular clinical follow-up with a patient by a pharmacist that was communicated to physicians for expedient resolution of any clinical issues, and financial consultations.
Site of care
Few studies in the US have compared site of care (ie, place of service), such as hospital inpatient, hospital outpatient, physician office, community infusion center, and patient home. Small studies comparing two care sites have identified no differences in infection or related clinical outcomes, although some differences in quality of life and cost have emerged.33,34 Further understanding of the clinical and economic advantages and disadvantages of all available sites of care is needed. Regardless of site of care, expert clinical practice is essential to ensure safe administration of IVIG3,20,35 and avoid adverse reactions.20
Study objective
This study evaluated a national home infusion specialty pharmacy clinical management program on economic and clinical outcomes of IVIG patients. We hypothesized that AEs and infection rates, as well health costs, could be lower through this patient management model compared to the outcomes of other care models.
Ethics approval
This research was approved by Quorum IRB (28495/1) with a waiver of informed consent, as well as a complete waiver of Health Insurance Portability and Accountability Act authorization.
Materials and methods
We conducted a retrospective cohort study to compare the clinical and economic outcomes of patients who received IVIG and managed by an Ig clinical management program with matched controls in the PharMetrics Plus (PMTX+) database, a US-based administrative claims database with adjudicated medical and pharmacy claims for more than 150 million unique enrollees since 2006.
Ig clinical management model
This IVIG patient care model provided individualized patient care and clinical management by qualified health care professionals. These services included the following:
- pre-infusion clinical evaluation – evaluation for comorbidities affecting the risk of adverse drug reactions (ADRs), coordination with the prescribing clinician for individualized infusion plans to avoid ADRs and patient education to address concerns proactively
- clinical management of infusion by RNs – individualized infusion rate protocols with clinical monitoring before, during, and after infusion; patient education regarding Ig; expectations of treatment; and potential AEs
- regular clinical follow-up with a patient by a pharmacist that was communicated to the prescribing clinician – minimally quarterly contact (always after the first visit, a monthly option is also provided) to assess adherence and ADR management, disease-specific patient-reported outcome measures (quarterly report), and dose adjustment
The care team also provided patient consultation on insurance coverage and financial assistance.
Data source and study population
The data used in this study was from the PMTX+ database, from which the dependent outcomes and covariables for both intervention and control groups were derived. This database is a large longitudinal repository of adjudicated medical and pharmacy claims of more than 150 million unique, commercially insured members throughout the US since 2006.
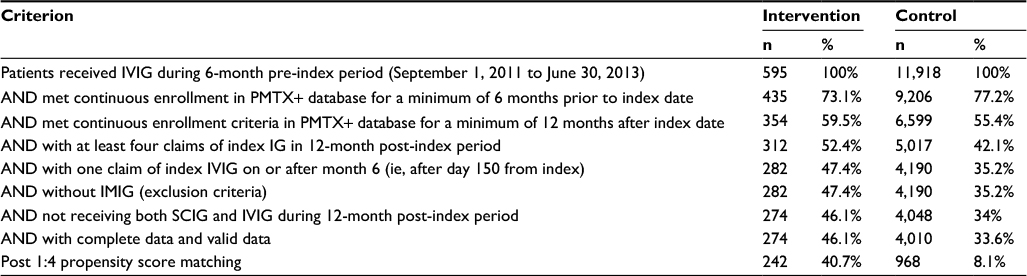
The same inclusion and exclusion criteria were used for the intervention and control groups. Included in the study were patients who had received at least one claim (prescription or administration procedure) for IVIG therapy between September 1, 2011 and June 30, 2013, had continuous eligibility in the PMTX+ database for a minimum of 6 months prior to and 12 months after the date they had received the first IVIG therapy in the study period (the index date), and had at least four IVIG claims in the 12-month post-index period and one claim of IVIG during or after month 6. Both intervention and control cohorts excluded patients who were administered intramuscular immunoglobulin or subcutaneous immunoglobulin during the period, who had incomplete or invalid data records, or if they were prescribed products that can be administered subcutaneously or intravenously (ie, Gammagard liquid, Gamunex-C, and Gammaked), unless they had an administration code (ie, J1561, J1569) observed within 7 days of the claim date. All inclusion and exclusion criteria can be found in Table S1.
The intervention group was identified by linking patients from the national home infusion specialty pharmacy to the PMTX+ database. All patients at the national home infusion specialty pharmacy were managed by the Ig clinical management program, which was administered across multiple locations in the US. None of the patients opted out unless their claims could not be identified in the databases.
All patients were categorized by whether they had an IVIG-treatable autoimmune disease, a non-IVIG-treatable autoimmune disease, or a non-autoimmune disease (Table S2). Within each autoimmune-disease category, the control group was selected from patients who were not in the program and matched to the intervention group using a 1:4 greedy propensity score without replacement.36 Covariates in the propensity score model were age at index date, sex, proximity to immunology centers of excellence (Table S3), geographic region, Charlson Comorbidity Index score, and 6-month pre-index total health care costs (Table 1).
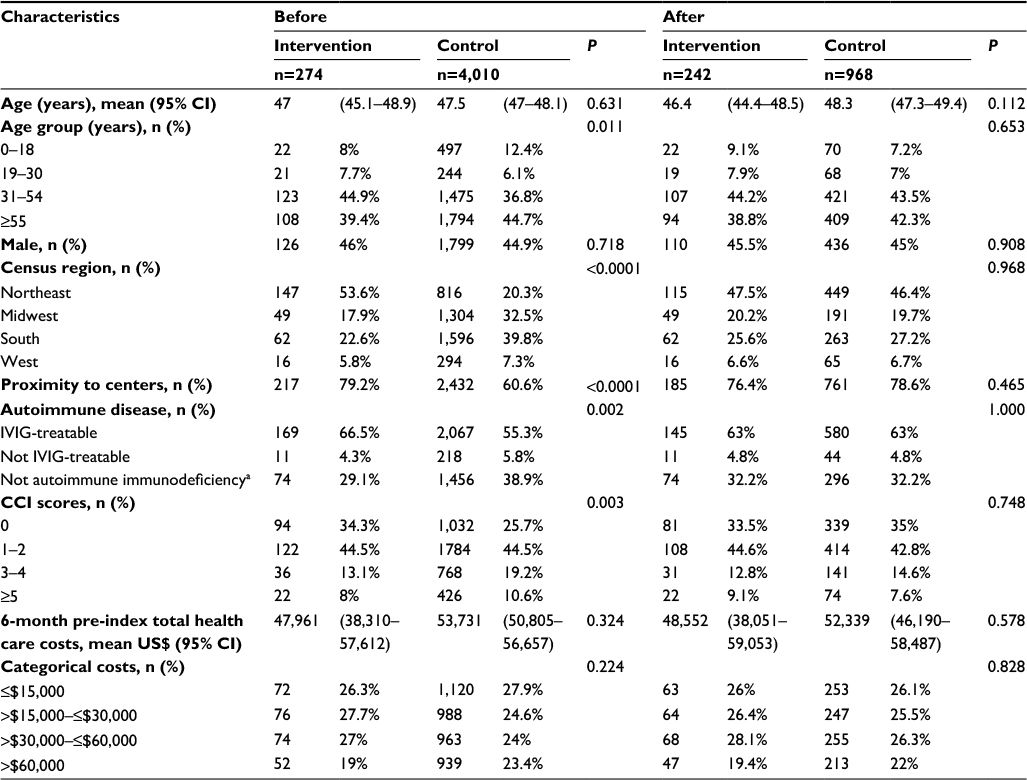 | Table 1 Baseline characteristics of study population before and after propensity score matching Note: aIncluding common variable immunodeficiency. Abbreviations: CCI, Charlson Comorbidity Index; IVIG, intravenous immunoglobulin. |
Clinical outcomes
Primary clinical outcomes included infection and infusion-related AE rates. Infections were categorized into three groups: serious bacterial infections (SBIs), other infections, and all infections (both SBIs and other infections).14,15,37–41 AEs were categorized into four groups: common AEs, serious AEs, and mild, less common AEs (both subjective and objective) (Table S3). Infections and AEs were reported as both patient counts by events of interest and as rates (number of events per patient per year).
Economic outcomes
The primary economic outcome was direct medical costs per person during the study period (12 months post-index date). Total health care costs and segregated cost categories, inpatient, emergency center, outpatient, and total pharmacy claims were reported. All patients in the cohort were included for calculating total health care cost. The allowed amount of the claim was used to determine direct costs, which was defined as the amount the health plan allowed for a particular service, and included both the plan amount paid and member liability (ie, copayment, deductible, and coinsurance). These fully adjudicated claims were inflation-adjusted to 2014 prices using the medical care component of the US Consumer Price Index for all urban consumers. When appropriate, costs that were considered directly related to the drug or administration of the drug were broken down based on Healthcare Common Procedure Coding System (HCPCS), Current Procedural Terminology (CPT), or National Drug Codes. Specifically, Ig-related costs were reported for total allowable costs and total outpatient costs (based on HCPCS/CPT codes). Inpatient/outpatients costs were capped at five times the standard deviation (SD), in order to mitigate outlier effects for both intervention and control groups.
Statistical analyses
We compared baseline characteristics between the two groups using c2 or Fisher’s exact test for categorical variables and Student’s t-test for continuous variables. Categorical measures were reported as the number of cases and percentage of total patients observed in each category, and both mean and SD/ confidence intervals (CIs) were reported for continuous variables. Clinical and economic outcomes were analyzed using generalized estimation equation (GEE) models with log-link, negative-binomial distributions. The unstructured correlation matrix was applied or compound symmetry used if the model did not converge. For the clinical model, the adjusted event rate was reported and the models adjusted for program-management model, number of Ig administrations, place of service (eg, hospital, home, clinic), diabetes (yes/no), and renal disease (yes/no). The program-management variable adjusted for changes in how the program was administered over the 3-year study period across the US. For example, the frequency of clinical assessments increased for the intervention group over time. For the economic model, adjusted mean costs used were adjusted by program management model, place of service, and number of Ig administrations. The proportion of patients with AEs was compared between intervention and control groups using c2 or Fisher’s exact test. Unadjusted results were presented if the GEE model did not converge. All analyses were performed at a patient level using SAS 9.2 (SAS Institute, Cary, NC, USA). P<0.05 was considered statistically significant.
Results
To evaluate the impact of this “high-touch” clinical management program, both clinical and economic outcomes were compared between patients within the program and their matched controls. Prior to propensity score matching, there were 274 and 4,010 eligible patients in the intervention and control groups, respectively. Before matching, patient geographic distribution and access to immunology expertise centers were significantly different between the two groups, whereas no significant differences were found for age, sex, or autoimmune disease status. After propensity score matching, the 242 and 968 patients remaining in the intervention and control groups, respectively, had similar baseline characteristics across all domains, including cost prior to intervention (Table 1).
After the intervention, there were a few differences worth noting. While most AE and infection outcomes were not statistically significantly different, the proportion of patients who had SBIs was significantly lower in the intervention group compared to the matched controls (4.13% vs 7.75%, P=0.05). The SBI rate (events per patient per year) was also much lower among managed patients and close to significance (0.12 vs 0.45, P=0.07; Table 2).
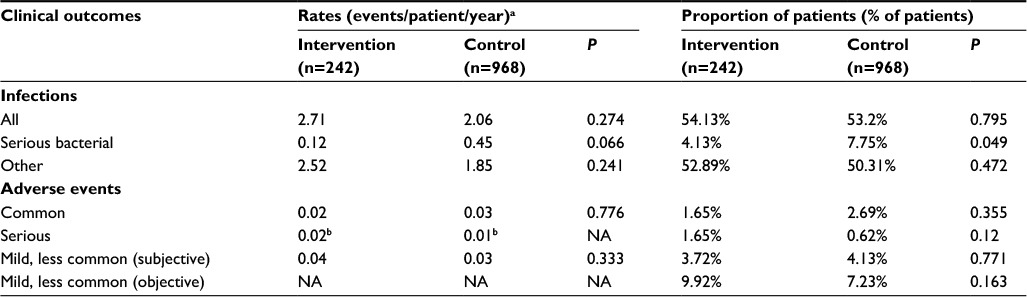 | Table 2 Infection and adverse event rates of comparison groups Notes: aRates are means after adjustment of program management model, number of Ig administrations, site of care, diabetes (yes/no), and renal disease (yes/no) by the GEE regression model; bunadjusted means, since the GEE model did not converge. Abbreviations: GEE, generalized estimation equation; NA, not applicable. |
Considerably lower cost was achieved for managed patients (Table 3). The annual mean total allowable cost of patients in the clinical management program was $26,522 (20%) lower compared to the annual mean cost of matched controls (P=0.002), with the difference in mean Ig-related total allowable costs $17,495 (annual mean cost of intervention vs control groups $64,332 vs $81,827, P=0.001). A major contribution to this difference ($17,269) was Ig-related total outpatient cost (intervention vs control groups: $64,080 vs $81,349, P=0.001). Though not statistically significant, annual differences in total mean inpatient and pharmacy costs were $5,356 and $1,517, respectively. In contrast, the total emergency center care costs were slightly higher for patients in the IVIG clinical management program, but the difference was not significant (P=0.107).
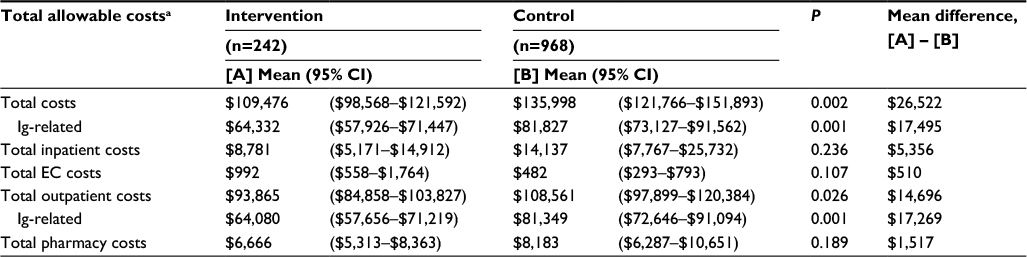 | Table 3 Total allowable costs (US$) of comparison groups Note: aMean costs per patient per year are means after adjustment of program management model, site of care, and number of Ig administrations by regression model. Abbreviation: EC, emergency center. |
Discussion
IVIG is standard therapy for many immunologic diseases. In recent years, alternative sites of care for IVIG infusion have emerged, including infusion in a patient’s home or at an ambulatory infusion suite, compared to more traditional sites of care, such as a hospital or a physician’s office.6,42
Due to the complexity of immunoglobulin administration and its known potential for causing AEs, safety is a major concern, especially in settings outside hospitals or hospital infusion centers. While IVIG infusion is clinically complex, several studies have demonstrated the safety of administration of IVIG at home or in ambulatory infusion settings.26,43–45 Providers and physicians continue to develop and optimize clinical care models to provide the best outcomes while minimizing health care expenditures. The results of this study suggested that a clinical care model drives comparable clinical outcomes when compared to a diverse population receiving IVIG. AE rates and non-serious infection rates in the intervention group were comparable, while SBI rates and the proportion of patients who had SBIs were either significantly lower or very close to being significantly lower in the intervention group. This may be attributable to the individualized infusion services provided by the Ig-trained RNs and pharmacists in this care model. It was difficult to compare our findings with AE rates stated in the existing literature, due to differences in Ig dosages, diversity of diagnoses, and the scope and definition of AEs and infections. When one considers AE rates in licensing materials (package inserts) from IVIG products, those identified in the present work were generally in line with existing/expected experience.34 The major exception was common, mild AEs, which were low in both populations, but this could have been due to differences in reporting these occurrences in a trial study vs real-world practice.
This study also revealed lower direct health care expenditure in the intervention group compared to the control group. The majority of the difference in total adjusted allowable cost between the two groups was in Ig-related outpatient costs ($17,269, 65% of cost difference). The IVIG treatment cost variations in this study and two other US studies cited in the introduction session could be attributed to cost inflation, place of service, disease scope, and dosage range of Ig therapies. Even when Ig-related costs were removed, cost differences remained in the intervention group when compared to controls. This difference could be ascribed to lower medication costs related to site of care; in other words, the same drug is reimbursed differently across sites of care.46,47 With the rising demand for accessible high-quality care at lower overall cost, this patient-centered clinical management model may show the ability to help achieve these goals in IVIG treatment.
Limitations
Many of the limitations in this study were similar to many other retrospective observational studies using administrative claims data. For instance, the population of patients selected for one particular treatment over another may have different characteristics (channeling bias). The medical billing codes used to indicate diagnoses and procedures may be subject to non-clinical influences. Some of these differences can often be measured (such as age and autoimmune disease status), and thus were controlled for in this study. Others were unknown or not measurable. In addition, this study was unable to specify if any clinical care model was applied to any patient in the control group. Because our study period covered 3 years, changes in the program model were inevitable, although we tried to control for such changes by adding the program management model variable to our regression models. While there was careful matching of the intervention and control groups in the pre-intervention period, the comparison may be skewed by physicians maintaining more fragile patients at inpatient and outpatient settings for treatment, which would lead to a bias in health care-related expenses in the control group. That said, we controlled for pre-intervention costs via propensity score matching. Importantly, the cost advantage of this care model was maintained, even when the differing drug cost was removed as a factor. Future studies could and perhaps should focus more specifically upon comparing specific care models within individual sites of care. This, however, represents a first step in generating the motivation for these questions.
Implications for clinical care and future research
In aggregate, though there were a few notable clinical benefits, clinical outcomes were similar between patients in this care model and the matched control group, which likely represented various types of care models. However, given the significant economic advantage shown here, the provision of therapy at home using this type of care model should be a consideration for patients, providers, and payers. Since it was difficult to draw strong conclusions from this initial study, further research will be needed to identify exactly which type of patients may benefit most and exactly what advantages this robust clinical care model may offer in comparison with other programs. Appreciating that the site of care decision for patients is complex, we are hopeful that research will help identify how to utilize advantages and avoid disadvantages to achieve the best clinical outcomes and cost savings for patients.
All authors contributed toward data analysis, drafting and critically revising the paper and agree to be accountable for all aspects of the work.
Acknowledgments
We would like to thank Dr. Harry Leider for his support and constructive advice. We are also grateful to Jingsong Lu, who provided data analysis and statistical advice. Also, we thank Nancy Kupka for her clinical advice and assistance. This research was funded by Walgreen Co. and Option Care Inc.
Disclosure
JZ, CHR, and HSK are full-time employees of Walgreens, a study sponsor. GA is a salaried employee of Option Care, a study sponsor. CCC, RLW, and SUK report grants from Walgreens. JSO reports personal fees from Walgreens/Option Care during the conduct of the study, grants, and personal fees from CSL Behring, Baxalta, Grifols, ASD Healthcare, ADMA Biologics, and Atlantic Research Group, and non-financial support from BPL outside the submitted work.
References
Jolles S, Sewell WA, Misbah SA. Clinical uses of intravenous immunoglobulin. Clin ExP Immunol. 2005;142(1):1–11. | ||
Todd AA, Yap PL. Applications of intravenous immunoglobulin in haematology. Blood Rev. 1992;6(2):105–117. | ||
Orange JS, Hossny EM, Weiler CR, et al. Use of intravenous immunoglobulin in human disease: a review of evidence by members of the Primary Immunodeficiency Committee of the American Academy of Allergy, Asthma and Immunology. J Allergy Clin Immunol. 2006;117(4 Suppl): S525–S553. | ||
Orange JS, Ochs HD, Cunningham-Rundles C. Prioritization of evidence-based indications for intravenous immunoglobulin. J Clin Immunol. 2013;33(6):1033–1036. | ||
Dalakas MC. Intravenous immune globulin therapy for neurologic diseases. Ann Intern Med. 1997;126(9):721–730. | ||
Ashida ER, Saxon A. Home intravenous immunoglobulin therapy by self-administration. J Clin Immunol. 1986;6(4):306–309. | ||
Modell V, Gee B, Lewis DB, et al. Global study of primary immunodeficiency diseases (PI) – diagnosis, treatment, and economic impact: an updated report from the Jeffrey Modell Foundation. Immunol Res. 2011;51(1):61–70. | ||
Tonkovic B, Rutishauser LK. Descriptive review and analysis of immunoglobulin utilization management from 2,548 prior authorization requests. J Manag Care SPec Pharm. 2014;20(4):357–367. | ||
Boyle ML, Scalchunes C. Impact of intervenous [sic] immunoglobulin (IVIG) treatment among patients with primary immunodeficiency diseases. Pharm Policy Law. 2008;10:133–146. | ||
Darabi K, Abdel-Wahab O, Dzik WH. Current usage of intravenous immune globulin and the rationale behind it: the Massachusetts General Hospital data and a review of the literature. Transfusion. 2006;46(5):741–753. | ||
Ballow M. Safety of IGIV therapy and infusion-related adverse events. Immunol Res. 2007;38(1–3):122–132. | ||
Wittstock M, Zettl UK. Adverse effects of treatment with intravenous immunoglobulins for neurological diseases. J Neurol. 2006;253(Suppl 5):V75–V79. | ||
Hamrock DJ. Adverse events associated with intravenous immunoglobulin therapy. Int ImmunoPharmacol. 2006;6(4):535–542. | ||
Chapel HM, Spickett GP, Ericson D, Engl W, Eibl MM, Bjorkander J. The comparison of the efficacy and safety of intravenous versus subcutaneous immunoglobulin replacement therapy. J Clin Immunol. 2000;20(2):94–100. | ||
Desai SH, Chouksey A, Poll J, Berger M. A pilot study of equal doses of 10% IGIV given intravenously or subcutaneously. J Allergy Clin Immunol. 2009;124(4):854–856. | ||
Cunningham-Rundles C, Bodian C. Common variable immunodeficiency: clinical and immunological features of 248 patients. Clin Immunol. 1999;92(1):34–48. | ||
Cunningham-Rundles C. Clinical and immunologic analyses of 103 patients with common variable immunodeficiency. J Clin Immunol. 1989;9(1):22–33. | ||
Sneller MC, Strober W, Eisenstein E, Jaffe JS, Cunningham-Rundles C. New insights into common variable immunodeficiency. Ann Intern Med. 1993;118(9):720–730. | ||
Aghamohammadi A, Farhoudi A, Nikzad M, et al. Adverse reactions of prophylactic intravenous immunoglobulin infusions in Iranian patients with primary immunodeficiency. Ann Allergy Asthma Immunol. 2004;92(1):60–64. | ||
Brennan V, Salomé-Bentley N, Chapel H. Prospective audit of adverse reactions occurring in 459 primary antibody-deficient patients receiving intravenous immunoglobulin. Clin ExP Immunol. 2003;133(2):247–251. | ||
Feldmeyer L, Benden C, Haile SR, et al. Not all intravenous immunoglobulin preparations are equally well tolerated. Acta Derm Venereol. 2010;90(5):494–497. | ||
Pierce LR, Jain N. Risks associated with the use of intravenous immunoglobulin. Transfus Med Rev. 2003;17(4):241–251. | ||
Stangel M, Kiefer R, Pette M, Smolka MN, Marx P, Gold R. Side effects of intravenous immunoglobulins in neurological autoimmune disorders. J Neurol. 2003;250(7):818–821. | ||
Stiehm ER. Adverse effects of human immunoglobulin therapy. Transfus Med Rev. 2013;27(3):171–178. | ||
Souayah N, Hasan A, Khan HM, Yacoub HA, Jafri M. The safety profile of home infusion of intravenous immunoglobulin in patients with neuroimmunologic disorders. J Clin Neuromuscul Dis. 2011;12 (Suppl 4):S1–S10. | ||
Singh-Grewal D, Kemp A, Wong M. A prospective study of the immediate and delayed adverse events following intravenous immunoglobulin infusions. Arch Dis Child. 2006;91(8):651–654. | ||
Katz U, Achiron A, Sherer Y, Shoenfeld Y. Safety of intravenous immunoglobulin (IVIG) therapy. Autoimmun rev. 2007;6(4):257–259. | ||
Immune Deficiency Foundation. IDF surveys. Available from: http://primaryimmune.org/idf-survey-research-center/idf-surveys. Accessed May 2, 2016. | ||
Lazzaro C, Lopiano L, Cocito D. Subcutaneous vs intravenous administration of immunoglobulin in chronic inflammatory demyelinating polyneuropathy: an Italian cost-minimization analysis. Neurol Sci. 2014;35(7):1023–1034. | ||
Daoud Y, Amin KG, Mohan K, Ahmed AR. Cost of intravenous immunoglobulin therapy versus conventional immunosuppressive therapy in patients with mucous membrane pemphigoid: a preliminary study. Ann Pharmacother. 2005;39(12):2003–2008. | ||
Martin A, Lavoie L, Goetghebeur M, Schellenberg R. Economic benefits of subcutaneous rapid push versus intravenous immunoglobulin infusion therapy in adult patients with primary immune deficiency. Transfus Med. 2013;23(1):55–60. | ||
Högy B, Keinecke HO, Borte M. Pharmacoeconomic evaluation of immunoglobulin treatment in patients with antibody deficiencies from the perspective of the German statutory health insurance. Eur J Health Econ. 2005;6(1):24–29. | ||
Membe SK, Ho C, Cimon K, Morrison A, Kanani A, Roifman CM. Economic assessment of different modalities of immunoglobulin replacement therapy. Immunol Allergy Clin North Am. 2008;28(4):861–874. | ||
Gardulf A, Nicolay U, Asensio O, et al. Children and adults with primary antibody deficiencies gain quality of life by subcutaneous IgG self-infusions at home. J Allergy Clin Immunol. 2004;114(4):936–942. | ||
Brennan VM, Salomé-Bentley NJ, Chapel HM. Prospective audit of adverse reactions occurring in 459 primary antibody-deficient patients receiving intravenous immunoglobulin. Clin ExP Immunol. 2003;133(2):247–251. | ||
Misbah SA, Chapel HM. Adverse effects of intravenous immunoglobulin. Drug Saf. 1993;9(4):254–262. | ||
Rassen JA, Shelat AA, Myers J, Glynn RJ, Rothman KJ, Schneeweiss S. Optimal approaches to one-to-many propensity score matching in cohort studies. Pharmacoepidemiol Drug Saf. 2012;21(Suppl 3):S34–S35. | ||
Orange JS, Belohradsky BH, Berger M, et al. Evaluation of correlation between dose and clinical outcomes in subcutaneous immunoglobulin replacement therapy. Clin ExP Immunol. 2012;169(2):172–181. | ||
Ochs HD, Gupta S, Kiessling P, Nicolay U, Berger M. Safety and efficacy of self-administered subcutaneous immunoglobulin in patients with primary immunodeficiency diseases. J Clin Immunol. 2006;26(3):265–273. | ||
Maroto Hernando M, Soler Palacin P, Martin Nalda N, Oliveras Arenas M, Espanol Boren T, Figueras Nadal C. Gammaglobulina subcutánea en inmunodeficiencia común variable. Primera experiencia en España [Subcutaneous gammaglobulin in common variable immunodeficiency. First experience in Spain]. An Pediatr (Barc). 2009;70(2):111–119. Spanish. | ||
Hagan JB, Fasano MB, Spector S, et al. Efficacy and safety of a new 20% immunoglobulin preparation for subcutaneous administration, IgPro20, in patients with primary immunodeficiency. J Clin Immunol. 2010;30(5):734–745. | ||
Berger M, Murphy E, Riley P, Bergman GE. Improved quality of life, immunoglobulin G levels, and infection rates in patients with primary immunodeficiency diseases during self-treatment with subcutaneous immunoglobulin G. South Med J. 2010;103(9):856–863. | ||
Lima H, Clarke A. IgG therapy for the home-based patient: administration and delivery method considerations. 2012. Available from: https://www.nhia.org/infusion/documents/2012/IgGSupplement_NovDec12_FINAL.pdf. Accessed September 25, 2017. | ||
Chapel H, Brennan V, Delson E. Immunoglobulin replacement therapy by self-infusion at home. Clin ExP Immunol. 1988;73(1):160–162. | ||
Brennan VM, Cochrane S, Fletcher C, Hendy D, Powell P. Surveillance of adverse reactions in patients self-infusing intravenous immunoglobulin at home. J Clin Immunol. 1995;15(2):116–119. | ||
Kobayashi RH, Kobayashi AD, Lee N, Fischer S, Ochs HD. Home self-administration of intravenous immunoglobulin therapy in children. Pediatrics. 1990;85(5):705–709. | ||
Johnson K. Current trends in specialty drug utilization and management payer interventions in the shadow of a burgeoning pipeline. 2013. Available from: http://formularyjournal.modernmedicine.com/formulary-journal/content/tags/specialty-drugs/current-trends-specialty-drug-utilization-and-managem. Accessed September 25, 2017. |
Supplementary materials
 | Table S1 Study population attrition Abbreviations: IVIG, intravenous Ig; PMTX, PharMetrics; IMIG, intramuscular immunoglobulin; SCIG, subcutaneous immunoglobulin. |
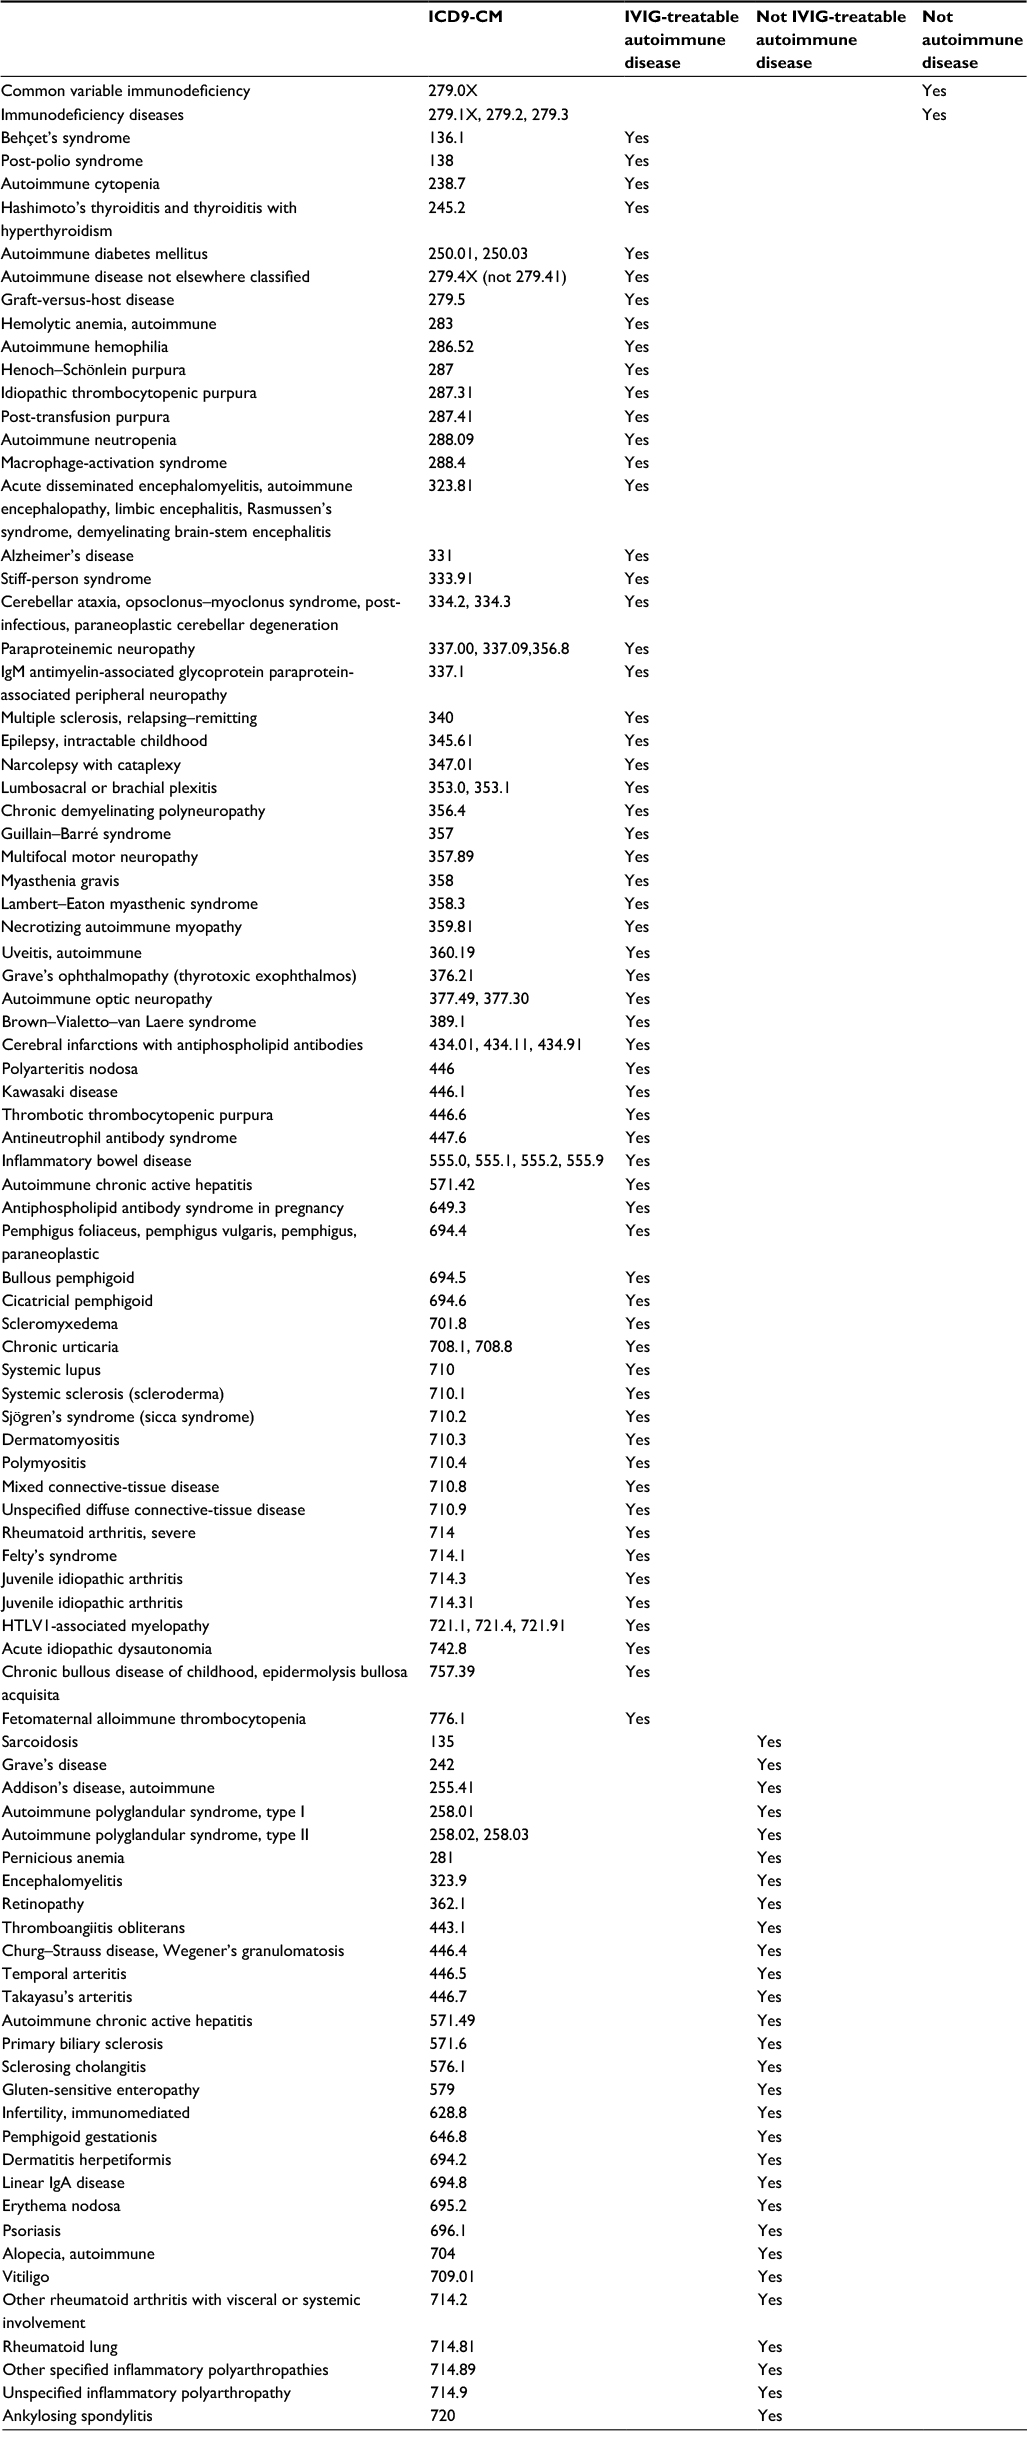 | Table S2 Classification of autoimmune disease covariates Abbreviations: HTLV1, Human T-lymphotropic virus 1; IVIG, intravenous immunoglobulin. |
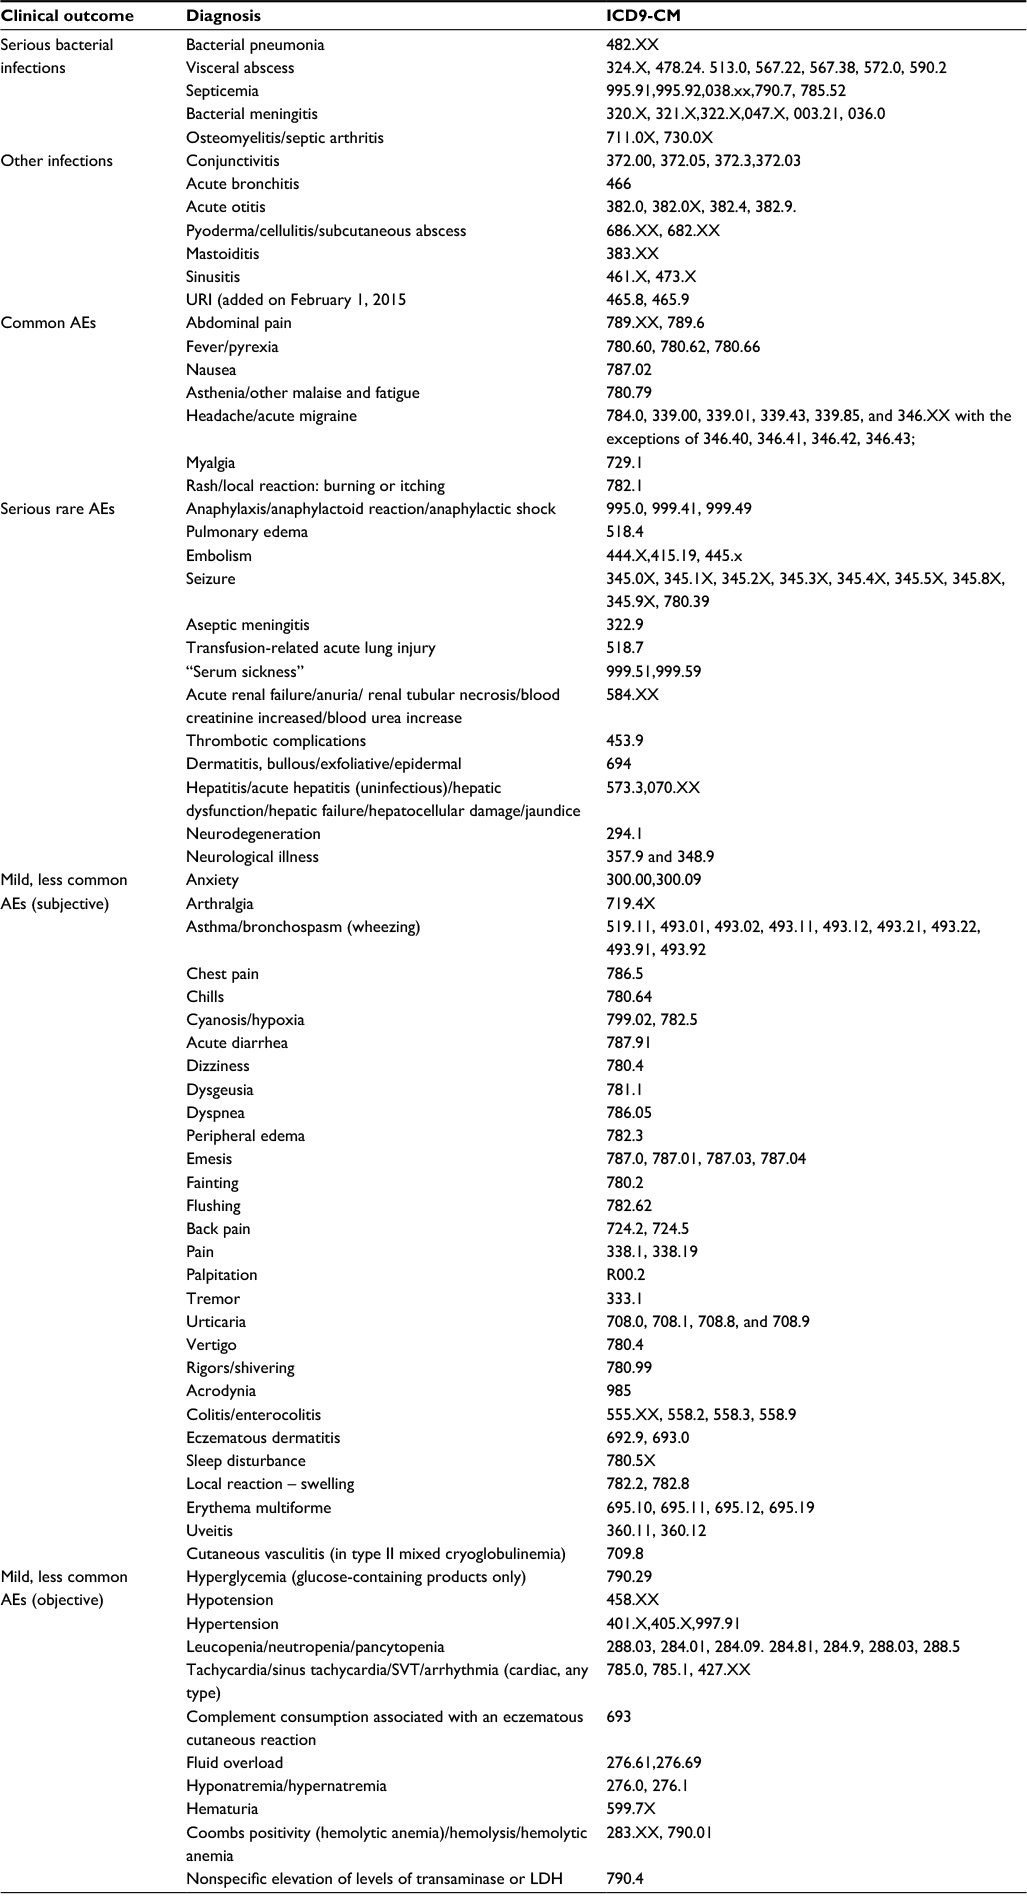 | Table S3 Clinical outcomes Abbreviations: URI, Upper respiratory infections; AEs, adverse events; SVT, supraventricular tachycardia; LDH, lactic acid dehydrogenase. |
 © 2017 The Author(s). This work is published and licensed by Dove Medical Press Limited. The full terms of this license are available at https://www.dovepress.com/terms.php and incorporate the Creative Commons Attribution - Non Commercial (unported, v3.0) License.
By accessing the work you hereby accept the Terms. Non-commercial uses of the work are permitted without any further permission from Dove Medical Press Limited, provided the work is properly attributed. For permission for commercial use of this work, please see paragraphs 4.2 and 5 of our Terms.
© 2017 The Author(s). This work is published and licensed by Dove Medical Press Limited. The full terms of this license are available at https://www.dovepress.com/terms.php and incorporate the Creative Commons Attribution - Non Commercial (unported, v3.0) License.
By accessing the work you hereby accept the Terms. Non-commercial uses of the work are permitted without any further permission from Dove Medical Press Limited, provided the work is properly attributed. For permission for commercial use of this work, please see paragraphs 4.2 and 5 of our Terms.