")
Back to Journals » Integrated Pharmacy Research and Practice » Volume 5
Clients’ perception and satisfaction toward service provided by pharmacy professionals at a teaching hospital in Ethiopia
Authors Teshome Kefale A , Hagos Atsebah G, Ayele Mega T
Received 1 August 2016
Accepted for publication 29 September 2016
Published 14 November 2016 Volume 2016:5 Pages 85—94
DOI https://doi.org/10.2147/IPRP.S118657
Checked for plagiarism Yes
Review by Single anonymous peer review
Peer reviewer comments 2
Editor who approved publication: Professor Jonathan Ling
Adane Teshome Kefale, Gebru Hagos Atsebah, Teshale Ayele Mega
Department of Pharmacy, College of Health Sciences, Mizan-Tepi University, Mizan-Aman, Ethiopia
Background: Evaluation of client’s perception and satisfaction with pharmacy services is important to identify specific areas of the service that need improvement in achieving high-quality pharmacy services. It also helps to detect the gaps in the current pharmaceutical services provision.
Objective: To assess clients’ perception and satisfaction toward service provided by pharmacy professionals at Mizan-Tepi University Teaching Hospital.
Methods: A cross-sectional study design was employed from March 8 to 24, 2016. A semistructured questionnaire was used to assess clients’ perception and satisfaction toward service provided by pharmacy professionals. The data collected were entered into Epi data 3.1, cleaned, and transported into and analyzed using SPSS version 20. Logistic regression was employed to determine associated factors, and statistical significance was considered at p-value <0.05.
Results: Among 384 respondents, 53.1% were male. Of the total participants, 63.8% had good perception and 36.2% had poor perception toward pharmacy services. With regard to satisfaction, 52.6% of the respondents were satisfied and 47.4% were unsatisfied by the pharmaceutical services. Sociodemographic variables such as educational level (p=0.000), occupation (p=0.031), payment for service (p=0.002), and reasons the respondents seek service (p=0.001) showed statistically significant association with the level of perception. Clients’ satisfaction was found to be significantly associated with educational level (p=0.002) and reason for seeking service (p=0.016).
Conclusion and recommendation: This study showed that the overall mean perception and satisfaction of clients in Mizan-Tepi University Teaching Hospital was low, even though it was above the mean level of perception and satisfaction. Action has to be taken to improve the perception and satisfaction of clients with the services provided in the pharmacy section.
Keywords: pharmaceutical services, MTUTH, Likert scale
Introduction
Pharmacy professionals are drug experts who can provide drug information, optimized drug therapy management, promoting safe and cost effective use of medications for positive therapeutic outcome1–3 along with reduction of deleterious effects of drugs. Pharmacy professionals comprise pharmacists, druggists, and pharmacy technicians. Pharmacists are the principal professionals who interact with clients, starting from receiving prescriptions to dispatching medications. Counseling is a major activity that is carried out by pharmacists. Druggists and technicians provide technical support to pharmacists and also carry out counseling and dispensing medication under the supervision of pharmacists.4
Evaluation of client’s satisfaction toward pharmacy services as a crucial part of the health services through appropriate studies is important to identify gaps and factors influencing it.5 Patient’s perception toward pharmaceutical services is one of the biggest personal challenges in medication therapy. It affects the patient’s awareness and attitude toward the effectiveness and safety of drugs as well as the health care service and decreases patient’s acceptability of medication and in turn patient’s adherence. Nowadays health care providers have realized that patients’ perception and psychological acceptance of the medication provided is the first component of medical therapy.6 In one study, less than half of (45.1%) respondents agreed that pharmacists could play a leading role in patient self-care of chronic diseases, whereas 44.6% disagreed and 10.3% were neutral.7 A study done in Nigeria on perception of pharmaceutical care roles of pharmacists among inpatients in a tertiary care facility showed that the mean percentage perception score of respondents toward pharmaceutical care was 86%.8
It is recommended that measurement of the quality of pharmaceutical services should give emphasis on the feelings of the customers of the service. The overall mean score the respondents gave to satisfaction with the pharmaceutical services was 2.48 out of a maximum of 5.00, and clients who were paying for the pharmacy service they received had lower satisfaction with the service.9 Different literature reported different levels of patients’ perception and satisfaction by the service provided by pharmacists.7,8,10–15
With all these diverse literature findings and lack of studies in the current setup, it is prudent to conduct this study to determine perceptions and satisfaction level of clients served by the hospital and identify factors that can negatively affect service provision. At the end, the result of this study helps to improve quality of pharmaceutical services at Mizan-Tepi University Teaching Hospital (MTUTH).
Method and participants
Study setting and participants
A cross-sectional study was conducted at the outpatient pharmacy and antiretroviral therapy (ART) sections of MTUTH, located in Southwest Ethiopia from March 8 to 24, 2016. MTUTH is one of the public hospitals in Bench Maji zone that serves the people of Mizan-Aman town and surrounding community with a catchment population of more than a half million. It has four major wards, namely, medical, surgical, pediatric, and gynecology/obstetric wards. The hospital pharmacy is organized into outpatient, emergency, inpatient, and ART pharmacies.
Patients who are being treated or caregivers aged >18 years who received pharmacy services were included in the study. Patients who were too severely ill to be interviewed and those refusing to participate were excluded from the study.
Sample size determination and sampling technique
The sample size was determined using the following single proportion formula:
|
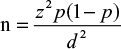
where n is the sample size, z the confidence interval, p the prevalence rate 0.5 based study done in Gondar,4 q=1–p, which is 0.5, and d the standard error (5%).
|
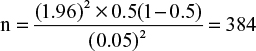
Accordingly, 384 subjects were included the study. Study subjects were randomly selected – every sixth client who visited the outpatient pharmacy; this was determined from the average number of clients who received pharmaceutical services per day. Data collectors interviewed 30 clients per day each working day.
In this study, the client was a patient or caregiver who received pharmaceutical services from hospital pharmacies and who met inclusion criteria.
Data collection instrument and process
Data were collected on sociodemographic variables such as age, sex, residence, educational level, reason of visit, and payment status by interview using semistructured questionnaire developed by investigators. A questionnaire containing 10 four-point Likert scale items to assess the perception and knowledge of clients toward service provided by pharmacy professionals and 12 five-point Likert scale items to assess satisfaction of clients toward pharmacy services was employed; this was adapted from previous studies.5,8,16,17 The questionnaire was pretested on 20 clients to check its suitability and validity prior to main data collection.
The interview was conducted at exit from pharmacy after they received pharmaceutical services. The interview was taken by two BSc nurses who were trained on the objective of the study, techniques of interviewing, how to approach clients, and the necessity of keeping confidentiality. Principal investigators continuously checked completeness and clarity of collected data.
Statistical analysis
The collected data were cleaned, filtered, and organized using Epi data 3.1 and then exported to SPSS version 20 for analysis. Each item for perception was scored on a four-point Likert scale ranging from 1 (strongly disagree) to 4 (strongly agree). The mean level of perception of clients was calculated by averaging their ratings on Likert scale for the ten items measuring perception, and those who scored greater than the overall mean value were considered to have positive perception and those who scored less than the overall mean value were considered to have negative perception. Each item for satisfaction was scored on a five-point Likert scale ranging from 1 (poor) to 5 (excellent). Accordingly, the mean level of clients’ satisfaction was calculated by averaging their ratings for the 12 items measuring satisfaction, and those who scored greater than the overall mean value were considered to be satisfied and those who scored less than the overall mean value were considered to be unsatisfied with services.5,9,17 Factors associated with perception and satisfaction level of clients were described using 95% confidence interval, and p-value of 0.05 or less was considered as statistically significant.
Ethical considerations
The study was conducted after receiving ethical clearance from the institutional review board of Mizan-Tepi University, College of Health Sciences. A formal letter of cooperation was written to MTUTH, and data collection was commenced after obtaining official permission from clinical director of the hospital. Informed written consent was secured for all participants, and the confidentiality of collected data was maintained.
Results
Background characteristics of participants
Out of 384 clients interviewed, most of the respondents were male (53.1%) and from urban areas (59.5%). Among the respondents, those in the age group of 25–34 years constituted the highest proportion (30.5%), followed by the age group of 35–44 years (29.7%). Respondents who collected medications for themselves (67.4%) and those who paid for the medications (59.9%) constituted the highest proportion in their respective categories (Table 1).
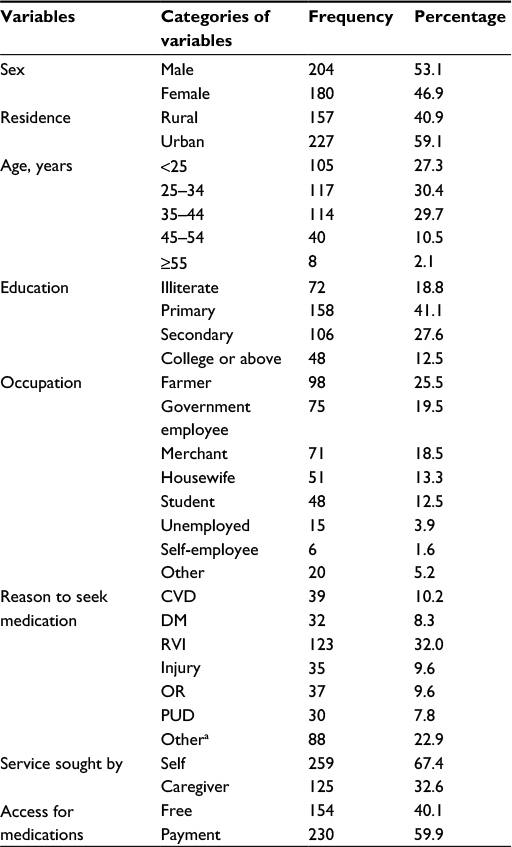 | Table 1 Background characteristics of study participants (N=384), MTUTH, March 2016 Note: aTyphoid, pneumonia, antenatal care, epilepsy, asthma, skin infections. Abbreviations: RVI, retroviral infection; CVD, cardiovascular disorder; DM, diabetes mellitus; OR, operation room; PUD, peptic ulcer disease; MTUTH, Mizan-Tepi University Teaching Hospital. |
Perception of clients toward pharmacy services and associated factors
In the study of clients’ perception toward pharmacy services, the overall mean score of the respondents was 28 out of a maximum of 40. All the mean scores for the individual parameters rated were less than 3.00 out of 4.00 but were above the mean of Likert scale (2.00). Among the mean scores, the maximum score was given for the parameter “Pharmacists counsel you about the directions for use of medications” (2.95), while “Pharmacists are very helpful in drug product selection” and “Pharmacists have responsibilities to monitor your response to drugs” were parameters with lowest mean score, each scored 2.73. The overall mean score of all parameters was 2.85 out of 4.00 (Table S1). Overall, 63.8% had positive perception and 36.2% had negative perception toward pharmacy services.
Among different independent variables, educational level, occupation, the reason for seeking service, and payment for service were found to be significantly associated with clients’ perception on bivariate logistic regression. Accordingly, those who were illiterate (p=0.000, crude odd ratio [COR] =0.189) and those who studied up to primary (p=0.011, COR =0.345) and secondary (p=0.031, COR =0.389) level had a more positive perception toward pharmacy services as compared with the more educated (college or above) counterparts. Similarly, patients who sought ART-related services had a positive perception (p=0.001, COR =0.191). However, government employees (p=0.028, COR =3.619) and those receiving services with payment (p=0.002, COR =1.94) demonstrated negative perception toward pharmaceutical services (Table 2).
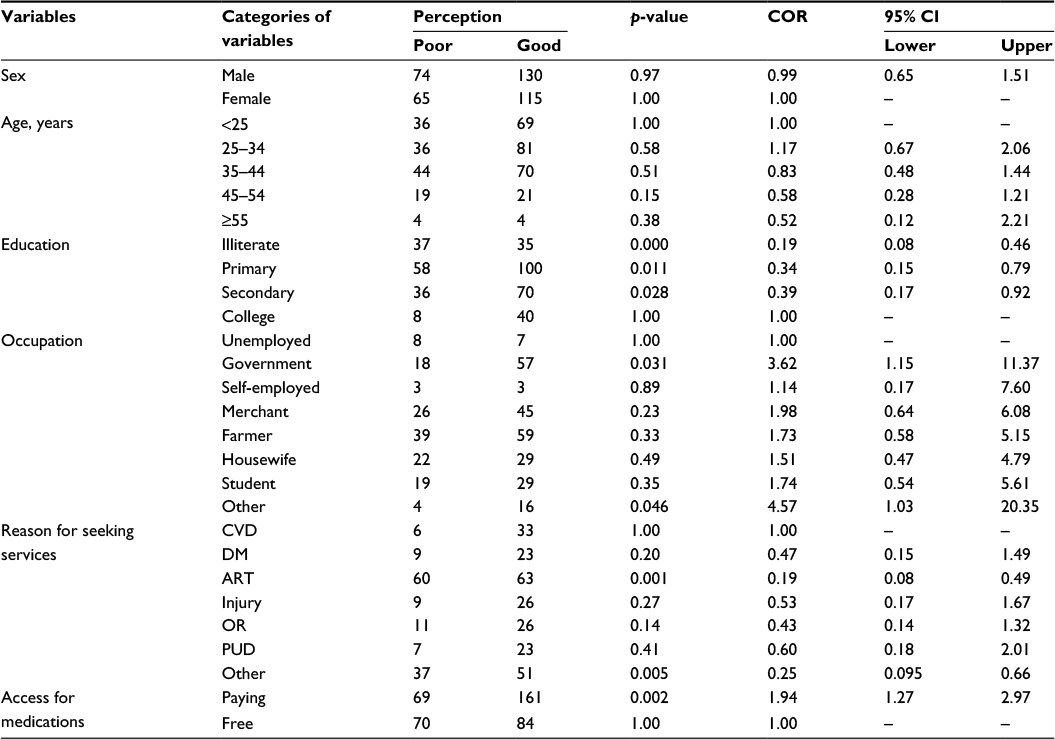 | Table 2 Factors associated with perception of clients on pharmaceutical services (N=384), MTUTH, March 2016 Abbreviations: ART, antiretroviral therapy; COR, crude odd ratio; CI, confidence interval; CVD, cardiovascular disease; DM, diabetes mellitus; PUD, peptic ulcer disease; OR, operation room (patients with some procedures); MTUTH, Mizan-Tepi University Teaching Hospital. |
Multivariable logistic regression was fit to determine independent predictors of clients’ perception. The result of output shows that education and the primary reason for seeking service remained independent predictors of perception. Accordingly, those who were illiterate (p=0.009, adjusted odd ratio [AOR] =0.23) and those patients who sought ART services (p=0.004, AOR =0.21) had more likely good perception toward pharmacy services (Table S2).
Satisfaction level of clients with the services of the pharmacy
For the satisfaction level of clients’ toward the pharmaceutical services, the overall mean score of the respondents was 41.6 out of a maximum score of 60. The mean scores for the individual parameter were rated and found to be less than 4.50 out of 5.00. Among the mean scores, the maximum score was given for the parameter “The care that the pharmacy professional takes while supplying your medicines” (4.06), while the parameter rated the lowest score was “The amount of time you spend waiting for your prescription to be filled” (2.73). Among the participants of the study, only 1% rated all satisfaction parameters as “very high (5.00).” The overall mean score of all parameters was 3.47 out 5.00. Of the total of 384 respondents, 52.60% were satisfied (mean score ≥2.50) and 47.40% were unsatisfied (mean score <2.50) with services provided by pharmacy professionals (Table S3).
Bivariate logistic regression output to identify factors associated with satisfaction level showed that level of education and reason for seeking services were significantly associated with clients’ satisfaction. Accordingly, illiterate clients in comparison to college-educated ones (p=0.002, COR =0.30) and patients who sought service for any other reason other than cardiovascular disorder (p=0.016, COR =0.38) showed poor satisfaction (Table 3).
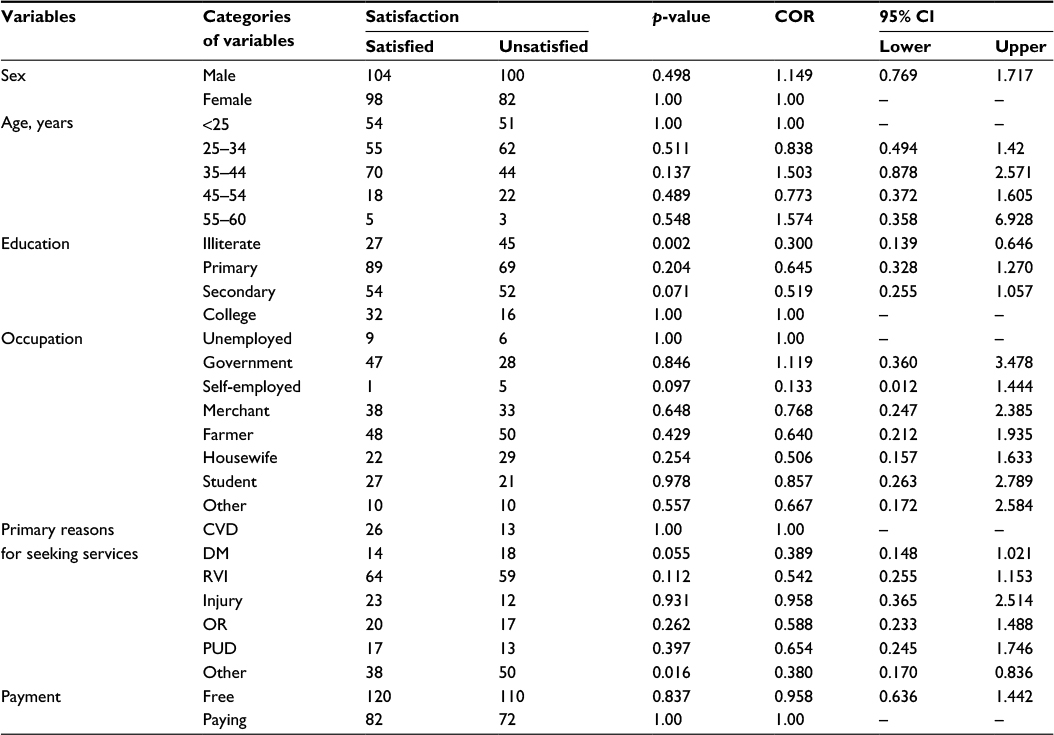 | Table 3 Factors associated with satisfaction of clients on pharmaceutical services (N=384), MTUTH, March 2016 Abbreviations: COR, crude odd ratio; CVD, cardiovascular disease; DM, diabetes mellitus; RVI, retroviral infection; PUD, peptic ulcer disease; OR, operation room; CI, confidence interval; MTUTH, Mizan-Tepi University Teaching Hospital. |
On multivariable logistic regression, age, level of education, occupation, and the disease for which service was sought remained statistically significant. Age 25–34 years was an independent predictor of high satisfaction (p=0.041, AOR =1.94), while illiteracy (p=0.031, AOR =0.33), self-employment (p=0.036, AOR =0.072), and diabetes mellitus (p=0.032, AOR =0.33) were predictors of poor satisfaction (Table S4).
Discussion
Our study revealed that the perception of clients toward services provided by pharmacy professionals was nearly 64%, while only 52.6% of respondents were satisfied with pharmaceutical services. The factors that influenced clients’ perception and satisfaction included level of education of respondents, occupation, primary medical condition for seeking service, and payment status to get services.
In the study of clients’ perception toward pharmacy services, almost 64% of respondents rated hospital pharmacy service above the neutral point, and it was comparable with study in Nigeria (60%).14 In this study, 64% of the respondents had good perception toward pharmacy services, which is inconsistent with previous studies (Nigeria, 84%8 and Ghana, 75%16), which can partly be attributed to sociocultural difference of participants and type of participants, as only inpatients were included in the Nigerian study.
The proportion of respondents who were satisfied with pharmaceutical service provided in this study was only 52.6%, which is almost similar to the study conducted at Wolaita Sodo University Teaching Hospital, 54.2%11 but lower than reported from Arba Minch University.12 Despite these studies conducted in the same country, satisfaction level varied since it is multidimensional by its nature, and so it can be influenced by a number of factors like culture, socioeconomic, and demographic factors, clients’ expectation, and quality of service provided. All of the aforementioned factors vary from one institution to another.
In this study, illiterate respondents (p=0.000) and those with primary (p=0.011) and secondary education (p=0.031) had good perception in comparison with respondents of higher education, which was also observed in the study conducted in a Ghanaian hospital (p=0.018).16 It seems paradoxical that those who were more educated had negative perception to pharmaceutical service. This perception is actually due to the underestimation of the dispensing role of pharmacy professionals, where majority of pharmacy professionals in the country are still working in this area. Educated people perceived that dispensing is a simple activity that might even be carried out by nonpharmacy professionals. This kind of thought can significantly affect the perception toward overall services of pharmacy professionals. In addition, clients who sought ART-related services had good perception toward pharmacy services (p=0.001). Such groups of clients take medication for a long period of time and have frequent contact with professionals, which help them to develop awareness about how important pharmacy services are. Besides this, ART services are given free of charge, which also promotes positive perception since service charge is one of the factors that is associated with negative perception (p=0.028).
Despite positive perception of illiterate clients, their satisfaction was low (p=0.002). Illiterate individuals need more time for clarification of instructions on how to take medications and need more information with any aspect of their medications. However, pharmacy professionals are too busy in the hospital, and so in-depth counseling of clients might be difficult, which in turn affects satisfaction.
Limitations
The main limitation of this study was that it was cross sectional in nature, and so it is difficult to see the prevailing problems at a given point of time. The other limitation was that it was a single-center study, so extrapolation should be made cautiously.
Conclusion
This study showed that the overall mean perception and satisfaction of clients in the hospital were low. It also showed that there was statistically crude association between perception and different factors including educational level, occupation, reason to seek pharmaceutical service, and service charge. Being illiterate and seeking ART were independent predictors of client perception. Satisfaction was significantly associated only with reason to seek the service and educational level.
Author contributions
All authors contributed toward data analysis, drafting and critically revising the paper and agree to be accountable for all aspects of the work.
Acknowledgments
We thank patients and their caregivers in MTUTH for their indispensable cooperation during acquisition of data. We also thank Mizan-Tepi University for providing stationary materials for doing this research.
Disclosure
The authors report no conflicts of interests in this work.
References
Merlin NJ. Pharmacy careers – an overview. Asian J Res Pharm Sci. 2011;1:1–3. | ||
Smith M, Bates DW, Bodenheimer T, et al. Why pharmacists belong in the medical home. Health Aff. 2010;29:906–913. | ||
Hussen DA, Alemu HM, Mohammednur MM, et al. Pharmacy practice in view of health professionals in Jimma University specialized hospital. IJPSR. 2012;3(2):576–582. | ||
Federal Democratic Republic of Ethiopia, Ministry of Health. Ethiopian Hospitals Reform Implementation Guidelines. Ethiopian hospital management initiative. 2010;1(1). | ||
Surur AS, Teni FS, Girmay G, et al. Satisfaction of clients with the service of an outpatient pharmacy at University hospital in northwestern Ethiopia: a cross-sectional study. BMC Health Serv Res. 2015; | ||
Erah OP, Chuks-Eboka NA. Patients’ perception of the benefits of pharmaceutical care services in the management of hypertension in a tertiary health care facility in Benin City. Trop J Pharm Res. 2008;7(1): | ||
You JH, Wong FY, Chan FW, et al. Public perception on the role of community pharmacists in self-medication and self-care in Hong Kong. BMC Clin Pharmacol. 2011;11:19. | ||
Igbanugo JS, Dabi SI, Abah OI. Perception of pharmaceutical care roles of pharmacists among in-patients in a tertiary care facility in Jos City, Nigeria. Br J Pharm Res. 2014;4(11):1332–1340. | ||
Eshetu E, Gedif T. Quality of Pharmaceutical Care in Government Hospitals of Addis Ababa, Ethiopia [master’s thesis]. Ethiopia: Addis Ababa University; 2010. | ||
Fekadu A, Andualem M, Yohannes H. Assessment of clients’ satisfaction with health service delivery service delivery at Jimma University Specialized Hospital. Ethiop J Health Sci. 2011;21(2):101–109. | ||
Sagaro GG, Yalew AW, Koyira MM. Patients’ satisfaction and associated factors among outpatient department at Wolaita Sodo University Teaching Hospital, Southern Ethiopia: a cross sectional study. Sci J Clin Med. 2015;4(5):109–116. | ||
Srinivasan K, Saravanan S. Delivery of public health care services: assessing customer satisfaction using servqual approach. IJAIEM. 2015;4(7):6–14 | ||
Waitzman J, Hiller DP, Marciniak MW, et al. Assessment of patient perceptions concerning a community pharmacy-based warfarin monitoring service. Innov Pharm. 2012;3(1):1–10. | ||
Ofili AN, Ofovwe CE. Patients’ assessment of efficiency of services at a teaching hospital in a developing country. Ann Afr Med. 2005;4(4):150–153. | ||
Wilbur K, El Salam S, Mohammedi E. Patient perceptions of pharmacist roles in guiding self-medication of over-the-counter therapy in Qatar. Patient Prefer Adher. 2010;4:87–93. | ||
Ankrah DNA, Ofei-Palme CN, Nordor M, et al. Patient perception and expectation of service provided by pharmacists in Ghanaian hospitals. Afr J Pharm Pharmacol. 2014;8(46):1164–1172. | ||
Jose J, Al Shukili MN, Jimmy B. Public’s perception and satisfaction on the roles and services provided by pharmacists – cross-sectional survey in Sultanate of Oman. Saudi Pharm J. 2015;23:635–641. |
Supplementary material
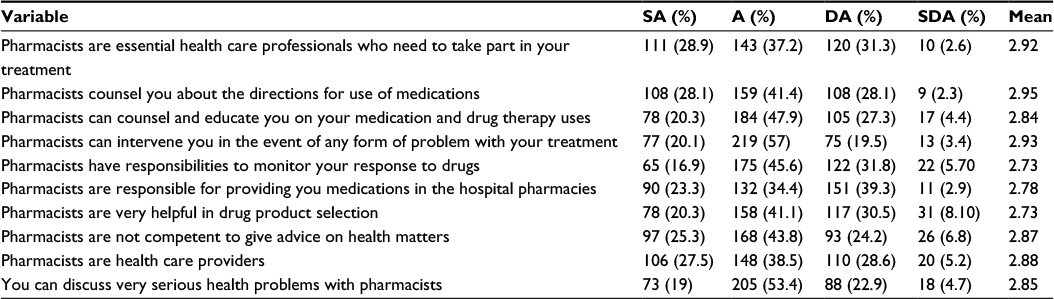 | Table S1 The proportion and mean score of respondents for each parameters used to assess perception toward pharmaceutical services, MTUTH, March 2016 Abbreviations: SA, strongly agree; A, agree; DA, disagree; SDA, strongly disagree; MTUTH, Mizan-Tepi University Teaching Hospital. |
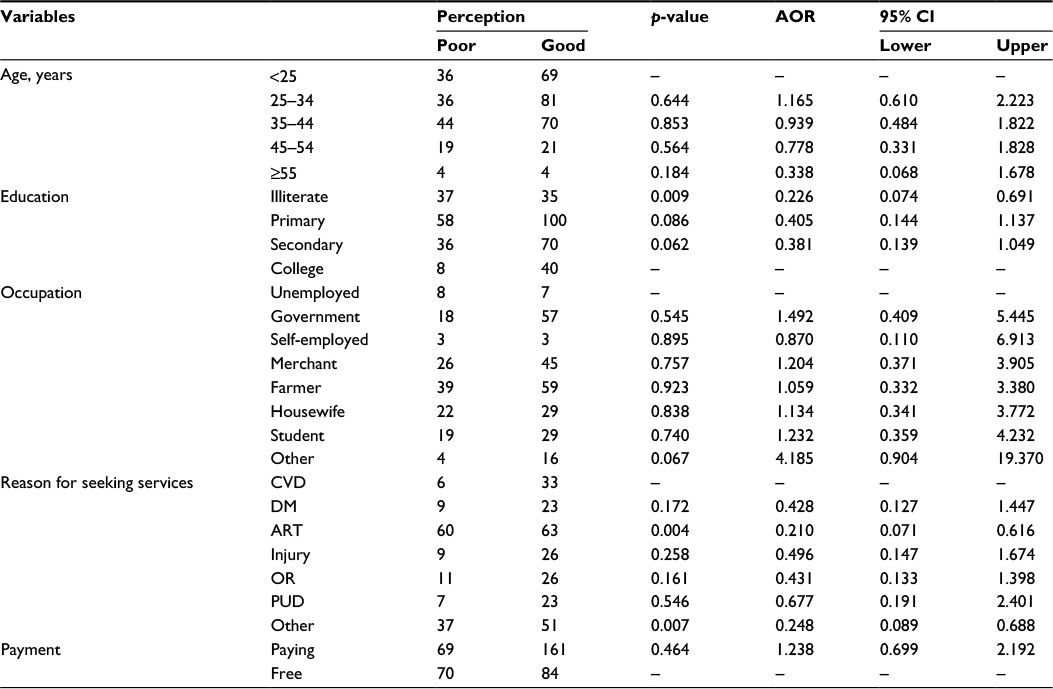 | Table S2 Multivariable output for determinants of clients’ perception, MTUTH, March 2016 Abbreviations: AOR, adjusted odd ratio; CVD, cardiovascular disease; DM, diabetes mellitus; PUD, peptic ulcer disease; OR, operation room; CI, confidence interval; MTUTH, Mizan-Tepi University Teaching Hospital; –, no data. |
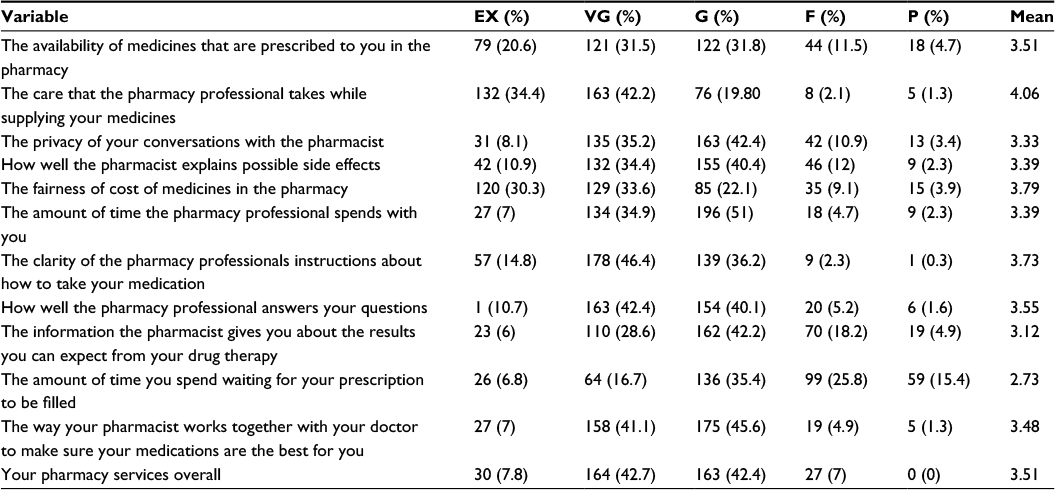 | Table S3 The proportion and mean of satisfaction score of respondents for each parameter used to assess satisfaction with the pharmaceutical services, MTUTH, March 2016 Abbreviations: EX, excellent; VG, very good; G, good; F, fair; P, poor; MTUTH, Mizan-Tepi University Teaching Hospital. |
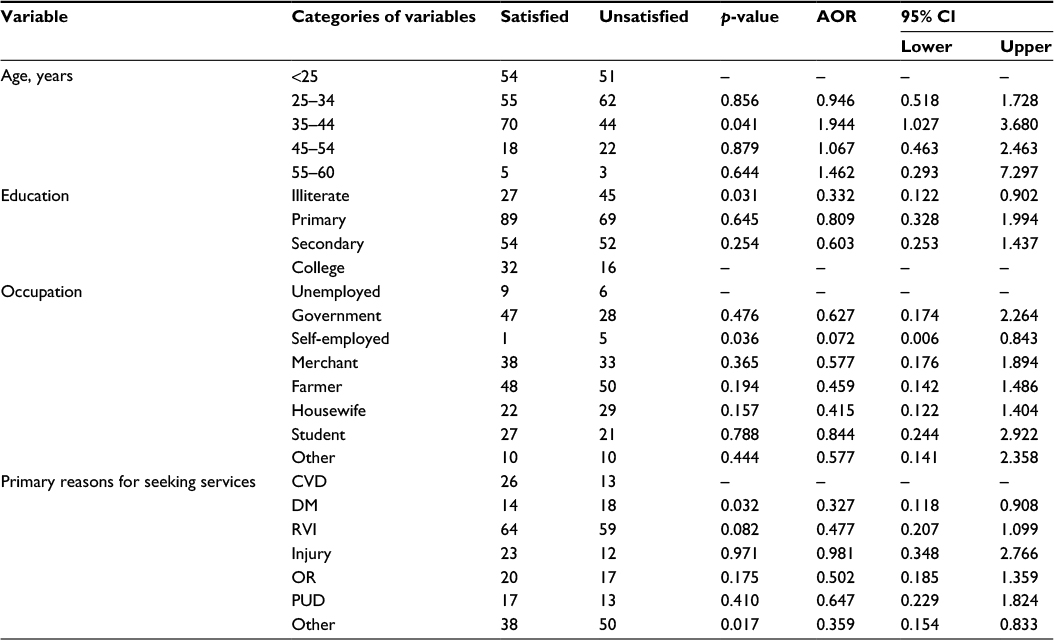 | Table S4 Multivariable output for determinants of clients’ satisfaction, MTUTH, March 2016 Abbreviations: AOR, adjusted odd ratio; CVD, cardiovascular disease; DM, diabetes mellitus; RVI, retroviral infection; PUD, peptic ulcer disease; OR, operation room; CI, confidence interval; MTUTH, Mizan-Tepi University Teaching Hospital; –, no data. |
 © 2016 The Author(s). This work is published and licensed by Dove Medical Press Limited. The full terms of this license are available at https://www.dovepress.com/terms.php and incorporate the Creative Commons Attribution - Non Commercial (unported, v3.0) License.
By accessing the work you hereby accept the Terms. Non-commercial uses of the work are permitted without any further permission from Dove Medical Press Limited, provided the work is properly attributed. For permission for commercial use of this work, please see paragraphs 4.2 and 5 of our Terms.
© 2016 The Author(s). This work is published and licensed by Dove Medical Press Limited. The full terms of this license are available at https://www.dovepress.com/terms.php and incorporate the Creative Commons Attribution - Non Commercial (unported, v3.0) License.
By accessing the work you hereby accept the Terms. Non-commercial uses of the work are permitted without any further permission from Dove Medical Press Limited, provided the work is properly attributed. For permission for commercial use of this work, please see paragraphs 4.2 and 5 of our Terms.