")
Back to Journals » Journal of Pain Research » Volume 12
Classifying patients with lumbar disc herniation and exploring the most effective risk factors for this disease
Authors Jafari S , Dehesh T , Iranmanesh F
Received 6 October 2018
Accepted for publication 18 February 2019
Published 15 April 2019 Volume 2019:12 Pages 1179—1187
DOI https://doi.org/10.2147/JPR.S189927
Checked for plagiarism Yes
Review by Single anonymous peer review
Peer reviewer comments 3
Editor who approved publication: Professor E Alfonso Romero-Sandoval
Samira Jafari,1 Tania Dehesh,2 Farhad Iranmanesh3
1Modeling in Health Research Center, Institute for Futures Studies in Health, Kerman University of Medical Sciences, Kerman, Iran; 2Department of Biostatistics and Epidemiology, School of Public Health, Kerman University of Medical Sciences, Kerman, Iran; 3Department of Neurology, Kerman University of Medical Sciences, Kerman, Iran
Objectives: To classify patients suffering from low back pain (LBP) into two different groups – patients with lumbar disc herniation (LDH) and patients without this disease based on simple questions and without magnetic resonance imaging (MRI) procedure – and to diagnose the most effective risk factors of LDH.
Methods: Four hundred patients aged over 18 years suffering from LBP for over 6 months were randomized into two groups in this cross-sectional study. The data were gathered at Besat clinic, in Kerman, southeast of Iran. Twelve dichotomous questions from the main LDH risk factors were asked. Three statistical classification methods – K-nearest neighbors (KNN), support vector machine (SVM), and logistic regression (LR) – were performed. LR was used in order to diagnose the most important risk factors of LDH.
Results: SVM method was more efficient among the small sample sizes, while KNN method showed the best classification relative to other methods when the sample size increased. LR model had the least efficiency of all. The drug use increased the chance of LDH more than 7 times (OR=7.249), and the chance of having LDH among people who had associated illness was 4.847 times more compared with people who did not have. Using hookah increased the chance of having LDH more than twice (OR=2.401), and the chance of smokers for LDH was near four times higher than nonsmokers (OR=3.877).
Conclusion: The statistical classification methods had acceptable precisions for diagnosis of LDH patients. It is suggested that neurologists become more familiar with these methods and use them before MRI prescription to decrease the unnecessary burden on health services. Addiction to drugs, cigarettes, and hookah is the main factor in the creation of a lumbar disc herniation.
Keywords: classification, K nearest neighbors, support vector machine, logistic regression, lumbar disc herniation
Introduction
One of the common chronic disorders that have increased in recent decades is low back pain (LBP).1 There is no exact agreement about the definition of LBP in most literature.2 This disease can vary from a permanent ache to a sudden severe pain in the patients’ back.3 This disorder can be classified depending on the duration of the pain. The chronic LBP lasts between 6 and 12 months.4 The reported complications of LBP are excessive. In some cases, it causes severe pain that brings motionlessness and weakness that lowers the quality of life.5 This disease disrupts the daily activities of more than 80% of the people around the world.6 It is reported that annual prevalence of this disease is between 15% and 45%, and it involves an average of 30% of the people.7
Often, all people have experienced LBP between the ages of 30 and 50.8 One of the most prevalent reasons of LBP is lumbar disc herniation (LDH) which is a musculoskeletal disease.4 The most important and effective causes of LDH are genetic, biochemical, traumatic, and psychosocial. In most cases, this disease is inherited from parents to children.9 The usual procedure for diagnosing LDH is labeling the hernia discs by magnetic resonance imaging (MRI).6 MRI is a medical procedure that is often used in the assessment of people with spinal problems. This procedure has huge budget burden on patients and health-care services.10
The increased prevalence of LBP creates an economic burden on society and health services because usually all the patients with backache are referred to an MRI center by the physicians.
Despite incredible benefits of MRI in diagnosing the main cause of LBP such as spinal discs, ligaments, vertebral bodies, vascular structures, muscle tissues, disc degeneration, and lumbar spinal canal stenosis,11 it may be possible to diagnose the back pain patients due to LDH in the early stages with other procedures rather than MRI.
Many of the patients with LBP need conservative treatments first, and MRI diagnostic procedure could be the next step if the pain worsens. The classification methods have old history in statistics which are used in classifying the observations in similar classes. LR classic classification method has simple interpretations but not in complicated data.12
Recently, machine learning methods, which diagnose the existing classes automatically, were introduced to the classification fields.13 The most frequently used methods in machine learning that classify observations are KNN and SVM.14
Despite traditional classification method, LR, the machine learning methods are relaxed from linearity combination of predictor variables in order to find the best decision boundary. Logistic regression (LR) focuses on maximizing the likelihood ratio function in order to have the best coefficients and also prediction. SVM tries to find the separating hyperplane which has the biggest distance to the closest points (the support vectors). If the cases could not be separated by linear function, this procedure could project the cases to higher dimensions with kernel functions and separate them perfectly. KNN method also classifies cases based on distances, not likelihood function. In fact, this procedure is free from probability density function for outcome.15 SVM and KNN are called the newest classification methods and LR is the most famous one.16 Many of these classification methods can classify patients into two groups with high precision. The performances of these classification methods are based on simple information provided by asking simple questions from the patients without incurring any cost.
Using classification methods in statistics, physicians can avoid sending people who have backache for an MRI unnecessarily, and for those patients who do not belong to the LDH group, remedies can be prescribed first. Therefore, the patients can be protected from the stress of MRI, as well as the unnecessary financial burden. This important goal needs the cooperation of biostatistics experts and physicians. Actually, different scientific fields must help each other in order to have better services in the society.
A study conducted by Pedro J. García-Laencina et al in 2015 assessed and predicted breast cancer in women. In this study, KNN and LR were used according to the specificity (SP) and concluded that the KNN model was more efficient than LR.17 In another study conducted by Eun-Suk Yang et al, KNN and LR have been used to assess the best combination for ovarian cancer. In the present study, according to the values of receiver operating characteristic (ROC) curve, LR was recognized as the best model for the classification of individuals.18 Chia-Hsun Hsieh et al assessed cancer screening in an asymptomatic population using multiple tumor markers. His results also indicated superiority of SVM over KNN and LR methods.19
The present study aims to compare classification methods (LR, KNN, and SVM) to classify patients with backache into two groups – patients with LDH and patients without LDH with high precision – and to explore and diagnose the most effective risk factors of LDH based on LR.
Methods
Data collection and preparation
The data of this cross-sectional study were collected from June to September 2017 at Besat clinic which is the main clinic for lumbar disorders in the center of Kerman, southeast of Iran. Eligible patients were 252 women and 148 men aged over 18 years suffering from LBP for at least 6 months. Also, they complained of severe pain in their low back that disabled them in routine activities such as walking, sitting, and standing. These patients were referred to the MRI center of Besat clinic by the neurologists to investigate the main cause of their severe back pain. Exclusion criteria were lack of understanding Persian language and any kind of back surgery within the last 4 months.
The data were divided into two parts, which are called train and test sets. Three models were built with train set and then their classification efficiency was checked on test set. In fact, the test set did not have any role in building the models.
Each of the train and test tests was composed of 200 samples. The models were made based on training data, and then were implemented on the testing data for checking their efficiency better. In this study, the main variables, which were the most effective risk factors for LDH, were collected through a checklist. This checklist, which was developed under the guidance of a neurologist, consisted of 12 questions. The questions are indicated in Table 1. The history of associated illnesses such as diabetes, kidney stones, hypertension, and underlying diseases such as the elongation of the ligaments or muscles of the lower back musculoskeletal system and low back arthritis20,21 were also recorded as Yes or No.
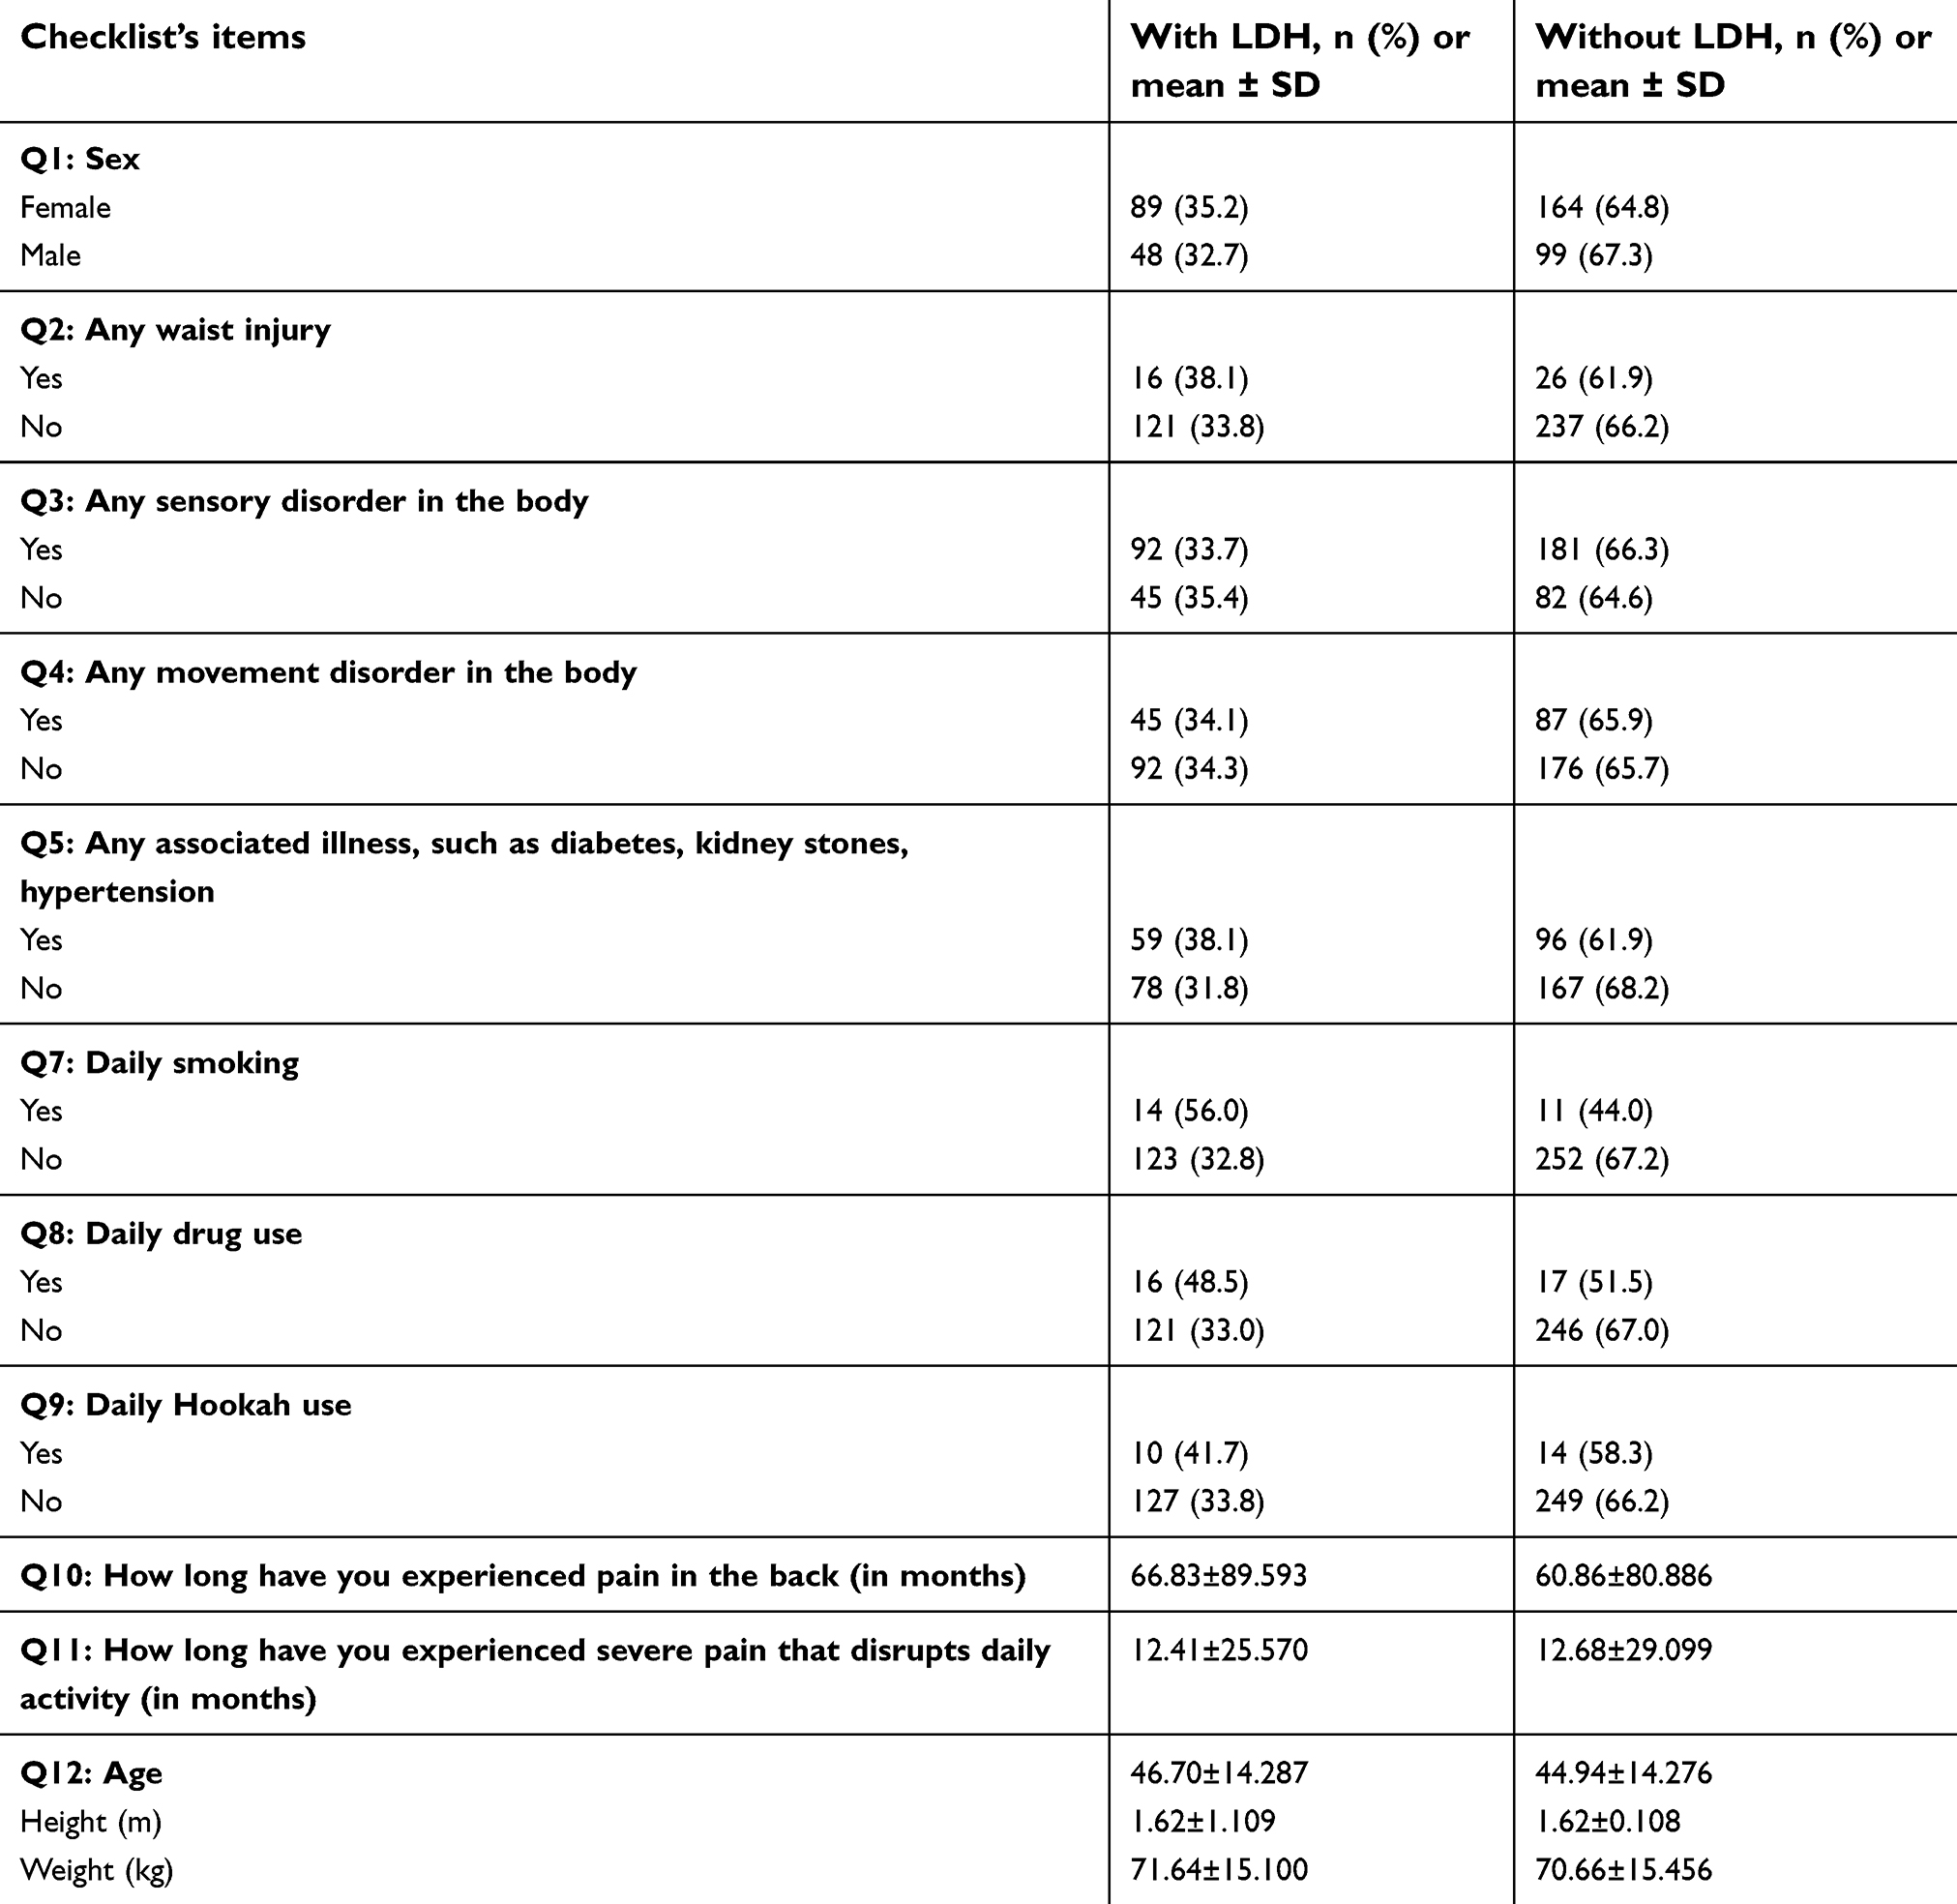 | Table 1 The list of 12 simple questions (Q) |
The interviewing team was trained by the neurologist about the concept of checklist’s questions before dispatching them to the clinic. The participants completed the written informed consent form prior to enrollment in the study. The study was approved by the ethical committee of our institution Kerman University of Medical Sciences (reference code: IR.KMU.REC.1397.078). The study was conducted in compliance with the Helsinki Declaration. The result of the outcome variable was being diagnosed after observing the result of MRI by the neurologist in the form of having lumber disc/not having lumber disc.
KNN method
K-nearest neighbors (KNN) method represents one of the simplest algorithms of the learning machine where we have no model and estimation of parameters. In the KNN method, the distances between all observations (patients, in our study) are calculated and the nearest observations construct a group. Therefore, observations are classified into K similar classes based on the distances between them. After building the classes based on distances, the new observation (new patient), which does not have any role in previous classification, is classified to the nearest class.
SVMs method
The SVMs were introduced by Vapnik et al (1990) for the first time as a family of machine-learning methods. The aim of SVMs is to separate observations by a line (two dimensions) or by a plan (more than two dimensions) in a complicated problem.22
Essentially, SVMs are looking for the best separating line between the classes.23
LR method
The LR is a traditional statistical technique for classification. The same as the previous two methods, its outcome is a dichotomous variable. The method is a kind of regression method which needs a link function.24 The explanatory (independent) variables may be continuous, discrete, or combined.24
Classifying the training data with three classification methods was done with R software version (3.4.4), packages caret, and e1071. R software is free and also the most used, especially when program writing is needed. The models were examined with the testing data, and the best models are introduced based on four classification critera. These diagnosis criteria are sensitivity (SE), SP, correct classification rate (CCR), and kappa coefficient (KC).
SE evaluates the validity of the test in detecting the real patient. SP estimates the number of healthy patients that must be excluded. CCR measures how correctly a diagnostic test identifies and rules out a certain condition. CCR of a diagnostic test can be determined from SE and SP with the prevalence.25 The model with the highest value of SE, CCR, and KC and the lowest value of SP is identified as the best classification model.
SE, SP, and CCR are described in terms of TP, TN, FN, and FP.


The homogeneity of training and testing groups based on demographic variable were tested by Chi-square test and independent samples T test. To explore the effect of sample size on the efficiency of three models, the above classification models were performed in different sample sizes (50, 100, 150, and 200). LR model was used for diagnosing the most effective risk factors of LDH. The odds ratio (OR) index was used to reflect the rate of risk factor effects.
Results
Table 2 describes the demographic characteristics of all the patients in the present study. As depicted, 36.8% were male and 63.2% female. Also, 137 out of 400 (34.2%) patients that were referred to the neurologist had herniated discs according to MRI results. The mean (±SD) age of the patients was 45 years. It showed that people who suffered from LBP were middle-aged and their mean value of BMI was in the normal range.
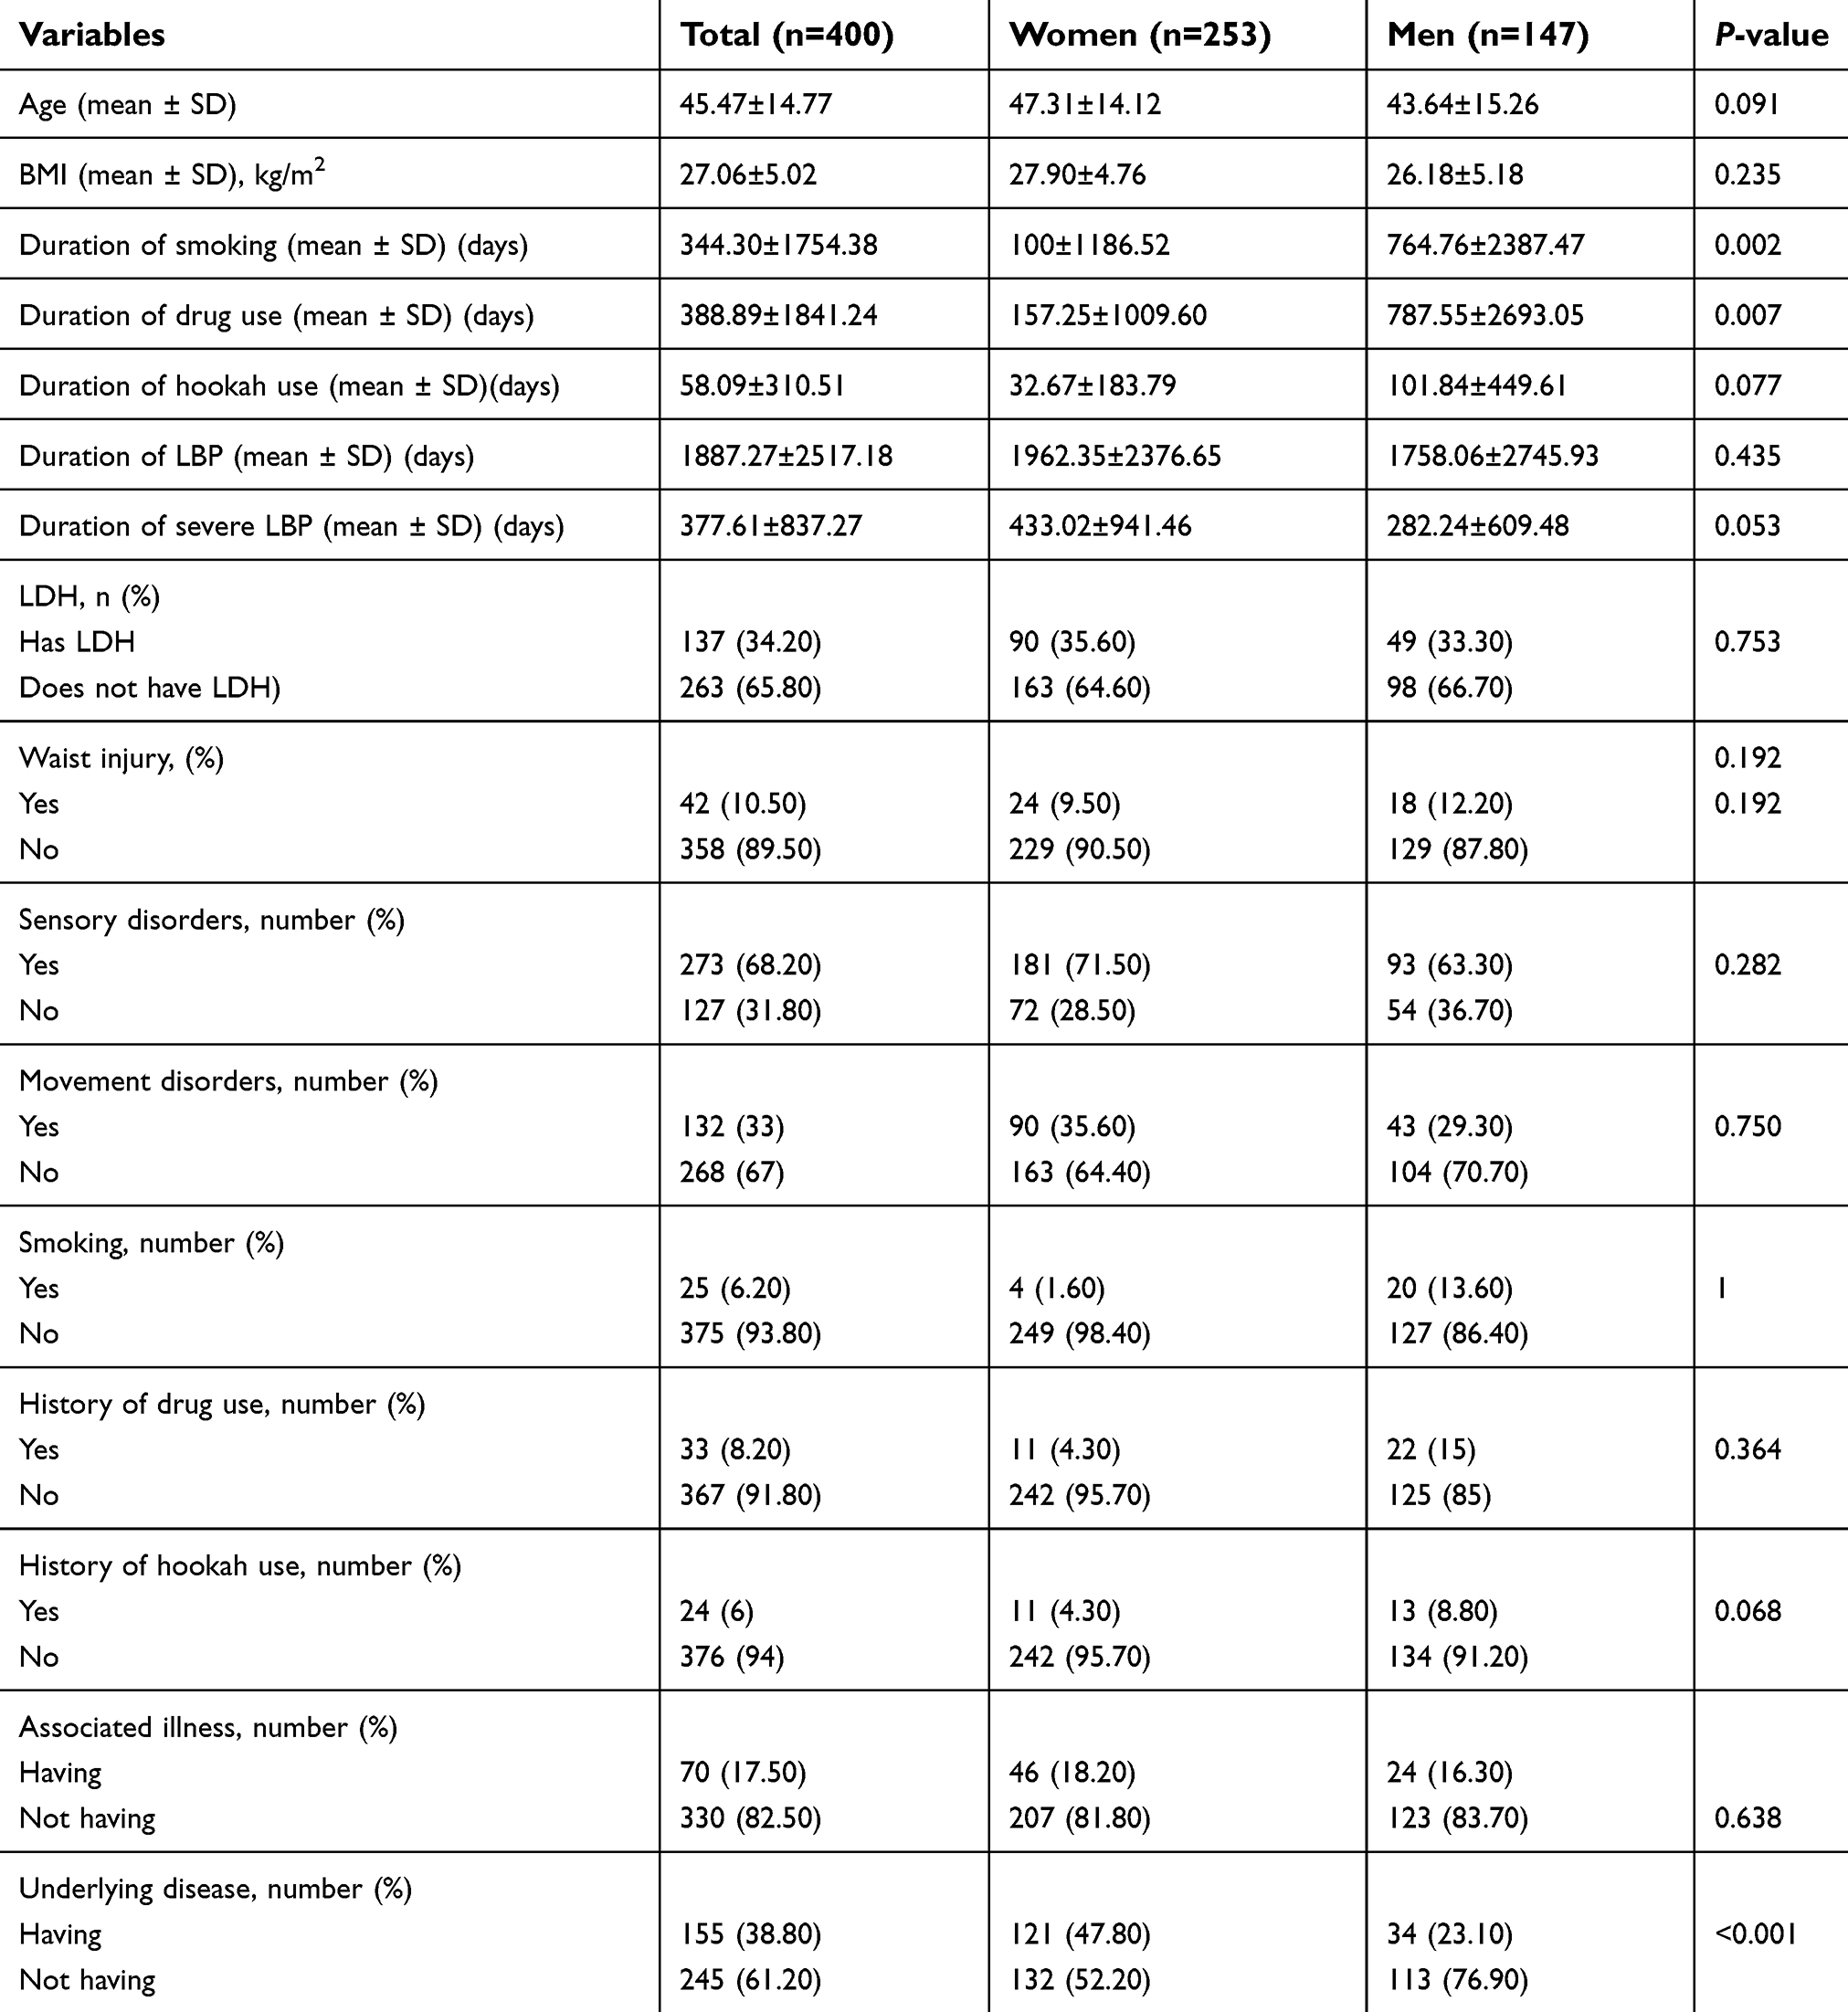 | Table 2 Subject characteristics based on sex |
As observed, the majority of LBP patients were women (n=253, 63.2%) in proportion to men (n=147, 36.8%), but the number of herniated discs between them was not statistically significant (P=0.753). The main cause of LBP in patients was not a hit to the back (89.5%). Most patients had a sensory disorder (89.5%), but not any movement disorder (33%). Against the neurologist’s expectation, the prevalence of cigarettes (6.2%) and drug addiction among patients was low (8.2%). These results exhibited that the main reason of LBP in most patients was not the usual reasons that were categorized in the checklist as the main factors by neurologist. Comparing the two patient groups (train and test), there were no statistically significant differences in all demographic variables. This result demonstrates the homogeneity of two groups according to demographic variables.
The result of this table also shows that there is no statistically significant difference between women and men in terms of demographic and diagnostic LDH variables, except for the duration of drug, cigarettes, and hookah use. Men used all of them significantly longer than women. Women had significantly higher levels of LDH than men (P<0.001).
Table 3 shows the results of comparing four criteria (SE, SP, KC, and CCR) in different sample sizes (50, 100, 150, and 200) between three classification methods. As explained in the method section, for best classification, SE, KC and CCR values must be high and SP value must be low. So, in general, the SVM model is useful in classifying low sample size and as the sample size increases, the efficiency of KNN model increases. Also, according to the four criteria, LR model had the least efficiency in all the sample sizes. The comparison of three models with four criteria in different sample sizes is shown for more clarification (Figure 1).
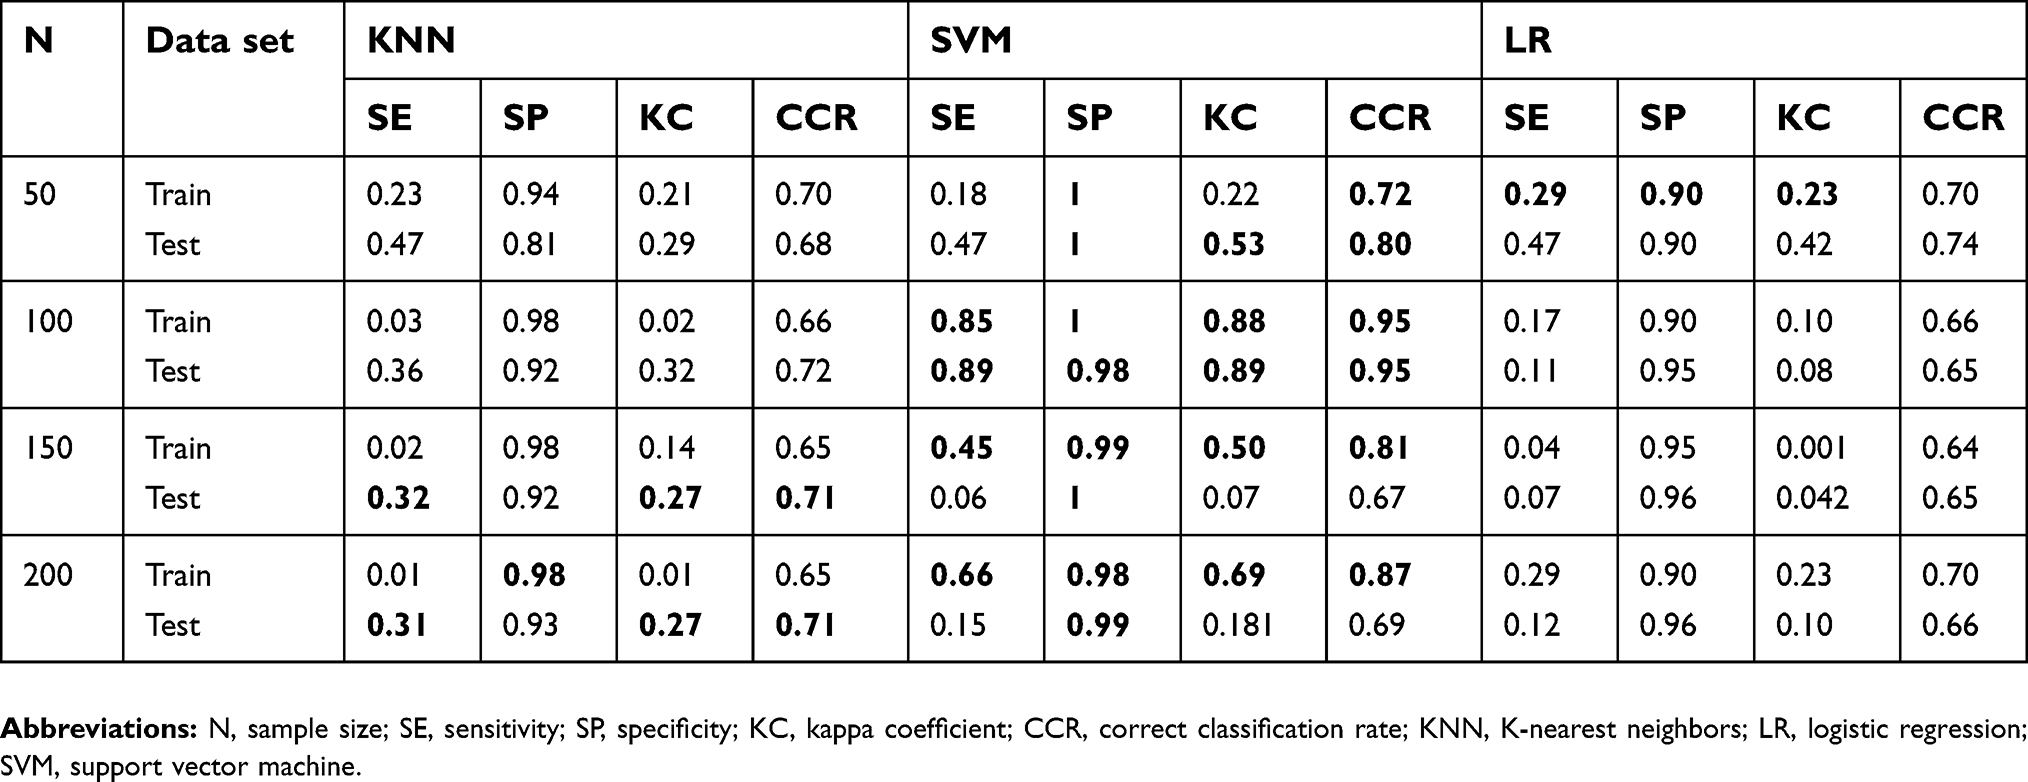 | Table 3 The results of comparing KNN, SVM, and LR in different sample sizes |
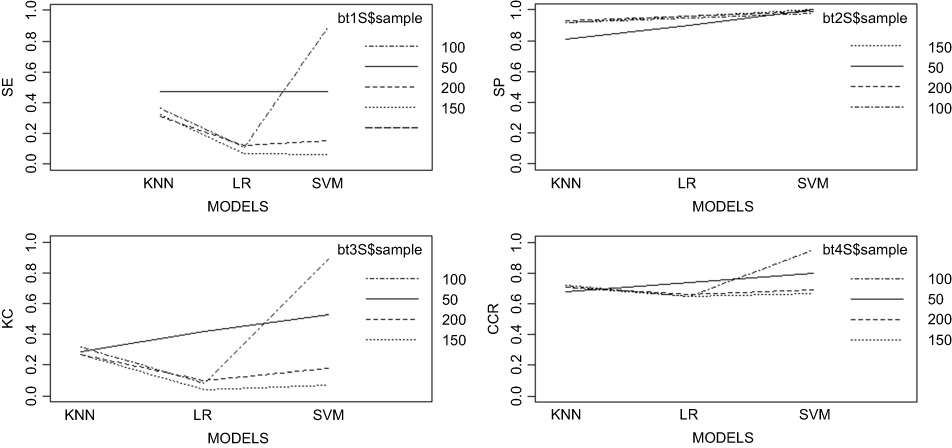 | Figure 1 The comparison of three models with four criteria in different sample sizes.Abbreviations: SE, sensitivity; SP, specificity; KC, kappa coefficient; CCR, correct classification rate; KNN, K-nearest neighbors; LR, logistic regression; SVM, support vector machine. |
Table 4 shows the results of LR model. According to the values of OR, the most effective risk factors of LDH are the use of drug, associated illness of LDH, use of hookah, and cigarettes, respectively. The use of drug increased the chance of LDH more than 7 times (OR=7.249) and the chance of having LDH in people who have associated illness 4.847 times comparing with people who do not have. Using hookah increased the chance of having LDH more than twice (OR=2.401) and the chance of smoker for LDH is near four times higher than nonsmokers (OR=3.877). The chance of women was near 1.5 times more than men for LDH (OR=1.38) and the sensory disorder in the back increased the chance of LDH (OR=1.5). Other risks factors did not significantly affect the development of LDH.
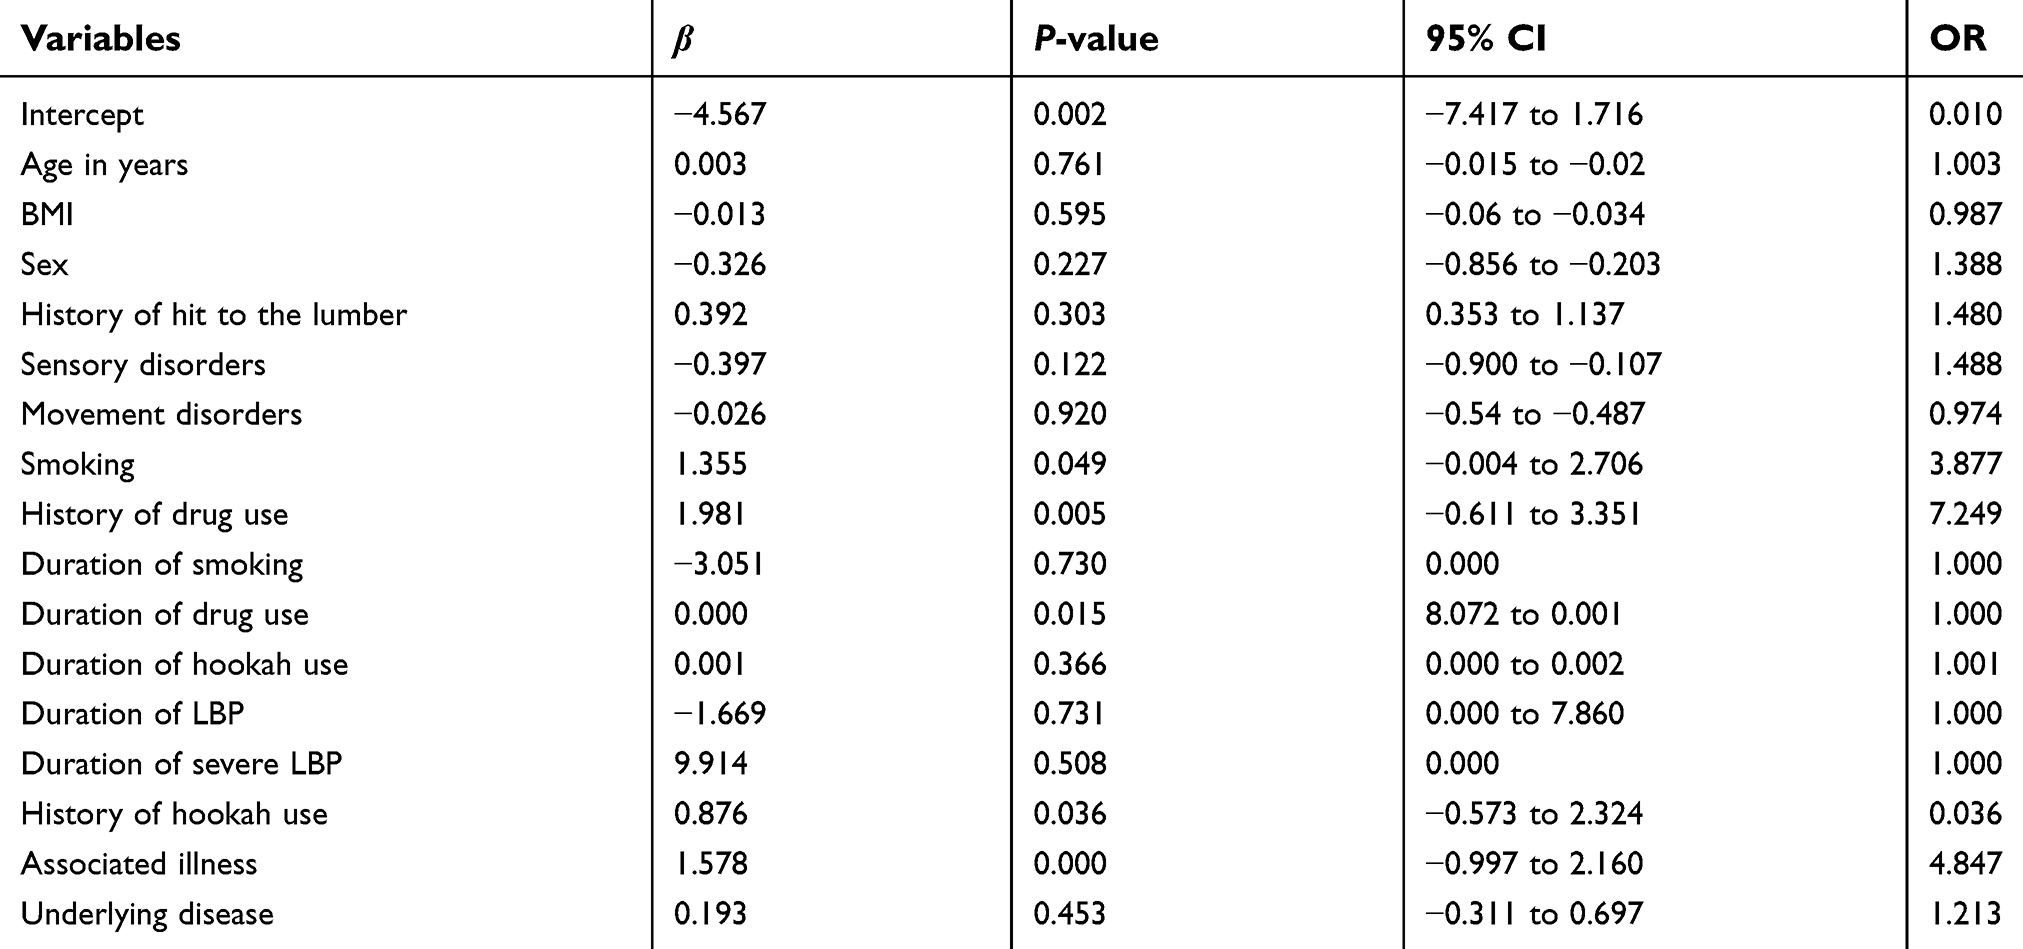 | Table 4 The effects of risk factors on LDH |
Discussion
The results of the present study provide a perspective for researchers who want to use simpler statistical diagnostic methods before clinical diagnostic. The present results revealed that basic sciences could have an important role in clinical diagnostic which has been rarely mentioned in the previous studies. In this study, the results of three statistical classification methods KNN, SVM, and LR were compared with the results of MRI in diagnosing patients with herniated discs to determine whether they could be used as the former step of clinical methods to avoid the burden of stress and expense on the patients. For this comparison, simple questions have been asked from the patients in the first step of diagnosis. Since this is the first study appraising these three classification methods with dichotomous questions to diagnose patients with herniated disks, there were no directly comparable studies in this context. Most of the previous studies compared classification methods with qualitative questions. Four criteria which are SE, SP, KC, and CCR in four different sample sizes were used to compare. For small sample sizes (50, 100), the SVM models had better classification based on the four criteria, and the KNN model displayed the best classification for larger sample sizes (150, 200). These results depict that SVM model classifies observations better than other methods, especially in small sample sizes. This may be due to the fact that in small sample sizes with dichotomous questions the information gained is little. Since the SVM model does not pay attention to the distribution of data and works based on constructing a high-dimensional plan between observations, these results are in accordance with actual expectations. In contrast, the KNN model is made based on distances between observations, and calculating the distances with quantitative values is simpler relative to dichotomous data. The present results are also in accordance with those of the previous works, such as those noted in the study by Wu Yunfeng in 2016 about knee vibration quantum. In the present study, the comparison is between SVM and LR, and SVM model was chosen in competition with LR.26 LR method is a completely parametric method that displays the best result in follow-up studies, but KNN method is not a parametric method, and it is conducted based on distances between observations. Therefore, when the number of predictors becomes more, KNN procedure shows better results.
The present researchers’ findings reveal that sample size has the most influence on the efficiency of KNN compared with the other two methods. Another important finding is that addiction increases the chance of LDH, especially use of drugs, hookah, and cigarettes. These findings are completely in accordance with the previous study.27 The chance of having LDH for people who have sensory disorder and also women is higher than in others. They should be more careful about their back. This result also approves previous results.28
An important strength of the present study is that the predictor variables are made up of the simplest possible questions and the physician collects the information without any measurements. The researchers tried to depict the precision of statistical models in proportion to the clinical method (MRI) in the correct diagnosis of patients. Hence, if there is only one computer system with statistical programs in the doctor’s office s/he can ask patients suffering from LBP the simplest questions and enter their information into the system. If the patient is classified in the group of LDH patients, then the neurologist could refer the patients to MRI for definitive diagnosis. Finally, most studies agree with the present results. Small differences exist because of the differences between type and number of predictors. Therefore, offering methods which could diagnose patients without any measurement is valuable. An important strength of the present study is that today, basic sciences like biostatistics and medicine must cooperate to avoid the burden of many emotional and financial costs on patients. Separating different scientific branches is completely wrong when they could be complementary. The present study had some limitations that merit attention when interpreting the findings. First of all, most of the 12 questions in the checklist were based on one neurologist experiences and also neurology text. In fact, there are other valuable questions that could be taken into account in this study. Maybe other neurologists have useful experiences. Furthermore, diagnosis of LDH was done by one neurologist who could diagnose incorrectly. It could be better to have other neurologists’ cooperation in order to prevent incorrect diagnosis. Planning to compare these three models with a variety of questions and cooperation of more than one neurologist in order to demonstrate the efficiency of models is necessary.
Conclusion
To the best of the present researchers’ knowledge, this study was one of the first ones that compared classification methods when the majority of predictors are binomial. This study confirms the precision of statistical methods in classifying patients which is near MRI results. Hence using them could prevent unnecessary MRI, especially in the first stage of the disease. Since the mean age of our patients’ population is not high, we could emphasize that different types of addiction were the main cause of LDH in young people.
Disclosure
The authors report no conflicts of interest in this work.
References
1. Vivas ELA, Oliva FJC, Aguilar RQF, González AG, Cruz JG, Ávila JMJ. Application of a semiautomatic classifier for modic and disk hernia changes in magnetic resonance. Coluna/Columna. 2015;14(1):18–22. doi:10.1590/S1808-1851201514010R121
2. Andersson GB. Epidemiological features of chronic low-back pain. Lancet. 1999;354(9178):581–585. doi:10.1016/S0140-6736(99)01312-4
3. Sheet. National Institute of Neurological Disorders and Stroke, National Institutes of Health; updated February 2011. Available from:
4. Mio F, Chiba K, Hirose Y, et al. A functional polymorphism in COL11A1, which encodes the α1 chain of type XI collagen, is associated with susceptibility to lumbar disc herniation. Am J Hum Genet. 2007;81(6):1271–1277. doi:10.1086/522377
5. Buchmann N, Preuß A, Gempt J, et al. Outcome after surgical treatment for late recurrent lumbar disc herniations in standard open microsurgery. World Neurosurg. 2016;89:382–386. doi:10.1016/j.wneu.2016.02.028
6. Ghosh S, Chaudhary V. Supervised methods for detection and segmentation of tissues in clinical lumbar MRI. Comput Med Imaging Graph. 2014;38(7):639–649. doi:10.1016/j.compmedimag.2014.03.005
7. Takahashi M, Haro H, Wakabayashi Y, Kawa-Uchi T, Komori H, Shinomiya K. The association of degeneration of the intervertebral disc with 5a/6a polymorphism in the promoter of the human matrix metalloproteinase-3 gene. J Bone Joint Surg. 2001;83(4):491–495. British volume.
8. Owlia M, Salimzadeh A, Alishiri G, Haghighi A. Comparison of two doses of corticosteroid in epidural steroid injection for lumbar radicular pain. Singapore Med J. 2007;48(3):241.
9. Kimura T, Nakata K, Tsumaki N, et al. Progressive degeneration of articular cartilage and intervertebral discs. Int Orthop. 1996;20(3):177–181.
10. Lurie JD, Tosteson AN, Tosteson TD, et al. Reliability of magnetic resonance imaging readings for lumbar disc herniation in the Spine Patient Outcomes Research Trial (SPORT). Spine. 2008;33(9):991. doi:10.1097/BRS.0b013e31816c8379
11. Elliott J, Flynn T, Al-Najjar A, Press J, Nguyen B, Noteboom JT. The pearls and pitfalls of magnetic resonance imaging for the spine. J Orthop Sports Physl Ther. 2011;41(11):848–860. doi:10.2519/jospt.2011.3636
12. Rasmussen CE. Gaussian processes in machine learning. In: Advanced Lectures on Machine Learning. Springer; 2004:63–71.
13. Robert C. Machine Learning, a Probabilistic Perspective. 2nd ed. Abingdon-on-Thames: Taylor & Francis; 2014.
14. Rani P, Liu C, Sarkar N, Vanman E. An empirical study of machine learning techniques for affect recognition in human–robot interaction. Pattern Anal Appl. 2006;9(1):58–69. doi:10.1007/s10044-006-0025-y
15. Lesmeister C. Mastering Machine Learning with R. Packt Publishing Ltd; 2015.
16. James G, Witten D, Hastie T, Tibshirani R. An Introduction to Statistical Learning. Vol. 112. Springer; 2013.
17. García-Laencina PJ, Abreu PH, Abreu MH, Afonoso N. Missing data imputation on the 5-year survival prediction of breast cancer patients with unknown discrete values. Comput Biol Med. 2015;59:125–133. doi:10.1016/j.compbiomed.2015.02.006
18. Yang E-S, Kim J-D, Park C-Y, Song H-J, Kim Y-S. Best combination looking for ovarian cancer. 2015.
19. Wang H-Y, Hsieh C-H, Wen C-N, Wen Y-H, Chen C-H, Lu J-J. Cancers screening in an asymptomatic population by using multiple tumour markers. PLoS One. 2016;11(6):e0158285. doi:10.1371/journal.pone.0158285
20. Heliövaara M, Mäkelä M, Knekt P, Impivaara O, Aromaa A. Determinants of sciatica and low-back pain. Spine. 1991;16(6):608–614.
21. Kuisma M, Karppinen J, Niinimäki J, et al. Modic changes in endplates of lumbar vertebral bodies: prevalence and association with low back and sciatic pain among middle-aged male workers. Spine. 2007;32(10):1116–1122. doi:10.1097/01.brs.0000261561.12944.ff
22. Furey TS, Cristianini N, Duffy N, Bednarski DW, Schummer M, Haussler D. Support vector machine classification and validation of cancer tissue samples using microarray expression data. Bioinformatics. 2000;16(10):906–914.
23. Meyer D, Wien FT. Support vector machines. R News. 2001;1(3):23–26.
24. Subasi A, Ercelebi E. Classification of EEG signals using neural network and logistic regression. Comput Methods Programs Biomed. 2005;78(2):87–99. doi:10.1016/j.cmpb.2004.10.009
25. Zhu W, Zeng N, Wang N. Sensitivity, specificity, accuracy, associated confidence interval and ROC analysis with practical SAS implementations. NESUG Proc. 2010;19:67.
26. Wu Y, Chen P, Luo X, et al. Quantification of knee vibroarthrographic signal irregularity associated with patellofemoral joint cartilage pathology based on entropy and envelope amplitude measures. Comput Methods Programs Biomed. 2016;130:1–12. doi:10.1016/j.cmpb.2016.03.021
27. Feldman DE, Shrier I, Rossignol M, Abenhaim L. Risk factors for the development of low back pain in adolescence. Am J Epidemiol. 2001;154(1):30–36.
28. Schneider S, Randoll D, Buchner M. Why do women have back pain more than men?: a representative prevalence study in the Federal Republic of Germany. Clin J Pain. 2006;22(8):738–747. doi:10.1097/01.ajp.0000210920.03289.93
 © 2019 The Author(s). This work is published and licensed by Dove Medical Press Limited. The full terms of this license are available at https://www.dovepress.com/terms.php and incorporate the Creative Commons Attribution - Non Commercial (unported, v3.0) License.
By accessing the work you hereby accept the Terms. Non-commercial uses of the work are permitted without any further permission from Dove Medical Press Limited, provided the work is properly attributed. For permission for commercial use of this work, please see paragraphs 4.2 and 5 of our Terms.
© 2019 The Author(s). This work is published and licensed by Dove Medical Press Limited. The full terms of this license are available at https://www.dovepress.com/terms.php and incorporate the Creative Commons Attribution - Non Commercial (unported, v3.0) License.
By accessing the work you hereby accept the Terms. Non-commercial uses of the work are permitted without any further permission from Dove Medical Press Limited, provided the work is properly attributed. For permission for commercial use of this work, please see paragraphs 4.2 and 5 of our Terms.