")
Back to Journals » Diabetes, Metabolic Syndrome and Obesity » Volume 14
Classic Type 1 Diabetes Mellitus and Fulminant Type 1 Diabetes Mellitus: Similarity and Discrepancy of Immunological Characteristics and Cytokine Profile
Authors Ying L, Zhang Y, Yin J, Wang Y, Lu W, Zhu W, Bao Y, Zhou J
Received 17 August 2021
Accepted for publication 16 November 2021
Published 30 November 2021 Volume 2021:14 Pages 4661—4670
DOI https://doi.org/10.2147/DMSO.S334712
Checked for plagiarism Yes
Review by Single anonymous peer review
Peer reviewer comments 5
Editor who approved publication: Professor Ming-Hui Zou
Lingwen Ying,1,* Yong Zhang,2,* Jun Yin,1,* Yufei Wang,1 Wei Lu,1 Wei Zhu,1 Yuqian Bao,1 Jian Zhou1
1Department of Endocrinology and Metabolism, Shanghai Jiao Tong University Affiliated Sixth People’s Hospital; Shanghai Clinical Center for Diabetes; Shanghai Diabetes Institute; Shanghai Key Laboratory of Diabetes Mellitus, Shanghai, 200233, People’s Republic of China; 2Department of Immunology and Microbiology, Shanghai Jiao Tong University, School of Medicine, Shanghai, People’s Republic of China
*These authors contributed equally to this work
Correspondence: Jian Zhou
Department of Endocrinology and Metabolism, Shanghai Jiao Tong University Affiliated Sixth People’s Hospital, 600 Yishan Road, Shanghai, 200233, People’s Republic of China
Tel +86-21-64369181
Fax +86-21-64368031
Email [email protected]
Purpose: We aimed to explore the immunological characteristics and cytokine profile of the initial stage of type 1 diabetes.
Patients and Methods: In total, 123 age- and sex-matched subjects with newly diagnosed classic type 1 diabetes mellitus (T1ADM), fulminant type 1 diabetes mellitus (FT1DM), and normal glucose tolerance (NGT) were enrolled. Serum cytokine levels were measured using Milliplex MAP multifactor detection.
Results: There was a significant increase in the levels of transforming growth factor β (TGFβ 1) and TGFβ 2 and decrease in programmed death-1 (PD-1), PD ligand 1 (PD-L1), pro-inflammatory cytokines, and anti-inflammatory cytokines in type 1 diabetes patients compared with the NGT subjects (all P < 0.05). There was no significant difference in C-reactive protein (CRP) and blood routine indicators between the two groups. Type 1 diabetes was further divided into T1ADM and FT1DM subgroups. FT1DM patients had much higher CRP levels than T1ADM patients (4.90 [0.95– 26.05] mg/L vs 0.39 [0.20– 0.74] mg/L, P < 0.01). Blood routine results showed that the number of leukocytes was significantly increased in FT1DM compared with that in T1ADM (9.2 [5.1– 18.8] × 109 cells/L vs 5.4 [4.5– 6.7] × 109 cells/L, P < 0.01). In FT1DM patients, neutrophil% was increased, and lymphocyte% was declined significantly, compared with that in T1ADM patients (neutrophil%: 80.2 [59.2– 85.2]% vs 59.5 [54.8– 64.0]%; lymphocyte%: 18.3 [10.1– 32.3]% vs 32.6 [26.8– 35.9]%; both P < 0.01). However, there was no difference between FT1DM and T1ADM in cytokine profile except for the decrease in CTLA-4 in T1ADM (P < 0.05).
Conclusion: Compared with T1ADM, CRP and leukocytes’ levels were increased significantly in FT1DM, with an increase in neutrophil% and decline in lymphocyte%, suggesting that FT1DM may have more abrupt onset and occur as a more serious subtype of type 1 diabetes mellitus.
Keywords: cytokine profile, fulminant type 1 diabetes mellitus, immune response, multifactor detection, type 1 diabetes mellitus
Introduction
Type 1 diabetes mellitus is caused by an interaction among genetic and environmental factors and mainly characterized by progressive and insidious destruction of pancreatic β cells, thereby resulting in absolute lack of insulin.1 Although the factors triggering the onset of type 1 diabetes remain unclear, it is widely accepted that immune factors, ie, organ-specific autoimmune destruction of pancreatic β cells mediated by autoimmune T cells may be responsible for the pathogenesis of this condition. This process is mainly manifested by the production of autoantibodies to β-cell antigens, including glutamic acid decarboxylase antibodies (GAD-Ab), insulinoma-associated protein 2 antibodies (IA2-Ab), and insulin autoantibody (IAA) and these are related to the action of immune response-related genes.2–5 Moreover, studies found a shift in the ratio of islet-autoantigen-specific CD4+ T-cell subsets from a regulatory phenotype to a pro-inflammatory one, which underlies the pathogenesis of type 1 diabetes.6
Cytokines have been implicated in the pathogenesis of type 1 diabetes because they are regarded as the major drivers of inflammation and play crucial roles in controlling the ongoing β-cell destruction.7 Studies conducted in mouse models, especially in non-obese diabetic (NOD) mice, showed that the regulation of cytokine function may be employed in type 1 diabetes therapy. In this vein, several cytokines (including tumor necrosis factor [TNF], interleukin 2 [IL-2], etc) have been identified as potential therapeutic targets.8–12 However, the specific role of cytokines in the pathophysiology of type 1 diabetes remains unclear, particularly in terms of whether it exerts a pathological or protective immune response in the initial stage of the disease.
Fulminant type 1 diabetes mellitus (FT1DM) is a new subtype of type 1 diabetes characterized by the sudden onset of insulin-deficient hyperglycemia and rapid progression to diabetic ketosis (DK) or diabetic ketoacidosis (DKA) in a short time (approximately 7 days), accompanied with almost complete destruction of β-cell function.13 Thus far, the etiology and pathogenesis of FT1DM remain unclear and are currently thought to be associated with genetic, environmental (viral infection, especially the enterovirus), and autoimmune factors.14,15 FT1DM was considered not to be related to autoimmunity because the reported patients showed negative results for islet autoantibodies when the first case of FT1DM was reported.13 Therefore, FT1DM was distinguished from autoimmune type 1 diabetes (ie, T1ADM) and was classified as type 1B diabetes temporarily. However, subsequent follow-up studies reported that some FT1DM patients presented with positive GAD-Ab or accompanied with autoimmune diseases such as Hashimoto’s thyroiditis, or showed lymphocyte infiltration in islet tissue,16,17 suggesting that immune response may be involved in the occurrence of FT1DM. Nevertheless, the differences in impact of inflammation on T1ADM and FT1DM, especially in the early stage, remain unknown.
Milliplex MAP multiple detection is a liquid-chip multifactor detection product based on xMAP technology (Merck & Co., Inc., New Jersey, USA). It can detect multiple analytes in a single sample simultaneously and accurately, and has been applied to studies of various diseases including metabolic diseases (such as obesity and liver disease), infectious diseases, congenital immunodeficiency diseases, and tumors as a new research strategy.18,19 Consequently, the present study enrolled newly diagnosed type 1 diabetes patients (both T1ADM and FT1DM) and normal glucose tolerance (NGT) subjects with an aim to explore the specific immunological characteristics, so as to clarify the differences between the immune responses in the early stage of T1ADM and FT1DM to provide a basis for their clinical diagnosis and treatment.
Patients and Methods
Study Population
In this single-center cross-sectional study, a total of 40 patients who were admitted to the Department of Endocrinology and Metabolism, Shanghai Jiao Tong University Affiliated Sixth People’s Hospital between January 2007 and November 2019 were diagnosed with FT1DM. Seventeen patients were excluded because they were first diagnosed and treated in other departments or other hospitals. Finally, 23 newly diagnosed FT1DM patients, age- and sex-matched newly diagnosed T1ADM (n = 66) patients, and NGT (n = 34) subjects with complete clinical data and blood samples available (with a diabetes duration of less than 1 month) were enrolled in the current study.
The present study was conducted in accordance with the Declaration of Helsinki and approved by the Ethics Committee of Shanghai Jiao Tong University Affiliated Sixth People’s Hospital. Written informed consent was obtained from each participant.
Diagnostic Criteria
NGT and T1ADM were defined based on the American Diabetes Association (ADA) diagnostic criteria.20 FT1DM was diagnosed according to the 2012 Japan Diabetes Society (JDS) diagnostic criteria, in line with previous studies;21 that is, patients who met all the following three criteria were diagnosed with FT1DM: 1) DK/DKA rapid onset after the occurrence of hyperglycemia symptoms; 2) glucose ≥16.0 mmol/L and glycated hemoglobin A1c (HbA1c) <8.7%; 3) fasting C-peptide <0.1 nmol/L and 2-hour postload C-peptide <0.17 nmol/L.
Anthropometric and Biochemical Assessments
Physical examination of anthropometric indexes (eg, height, body weight) and blood pressure measurements were performed comprehensively in every participant, and related clinical information on basic characteristics, medical history, past history, and family history of diabetes was recorded. Body mass index (BMI) was calculated as weight (kg) divided by height2 (m2). Related laboratory data, including data on blood routine indicators, glucose levels, HbA1c, glycated albumin (GA), fasting C-peptide, 2-hour C-peptide, C-reactive protein (CRP), GAD-Ab, IA2-Ab, IAA, amylase, and lipase, were collected. GAD-Ab, IA2-Ab and IAA were measured by enzyme-linked immunosorbent assay (Analyzer I automated analyzer, EUROIMMUN Inc., Germany). The detection methods for the remaining indicators are described previously.22
Serum Cytokine Measurement
After an overnight fasting for at least 10 hours when DK/DKA resolved, fasting blood samples were collected and centrifuged, and sera were collected for cytokine determination. The following cytokines were measured: interleukin (IL)-1β, IL-2, IL-4, IL-5, IL-6, IL-10, IL-17A/CTLA-8, IL-17F, IL-21, IL-22, IL-23, interferon-γ (IFN-γ), programmed death-1 (PD-1), PD ligand 1 (PD-L1), cytotoxic T-lymphocyte-associated antigen 4 (CTLA-4/CD152), CD40, transforming growth factor β1 (TGFβ1), TGFβ2, and TGFβ3. All these measurements of cytokines were performed using Milliplex MAP technology in the Luminex platform (Millipore, Billerica, MA). Immunology multiplex assay kits (HTH17MAG-14K-12, TGFBMAG-64K-03, and HCKPMAG-11K-04) were obtained from MERCK (MERCK Millipore Co., Billerica, MA, USA). All the collected serum samples were mixed and diluted at a ratio of 1:2 with buffer, and all samples, standards, and quality controls were assayed in accordance with the manufacturer’s instructions. Median fluorescent intensity (MFI) data were acquired using MILLIPLEX Analyst.V5.1 software, and a 5-parameter logistic method was used to calculate cytokine concentrations.
Statistical Analysis
Statistical analyses were performed with SPSS, version 24.0 (SPSS Inc., Chicago, IL, USA) and MedCalc 19.0.4 (MedCalc Software bvba, Ostend, Belgium). Propensity score matching was used for matching sex and age. For continuous variables, data were presented as mean ± standard error of the mean or median with the interquartile range, and for categorical variables, data were presented as numbers (percentages). Intergroup comparisons were performed using unpaired Student’s t-test, Wilcoxon rank-sum test, analysis of variance, and chi-square test for continuous and categorical variables, respectively. The receiver operating characteristic (ROC) curve was used to evaluate the efficacy of relevant indicators in distinguishing T1ADM and FT1DM. A two-tailed P < 0.05 was considered statistically significant.
Results
Clinical Characteristics of the Study Participants
The average age in all 123 subjects (86 males and 37 females) was 33 (26–43) years. As shown in Table 1, T1ADM patients had a significantly lower BMI than those in the NGT group (20.9 ± 0.4 kg/m2 vs 22.9 ± 0.7 kg/m2, P < 0.01), while their blood pressure and family history of diabetes did not differ from those in NGT and FT1DM subjects. Moreover, the duration of symptoms in the enrolled FT1DM patients was 4 (1–7) days, with an onset blood glucose of 36.07 ± 2.17 mmol/L and 30.4% (7/23) GAD-Ab-positive rate.
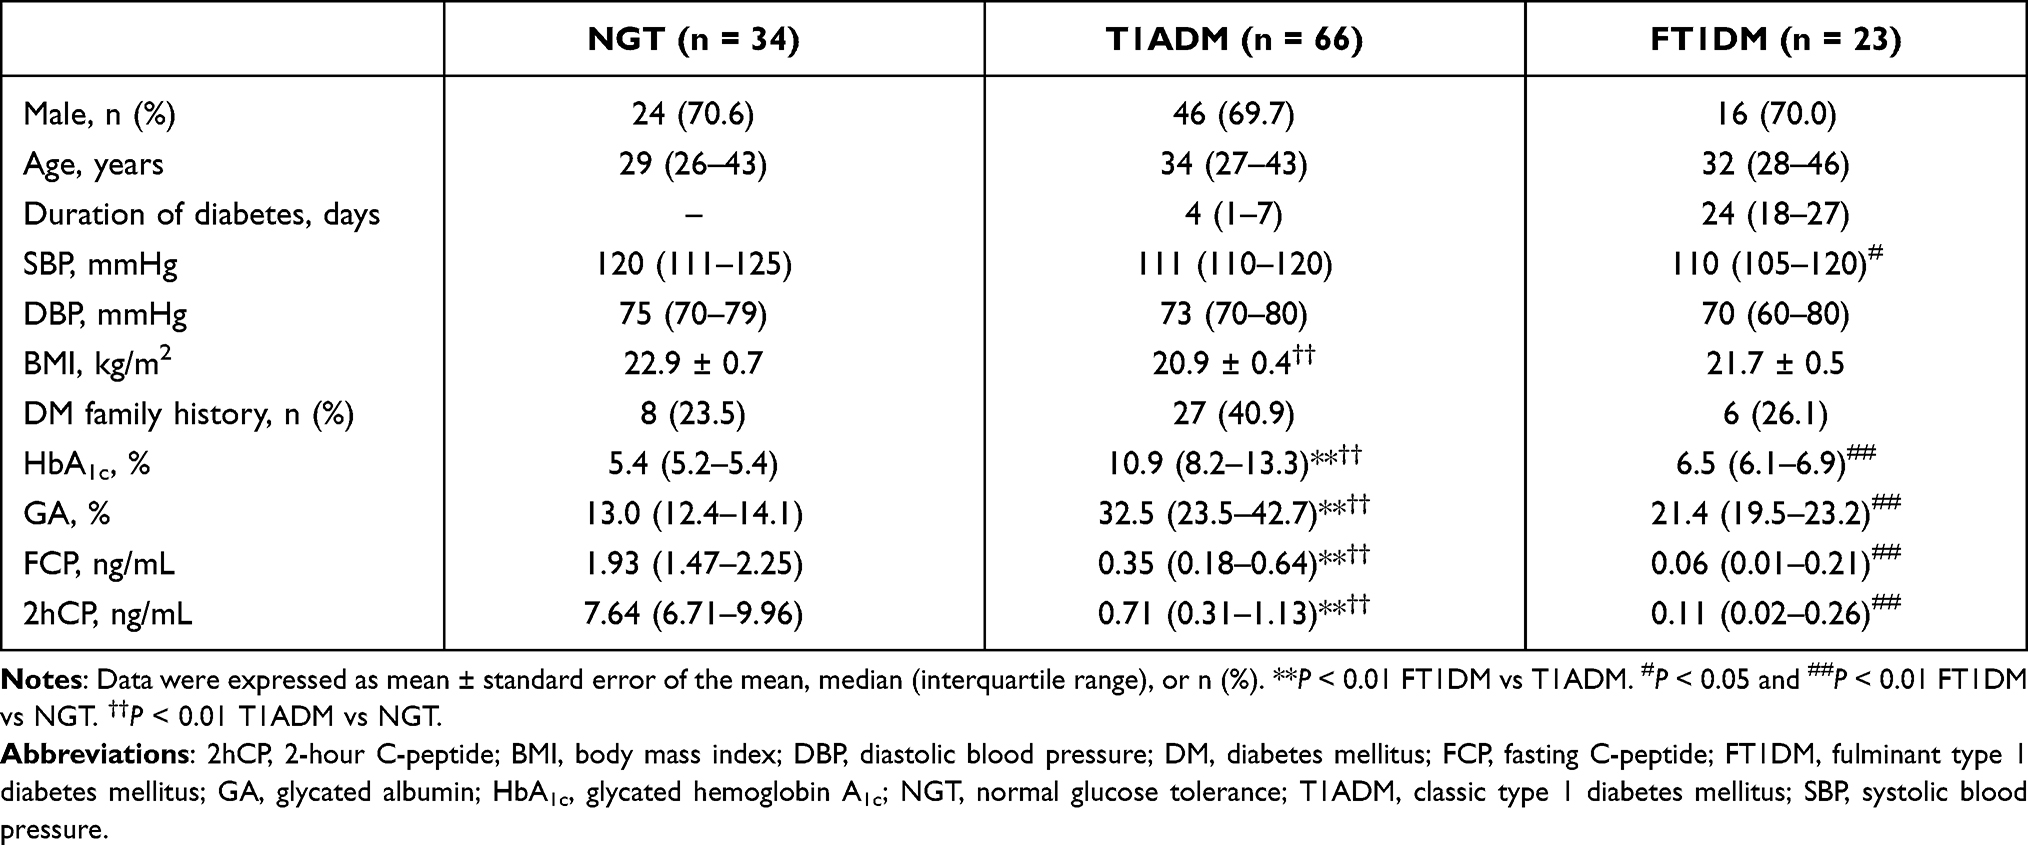 |
Table 1 Clinical Characteristics of NGT, T1ADM and FT1DM Subjects |
Glucose-related indicators showed that both HbA1c and GA were increased gradually in all three subgroups. For HbA1c, the NGT, FT1DM, and T1ADM subjects, had 5.4 (5.2–5.4)%, 6.5 (6.1–6.9)%, and 10.9 (8.2–13.3)%, respectively. In addition, GA levels were 13.0 (12.4–14.1)%, 21.4 (19.5–23.2)%, and 32.5 (23.5–42.7)% in three groups, respectively (all P < 0.01). Furthermore, islet function indicators suggested a deterioration in the newly diagnosed type 1 diabetes patients, and the islet dysfunction further progressed in FT1DM patients when compared with the NGT population (fasting C-peptide: 0.35 [0.18–0.64] ng/mL vs 0.06 [0.01–0.21] ng/mL vs 1.93 [1.47–2.25] ng/mL; 2 hours postload C-peptide: 0.71 [0.31–1.13] ng/mL vs 0.11 [0.02–0.26] ng/mL vs 7.64 [6.71–9.96] ng/mL, all P < 0.01].
Cytokine Profile, Rather Than the Inflammation Indicators, Can Differentiate Type 1 Diabetes from NGT
Related inflammatory indicators and serum cytokines were measured to evaluate whether the immune response played a certain role in the early onset of type 1 diabetes and to explore its characteristic immune spectrum. Our results showed that TGFβ1 and TGFβ2 levels were increased significantly in type 1 diabetes patients, while their PD-1, PD-L1, pro-inflammatory cytokines (IFN-γ, IL-1β, and IL-21), and anti-inflammatory cytokines (IL-5, IL-10, and IL-13) were decreased significantly when compared with those in NGT subjects (all P < 0.05). No significant differences were found in other related cytokines between the two groups (all P > 0.05; Supplementary Figure 1). Type 1 diabetes patients were further divided into T1ADM and FT1DM subgroups. Compared with the NGT population, the changes in cytokine levels in both T1ADM and FT1DM subgroups were similar (Figure 1). Moreover, we found a significant increase in CD40 in FT1DM patients compared to that in NGT subjects (P < 0.05).
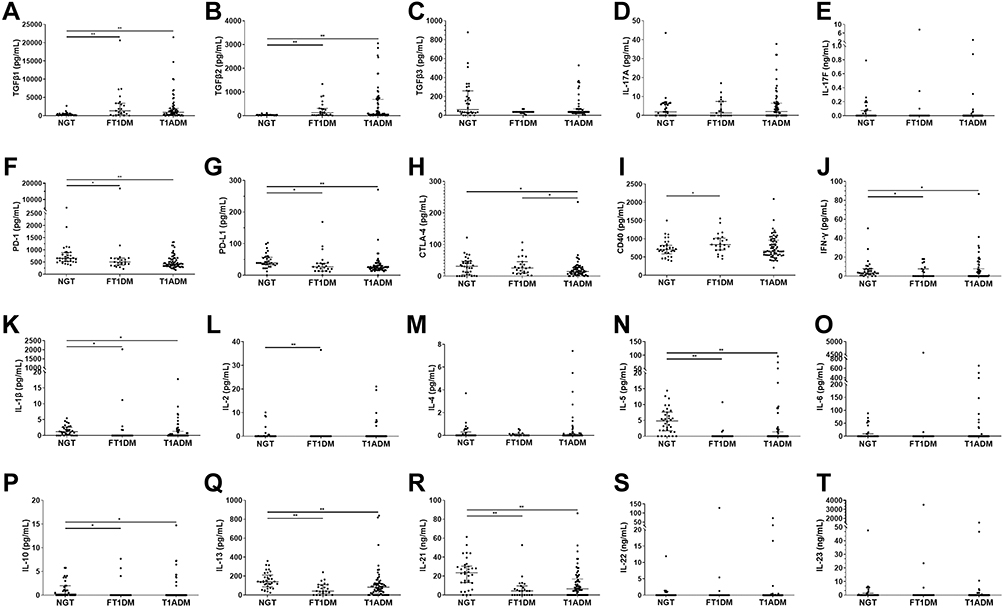 |
Figure 1 Inflammatory profiles of NGT, T1ADM and FT1DM subgroups (A–T). The data are presented as Scatter dot plots (median with interquartile range). Wilcoxon rank-sum test were used for statistical analysis. *P < 0.05; **P < 0.01. Cytokine profiles showed almost no difference between FT1DM and T1ADM subjects, except for a decrease in the Tregs-related indicator CTLA-4 in T1ADM patients. Abbreviations: CD40, tumor necrosis factor receptor superfamily member 5; CTLA-4, cytotoxic T-lymphocyte protein 4; FT1DM, fulminant type 1 diabetes mellitus; IFN-γ, interferon γ; IL, Interleukin; PD-1, programmed cell death protein 1; PD-L1, PD ligand 1; T1ADM, classic type 1 diabetes mellitus; TGFβ, transforming growth factor β. |
In contrast to the cytokine measurement results, the traditional inflammatory indicator CRP and blood routine indicators including leukocyte, neutrophil% (Neu%), and lymphocyte% (Lc%) in type 1 diabetes patients did not differ significantly from those in NGT subjects (data not shown). Likewise, we compared the T1ADM and FT1DM subgroups with the NGT group (Figure 2). In FT1DM, CRP was significantly higher (4.90 [0.95–26.05] mg/L vs 0.42 [0.23–0.91] mg/L, P < 0.01), while the blood routine results showed significant reduction in the number of erythrocytes, remarkable increase in the number of leukocytes and Neu%, and observable decline in Lc% (all P < 0.05). Moreover, there was no difference in both CRP and blood routine indicators between T1ADM patients and NGT subjects (all P > 0.05).
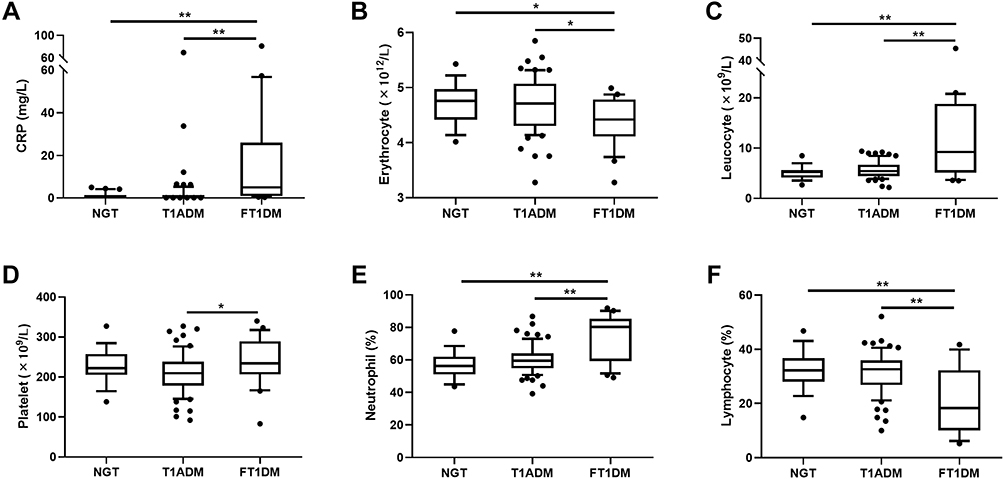 |
Figure 2 CRP and blood routine indexes of NGT and type 1 diabetic subjects (both FT1DM and T1ADM) (A–F). The data are presented as Box and whiskers (10–90 percentile). Unpaired Student’s t-test were used for statistical analysis. *P < 0.05, **P < 0.01. Compared with T1ADM patients, patients with FT1DM showed much higher CRP, leucocyte, and Neu%, but significantly lower erythrocytes and Lc% levels. Moreover, both CRP and blood routine indicators showed no differences between T1ADM patients and NGT subjects. Abbreviations: CRP, C-reactive protein; FT1DM, fulminant type 1 diabetes mellitus; Neu%, Neutrophil %; Lc%, lymphocyte %; NGT, normal glucose tolerance; T1ADM, classic type 1 diabetes mellitus. |
Inflammation Indicators, Rather Than the Cytokine Profile, Can Help Distinguish Fulminant Type 1 Diabetes Mellitus from Type 1A Diabetes Mellitus Patients
Intergroup comparisons between T1ADM and FT1DM patients demonstrated that CRP levels were increased significantly in the FT1DM patients (4.90 [0.95–26.05] mg/L vs 0.39 [0.20–0.74] mg/L, P < 0.01), along with an evident decrease in erythrocyte (4.4 [4.1–4.8] × 1012 cells/L vs 4.7 [4.3–5.1] × 1012 cells/L, P < 0.05) and an increase in leukocytes and platelets (9.2 [5.1–18.8] × 109 cells/L vs 5.4 [4.5–6.7] × 109 cells/L; 234 [206–289] × 109 cells/L vs 209 [179–238] × 109 cells/L, both P < 0.05). Moreover, Neu% in FT1DM patients was increased to 80.2 (59.2–85.2)%, while Lc% was reduced to as low as 18.3 (10.1–32.3)% compared to T1ADM patients (Neu% 59.5 [54.8–64.0]%; Lc% 32.6 [26.8–35.9]%; all P < 0.01). The ROC curve analysis results showed that Neu%/Lc% ratio >3.5 could successfully differentiate 83.1% of FT1DM from T1ADM patients, with sensitivity, specificity, and area under the curve (AUC) values of 55.6%, 90.8%, and 0.732, respectively.
FT1DM participants were grouped according to GAD-Ab results. CRP was much higher in the GAD-Ab-positive subgroup than in the GAD-Ab-negative subgroup (51.9 [14.10–69.17] mg/L vs 3.51 [0.91–8.15] mg/L, P = 0.033), which were both significantly higher than those in T1ADM patients. In addition, leukocytes, Neu%, Lc%, and other related blood routine indicators did not differ significantly between the GAD-Ab-positive and GAD-Ab-negative subgroups (all P > 0.05; Figure 3). Moreover, we found that both CRP and blood routine parameters were comparable in terms of whether FT1DM patients experienced cold-like symptoms or pancreatitis (all P > 0.05; Table 2).
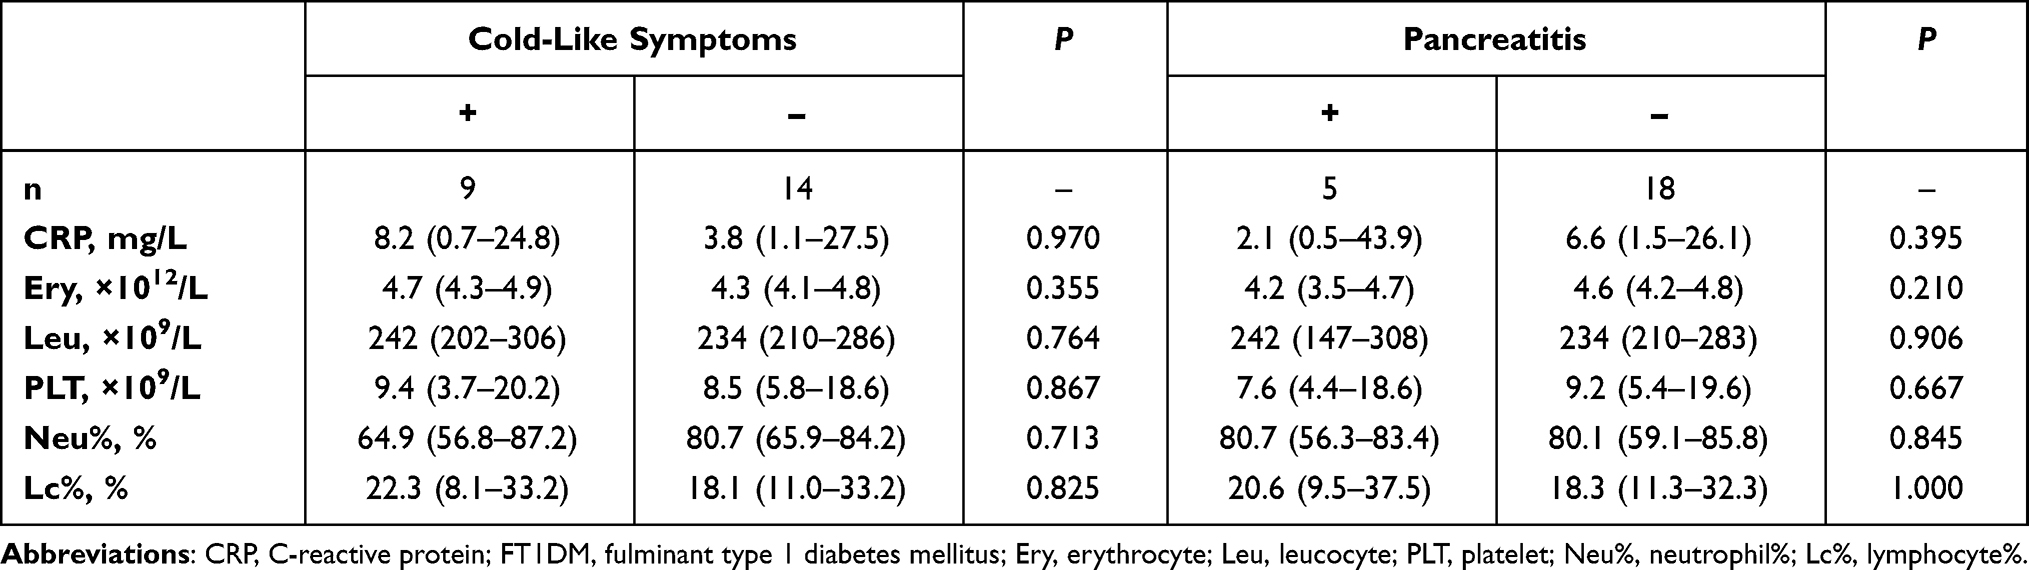 |
Table 2 CRP and Blood Routine Indicators of FT1DM Subjects |
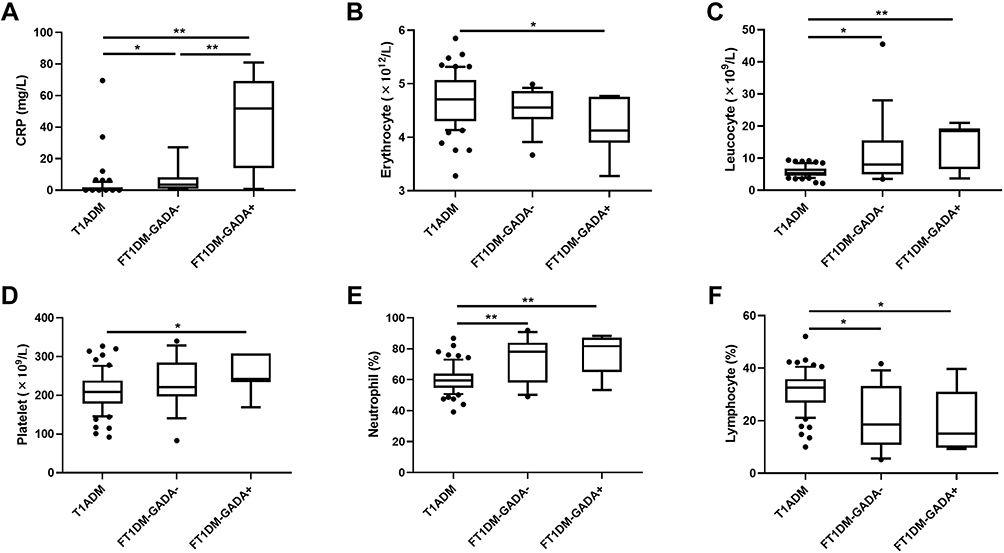 |
Figure 3 CRP and blood routine indexes of T1ADM, FT1DM-GADA+ and FT1DM-GADA− patients (A–F). The data are presented as Box and whiskers (10–90 percentile). Unpaired Student’s t-test were used for statistical analysis. *P < 0.05, **P < 0.01. CRP was significantly increased in GAD-Ab-positive FT1DM patients than those GAD-Ab-negative ones, which were both significantly higher than those in T1ADM patients. While blood routine indicators like leucocytes, Neu%, and Lc% did not differ significantly between the GAD-Ab-positive and GAD-Ab-negative subgroups. Abbreviations: CRP, C-reactive protein; GADA, glutamic acid decarboxylase antibodies; FT1DM- GADA+, fulminant type 1 diabetes mellitus patients with GADA positive; FT1DM-GADA−, fulminant type 1 diabetes mellitus patients with GADA negative; T1ADM, classic type 1 diabetes mellitus; Neu%, Neutrophil %; Lc%, lymphocyte %. |
In addition, we performed intergroup comparisons of cytokine profiles between T1ADM and FT1DM patients (Figure 1). The results demonstrated that FT1DM and T1ADM subjects shared similar cytokine profiles, but with a decrease in only the Regulatory T cells (Tregs)-related indicator CTLA-4 in T1ADM (P < 0.05) (Figure 4).
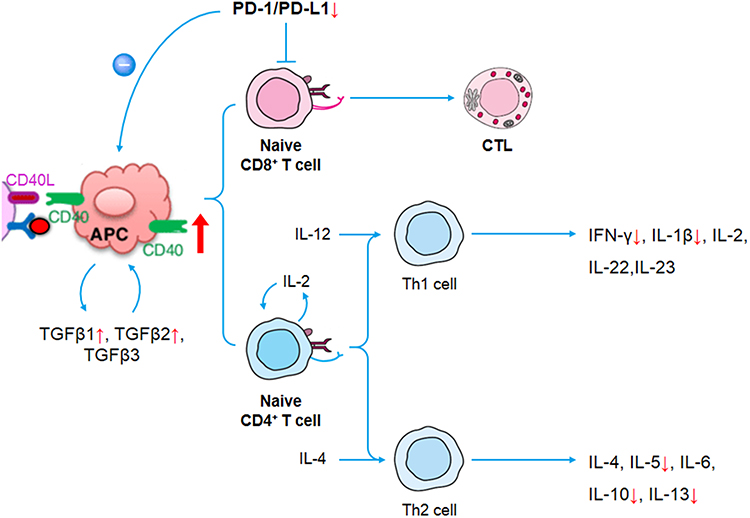 |
Figure 4 Inflammatory profiles of type 1 diabetes mellitus. In the early-onset stage of type 1 diabetes, the CD40 level increased (more pronounced in fulminant type 1 diabetic patients), which results in the increase of CD40 binding to CD40L on antigen presenting cells (APC), and the significant increase of expression of TGFβ1 and TGFβ2. Besides, the PD-1/PD-L1 decreases significantly, which reduces its inhibitory effect on effector T cells, and weakened its negative regulatory effect on APC, causing a decrease in autoimmune tolerance. Abbreviations: APC, antigen presenter cell; CD40, tumor necrosis factor receptor superfamily member 5; CD40L/CD154, CD40 ligand; IFN-γ, interferon γ; IL, Interleukin; PD-1, programmed cell death protein 1; PD-L1, PD ligand 1; TGFβ, transforming growth factor β; Th cell, helper T cell. |
Discussion
The present study showed that, when compared with NGT subjects, TGFβ1 and TGFβ2 were increased significantly in type 1 diabetes patients. However, T cell-related indicators, an important part of the adaptive immune system, Th1- and Th2-cytokines, were declined significantly in type 1 diabetes, while Th17-cytokines and the Tregs-related indicator CTLA-4 showed no difference, suggesting that adaptive immunity may not participate in the early stage of type 1 diabetes.
Innate immunity and adaptive immunity are the two major defense systems of the immune system. Adaptive immunity is triggered when invading pathogens break through the defense line of innate immunity. Among immune cells, macrophages play an important role in innate immunity, whereas T cells are an important part of adaptive immunity.23,24 Previous studies showed that cytokines, which are major drivers of inflammation, played a crucial role in coordinating multiple interactions between pancreatic β cells and immune cells in the development of type 1 diabetes mellitus.10 However, the role of cytokines in the onset and development of type 1 diabetes, especially during the initial stage of the disease, has not yet been fully clarified. Moreover, previous studies focused on several cytokines and therefore could not obtain a relatively complete cytokine profile in type 1 diabetes. One reason is that the levels of cytokines and inflammatory biomarkers can be affected by many factors including infection, stress, etc. We have also tested the antibodies to common virus and bacteria in all enrolled subjects. The results showed that only some of the included participants had previous bacterial or viral infections (positive for corresponding IgG antibody), but no recent infections (ie, positive for corresponding IgM antibody), and none of them presented symptoms of systemic infection such as fever. Therefore, we considered that the change in cytokines and inflammatory indicators in this study are more likely to be the characteristics of FT1DM and T1ADM.
PD-1 is considered an important immune checkpoint that plays a broad immune regulatory role in T cell activation and autoimmune tolerance and confers protection to organs and tissues from autoimmune attacks under physiological conditions.25,26 Previous studies reported that overexpression of PD-1/PD-L1 could inhibit autoimmune-related diabetes, while PD-1/PD-L1 blockade rapidly precipitated diabetes in prediabetic NOD mice.27,28 Recently, the soluble forms of PD-1 and PD-L1 in the blood have attracted researchers’ attention because measurement of serum indicators is less invasive and more efficient.29 Studies showed that serum PD-1/PD-L1 may be involved in the maintenance of peripheral self-tolerance and prevention of autoimmunity.30 Moreover, studies have reported a high concordance rate between serum levels of PD-1/PD-L1 and membrane levels of PD-1/PD-L1 in cancer cells.31 However, only few studies have explored the role of PD-1 in type 1 diabetes, with no related data on newly diagnosed type 1 diabetes, especially with blood-based biomarkers, because the average duration of diabetes in the enrolled subjects ranged from 4.2 months to 7.8 years.32–34 Our research revealed that both PD-1 and PD-L1 were decreased significantly in newly diagnosed type 1 diabetes (both T1ADM and FT1DM patients), suggesting that a decrease in immune tolerance and weakening of their inhibitory effect while presenting on antigen-presenting cells are related to the onset and development of type 1 diabetes.
This study is the first to perform a comparison of cytokine profiles between T1ADM and FT1DM patients. Our results illustrated that the cytokine profile in FT1DM did not differ significantly from that of T1ADM, except for the decrease in the Tregs indicator CTLA-4 in T1ADM (Figure 1). We also found that the innate immune indicator CD40 in FT1DM patients were remarkably higher than that of NGT subjects. Considering that the onset of T1ADM is relatively insidious, the duration of symptoms of FT1DM is more accurate, and the innate immune response progresses to adaptive immune response usually after a duration of 48–96 hours (2–4 days). Because the blood samples of FT1DM participants were mostly collected within 4 days (17/23) after the onset of DK/DKA, with an average duration of 4 (1–7) days, most FT1DM patients were still in the innate immune stage within this time window. Therefore, we believe that the innate immune response, rather than the adaptive immune response, is the driving factor in the early onset of type 1 diabetes, while FT1DM may be a special type of type 1 diabetes that manifests with more rapid onset and more severe condition.
It is worth noting that CRP and blood routine rather than the cytokine profile may be used in the early differentiation between T1ADM and FT1DM. We found that the number of leukocytes was increased significantly FT1DM compared with those in T1ADM, along with an increase in Neu%, decrease in Lc%, and evident increase in CRP. All these results indicated a stress state of FT1DM, while stress that induces rapid outbreak of the immune response within a short duration may be an important factor for the occurrence of FT1DM in the more severe form than the occurrence of T1ADM. Moreover, we proposed for the first time that the Neu%/Lc% ratio may be used for the early identification of FT1DM and T1ADM and the differentiation between these two subtypes.
In addition, we found that only CRP was increased in GAD-Ab-positive FT1DM subjects, without differences in blood routine parameters, compared with those in GAD-Ab-negative subjects, suggesting that FT1DM in the presence of islet autoantibodies at onset may occur in the more severe form than that in the absence of islet autoantibodies at onset.
The present study focused on newly diagnosed type 1 diabetes and enrolled FT1DM patients with an average duration of symptoms for 4 (1–7) days; this period was able to reflect the conditions at their onset stage. Meanwhile, the emerging method of multiple parameters’ detection has been used for convenient and accurate measurement of comprehensive cytokines, which can better mirror the onset stage cytokine profile of type 1 diabetes.
However, the present study had some limitations. First, this was a single-center, cross-sectional study, with a relatively small sample size because the prevalence of FT1DM was relatively low. Further study with expansion of the sample size is needed for verification. Second, since levels of indicators such as CRP and leukocyte may change in the later stage of the disease, and the average duration of symptoms in the enrolled FT1DM patients was 4 (1–7) days, the Neu%/Lc% ratio was suitable only for early differentiation between FT1DM and T1ADM and in their diagnosis, while a suitable indicator for the later course needs further study. Moreover, further characterization of the T cell populations via intracellular cytokine staining and/or ELISPOT to assess true precursor frequency and phenotype of the cytokine expressing T cell population in NGT and type 1 diabetic population is needed for verification.
Conclusion
This study suggested the important role of cytokines in the early-onset phase of type 1 diabetes. Moreover, this study, for the first time, reported that FT1DM and T1ADM shared a similar cytokine profile, and FT1DM patients had significantly higher CRP level and leukocytes, with a remarkable increase in Neu% and a simultaneously decrease in Lc%. These findings suggest that FT1DM may have more rapid onset and occur as a more severe special subtype of type 1 diabetes. The Neu%/Lc% ratio may be a simple parameter for early differentiation and diagnosis of FT1DM and T1ADM.
Data Sharing Statement
The datasets generated during and/or analyzed during the current study are not publicly available but are available from the corresponding author on reasonable request.
Ethical Approval
This study was approved by the Ethics Committee of Shanghai Jiao Tong University Affiliated Sixth People’s Hospital, and was in accordance with the 1964 Helsinki declaration and its later amendments or comparable ethical standards.
Informed Consent
Informed consent was obtained from all individual participants included in the study.
Acknowledgments
We would like to thank all of the involved clinicians, nurses, and technicians for dedicating their time and skill to the completion of this study. We would like to thank all participants for their dedication in data collection and laboratory measurements.
Author Contributions
All authors made a significant contribution to the work reported, whether that is in the conception, study design, execution, acquisition of data, analysis and interpretation, or in all these areas; took part in drafting, revising or critically reviewing the article; gave final approval of the version to be published; have agreed on the journal to which the article has been submitted; and agree to be accountable for all aspects of the work.
Funding
This work was funded by the Shanghai Municipal Education Commission—Gaofeng Clinical Medicine Grant Support (20161430 and 20172025).
Disclosure
The authors report no competing financial/non-financial interests.
References
1. Tuomilehto J. The emerging global epidemic of type 1 diabetes. Curr Diab Rep. 2013;13(6):795–804. doi:10.1007/s11892-013-0433-5
2. van Belle TL, Coppieters KT, von Herrath MG. Type 1 diabetes: etiology, immunology, and therapeutic strategies. Physiol Rev. 2011;91(1):79–118. doi:10.1152/physrev.00003.2010
3. Skyler JS, Sosenko JM. The evolution of type 1 diabetes. JAMA. 2013;309(23):2491–2492. doi:10.1001/jama.2013.6286
4. Gan MJ, Albanese-O’Neill A, Haller MJ. Type 1 diabetes: current concepts in epidemiology, pathophysiology, clinical care, and research. Curr Probl Pediatr Adolesc Health Care. 2012;42(10):269–291. doi:10.1016/j.cppeds.2012.07.002
5. Eisenbarth GS. Update in type 1 diabetes. J Clin Endocrinol Metab. 2007;92(7):2403–2407. doi:10.1210/jc.2007-0339
6. Arif S, Pujol-Autonell I, Eichmann M. Assessing effector T cells in type 1 diabetes. Curr Opin Endocrinol Diabetes Obes. 2020;27(4):240–247. doi:10.1097/MED.0000000000000553
7. Polychronakos C, Li Q. Understanding type 1 diabetes through genetics: advances and prospects. Nat Rev Genet. 2011;12(11):781–792. doi:10.1038/nrg3069
8. Nepom GT, Ehlers M, Mandrup-Poulsen T. Anti-cytokine therapies in T1D: concepts and strategies. Clin Immunol. 2013;149(3):279–285. doi:10.1016/j.clim.2013.02.003
9. Mastrandrea L, Yu J, Behrens T, et al. Etanercept treatment in children with new-onset type 1 diabetes: pilot randomized, placebo-controlled, double-blind study. Diabetes Care. 2009;32(7):1244–1249. doi:10.2337/dc09-0054
10. Lu J, Liu J, Li L, Lan Y, Liang Y. Cytokines in type 1 diabetes: mechanisms of action and immunotherapeutic targets. Clin Transl Immunol. 2020;9(3):e1122. doi:10.1002/cti2.1122
11. Hartemann A, Bensimon G, Payan CA, et al. Low-dose interleukin 2 in patients with type 1 diabetes: a Phase 1/2 randomised, double-blind, placebo-controlled trial. Lancet Diabetes Endocrinol. 2013;1(4):295–305. doi:10.1016/S2213-8587(13)70113-X
12. Rosenzwajg M, Churlaud G, Mallone R, et al. Low-dose interleukin-2 fosters a dose-dependent regulatory T cell tuned milieu in T1D patients. J Autoimmun. 2015;58:48–58. doi:10.1016/j.jaut.2015.01.001
13. Imagawa A, Hanafusa T, Miyagawa J, Matsuzawa Y. A novel subtype of type 1 diabetes mellitus characterized by a rapid onset and an absence of diabetes-related antibodies. Osaka IDDM Study Group. N Engl J Med. 2000;342(5):301–307. doi:10.1056/NEJM200002033420501
14. Takita M, Jimbo E, Fukui T, et al. Unique inflammatory changes in exocrine and endocrine pancreas in enterovirus-induced fulminant type 1 diabetes. J Clin Endocrinol Metab. 2019;104(10):4282–4294. doi:10.1210/jc.2018-02672
15. Hosokawa Y, Hanafusa T, Imagawa A. Pathogenesis of fulminant type 1 diabetes: genes, viruses and the immune mechanism, and usefulness of patient-derived induced pluripotent stem cells for future research. J Diabetes Investig. 2019;10(5):1158–1164. doi:10.1111/jdi.13091
16. Imagawa A, Hanafusa T, Uchigata Y, et al. Fulminant type 1 diabetes: a nationwide survey in Japan. Diabetes Care. 2003;26(8):2345–2352. doi:10.2337/diacare.26.8.2345
17. Minegaki Y, Higashida Y, Ogawa M, Miyachi Y, Fujii H, Kabashima K. Drug-induced hypersensitivity syndrome complicated with concurrent fulminant type 1 diabetes mellitus and hashimoto’s thyroiditis. Int J Dermatol. 2013;52(3):355–357. doi:10.1111/j.1365-4632.2011.05213.x
18. Ravimohan S, Tamuhla N, Steenhoff AP, et al. Immunological profiling of tuberculosis-associated immune reconstitution inflammatory syndrome and non-immune reconstitution inflammatory syndrome death in HIV-infected adults with pulmonary tuberculosis starting antiretroviral therapy: a prospective observational cohort study. Lancet Infect Dis. 2015;15(4):429–438. doi:10.1016/S1473-3099(15)70008-3
19. Trune DR, Larrain BE, Hausman FA, Kempton JB, MacArthur CJ. Simultaneous measurement of multiple ear proteins with multiplex ELISA assays. Hear Res. 2011;275(1–2):1–7. doi:10.1016/j.heares.2010.11.009
20. American Diabetes Association. Standards of medical care in diabetes—2010. Diabetes Care. 2010;33(Suppl 1):S11–S61. doi:10.2337/dc10-S011
21. Imagawa A, Hanafusa T, Awata T, et al. Report of the committee of the Japan diabetes society on the research of fulminant and acute-onset type 1 diabetes mellitus: new diagnostic criteria of fulminant type 1 diabetes mellitus (2012). J Diabetes Investig. 2012;3(6):536–539. doi:10.1111/jdi.12024
22. Ying L, Ma X, Lu J, et al. Fulminant type 1 diabetes: the clinical and continuous glucose monitoring characteristics in Chinese patients. Clin Exp Pharmacol Physiol. 2019;46(9):806–812. doi:10.1111/1440-1681.13099
23. Hedegaard CJ, Krakauer M, Bendtzen K, Lund H, Sellebjerg F, Nielsen CH. T helper cell type 1 (Th1), Th2 and Th17 responses to myelin basic protein and disease activity in multiple sclerosis. Immunology. 2008;125(2):161–169. doi:10.1111/j.1365-2567.2008.02837.x
24. Chatzigeorgiou A, Chavakis T. Immune cells and metabolism. Handb Exp Pharmacol. 2016;233:221–249.
25. Francisco LM, Sage PT, Sharpe AH. The PD-1 pathway in tolerance and autoimmunity. Immunol Rev. 2010;236(1):219–242. doi:10.1111/j.1600-065X.2010.00923.x
26. Fife BT, Pauken KE. The role of the PD-1 pathway in autoimmunity and peripheral tolerance. Ann N Y Acad Sci. 2011;1217(1):45–59. doi:10.1111/j.1749-6632.2010.05919.x
27. Dai S, Jia R, Zhang X, Fang Q, Huang L. The PD-1/PD-Ls pathway and autoimmune diseases. Cell Immunol. 2014;290(1):72–79. doi:10.1016/j.cellimm.2014.05.006
28. Wang CJ, Chou FC, Chu CH, et al. Protective role of programmed death 1 ligand 1 (PD-L1) in nonobese diabetic mice: the paradox in transgenic models. Diabetes. 2008;57(7):1861–1869. doi:10.2337/db07-1260
29. Khan M, Zhao Z, Arooj S, Fu Y, Liao G. Soluble PD-1: predictive, prognostic, and therapeutic value for cancer immunotherapy. Front Immunol. 2020;11:587460. doi:10.3389/fimmu.2020.587460
30. Gu D, Ao X, Yang Y, Chen Z, Xu X. Soluble immune checkpoints in cancer: production, function and biological significance. J Immunother Cancer. 2018;6(1):132. doi:10.1186/s40425-018-0449-0
31. Nascimento C, Urbano AC, Gameiro A, Ferreira J, Correia J, Ferreira F. Serum PD-1/PD-L1 levels, tumor expression and PD-L1 somatic mutations in HER2-positive and triple negative normal-like feline mammary carcinoma subtypes. Cancers. 2020;12(6):1386. doi:10.3390/cancers12061386
32. Tsutsumi Y, Jie X, Ihara K, et al. Phenotypic and genetic analyses of T-cell-mediated immunoregulation in patients with type 1 diabetes. Diabet Med. 2006;23(10):1145–1150. doi:10.1111/j.1464-5491.2006.01951.x
33. Parackova Z, Vrabcova P, Zentsova I, et al. Enhanced STAT3 phosphorylation and PD-L1 expression in myeloid dendritic cells indicate impaired IL-27Ralpha signaling in type 1 diabetes. Sci Rep. 2020;10(1):493. doi:10.1038/s41598-020-57507-8
34. Li X, Zhong T, Tang R, et al. PD-1 and PD-L1 expression in peripheral CD4/CD8+ T cells is restored in the partial remission phase in type 1 diabetes. J Clin Endocrinol Metab. 2020;105(6):dgaa130. doi:10.1210/clinem/dgaa130
 © 2021 The Author(s). This work is published and licensed by Dove Medical Press Limited. The full terms of this license are available at https://www.dovepress.com/terms.php and incorporate the Creative Commons Attribution - Non Commercial (unported, v3.0) License.
By accessing the work you hereby accept the Terms. Non-commercial uses of the work are permitted without any further permission from Dove Medical Press Limited, provided the work is properly attributed. For permission for commercial use of this work, please see paragraphs 4.2 and 5 of our Terms.
© 2021 The Author(s). This work is published and licensed by Dove Medical Press Limited. The full terms of this license are available at https://www.dovepress.com/terms.php and incorporate the Creative Commons Attribution - Non Commercial (unported, v3.0) License.
By accessing the work you hereby accept the Terms. Non-commercial uses of the work are permitted without any further permission from Dove Medical Press Limited, provided the work is properly attributed. For permission for commercial use of this work, please see paragraphs 4.2 and 5 of our Terms.