")
Back to Journals » OncoTargets and Therapy » Volume 10
Clarifying the molecular mechanism associated with carfilzomib resistance in human multiple myeloma using microarray gene expression profile and genetic interaction network
Authors Zheng Z, Liu T, Zheng J, Hu J
Received 20 December 2016
Accepted for publication 14 January 2017
Published 1 March 2017 Volume 2017:10 Pages 1327—1334
DOI https://doi.org/10.2147/OTT.S130742
Checked for plagiarism Yes
Review by Single anonymous peer review
Peer reviewer comments 3
Editor who approved publication: Dr Samir Farghaly
Zhihong Zheng, Tingbo Liu, Jing Zheng, Jianda Hu
Department of Hematology, Fujian Provincial Key Laboratory of Hematology, Fujian Medical University Union Hospital, Fuzhou, Fujian, People’s Republic of China
Abstract: Carfilzomib is a Food and Drug Administration-approved selective proteasome inhibitor for patients with multiple myeloma (MM). However, recent studies indicate that MM cells still develop resistance to carfilzomib, and the molecular mechanisms associated with carfilzomib resistance have not been studied in detail. In this study, to better understand its potential resistant effect and its underlying mechanisms in MM, microarray gene expression profile associated with carfilzomib-resistant KMS-11 and its parental cell line was downloaded from Gene Expression Omnibus database. Raw fluorescent signals were normalized and differently expressed genes were identified using Significance Analysis of Microarrays method. Genetic interaction network was expanded using String, a biomolecular interaction network JAVA platform. Meanwhile, molecular function, biological process and signaling pathway enrichment analysis were performed based on Gene Ontology and Kyoto Encyclopedia of Genes and Genomes. Totally, 27 upregulated and 36 downregulated genes were identified and a genetic interaction network associated with the resistant effect was expanded basing on String, which consisted of 100 nodes and 249 edges. In addition, signaling pathway enrichment analysis indicated that cytokine–cytokine receptor interaction, autophagy, ErbB signaling pathway, microRNAs in cancer and fatty acid metabolism pathways were aberrant in carfilzomib-resistant KMS-11 cells. Thus, in this study, we demonstrated that carfilzomib potentially conferred drug resistance to KMS-11 cells by cytokine–cytokine receptor interaction, autophagy, ErbB signaling pathway, microRNAs in cancer and fatty acid metabolism pathways, which may provide some potential molecular therapeutic targets for drug combination therapy against carfilzomib resistance.
Keywords: multiple myeloma, carfilzomib, drug resistance, microarray, interaction network, compensate pathways
Introduction
Multiple myeloma (MM), also known as plasma cell myeloma, is an incurable cancer formed by malignant plasma cells.1 As the second most common cancer of the blood next only to non-Hodgkin’s lymphoma, each year, over 20,000 new cases are diagnosed in the USA according to epidemiologic studies from the American Cancer Society.2 Over the last 40 years, therapy with melphalan plus prednisone has been recognized as the standard of care for patients with newly diagnosed MM.3 However, older patients and patients with clinically significant coexisting illnesses may not be eligible for high-dose therapy and usually do not tolerate this treatment. For these patients, the proteasome inhibitors (bortezomib and carfilzomib) are active in relapsed or refractory myeloma, which were approved by the Food and Drug Administration for treatment of relapsed/refractory MM in 2003 and 2012, respectively.4 In preclinical studies, bortezomib and carfilzomib sensitized melphalan-sensitive and melphalan-resistant myeloma cell lines to melphalan by breaking down enzyme complexes and downregulated cellular responses to genotoxic stress.5 However, recent studies revealed that relapse of myeloma developed due to acquisition of resistance to proteasome inhibitors, owing to the mutations of proteasome complex,6 upregulation of transporter channels or cytochrome components7 and the induction of alternative compensatory pathways.8 Although several aspects of the mechanisms associated with acquisition of resistance to proteasome inhibitors have been studied, a systems biological perspective in terms of proteasome inhibitors resistance for MM has not been fully elucidated.
In recent years, with the rapid development of precision medicine, it is possible to analyze high-throughput screening dataset to better understand pathogenesis in terms of disease progression and drug therapeutics.9–11 To better address this merit, herein, we identified a microarray gene expression profile originating from the carfilzomib-resistant KMS-11 versus parental human myeloma cell line to establish a comprehensive genetic interaction network in order to reveal the molecular mechanisms in carfilzomib resistance in MM, which may provide molecular information or targets for MM clinical interventions in terms of acquisition of resistance to proteasome inhibitors.
Materials and methods
Microarray dataset search strategy
Microarray dataset was downloaded from Gene Expression Omnibus (http://www.ncbi.nlm.nih.gov/geo/) with the accession number GSE69078. In this study, Riz et al treated KMS-11 MM cell line with increasing concentrations of carfilzomib over a period of 18 weeks to establish the carfilzomib-resistant MM cell line.8 Total RNA was extracted from the KMS-11 cell line with or without carfilzomib treatment, and messenger RNA array was performed based on Affymetrix Human Genome U133 Plus 2.0 platform.
Differently expressed genes identification
Comparison of the gene expression profiles of carfilzomib-resistant derivatives versus parental human KMS-11 MM cell line was normalized using log2 transformation after normalization. Significance Analysis of Microarrays (SAM, http://statweb.stanford.edu/~tibs/SAM/), a statistical technique for finding significant genes in a set of microarray experiments, was applied according to a previous publication.12
Genetic interaction network construction
To better understand how these significant genes identified by SAM interacted with each other, genetic interaction network was expanded using String JAVA consortium (http://string-db.org/). String, a website-based biomolecular interaction network database, has an application programming interface which enables the user to get the data without using the graphical user interface of the web page.
To better understand the potential drug-resistant mechanisms in MM, Gene Ontology consortium (GO; http://www.geneontology.org/) and Kyoto Encyclopedia of Genes and Genomes (http://www.genome.jp/kegg/) functional enrichment were also applied through Database for Annotation, Visualization and Integrated Discovery13 (https://david.ncifcrf.gov/) plug-in in String database.
Statistical analysis
For differently expressed genes identification, gene expression was considered to be significant if the threshold of false discovery rate was ≤5% and fold change was ≥2. For GO and Kyoto Encyclopedia of Genes and Genomes enrichment analysis, biological process, molecular function and signaling pathways were identified as different if the P-value was ≤5%.
Results
Sixty-three genes were found to be significantly expressed in carfilzomib-resistant KMS-11 cells
To better understand which regulators contribute to carfilzomib resistance in KMS-11 cells, differently expressed genes were screened out using SAM plug-in in Excel frame. As shown in Figure 1, after performing SAM, 63 genes were found to be differently expressed in carfilzomib-resistant KMS-11 cell line compared to its parental one, with a false discovery rate ≤5% and a fold change ≥2. Figure 2 reveals the heatmap representation of these 63 genes, which indicates that 27 genes were upregulated and 36 genes decreased dramatically. The detailed information of these genes could be found in Table 1.
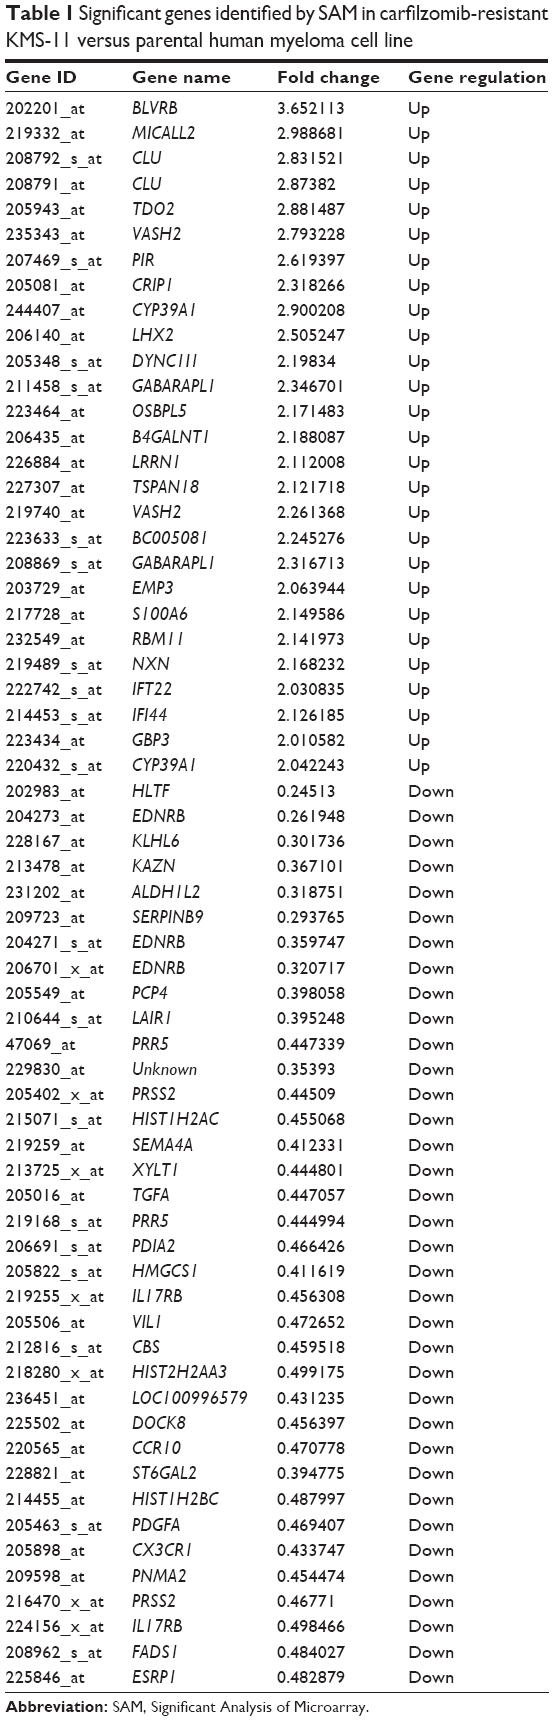 | Table 1 Significant genes identified by SAM in carfilzomib-resistant KMS-11 versus parental human myeloma cell line |
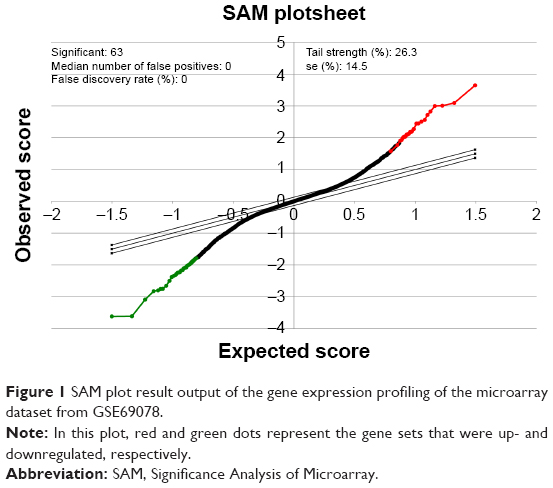 | Figure 1 SAM plot result output of the gene expression profiling of the microarray dataset from GSE69078. |
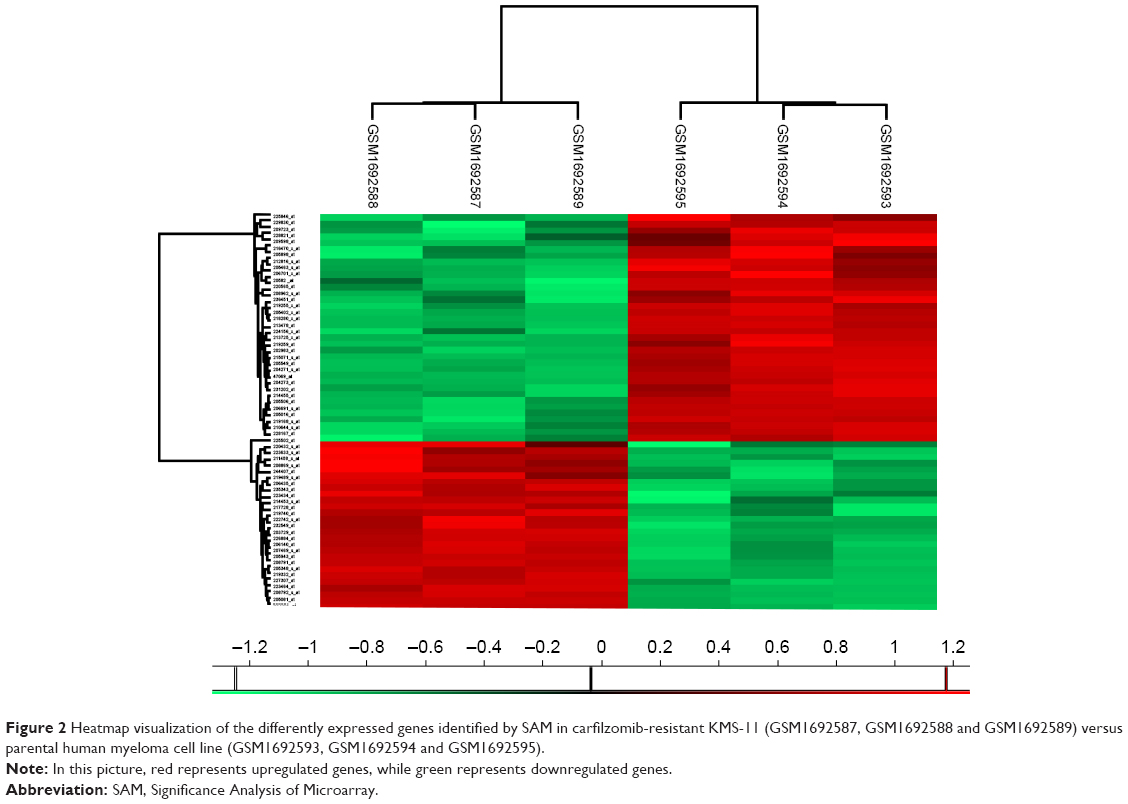 | Figure 2 Heatmap visualization of the differently expressed genes identified by SAM in carfilzomib-resistant KMS-11 (GSM1692587, GSM1692588 and GSM1692589) versus parental human myeloma cell line (GSM1692593, GSM1692594 and GSM1692595). |
Carfilzomib-resistant genetic interaction network
To address the merit of systems biology and deepen our understanding toward how these genes regulated carfilzomib resistance in MM in a system perspective, all these significant genes were submitted to String bioinformatics platform future analysis. As shown in Figure 3, the interaction network involved in carfilzomib resistance consists of 100 nodes (genes) and 249 edges (molecular interaction), with the average node degree (the number of edges connected to the node) being 4.98. Besides, network analysis also indicated that the clustering coefficient and protein–protein interaction enrichment P-value were 0.788 and 5.41e−12, respectively, which means the network has a reliable robustness.
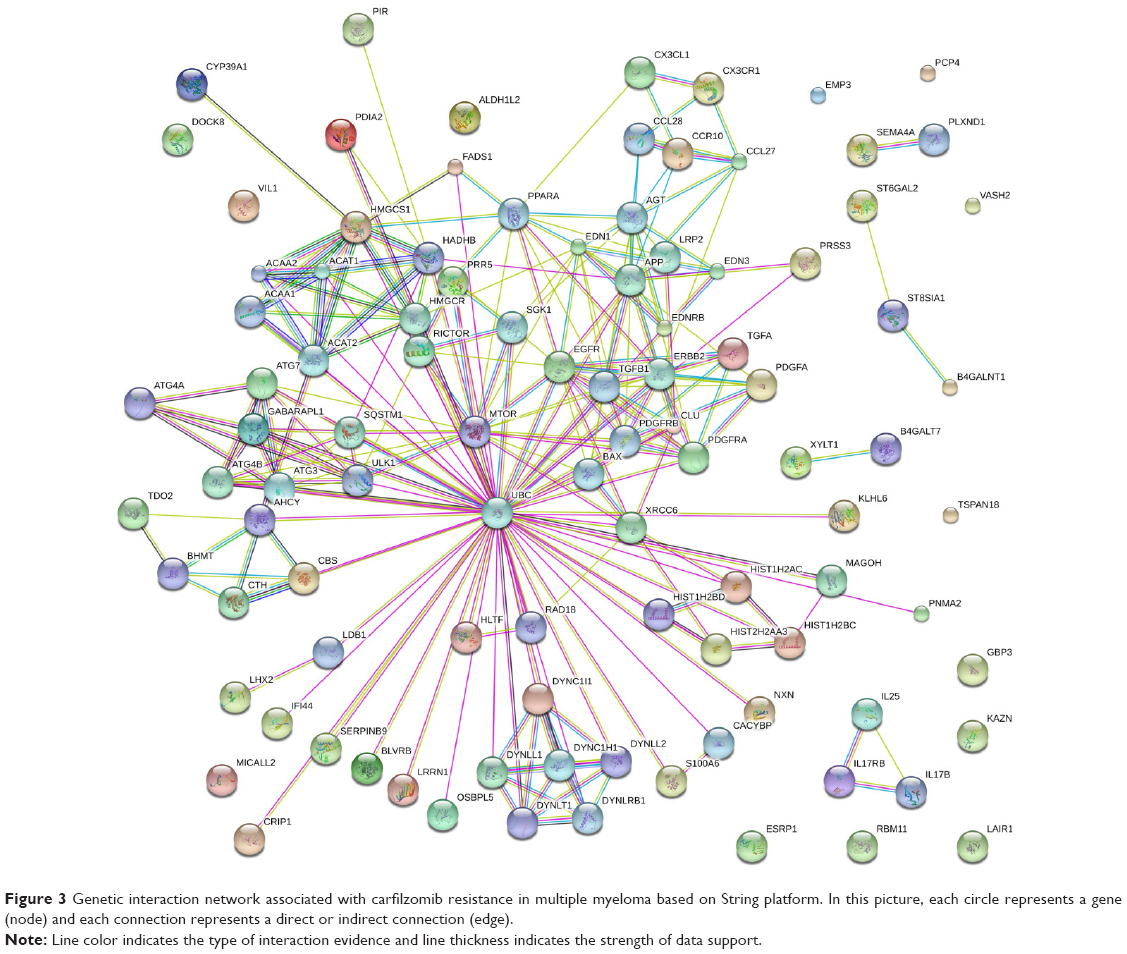 | Figure 3 Genetic interaction network associated with carfilzomib resistance in multiple myeloma based on String platform. In this picture, each circle represents a gene (node) and each connection represents a direct or indirect connection (edge). |
GO analysis
To assess the protein–protein interaction network involved in carfilzomib resistance in the context of GO, all the nodes were submitted to Database for Annotation, Visualization and Integrated Discovery bioinformatics platform for further functional annotation. As shown in Table 2, molecular function analysis indicated that most of these genes regulated protein or enzyme binding and activities. Besides, we also evaluated the biological processes involved in this carfilzomib-resistant network (Table 3). Table 3 summarizes all the potential biological processes for carfilzomib resistance. Among them, immune response, mitopahgy/macroautophagy and cellular stress ranked as top candidates.
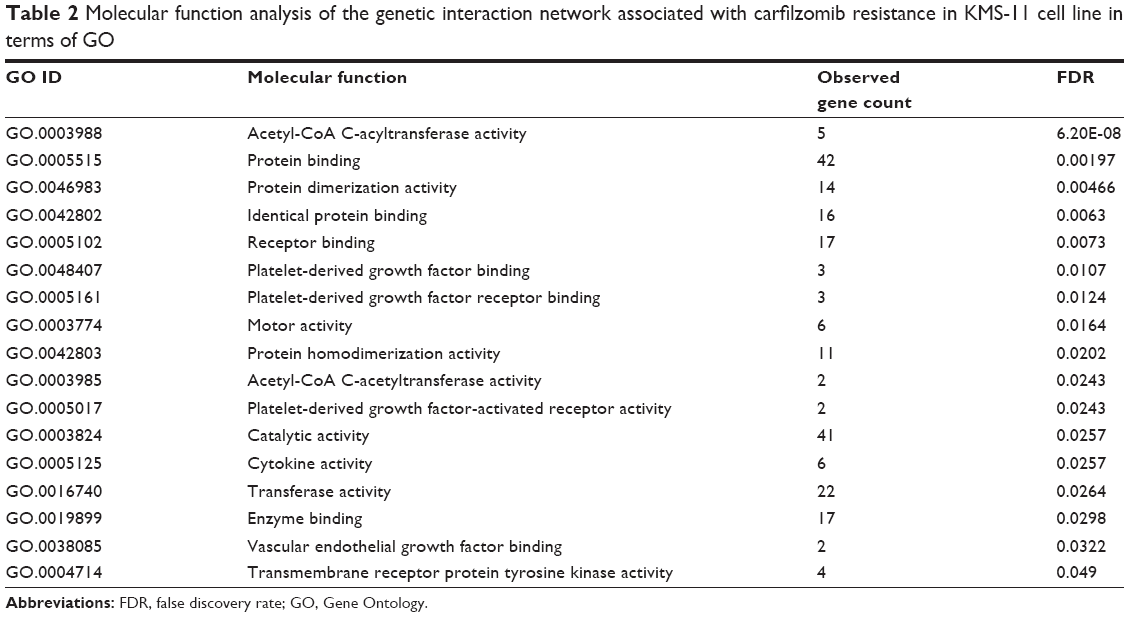 | Table 2 Molecular function analysis of the genetic interaction network associated with carfilzomib resistance in KMS-11 cell line in terms of GO |
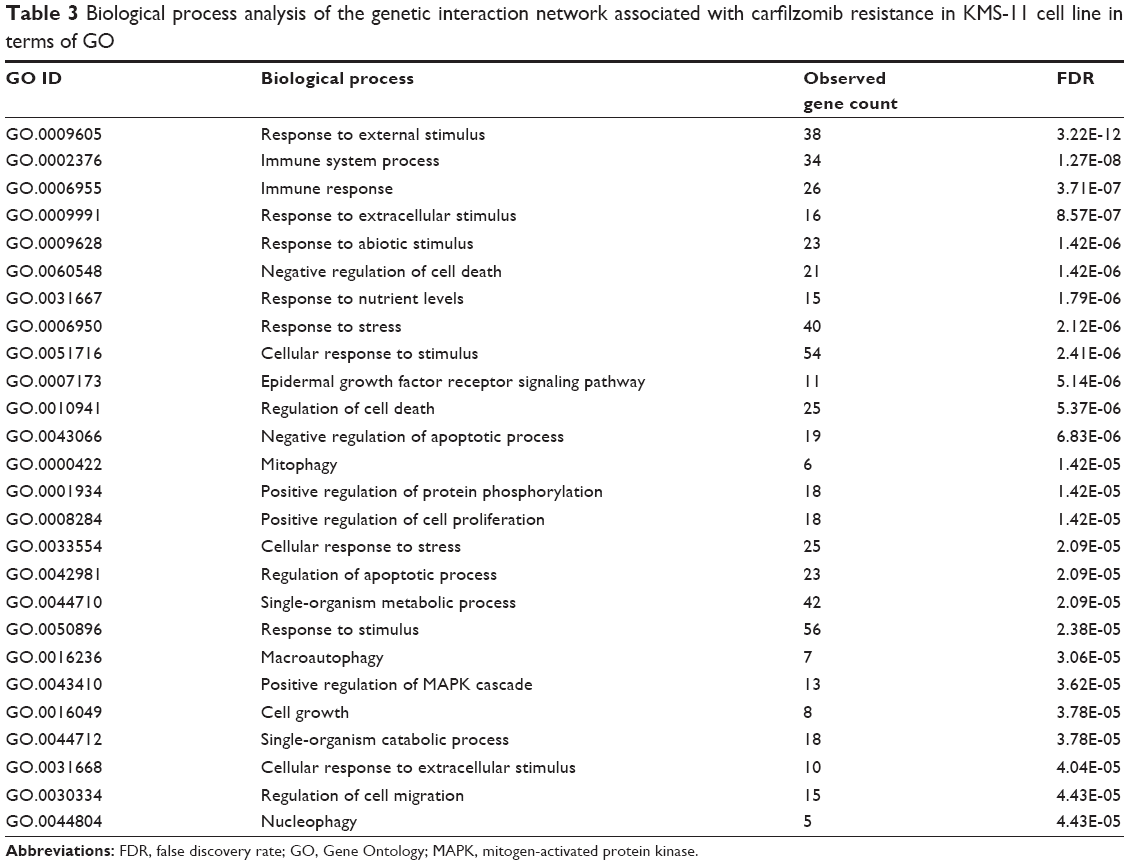 | Table 3 Biological process analysis of the genetic interaction network associated with carfilzomib resistance in KMS-11 cell line in terms of GO |
Pathway enrichment analysis
To assess the relationship between the significantly expressed genes and carfilzomib resistance, we also evaluated the signaling pathways involved in this pathogenesis (Table 4). Notably, cytokine–cytokine receptor interaction, autophagy, ErbB signaling pathway, microRNAs in cancer and fatty acid metabolism pathways seem to confer carfilzomib resistance in human KMS-11 MM cell line.
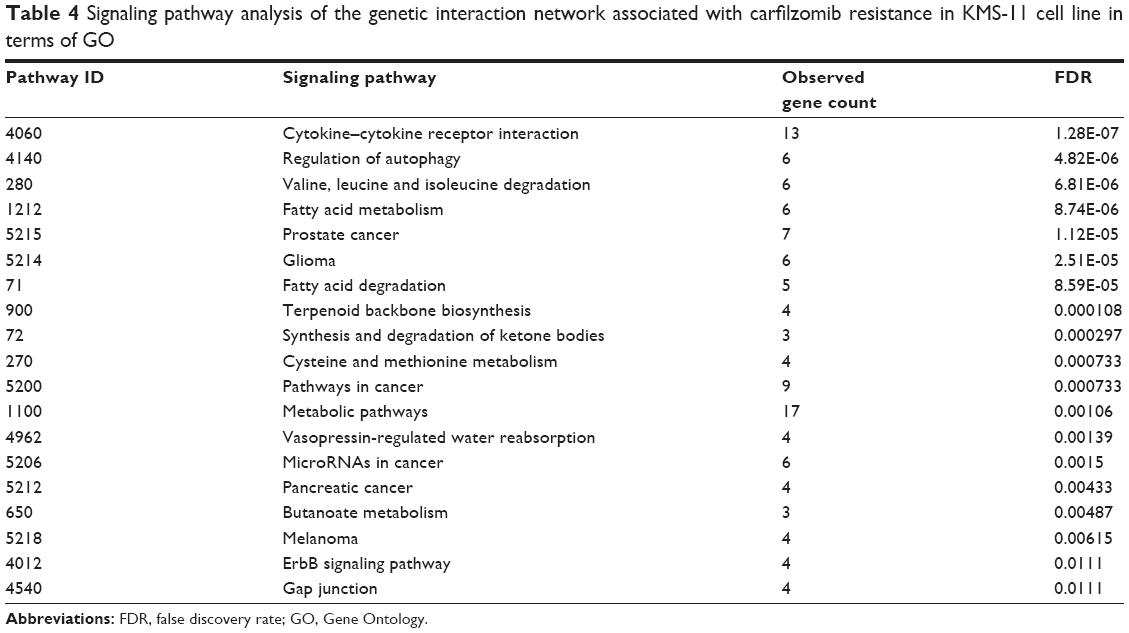 | Table 4 Signaling pathway analysis of the genetic interaction network associated with carfilzomib resistance in KMS-11 cell line in terms of GO |
Discussion
Combined with bioinformatics, high-throughput screening has become a convenient assay for drug-resistance or off-target identification.14,15 As early as 2003, a glass-based microarray suitable for detecting multiple tetracycline (tet) resistance genes was developed and applied.16 Then, Hongisto et al developed a high-throughput three-dimensional (3D) screening method that revealed drug sensitivities between the culture models of JIMT1 breast cancer cells. Compared with the traditional method for studying cancer in vitro, the anchorage-independent three-dimensional models allowed cells to grow in two dimensions and resulted in screening out 102 compounds with multiple concentrations and biological replicates for their effects on breast cancer cell proliferation.17 Using a similar method, in the present study, we also established a genetic interaction network using the publicly available microarray dataset and the functional protein interaction platform – String. Our results revealed that cytokine–cytokine receptor interaction, autophagy, ErbB signaling pathway, microRNAs (miRNAs) in cancer and fatty acid metabolism pathways were highly associated with carfilzomib resistance in MM.
A previous study indicated that autophagy contributed to carfilzomib resistance in MM by KLF4-SQSTM1/p62, which proved our bioinformatics prediction between carfilzomib resistance and autophagy.8 In this study, Riz et al identified high levels of KLF4 expression often occurring in MM patients carrying the t(4;14) translocation, and acquisition of carfilzomib resistance in both t(4;14)-positive MM cell line models was associated with reduced cell proliferation, decreased plasma cell maturation and activation of prosurvival autophagy by regulation of KLF4 expression.8 Meanwhile, basing on the proteostasis network analysis by Acosta-Alvear et al,18 inhibition of proteasome resulted in the compensatory mechanisms through inhibition of translation and induction of autophagy, which also confirmed our prediction regarding the role of autophagy in the acquisition of resistance to carfilzomib in MM.18
miRNAs, a group of noncoding RNA molecules composed of 19–25 nucleotides, can posttranscriptionally regulate target gene expression, which results in cell development, differentiation, apoptosis and proliferation.19,20 Besides, miRNAs are also involved in the development of drug resistance by miRNA dysregulation.21 By far, several labs have already focused on exploring the role of miRNAs in drug resistance using microarrays. They discovered that the epigenetic modulations of miRNAs contributed to cancer drug resistance.22 As to carfilzomib resistance, miRNA also plays a major role in regulating the fundamental cellular processes that control MM resistance to proteasome inhibitors.23 Malek et al identified that the expression of miR29 family and Let-7A1 increased in response to bortezomib, carfilzomib and ixazomib. However, Let-7A2, Let-7D, Let-7E and Let-7F2 were downregulated in bortezomib-, carfilzomib- and ixazomib-resistant cells, compared to drug-sensitive parental cells. According to our bioinformatics analysis, MTOR, EGFR, ERBB2, PDGFA, PDGFRA and PDGFRB were involved in the subnetwork of miRNAs in cancer pathways. Since mammalian target of rapamycin (mTOR) inhibition can also induce autophagy,24,25 previous results also support the protective role of autophagy during proteasome inhibition, indicating that mTOR inhibition may desensitize carfilzomib both through inhibition of translation and induction of autophagy by regulation by miRNAs.18
As to the ErbB signaling pathway, the relation between drug resistance and ErbB pathway has already been predicted by Azad et al.26 Using the Bayesian modeling framework, potential cross-talks between epidermal growth factor receptor (EGFR)/ErbB signaling and six other signaling pathways (Notch, Wnt, G protein coupled receptor [GPCR], hedgehog, insulin receptor/insulin-like growth factor 1 receptor [IGF1R] and transforming growth factor-beta [TGF-b] receptor signaling) contributed to drug resistance in breast cancer cell lines. However, limited information regarding carfilzomib resistance in MM is available.
Besides the signaling pathways mentioned above, we also discovered many pathways like valine, leucine and isoleucine degradation,27 fatty acid metabolism, fatty acid degradation,28 cysteine and methionine metabolism,29 and terpenoid backbone biosynthesis, which are also involved in carfilzomib resistance in MM. However, detailed information regarding the association between these pathways and carfilzomib resistance is not available. Notably, all these pathways seem to participate in cancer energy/nutrition metabolism. Whether there are any cross-talks between cancer metabolism and MM resistance is still unknown.
Conclusion
In conclusion, using the integrated microarray gene expression profile and genetic interaction network, we explored the molecular mechanisms underlying carfilzomib resistance in MM cell line and highlighted some potential signaling pathways such as cytokine–cytokine receptor interaction, autophagy, ErbB signaling pathway, miRNAs in cancer and fatty acid metabolism pathways which may be involved in this process.
Acknowledgments
We would like to thank Gene Expression Omnibus (GEO), Significance Analysis of Microarrays (SAM), Database for Annotation, Visualization and Integrated Discovery and String databases for making their data readily available to the scientific community.
This work was supported by the National Natural Science Foundation of China (No 81141052). The funders had no role in the study design, data collection and analysis, decision to publish or preparation of the manuscript.
Authors contribution
All authors contributed toward data analysis, drafting and revising the paper and agree to be accountable for all aspects of the work.
Disclosure
The authors report no conflicts of interest in this work.
References
Raab MS, Podar K, Breitkreutz I, Richardson PG, Anderson KC. Multiple myeloma. Lancet.2009;374(9686):324–339. | ||
Siegel RL, Miller KD, Jemal A. Cancer statistics, 2016. CA Cancer J Clin.2016;66(1):7–30. | ||
Kyle RA, Rajkumar SV. Multiple myeloma. N Eng J Med.2004;351(18):1860–1873. | ||
Richardson PG, Barlogie B, Berenson J, et al. A phase 2 study of bortezomib in relapsed, refractory myeloma. N Eng J Med.2003;348(26):2609–2617. | ||
Berenson A, Vardanyan S, David M, et al. Outcomes of multiple myeloma patients receiving bortezomib, lenalidomide, and carfilzomib. Ann Hematol. Epub Dec 8 2016. | ||
Soriano GP, Besse L, Li N, et al. Proteasome inhibitor-adapted myeloma cells are largely independent from proteasome activity and show complex proteomic changes, in particular in redox and energy metabolism. Leukemia.2016;30(11):2198–2207. | ||
Gupta N, Huh Y, Hutmacher MM, Ottinger S, Hui AM, Venkatakrishnan K. Integrated nonclinical and clinical risk assessment of the investigational proteasome inhibitor ixazomib on the QTc interval in cancer patients. Cancer Chemother Pharmacol.2015;76(3):507–516. | ||
Riz I, Hawley TS, Hawley RG. KLF4-SQSTM1/p62-associated prosurvival autophagy contributes to carfilzomib resistance in multiple myeloma models. Oncotarget.2015;6(17):14814–14831. | ||
Fan S, Pan Z, Geng Q, et al. Layered signaling regulatory networks analysis of gene expression involved in malignant tumorigenesis of non-resolving ulcerative colitis via integration of cross-study microarray profiles. PLoS One.2013;8(6):e67142. | ||
Yang H, Fan S, An Y, et al. Bisdemethoxycurcumin exerts pro-apoptotic effects in human pancreatic adenocarcinoma cells through mitochondrial dysfunction and a GRP78-dependent pathway. Oncotarget.2016;7(50):83641–83656. | ||
Li J, Fan S, Han D, Xie J, Kuang H, Ge P. Microarray gene expression profiling and bioinformatics analysis of premature ovarian failure in a rat model. Exp Mol Pathol.2014;97(3):535–541. | ||
Fan S, Li X, Tie L, Pan Y, Li X. KIAA0101 is associated with human renal cell carcinoma proliferation and migration induced by erythropoietin. Oncotarget.2016;7(12):13520–13537. | ||
Huang da W, Sherman BT, Lempicki RA. Systematic and integrative analysis of large gene lists using DAVID bioinformatics resources. Nat Protoc.2009;4(1):44–57. | ||
Fu Y, Pan Y, Pan M, Wang Y, Liu W, Li Y. Development of a high-throughput DNA microarray for drug-resistant gene detection and its preliminary application. J Microbiol Methods.2012;89(2):110–118. | ||
Fan S, Geng Q, Pan Z, et al. Clarifying off-target effects for torcetrapib using network pharmacology and reverse docking approach. BMC Syst Biol.2012;6:152. | ||
Call DR, Bakko MK, Krug MJ, Roberts MC. Identifying antimicrobial resistance genes with DNA microarrays. Antimicrob Agents Chemother.2003;47(10):3290–3295. | ||
Hongisto V, Jernstrom S, Fey V, et al. High-throughput 3D screening reveals differences in drug sensitivities between culture models of JIMT1 breast cancer cells. PLoS One.2013;8(10):e77232. | ||
Acosta-Alvear D, Cho MY, Wild T, et al. Paradoxical resistance of multiple myeloma to proteasome inhibitors by decreased levels of 19S proteasomal subunits. eLife.2015;4:e08153. | ||
Maimaiti A, Abudoukeremu K, Tie L, Pan Y, Li X. MicroRNA expression profiling and functional annotation analysis of their targets associated with the malignant transformation of oral leukoplakia. Gene.2015;558(2):271–277. | ||
Ha M, Kim VN. Regulation of microRNA biogenesis. Nat Rev Mol Cell Biol.2014;15(8):509–524. | ||
Ma J, Dong C, Ji C. MicroRNA and drug resistance. Cancer Gene Ther.2010;17(8):523–531. | ||
Li H, Yang BB. MicroRNA-in drug resistance. Oncoscience.2014;1(1):3–4. | ||
Malek E, Kim BG, Driscoll JJ. Identification of Long Non-Coding RNAs Deregulated in Multiple Myeloma Cells Resistant to Proteasome Inhibitors. Genes (Basel).2016;7(10). | ||
Song L, Liu S, Zhang L, et al. MiR-21 modulates radiosensitivity of cervical cancer through inhibiting autophagy via the PTEN/Akt/HIF-1alpha feedback loop and the Akt-mTOR signaling pathway. Tumour Biol.2016;37(9):12161–12168. | ||
Yu X, Luo A, Liu Y, et al. MiR-214 increases the sensitivity of breast cancer cells to tamoxifen and fulvestrant through inhibition of autophagy. Mol Cancer.2015;14:208. | ||
Azad AK, Lawen A, Keith JM. Prediction of signaling cross-talks contributing to acquired drug resistance in breast cancer cells by Bayesian statistical modeling. BMC Syst Biol.2015;9:2. | ||
Schramm G, Surmann EM, Wiesberg S, et al. Analyzing the regulation of metabolic pathways in human breast cancer. BMC Med Genomics.2010;3:39. | ||
Carracedo A, Cantley LC, Pandolfi PP. Cancer metabolism: fatty acid oxidation in the limelight. Nat Rev Cancer.2013;13(4):227–232. | ||
Locasale JW. Serine, glycine and one-carbon units: cancer metabolism in full circle. Nat Rev Cancer.2013;13(8):572–583. |
 © 2017 The Author(s). This work is published and licensed by Dove Medical Press Limited. The full terms of this license are available at https://www.dovepress.com/terms.php and incorporate the Creative Commons Attribution - Non Commercial (unported, v3.0) License.
By accessing the work you hereby accept the Terms. Non-commercial uses of the work are permitted without any further permission from Dove Medical Press Limited, provided the work is properly attributed. For permission for commercial use of this work, please see paragraphs 4.2 and 5 of our Terms.
© 2017 The Author(s). This work is published and licensed by Dove Medical Press Limited. The full terms of this license are available at https://www.dovepress.com/terms.php and incorporate the Creative Commons Attribution - Non Commercial (unported, v3.0) License.
By accessing the work you hereby accept the Terms. Non-commercial uses of the work are permitted without any further permission from Dove Medical Press Limited, provided the work is properly attributed. For permission for commercial use of this work, please see paragraphs 4.2 and 5 of our Terms.