")
Back to Journals » OncoTargets and Therapy » Volume 13
Circulating Tumor DNA Correlates with Outcome in Metastatic Melanoma Treated by BRAF and MEK Inhibitors – Results of a Prospective Biomarker Study
Authors Forschner A , Weißgraeber S, Hadaschik D, Schulze M, Kopp M, Kelkenberg S , Sinnberg T , Garbe C, Biskup S, Battke F
Received 3 February 2020
Accepted for publication 9 April 2020
Published 4 June 2020 Volume 2020:13 Pages 5017—5032
DOI https://doi.org/10.2147/OTT.S248237
Checked for plagiarism Yes
Review by Single anonymous peer review
Peer reviewer comments 2
Editor who approved publication: Dr William C. Cho
Andrea Forschner,1 Stephanie Weißgraeber,2 Dirk Hadaschik,2 Martin Schulze,3 Maria Kopp,2 Sabine Kelkenberg,2 Tobias Sinnberg,1 Claus Garbe,1 Saskia Biskup,2,3 Florian Battke2
1Center for Dermatooncology, Department of Dermatology, University Hospital Tuebingen, Tuebingen, Germany; 2Center for Genomics and Transcriptomics (CeGaT) GmbH, Tuebingen, Germany; 3Practice for Human Genetics, Tuebingen, Germany
Correspondence: Andrea Forschner
Center for Dermatooncology, Department of Dermatology, University Hospital Tuebingen, Tuebingen, Germany
Email [email protected]
Purpose: BRAF and MEK inhibitors significantly improved the prognosis of metastatic melanoma. Nevertheless, initial treatment response may be only temporary. Liquid biopsies (LB) offer a possibility to monitor patients by measuring circulating tumor DNA (ctDNA). We sought to find out whether ctDNA can be used to reliably determine progressive disease under targeted therapy. In addition, we wanted to check whether ctDNA may represent a possible prognostic marker for survival.
Patients and Methods: We included 19 melanoma patients with BRAF and MEK inhibitor therapy. For each patient, a 710 gene panel was analyzed on the latest available tumor tissue before the start of therapy. Repetitive LB were collected in which BRAF V600E/K mutations were monitored using digital droplet PCR (ddPCR). We correlated radiological staging results and overall survival with ctDNA results.
Results: In 13 patients, ctDNA was detectable when starting targeted therapy, whereas in six patients, ddPCR was always negative, which we confirmed with ultra-deep sequencing. All patients with initially detectable ctDNA had ctDNA values declining to zero during follow-up, increasing again at the time of extracerebral progression or even slightly before detection by imaging. Survival was significantly worse for patients with elevated LDH (p=0.034) or detectable ctDNA (p=0.008) at the start of targeted therapy.
Conclusion: Therapy monitoring by ctDNA seems to be a reliable method for detecting extracranial progression, even more sensitive and specific than LDH or S100B. However, due to the small number of cases in our study, further studies are necessary.
Keywords: metastatic melanoma, BRAF and MEK inhibition, circulating tumor DNA, ctDNA
Introduction
BRAF V600 mutations are detectable in 40–50% of cutaneous melanomas and are therefore the most common oncogenic driver mutation in this cancer.1 Combined treatment with BRAF- and MEK-inhibitors has significantly improved prognosis in metastatic melanoma patients, although response to therapy is not always long-lasting as secondary resistances may occur.2–5 Liquid biopsies (LB) offer a possibility to monitor patients’ courses, for example, by measuring circulating tumor DNA (ctDNA). Recently, a comprehensive and very detailed review article has been published about the importance of LB in various cancers6 and several publications report on the high relevance of ctDNA monitoring in metastatic melanoma.7–15
We sought to find out whether BRAF V600 mutant ctDNA can be used to reliably determine progressive disease under targeted therapy and whether patients’ prognoses are different if ctDNA is detectable before initiating targeted therapy, ie, at baseline.
Patients and Methods
Patients and Clinical Data
In this study, metastasized melanoma patients of the Center for Dermatooncology of the Eberhard Karls University of Tuebingen were included, who started BRAF and MEK inhibitor treatment from January 2018 on. We obtained written consent for the participation in the study from all patients additionally informed consent was given according to the Gene Diagnostic Law in Germany. The ethics committee of the Ärztekammer Baden-Württemberg and local ethics committee of the Eberhard Karls University approved this study (approval numbers F-2016-010 and 827/2018BO2). This study was performed in accordance with the Declaration of Helsinki.
In this evaluation, we included 19 patients with advanced melanoma under targeted therapy with BRAF/MEK inhibitors and for whom ctDNA results were available at least until the first staging after the start of targeted therapy.
For all patients, sequencing data for tumor tissue as well as healthy tissue (blood) was generated and somatic variants determined. For each patient, a somatic variant (BRAF V600E or K) was selected and a digital droplet PCR (ddPCR) assay was designed as described in.7 Before the initiation of targeted therapy and on each follow-up, a blood sample was taken for liquid biopsy and analyzed with ddPCR for the selected variant. In two patients the first LB was taken two and three weeks after initiating targeted therapy. These two patients had undetectable ctDNA throughout all measurements performed. LB were accompanied by radiological staging and LDH and S100B blood tests as performed in routine patient care. Blood samples for LB were taken at the same time as the laboratory controls. Treatment response was assessed by comparison of patients’ CT scans before initiation of targeted therapy and at the follow-up stagings after treatment initiation. Response to therapy was assessed by oncologically experienced radiologists according to RECIST 1.1.16
Patients’ radiological responses were classified into 3 groups:
- No progression (including complete or partial remission, stable disease, and “no evidence of disease” in the two patients with adjuvant BRAF and MEK inhibitor therapy)
- Progressive disease extracerebral with or without cerebral progress
- Progressive disease only cerebral.
Cell-Free DNA and Tumor Sequencing
In all patients, a tumor panel of 710 tumor-associated genes was analyzed (tumor vs reference tissue comparison), followed by repetitive liquid biopsies every 3–4 weeks.
Tumor Panel Analysis
The formalin-fixed paraffin-embedded tissue used for sequencing was the latest available tissue, usually metastases that had been removed recently. From these samples as well as from EDTA blood, genomic DNA was isolated according to the manufacturers’ instructions using blackPREP FFPE DNA Kit (Analytik Jena, Jena, Germany) or QIAamp DNA Blood Maxi Kit (Qiagen, Hilden, Germany) on a QiaSymphony instrument, respectively. DNA isolation of tumor DNA was performed after macro dissection by a pathologist or neuropathologist. DNA quantity and quality were determined using Qubit® Fluorometer (Thermo Fisher Scientific, Dreieich, Germany) and Fragment Analyzer (AATI, Heidelberg, Germany), respectively. All coding regions and flanking intronic regions of 710 genes (2.1 Mbp) were enriched using Agilent in-solution bait-hybridization technology. For sequencing, we used either Illumina HiSeq2500, HiSeq4000, or NovaSeq6000 systems (Illumina, San Diego, USA) with 2x100 base pairs (bp) read length, yielding on average 9 Gbp of data per sample (range 5–17 Gbp). After demultiplexing (Illumina bcl2fastq 2.20), adapters were trimmed with Skewer (0.2.2). Trimmed raw reads were aligned to the human genome (hg19) with the Burrows-Wheeler Aligner (BWA-mem version 0.7.2). Reads likely arising from PCR duplication as well as reads that aligned at more than one locus were discarded (CeGaT internal software). Average coverage on target was 588x (range 109–920x; 98% >30x, range 88–99%). Sequence variants were called (CeGaT stratacall) with a minimum variant allele frequency of 5%. Calls resulting from technical artifacts were removed (CeGaT internal software). CNV were computed on uniquely mapping, non-duplicate, high quality reads using an internally developed method based on sequencing coverage depth. Briefly, we used at least 10 reference samples to create a model of the expected coverage that represents biases introduced by the target enrichment method, sequence GC content, library preparation protocol, insert size, and sequencing technology, as well as inter-sample variation. CNV calling was performed by computing each sample’s coverage profile, correcting for total read count, and computing the deviation from the expected coverage. Genomic regions were called as variant if they deviated by at least 2 standard deviations from the model mean and the deviation was concordant with a biologically possible copy number and observed SNV allele frequencies.
Data from FFPE and corresponding blood samples were compared to detect somatic alterations. All variants were manually assessed before inclusion in the final report.
TMB was calculated as the number of somatic single nucleotide variants, InDel, and essential splicing changes in the total coding region (exome) and reported as mutations (Mut) per one million coding bases (Mb), more details can be read elsewhere.7 We used the TMB classification widely used by others and also in our daily clinical practice.17 Thus, all TMB values >23.1 Var/MB were classified as “TMB high”, 3.3–23.1 Var/MB as “TMB intermediate” and <3.3 Var/MB as “TMB low”.
Isolation of Plasma and cfDNA
Whole blood was drawn into Streck Cell-Free DNA BCT Tubes (Streck, La Vista, USA, cat. no. 218992). Plasma was separated according to manufacturer’s protocol. Briefly, samples were centrifuged at 1.600 x g for 10 minutes at room temperature followed by a second centrifugation of the supernatant at 16.000 x g for 10 minutes at room temperature. Plasma was stored at −80°C until further processing. cfDNA was isolated from 4 mL plasma using the MagMAX Cell-Free DNA Isolation Kit (Thermo Fisher Scientific, Waltham, USA, cat. no. A29319) either manually or automated on the KingFisher Flex System (Thermo Fisher Scientific, Waltham, USA). The volume after extraction was 36 µL.
Digital Droplet PCR
For digital droplet PCR, predesigned dual-probe TaqMan assays were ordered from Thermo Scientific for BRAF V600E (c.1799T>A; Assay Hs000000004_rm; 17 patients) and BRAF V600K (c.1798_1799delinsAA; Assay Hs000000002_rm; 2 patients).
All ddPCR-based cell-free DNA analyses were performed (BioRad QX200 Droplet Generator and Reader, BioRad, Munich, Germany) and reported according to the digital MIQE guidelines.18,19 A total of 5 ng of DNA was used for each sample with a maximum of 8 µL used per well. In case of very low concentration (<0.625 ng/µL), samples were split into several wells (using 8 µL per well) and screened together. Numbers of mutant and wild-type DNA copies were calculated, and mutant allele frequencies were calculated by dividing the number of mutant DNA copies by the total number of DNA copies in the plasma sample. DNA from patients’ tumor tissue and reference DNA (obtained from Coriell Institute) were used as positive and negative controls, respectively.
cfDNA Library Preparation, Target Capture, and DNA Sequencing
NGS libraries were prepared with 20 ng of cfDNA using the Twist Library Preparation EF Kit (Twist Bioscience, San Francisco, USA) according to manufacturer’s instructions with minor modifications. The fragmentation time at 32°C was skipped followed by an enzyme inactivation at 65°C for 30 minutes. For adapter ligation and barcoding, xGen Duplex CS Adapters and customized IDT Dual-Index Primer (both from Integrated DNA Technologies, cat. no. 1080799) were used. Target enrichment was performed with a custom design enrichment panel containing selected hotspots in ALK, BRAF, EGFR, ERBB2, H3F3A, HIST1H3B, IDH1, IDH2, KIT, KRAS, MET, NRAS, PDGFRA, PIK3CA, ROS1, SRY, TERT, and TP53 (7kb in total). Quality and quantity of cfDNA and final libraries were assessed using the High Sensitivity NGS Fragment Analysis Kit (AATI, Santa Clara, USA, cat. no. DNF-474) and Qubit dsDNA HS Assay Kit (Thermo Fisher Scientific, Waltham, USA, cat. no. Q32854), respectively. Paired-end sequencing was performed on a NovaSeq6000 instrument (Illumina, San Diego, CA) with 2x100 base pairs (bp) read length, yielding at least 8 Gbp per sample (8.1–13.9, mean 11.8).
cfDNA NGS Bioinformatics
After demultiplexing (Illumina bcl2fastq 2.20), adapters were trimmed with Skewer (0.1.116) and in-insert duplex unique molecular identifiers (dUMI) were extracted into FASTQ headers (CeGaT internal software). Trimmed raw reads were aligned to the human genome (hg19) with the Burrows-Wheeler Aligner (BWA-mem version 0.7.17) in a modified version that directly transferred dUMI sequences from FASTQ headers to BAM RX tags. Reads aligning to more than one locus with similar alignment score were discarded (CeGaT internal software). Before deduplication, average coverage on target was 300,000.
Using dUMI information, reads were combined into per-molecule consensus sequences as follows. First, all left alignments (ie, primary alignments with mate pair downstream) deriving from a single molecule strand were collected into “families” based on mapping position, allowing for small differences due to different placement of individual reads, and dUMI sequence, allowing for up to two mismatches. Mismatches in dUMI sequences were corrected by assigning each read to the largest existing family within the mismatch radius.
Secondly, collected reads were filtered to remove subfamilies with incompatible alignments (ie, CIGAR strings differ by more than softclips) and the remaining reads used to build sequence, quality, and CIGAR consensus using 60% majority voting on base qualities.
Finally, consensus upper and lower strand sequences deriving from the same molecule were combined into consensus reads using perfect agreement, ie, any mismatching position between the upper and lower strand consensus was reported as N in the final read. The same procedure was applied to the corresponding right alignments (independent of their mapping positions) as well as supplemental alignments of the same reads. Consensus sequences inherit attributes from their constitutive reads.
For optimal specificity, consensus reads were only used in downstream variant calling if they had support from both original molecule strands, yielding an average deduplicated coverage on target of 973 molecules. Sequence variants were called with a minimum variant allele frequency of 0.1% (CeGaT stratacall).
Statistical Analysis
Descriptive statistics were used to characterize the study collective. We compared findings of ctDNA, S100B, and LDH with the results of radiological imaging to assess their ability to detect progress or disease control under BRAF and MEK inhibitor therapy. Differences between groups were tested using the Fisher’s exact test and the exact version of the Chi-Squared test for categorical data. Furthermore, Log-rank test was used to test differences of overall survival. Survival curves were calculated according to the Kaplan–Meier method: Survival time was defined as the time between initiation of targeted therapy and date of death or censored at the last date of patient contact. All death were caused by melanoma. For all statistical analyses, P values < 0.05 (two-sided) were considered statistically significant. All statistical analyses were carried out using SPSS v.25 (SPSS Inc., Chicago, IL, USA). STATA® v15 was used to generate the final version of KM survival curves.
Results
Patient Cohort
The cohort included 11 female patients (58%), median age of the total cohort was 51 years (IQR 43–57). Except for one patient who was treated by Encorafenib and Binimetinib, all patients received Dabrafenib and Trametinib. Two patients were treated in an adjuvant setting, all others for unresectable metastases. More than half of the patients (58%) received targeted therapy as second-line or later treatment and 47% of the patients had elevated LDH at the time of treatment initiation. The median time interval between the start of therapy and the first staging to evaluate the response to therapy was 12 weeks (IQR 11–13). We included 141 LB in this evaluation (7.4 on average per patient; median 6, range 2–16, IQR 5–10). Four patients had a high tumor mutation burden (TMB) of >23.1 var/Mb, 12 patients intermediate (3.3–23.1 var/MB) and three low (<3.3 var/Mb) (Table 1).
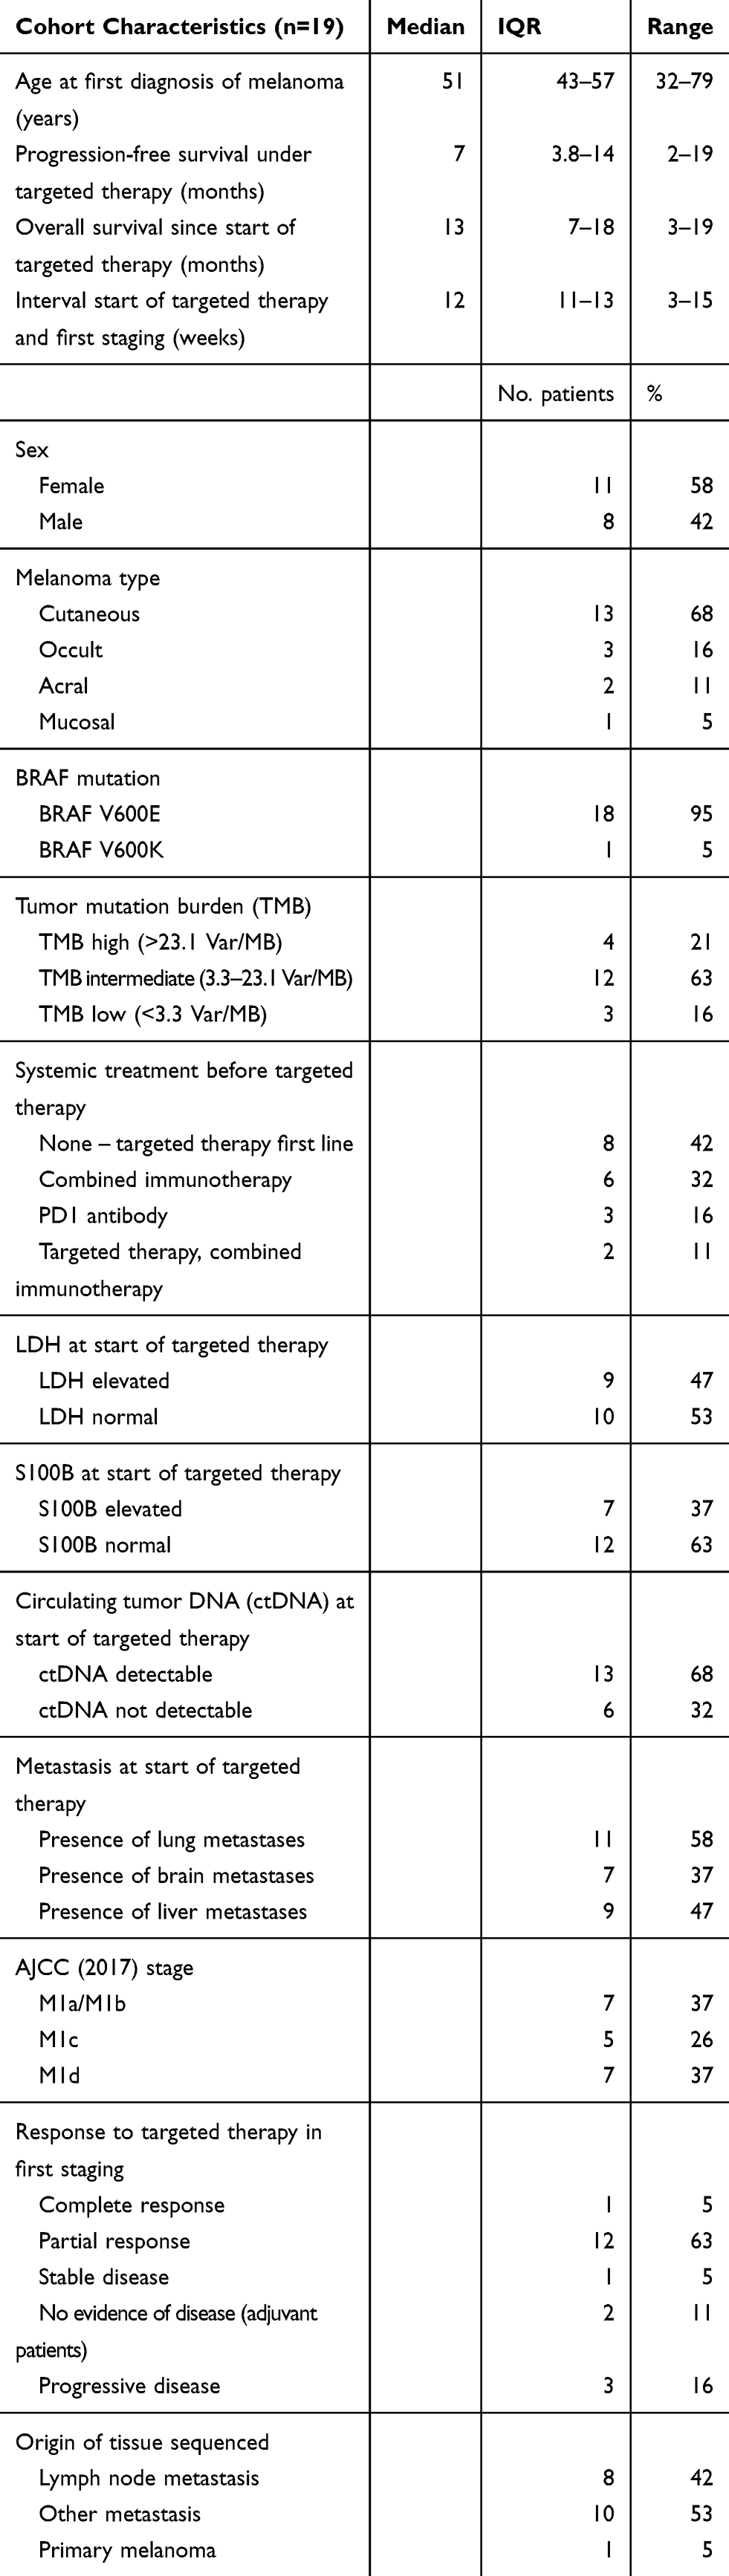 |
Table 1 Cohort Characteristics |
Besides BRAF, CDKN2A and PTEN were the most frequently mutated genes. When evaluating the CNV, it is noticeable that CDKN2A deletions were detected only in 2 of 6 (33.3%) of the evaluable cases with disease control (“no progress”), in 2 of 4 (50%) evaluable cases with exclusively cerebral progressive disease (“progress only in CNS”) but in all evaluable cases with extra-cerebral progression (“progress in other organs”). For further details concerning single nucleotide variants (SNV) and copy number variants (CNV), please refer to Figure 1, including information for each patient about TMB, SNV, CNV, and response to therapy.
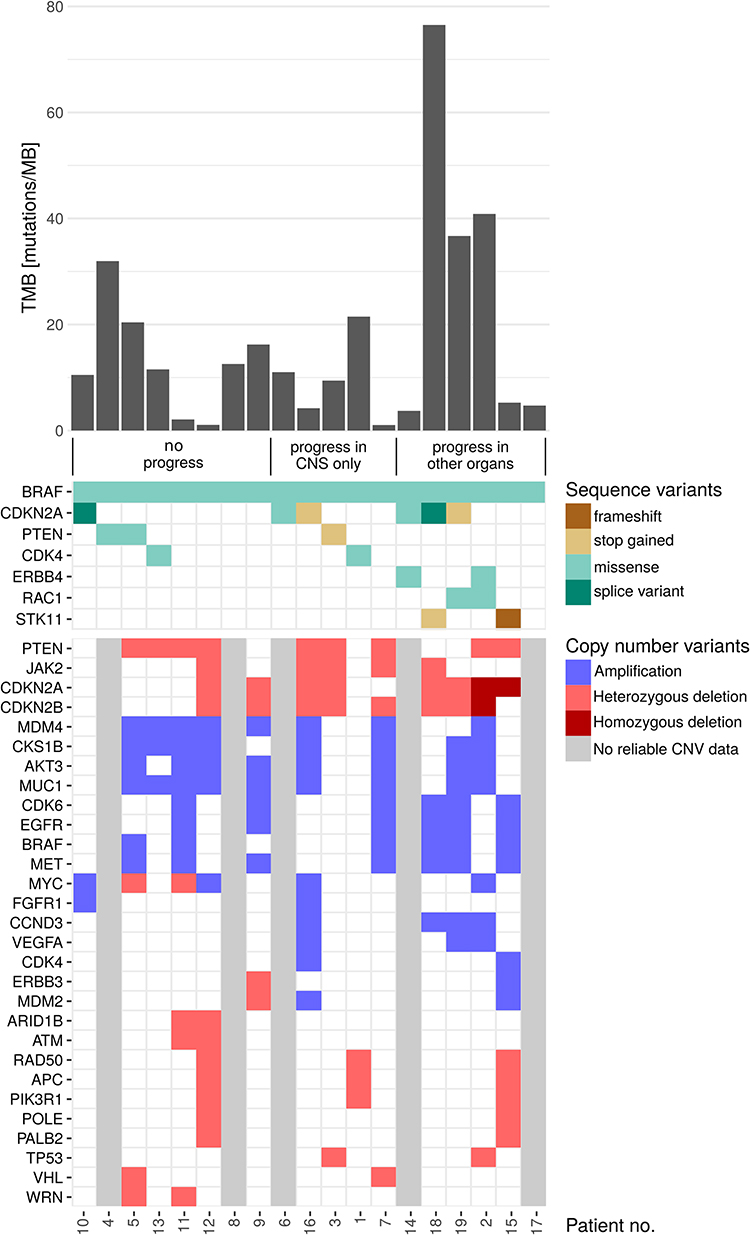 |
Figure 1 Results of next-generation sequencing of tumor tissue. Tumor mutation burden, sequence, and copy number variants of each patient and response to therapy. Genes shown are affected in more than one patient. Samples that were of too poor quality for the diagnostic evaluation of CNV calls or were considered to have too little tumor content are marked in our figure as “no reliable CNV data”. The numbers of the 19 patients are listed at the bottom. Each column corresponds to one patient. The patients are first sorted according to the clinical course (“no progress”, “progress in CNS only”, “progress in other organs”) and then by clustering the affected genes. |
Liquid Biopsy Detection at Start of Therapy is an Important Indicator of Whether the Tumor Releases ctDNA into the Blood Which may be Used for Disease Monitoring
The first cfDNA datapoint at the time of initiating targeted therapy (TT) is important to assess whether the tumor releases sufficient ctDNA into the blood to be detectable by our methods. In 13 of 19 patients, ctDNA was detectable with ddPCR. Of note, all patients with undetectable ctDNA at the start of TT had persistently negative ctDNA results under TT, irrespective of whether they developed progressive disease or not.
In the six ctDNA-negative patients, we additionally performed ultra-deep sequencing using duplex molecular barcodes on a focused panel allowing the detection of the known most clinically relevant tumor mutations including the BRAF V600 variant (see methods for details) and checked for the existence of previously identified tumor-specific coding mutations (from FFPE material). From the respective FFPE samples’ data, we selected all variants in the target region of the focused panel, yielding an average of 1.8 variants per patient, including the BRAF V600 variant (range 1–3; 2x1 variant, 3x2 variants, 1x3 variants). We checked for the presence of these variants in the ultra-deep sequencing data. The BRAF V600E/K variant could not be detected in any of those 6 ddPCR-negative samples and neither could any of the other variants be observed in the FFPE tissue, indicating that these tumors indeed did not release ctDNA into the blood.
Interestingly, all patients with “zero” ctDNA level at the start of TT also had normal values for the tumor markers LDH and S100B, while on the contrary 4/10 patients with normal LDH values had detectable ctDNA levels, as did 6/12 patients with S100B values below clinical thresholds (Table 2).
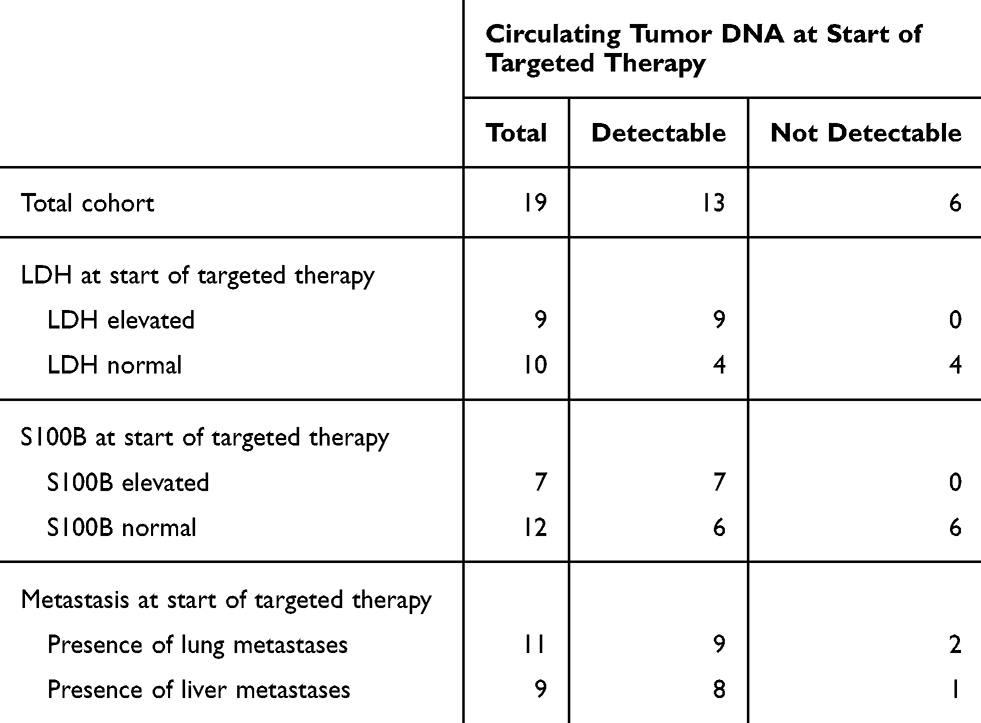 |
Table 2 Circulating Tumor DNA at Start of Targeted Therapy and LDH, S100B, Site of Metastases |
With the exception of two patients who received targeted therapy in an adjuvant setting, all patients had unresectable metastases at the beginning of the targeted therapy. The two adjuvant patients had normal LDH and S100B values and undetectable ctDNA levels.
As an example for a patient with non-detectable ctDNA at all time points, we present patient 19 (Figure 2). At the time of targeted treatment initiation, the patient had pulmonal, lymph node, and spleen metastases. The initial LB taken May 2018 - right before the start of TT - and all further LB showed no sign of the BRAFV600K variant in cfDNA, while the positive control of original tumor tissue run in a parallel ddPCR reaction was always positive. To further confirm this result, we selected the first LB sample for ultra-deep sequencing. Not only was the NGS data negative for the BRAF V600E variant, it was also negative for all other somatic variants covered by the cfDNA NGS panel and detected in the original FFPE sample. The lung, lymph node, and spleen metastases responded very well to targeted therapy, as shown by stagings performed in July 2018 and October 2018.
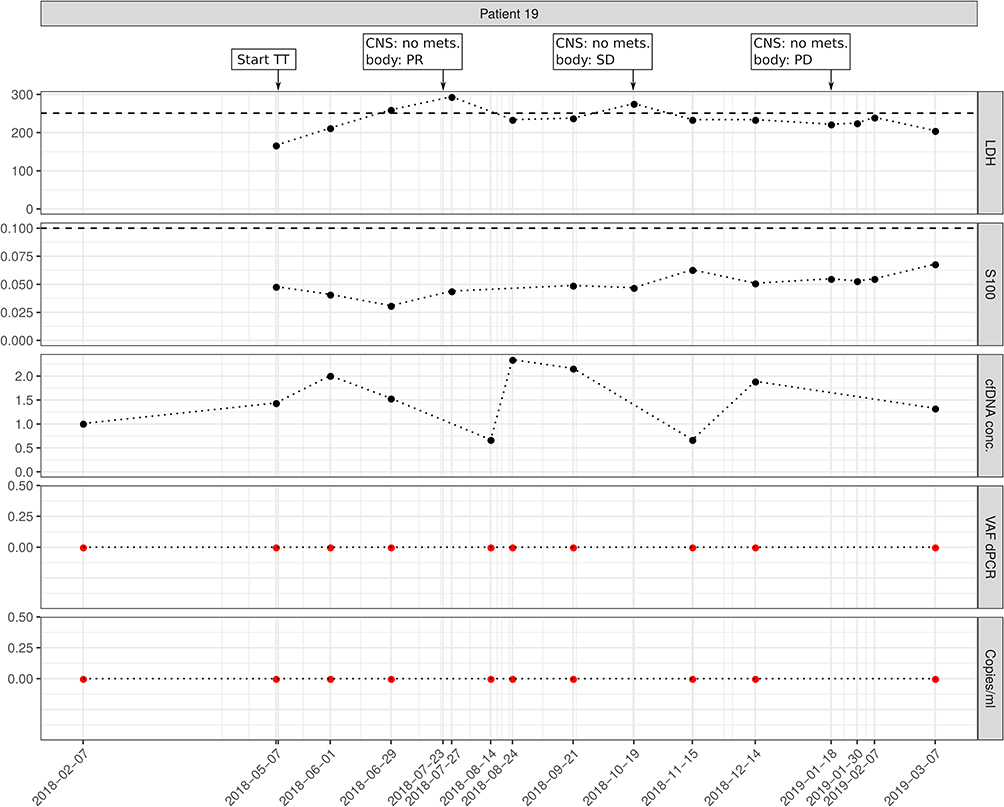 |
Figure 2 Example for a patient with non-detectable ctDNA at all time points. The patient had pulmonal, lymph node, and spleen metastases at the time of targeted treatment initiation. ctDNA was neither detectable at the beginning nor at progression. Imaging results for central nervous system (CNS) and extra-CNS imaging (body) as no mets. (no metastases), PR (partial response), PD (progressive disease), or SD (stable disease); TT, targeted therapy; Copies/mL, number of mutation molecules detected by ddPCR per mL plasma. Total DNA, amount of cell-free DNA isolated; VAF dPCR, allele frequency of mutant allele detected by ddPCR. Red dots indicate undetectable levels, thresholds for S100B and LDH are shown as dashed lines. |
In contrast, patient 5 had positive ctDNA values before starting targeted therapy. Early during targeted therapy, ctDNA became and stayed undetectable in LB samples, in line with the good response to BRAF and MEK inhibitor treatment (Figure 3).
 |
Figure 3 Example for a patient with positive ctDNA before starting targeted therapy. During therapy, ctDNA became undetectable, in line with persisting response to treatment. Imaging results for central nervous system (CNS) and extra-CNS imaging (body) as no mets. (no metastases), or PR (partial response); TT, targeted therapy; Copies/mL, number of mutation molecules detected by ddPCR per mL plasma. Total DNA, amount of cell-free DNA isolated; VAF dPCR, allele frequency of mutant allele detected by ddPCR. Red dots indicate undetectable levels, thresholds for S100B and LDH are shown as dashed lines. |
Circulating Tumor DNA Decreases to Zero During Targeted Therapy in all Patients
All patients with detectable ctDNA at the beginning of targeted therapy were found to have strongly declining ctDNA levels becoming undetectable during follow-up. Already at the first follow-up, almost all ctDNA values reached undetectable levels (Figure 4). Even the three patients who had already developed progressive disease until the first staging after treatment initiation showed an initial decrease of the ctDNA values to zero. However, in two of the three patients, ctDNA values quickly increased again, in line with the progression observed in the first follow-up staging. The third patient displaying early progression showed no ctDNA increase but this patient only developed cerebral progression.
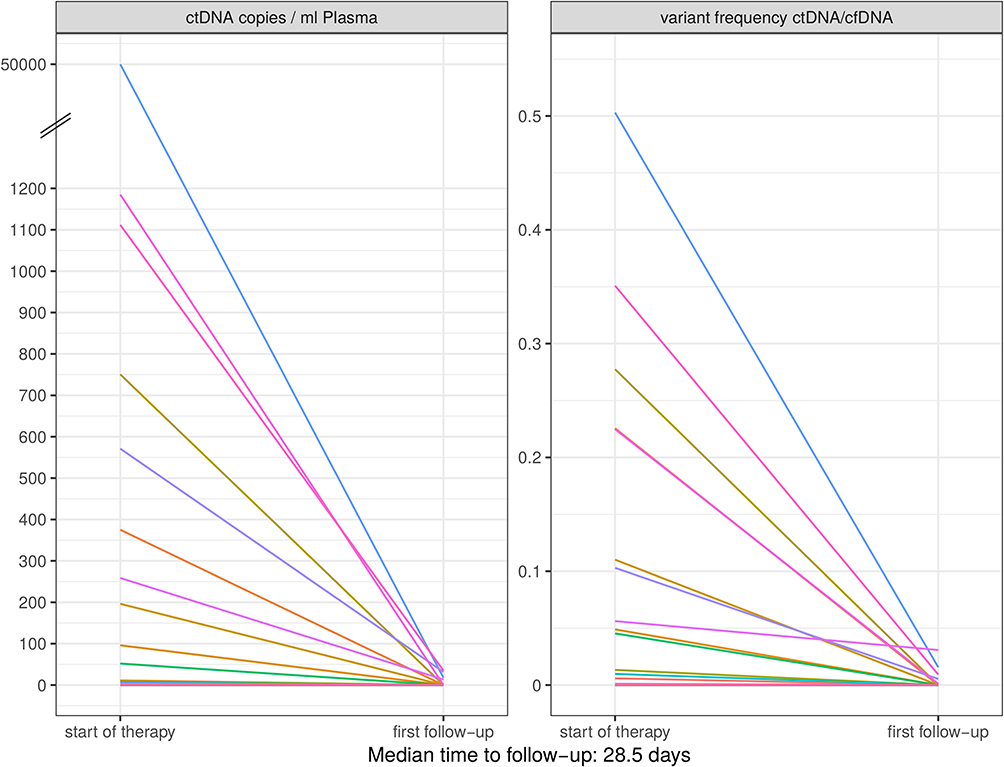 |
Figure 4 Courses of ctDNA under targeted therapy. All patients with detectable ctDNA at the beginning of targeted therapy had declining values (mostly to zero) in the first follow-up. |
Circulating Tumor DNA Correlates with Outcome
Circulating Tumor DNA Correlates with Extracerebral Status but not with Progression Limited to the Brain
In patients who experienced no progressive disease, ctDNA levels remained undetectable throughout targeted therapy and were therefore consistent with outcome (no false positives; Table 3). In patients with extracerebral progressive disease, all but one patient showed also increase of ctDNA when developing progressive disease (PD). It should be noted that the patient without increase at the time of progression was one of the few patients for whom no ctDNA could be detected in the LB at the beginning of therapy, as discussed above (Figure 2).
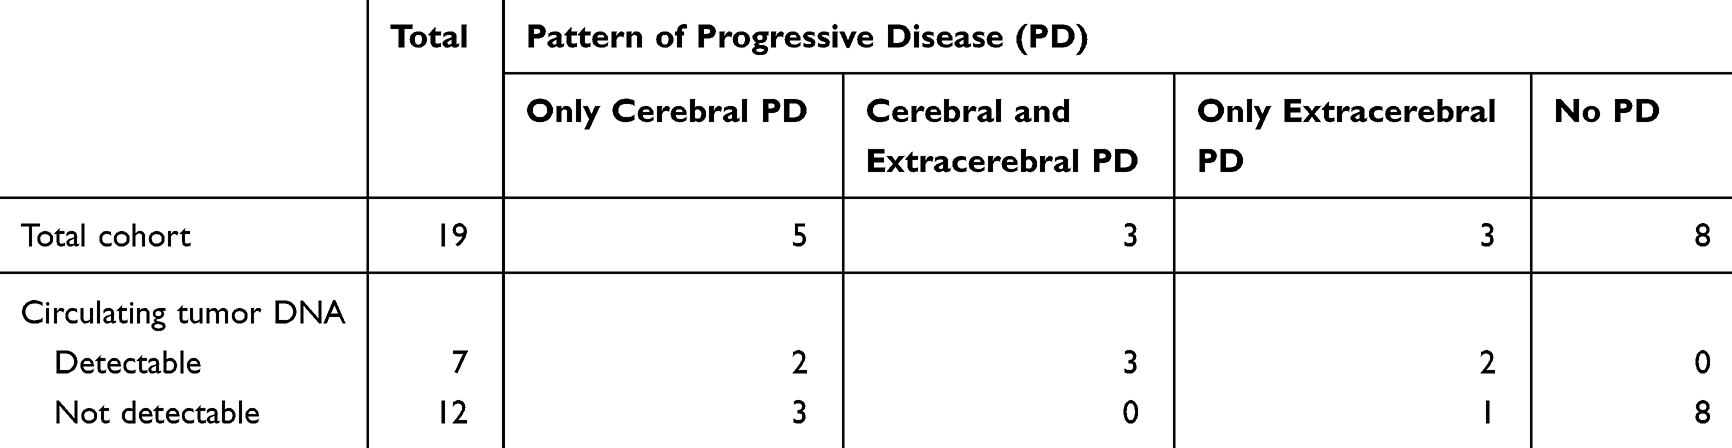 |
Table 3 Pattern of Progressive Disease and Circulating Tumor DNA |
In patients with progression exclusively confined to the brain, ctDNA results were not consistent for 3/5 patients. As an example, we present patient 1. He had an excellent response to treatment but suffered an exclusively cerebral progression and his ctDNA levels did not increase at the time of cerebral progression (Figure 5A). It has to be considered that one of the 3 missed cerebral progressive patients had undetectable ctDNA values at all timepoints, although extracerebral metastasis existed at the time of targeted therapy initiation. The two other patients also had extracerebral metastases at the beginning of the treatment but detectable ctDNA levels, declining to and staying at zero during therapy.
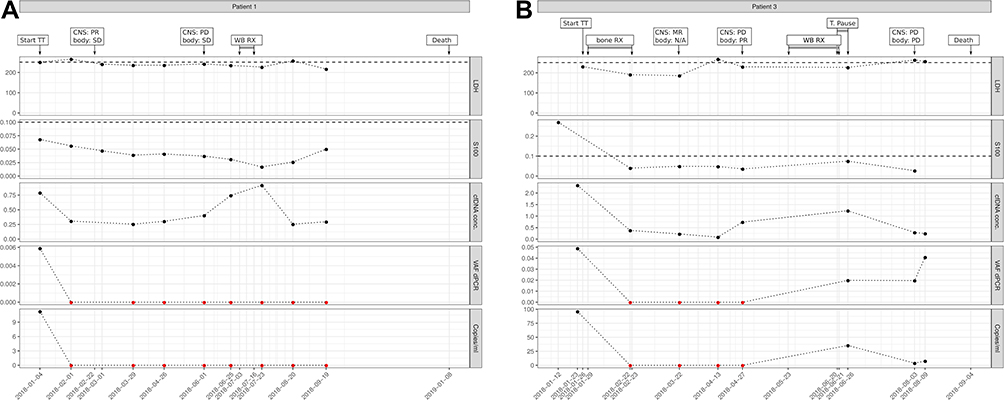 |
Figure 5 Examples of patients with exclusively cerebral progression and no increase of ctDNA at time of progression. (A), representative example. (B), patient with detectable ctDNA levels after whole-brain irradiation. Imaging results shown for central nervous system (CNS) and extra-CNS imaging (body) as MR (mixed response), PR (partial response), PD (progressive disease), SD (stable disease), or N/A (no imaging performed); TT, targeted therapy; RX, radiation therapy; T. pause, treatment pause due to adverse side effects; Copies/mL, number of mutation molecules detected by ddPCR per mL plasma. Total DNA, amount of cell-free DNA isolated; VAF dPCR, allele frequency of mutant allele detected by ddPCR. Red dots indicate undetectable levels, thresholds for S100B and LDH are shown as dashed lines. |
On the other hand, it is remarkable that in 2 of the 5 patients who suffered only from cerebral progression, ctDNA levels increased from zero to nonzero values, although extracerebral disease remained under control.
Remarkably, ctDNA became detectable in one of the previously ctDNA-negative patients after whole-brain irradiation (Figure 5B).
Circulating Tumor DNA Assessment is Superior to LDH and S100B in Detecting Progressive Disease and Might be able to Detect Progression before Radiological Staging
We checked whether LDH and S100B levels were elevated at the time of progression and found that they were often normal (73% and 64%) (Table 4). In contrast, analysis of ctDNA was able to detect all progressive patients with elevated LDH and S100B patients and additionally 4 and 3 progressive patients with normal LDH/S100B levels, respectively. Only 36% of patients had undetectable ctDNA levels at progression, indicating that ctDNA assessment is more sensitive than tumor marker analysis for the detection of progressive disease (ie, lower false-negative rate). On the other hand, among the eight patients without progression, there were four cases with elevated LDH and/or S100B levels (Table 5). Importantly, ctDNA was not detected in any of these eight patients with disease control, indicating that ctDNA analysis is also more specific than tumor marker assessment.
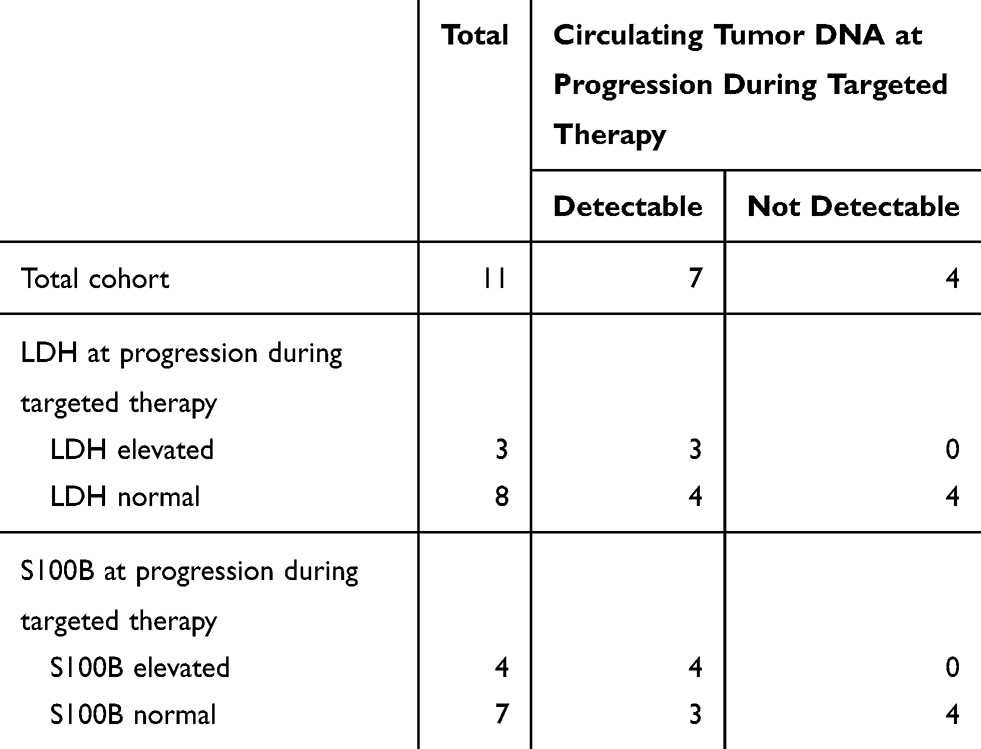 |
Table 4 Circulating Tumor DNA at Progression during Targeted Therapy and LDH, S100B |
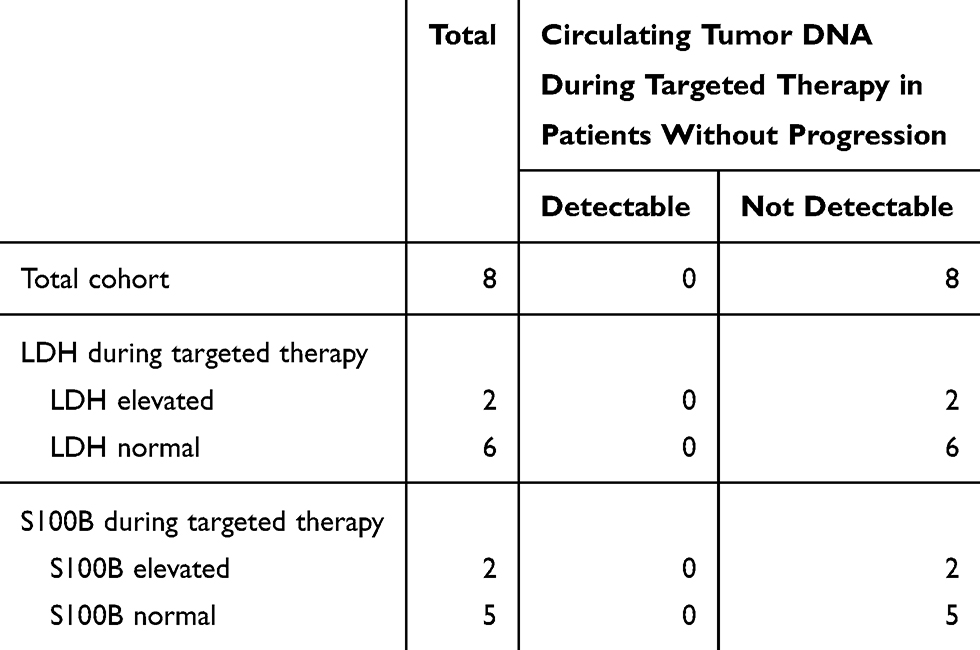 |
Table 5 Circulating Tumor DNA during Targeted Therapy in Patients without Progression and LDH, S100B |
In a few patients, we observed an increase of ctDNA levels a few days before radiological staging revealed progressive disease. As an example, patient 6 started with initially high ctDNA levels, which upon start of targeted therapy fell to zero. S100B also directly fell below the clinical threshold of 0.1, while LDH remained elevated (>250) for some time during treatment (Figure 6A). LB taken one week before staging already revealed increase of ctDNA, while S100B and LDH remained below clinical thresholds. Staging revealed progressive disease and the LB that had been taken on the same day showed further increase in ctDNA levels. In addition, patient 17 started with highly elevated ctDNA levels that recurrently increased about 4 weeks before progression was detected radiologically. Of note, at the time point of the first increase of ctDNA, the patient had been assessed as a partial responder in whole-body computed tomography. Four weeks later the patient again received a staging by PET/CT, and an extensive progression was observed, ctDNA also increased further (Figure 6B).
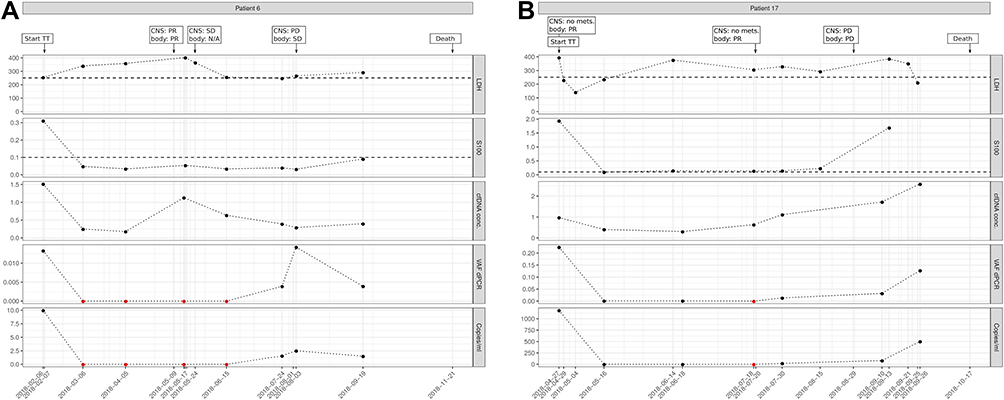 |
Figure 6 Examples of patients with increase of ctDNA levels before radiological staging revealed progressive disease. (A), The patient started with initially high ctDNA levels, which upon start of targeted therapy fell to zero. S100B also directly became normal, while LDH remained elevated (>250) for some time during treatment. A few days before progressive disease was detected radiologically, ctDNA already became detectable. (B), Patient showed ctDNA increase 4 weeks before progression was detected radiologically. Of note, at the time point of the first increase of ctDNA, the patient had been assessed as a partial responder in whole-body computed tomography. Four weeks later the patient again received staging by PET/CT and an extensive progression was observed, while ctDNA also increased further. Imaging results for central nervous system (CNS) and extra-CNS imaging (body) as no mets. (no metastases), PR (partial response), PD (progressive disease), SD (stable disease), or N/A (no imaging performed); TT, targeted therapy; Copies/mL, number of mutation molecules detected by ddPCR per mL plasma. Total DNA, amount of cell-free DNA isolated; VAF dPCR, allele frequency of mutant allele detected by ddPCR. Red dots indicate undetectable levels, thresholds for S100B and LDH are shown as dashed lines. |
Circulating Tumor DNA Correlates with Overall Survival Since Start of Targeted Therapy
We found the clearest survival advantage for those patients who had no detectable ctDNA values in the LB at the start of targeted therapy (p=0.008). None of these patients died during the observation period (Figure 7A–C). Patients whose LDH values were normal at the time of treatment initiation also had a significant survival benefit (p=0.034). Also regarding the S100B value, there was an advantage for those with normal values at start, but the difference was not significant (p=0.074).
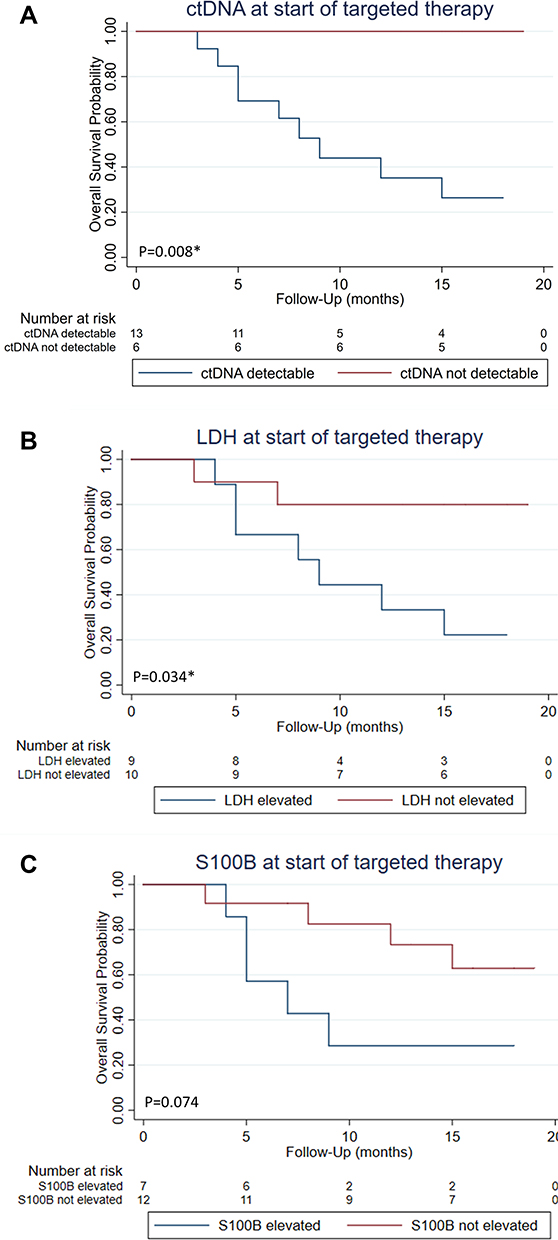 |
Figure 7 Impact of patients’ baseline ctDNA, LDH, and S100B on overall survival since the beginning of targeted therapy. 1Log-rank test; *significant. (A) ctDNA detectable vs ctDNA not detectable p=0.008*1. (B) LDH elevated vs LDH normal p=0.034*1. (C) S100B elevated vs S100B normal p=0.0741. |
Discussion
In this study, we investigated ctDNA levels in patients suffering from metastatic melanoma before and in the course of targeted therapy with BRAF and MEK inhibitors. Comparing the results with conventional tumor marker analysis (LDH, S100B) we could show that ctDNA analysis was more sensitive and specific than tumor marker assessment to detect disease progression. The re-increase of ctDNA correlated in all of our patients with an extracerebral progression, thus indicating a sensitivity of 100%. Concerning exclusively cerebral progression, sensitivity was diminished to 50%, maybe due to an intact blood–brain barrier preventing effective release of tumor DNA in the circulation. Additionally, patients without progression retained always undetectable ctDNA levels during targeted therapy, indicating 100% specificity. Furthermore, we found a significant association of baseline detectable ctDNA and worse overall survival in the course of targeted therapy.
The prognostic impact of detectable baseline ctDNA levels resulting in poorer survival has been demonstrated in a few other studies including melanoma patients treated by BRAF inhibitors.8,9,20 Our results are therefore in line with those of others. Interestingly, the survival difference in our cohort of patients with or without detectable ctDNA baseline levels was more pronounced than those comparing patients with baseline elevated LDH or S100B values to those with normal values. Due to the small number of patients and the fact that all patients with baseline normal LDH also had baseline undetectable ctDNA in the LB, no further statistical analysis such as Cox regression is useful. The superiority of ctDNA over LDH and S100B in melanoma patients under targeted therapy has also been demonstrated by others, although not in terms of survival.21
Most of the ctDNA studies in melanoma patients with targeted therapy focused on the detection of progression during therapy and evaluation of progression-free survival (PFS), resulting in a significant shorter PFS in patients with persistent elevated ctDNA values during therapy without declining to zero.10,11 As all our patients’ ctDNA values dropped to zero upon therapy initiation, we cannot check this in our cohort.
In our cohort, ctDNA was detectable at baseline in 76% (13/17) of the patients that received targeted therapy for unresectable metastases. These results are in line with those of others, reporting detectable ctDNA at the beginning of systemic treatment in 73–84% of the patients.10,12,13,22
In particular, it should be mentioned that in all cases with undetectable baseline ctDNA levels, we additionally performed ultra-deep NGS with duplex molecular barcodes to search for circulating mutations other than BRAF V600 with very high sensitivity. We obtained negative results in all cases. Thus, we speculate that in these patients no tumor-specific variants were detectable in blood. To our knowledge, this was not done in other studies.
In contrast to our results, others reported detectable BRAF V600 mutant ctDNA at the event of progression in 50% of the patients with undetectable ctDNA at the beginning of treatment.10 This was not the case in our study as those who were negative at the start remained negative during the course therapy. We interpret this in the same way as others have already done10 that the tumors of these patients did not have such strong proliferation dynamics or vascularization or simply did not spread into the blood for reasons unknown.
Remarkably, in other studies, 18.5% of extracerebral progressive patients had no increase in ctDNA at the time of progression; thus, LB was not always suitable to detect PD.10 In our study, among patients with initial detectable ctDNA, there were only two patients whose PD was not detectable by means of LB and those suffered exclusively cerebral progressive disease. Interestingly, ctDNA became detectable in a patient with exclusively cerebral progressive disease five days after having completed whole brain radiation. Perhaps this is due to a disintegration of the blood–brain barrier by the radiation. It would be interesting to assess this in further studies. Especially in patients with exclusively cerebral tumor progression but lacking tissue for a mutation analysis, this could offer a chance to take LB during or immediately after radiotherapy, and thus to gain genetic information about the tumor.
Schreuer and colleagues reported a 70% sensitivity of ctDNA for the discovery of progressive disease and 100% specificity.10 Furthermore, 44% of the cases had increasing ctDNA values about 2 months before progression was detected based on other clinical parameters. Others were able to detect PD by means of increasing ctDNA in 83–87% of the cases and even >100 days before radiological assessment.14,21 Concerning the detection rate, our data are even better as all patients with extracerebral progressive disease also had re-increasing ctDNA values. In two patients, the increase of ctDNA preceded radiological progression by one week or one month.
In 26% of the cases (5/19), we observed an exclusively cerebral progress in our patients. The occurrence of an exclusively cerebral progress is particularly observed in targeted therapy. Already several years ago the occurrence of CNS metastases was reported in 20% of patients under vemurafenib therapy.23 It is noteworthy to mention that in 30% of cases, the CNS was the first organ affected by the progression, which corresponds closely to the 26% in our study. Since ctDNA does not appear to be as sensitive in the detection of an exclusively cerebral progression, MRI monitoring of the brain would be highly advisable in addition to monitoring with ctDNA to assess an exclusively cerebral progression as early as possible.
It was interesting to note that we found CDKN2A deletions more frequently in the tumor tissue of progressive patients. All tissue samples of patients with extra-cerebral progression and 50% of patients with exclusively cerebral progression had CDKN2A deletions. CDKN2A is a tumor suppressor gene and genetic alterations of CDKN2A such as deletions are possible resistance mechanisms in a therapy with BRAF and MEK inhibitors.24,25
Finally, it should be noted that the sequencing results of tumor tissue revealed, in addition to BRAF, numerous other genes that could also have been monitored. This point is relevant in view of patients whose tumors do not have a BRAF mutation. In order to be able to conduct ctDNA-based therapy monitoring, for example, during immune checkpoint inhibitor therapy, in such patients, genes other than BRAF must be present. In these cases, it might be necessary to design assays for mutations identified for which no pre-designed assays are available.7
Furthermore, the detection of genes beyond BRAF might even offer the possibility of uncovering resistance mechanisms in the course of targeted therapy.26,27 Therefore, further studies should be carried out in this field of research.
Regarding the limitations of our study, the first point to mention is that the number of patients included in this study is very small, so our results can only be interpreted with caution. Besides the small cohort size, one major limitation of our study may be that LB sampling and radiological stagings were not always performed at the same time. In an ideal study, both LB and imaging would be performed with very short intervals in-between to investigate whether LB can result in earlier detection of progress under therapy.
Furthermore, we only took LB when the patients came to our melanoma outpatient department for routine blood tests. There were patients who had many hours of travel to us and for this reason had their laboratory checks carried out at home from time to time. As a result, we do not have more closely spaced LB controls for some patients, which might have provided valuable information, especially in the weeks before the staging, as to whether a progress can possibly be detected earlier in the LB.
On the other hand, we included a large number of samples. In total, 141 liquid biopsies were evaluated for this work and all patients included in this study had radiological staging to evaluate the treatment response and close-meshed tumor markers S100 and LDH. Furthermore, the baseline negative liquid biopsies were all confirmed by NGS. Thus, our results are of high quality and, despite the relatively small number of cases, have clinical relevance.
Conclusion
Monitoring of ctDNA in daily routine would be desirable, as ctDNA seems to be more sensitive and specific than LDH or S100B in detecting progression under BRAF and MEK inhibitor therapy. Furthermore, detectable ctDNA at the beginning of targeted therapy might be useful as a prognostic tool, indicating poorer survival. However, due to the small number of cases in our study, further studies are necessary.
Data Sharing Statement
The datasets used and/or analyzed during the current study are available from the corresponding author on reasonable request.
Ethic Approval and Informed Consent
Written consent for the participation in the study was obtained from all patients. Furthermore, informed consent was given according to the Gene Diagnostic Law in Germany. The ethics committee of the Ärztekammer Baden-Württemberg and local ethics committee of the Eberhard Karls University approved this study (approval numbers F-2016-010 and 827/2018BO2).
Acknowledgments
Dennis Döcker was involved in conception and design of the study and the initial establishment of ddPCR analyses. We thank the whole team of the melanoma outpatient department for their care for our melanoma patients, Ulrike Keim for preparing the STATA curves, Oliver Bartsch for data management, Günter Jäger for in-depth software review, and the tumor diagnostic team and patients’ office at Practice for Human Genetics for coordinating diagnostic procedures and preparing genetic reports. We are grateful to all patients participating in the study.
Author Contributions
All authors made substantial contributions to conception and design, acquisition of data, or analysis and interpretation of data; took part in drafting the article or revising it critically for important intellectual content; gave final approval of the version to be published; and agree to be accountable for all aspects of the work.
Funding
The study was supported by the German Federal Ministry of Education and Research (BMBF) within the KMU-innovative initiative. AF was supported by the TÜFF Habilitation Program for Women of the Faculty of Medicine Tübingen, Germany, grant no 2521-0-0.
Disclosure
AF served as consultant to Roche, Novartis, MSD, Pierre-Fabre; received travel support from Roche, Novartis, BMS, Pierre-Fabre, received speaker fees from CeGaT, Roche, Novartis, BMS, MSD. CG reports grants and personal fees from Novartis, BMS, Roche, personal fees from MSD, personal fees from Amgen, Philogen, LEO, Incyte, outside the submitted work. SW reports grants from Bundesministerium fuer Bildung und Forschung, during the conduct of the study. DH reports grants from BMBF, during the conduct of the study. TS reports grants from Novartis Pharma GmbH and Pierre Fabre Pharma GmbH, outside the submitted work. FB reports grants from Federal Ministry of Research and Education, Germany, during the conduct of the study. DH, FB, MK, MS, SK, and SW all work for CeGaT GmbH (Tuebingen, Germany). SB is managing director of CeGaT GmbH Tuebingen and owner of Practice for Human Genetics. The authors report no other conflicts of interest in this work.
References
1. Hodis E, Watson IR, Kryukov GV, et al. A landscape of driver mutations in melanoma. Cell. 2012;150:251–263. doi:10.1016/j.cell.2012.06.024
2. Long GV, Stroyakovskiy D, Gogas H, et al. Combined BRAF and MEK inhibition versus BRAF inhibition alone in melanoma. N Engl J Med. 2014;371:1877–1888. doi:10.1056/NEJMoa1406037
3. Flaherty KT, Infante JR, Daud A, et al. Combined BRAF and MEK inhibition in melanoma with BRAF V600 mutations. N Engl J Med. 2012;367:1694–1703. doi:10.1056/NEJMoa1210093
4. Dummer R, Ascierto PA, Gogas HJ, et al. Overall survival in patients with BRAF-mutant melanoma receiving encorafenib plus binimetinib versus vemurafenib or encorafenib (COLUMBUS): a multicentre, open-label, randomised, phase 3 trial. Lancet Oncol. 2018;19:1315–1327. doi:10.1016/S1470-2045(18)30497-2
5. Larkin J, Ascierto PA, Dréno B, et al. Combined vemurafenib and cobimetinib in BRAF-mutated melanoma. N Engl J Med. 2014;371:1867–1876. doi:10.1056/NEJMoa1408868
6. Bronkhorst AJ, Ungerer V, Holdenrieder S. The emerging role of cell-free DNA as a molecular marker for cancer management. Biomol Detect Quantif. 2019;17:100087. doi:10.1016/j.bdq.2019.100087
7. Forschner A, Battke F, Hadaschik D, et al. Tumor mutation burden and circulating tumor DNA in combined CTLA-4 and PD-1 antibody therapy in metastatic melanoma - results of a prospective biomarker study. J Immunother Cancer. 2019;7:180. doi:10.1186/s40425-019-0659-0
8. Knol AC, Vallee A, Herbreteau G, et al. Clinical significance of BRAF mutation status in circulating tumor DNA of metastatic melanoma patients at baseline. Exp Dermatol. 2016;25:783–788. doi:10.1111/exd.13065
9. Gonzalez-Cao M, Mayo-de-Las-Casas C, Molina-Vila MA, et al. BRAF mutation analysis in circulating free tumor DNA of melanoma patients treated with BRAF inhibitors. Melanoma Res. 2015;25:486–495. doi:10.1097/CMR.0000000000000187
10. Schreuer M, Meersseman G, Van Den Herrewegen S, et al. Quantitative assessment of BRAF V600 mutant circulating cell-free tumor DNA as a tool for therapeutic monitoring in metastatic melanoma patients treated with BRAF/MEK inhibitors. J Transl Med. 2016;14:95. doi:10.1186/s12967-016-0852-6
11. Louveau B, Tost J, Mauger F, et al. Clinical value of early detection of circulating tumour DNA-BRAF(V600mut) in patients with metastatic melanoma treated with a BRAF inhibitor. ESMO Open. 2017;2:e000173. doi:10.1136/esmoopen-2017-000173
12. Gray ES, Rizos H, Reid AL, et al. Circulating tumor DNA to monitor treatment response and detect acquired resistance in patients with metastatic melanoma. Oncotarget. 2015;6:42008–42018. doi:10.18632/oncotarget.5788
13. Sanmamed MF, Fernandez-Landazuri S, Rodriguez C, et al. Quantitative cell-free circulating BRAFV600E mutation analysis by use of droplet digital PCR in the follow-up of patients with melanoma being treated with BRAF inhibitors. Clin Chem. 2015;61:297–304. doi:10.1373/clinchem.2014.230235
14. Rowe SP, Luber B, Makell M, et al. From validity to clinical utility: the influence of circulating tumor DNA on melanoma patient management in a real-world setting. Mol Oncol. 2018;12:1661–1672. doi:10.1002/1878-0261.12373
15. Tzanikou E, Haselmann V, Markou A, et al. Direct comparison study between droplet digital PCR and a combination of allele-specific PCR, asymmetric rapid PCR and melting curve analysis for the detection of BRAF V600E mutation in plasma from melanoma patients. Clin Chem Lab Med. 2020. doi:10.1515/cclm-2019-0783
16. Eisenhauer EA, Therasse P, Bogaerts J, et al. New response evaluation criteria in solid tumours: revised RECIST guideline (version 1.1). Eur J Cancer. 2009;45:228–247. doi:10.1016/j.ejca.2008.10.026
17. Johnson DB, Frampton GM, Rioth MJ, et al. Targeted next generation sequencing identifies markers of response to PD-1 blockade. Cancer Immunol Res. 2016;4:959–967. doi:10.1158/2326-6066.CIR-16-0143
18. Whale AS, Devonshire AS, Karlin-Neumann G, et al. International interlaboratory digital PCR study demonstrating high reproducibility for the measurement of a rare sequence variant. Anal Chem. 2017;89:1724–1733. doi:10.1021/acs.analchem.6b03980
19. Huggett JF, Foy CA, Benes V, et al. The digital MIQE guidelines: minimum information for publication of quantitative digital PCR experiments. Clin Chem. 2013;59:892–902. doi:10.1373/clinchem.2013.206375
20. Kozak K, Kowalik A, Gos A, et al. Cell-free DNA BRAF V600E measurements during BRAF inhibitor therapy of metastatic melanoma: long-term analysis. Tumori. 2020;300891619900928.
21. Haselmann V, Gebhardt C, Brechtel I, et al. Liquid profiling of circulating tumor DNA in plasma of melanoma patients for companion diagnostics and monitoring of BRAF inhibitor therapy. Clin Chem. 2018;64:830–842. doi:10.1373/clinchem.2017.281543
22. Stroun M, Lyautey J, Lederrey C, Olson-Sand A, Anker P. About the possible origin and mechanism of circulating DNA apoptosis and active DNA release. Clin Chim Acta. 2001;313:139–142. doi:10.1016/S0009-8981(01)00665-9
23. Peuvrel L, Saint-Jean M, Quereux G, et al. Incidence and characteristics of melanoma brain metastases developing during treatment with vemurafenib. J Neurooncol. 2014;120:147–154. doi:10.1007/s11060-014-1533-z
24. Olbryt M, Piglowski W, Rajczykowski M, Pfeifer A, Student S, Fiszer-Kierzkowska A. Genetic profiling of advanced melanoma: candidate mutations for predicting sensitivity and resistance to targeted therapy. Target Oncol. 2020;15(1):101–113. doi:10.1007/s11523-020-00695-0
25. Wheler J, Yelensky R, Falchook G, et al. Next generation sequencing of exceptional responders with BRAF-mutant melanoma: implications for sensitivity and resistance. BMC Cancer. 2015;15:61. doi:10.1186/s12885-015-1029-z
26. Murtaza M, Dawson SJ, Tsui DW, et al. Non-invasive analysis of acquired resistance to cancer therapy by sequencing of plasma DNA. Nature. 2013;497:108–112. doi:10.1038/nature12065
27. Oellerich M, Schutz E, Beck J, Walson PD. Circulating cell-free DNA- diagnostic and prognostic applications in personalized cancer therapy. Ther Drug Monit. 2018;41:115–120.
 © 2020 The Author(s). This work is published and licensed by Dove Medical Press Limited. The full terms of this license are available at https://www.dovepress.com/terms.php and incorporate the Creative Commons Attribution - Non Commercial (unported, v3.0) License.
By accessing the work you hereby accept the Terms. Non-commercial uses of the work are permitted without any further permission from Dove Medical Press Limited, provided the work is properly attributed. For permission for commercial use of this work, please see paragraphs 4.2 and 5 of our Terms.
© 2020 The Author(s). This work is published and licensed by Dove Medical Press Limited. The full terms of this license are available at https://www.dovepress.com/terms.php and incorporate the Creative Commons Attribution - Non Commercial (unported, v3.0) License.
By accessing the work you hereby accept the Terms. Non-commercial uses of the work are permitted without any further permission from Dove Medical Press Limited, provided the work is properly attributed. For permission for commercial use of this work, please see paragraphs 4.2 and 5 of our Terms.