")
Back to Journals » Diabetes, Metabolic Syndrome and Obesity » Volume 13
Circulating miR-30a-5p and miR-182-5p in Prediabetes and Screen-Detected Diabetes Mellitus
Authors Weale CJ , Matshazi DM , Davids SFG, Raghubeer S , Erasmus RT, Kengne AP , Davison GM, Matsha TE
Received 15 October 2020
Accepted for publication 26 November 2020
Published 21 December 2020 Volume 2020:13 Pages 5037—5047
DOI https://doi.org/10.2147/DMSO.S286081
Checked for plagiarism Yes
Review by Single anonymous peer review
Peer reviewer comments 2
Editor who approved publication: Prof. Dr. Antonio Brunetti
Cecil Jack Weale,1 Don M Matshazi,1 Saarah FG Davids,1 Shanel Raghubeer,1 Rajiv T Erasmus,2 Andre Pascal Kengne,3,4 Glenda Mary Davison,1 Tandi E Matsha1
1SAMRC/CPUT/Cardiometabolic Health Research Unit, Department of Biomedical Sciences, Faculty of Health and Wellness Science, Cape Peninsula University of Technology, Cape Town, South Africa; 2Division of Chemical Pathology, Faculty of Health Sciences, National Health Laboratory Service (NHLS) and University of Stellenbosch, Cape Town, South Africa; 3Non-Communicable Diseases Research Unit, South African Medical Research Council, Cape Town, South Africa; 4Department of Medicine, University of Cape Town, Cape Town, South Africa
Correspondence:Tandi E Matsha
Department of Biomedical Sciences, Faculty of Health and Wellness Science, Cape Peninsula University of Technology, Bellville, Cape Town 7530, South Africa
Tel +27 21 959 6366
Fax +27 21 959 6760
Email [email protected]
Background: microRNAs (miRNAs) have been touted as potential diagnostic and prognostic biomarkers for various diseases. The aim of the present study was to evaluate the diagnostic value of miR-30a-5p and miR-182-5p for prediabetes and screen-detected type 2 diabetes mellitus (T2DM).
Methods: The study included 1270 participants (207 prediabetes, 94 screen-detected diabetes and 969 normotolerant) from the Vascular and Metabolic Health (VMH) study. Whole blood levels of miR-30a-5p and miR-182-5p were quantitated by RT-qPCR. Multivariable logistic regressions were used to relate miRNAs with prediabetes or T2DM and receiver operating characteristic (ROC) curves were used to evaluate the ability of each miRNA to diagnose these conditions.
Results: Both miRNAs were significantly highly expressed in individuals with prediabetes or T2DM (both ≥ 3.2-fold, and p< 0.001). We also observed significant under-expression in T2DM relative to prediabetes for miR-182-5p (0.49-fold, p=0.001). Age, sex and BMI-adjusted partial correlation coefficient analysis revealed a significant correlation between the two miRNAs across glucose tolerance statuses (r≥ 0.932, p< 0.001). In normotolerant individuals, both miRNAs showed a negative correlation with waist circumference and positive correlation with HDL-cholesterol whilst in T2DM they correlated positively with hip circumference, 2-hour insulin, HDL- and LDL-cholesterol. Multivariable logistic regressions revealed both miRNAs to be consistently and continuously associated with prediabetes or T2DM (OR≥ 1.18, 95% 95% CI: 1.10– 1.28, p< 0.001), while only miR-182-5p associated with a reduced prevalence of T2DM relative to prediabetes (OR: 0.89, 95% CI: 0.83– 0.96, p=0.003). In ROC analyses, miR-182-5p almost outperformed HbA1c in diagnosing prediabetes; area under the curve 0.74 vs 0.69.
Conclusion: Our findings demonstrate that miR-30a-5p and miR-182-5p are associated with dysglycaemia and could potentially predict prediabetes, particularly miR-182-5p.
Keywords: Africa, miR-30a-5p, miR-182-5p, diabetes, prediabetes
Background
Despite advances in the understanding of disease progression and related treatments, there has been a steady rise in diabetes mellitus (DM) incidence worldwide, with the global population of people with diabetes expected to increase to 700 million individuals by the year 2045.1,2 Prediabetes is a state of intermediate hyperglycaemia comprising three sub-phenotypes: impaired fasting glucose (IFG), defined as a fasting plasma glucose of 6.1–6.9 mmol/L, impaired glucose tolerance (IGT), defined as a 2-hour plasma glucose of 7.8–11.0 mmol/L after oral glucose tolerance test (OGTT), or the combination of both.3 Effective intervention for the prevention of progression from prediabetes to type 2 diabetes (T2DM) requires accurate diagnostic tools. Single-stranded noncoding microRNAs (miRNAs) in various metabolic disorders, especially T2DM, have drawn widespread attention as potential biomarkers.4–7 These miRNAs are present in various tissues, including extracellular fluids such as plasma, saliva or urine, and are highly stable since they are protected from RNAse degradation.8
Since their discovery over twenty years ago, miRNAs have been proven to play a pivotal role in the pathophysiology of several diseases, including T2DM, and altered miRNA expression profiles are observed in a range of different diseases.8 More recently, numerous additional miRNAs have been recognized as components of pathways triggered by, or contributing to, the pathology of both type 1 diabetes mellitus as well as T2DM.9,10 Amongst these, miR-30a-5p and miR-182-5p have been shown to play a role in regulatory pathways involved in cardiovascular disease (CVD) and DM.11–13 Both miRNAs have also displayed dysregulation in hyperglycaemic individuals.14 Comprehensive analysis of specific miRNA signatures may shed light on the complex mechanisms involved with the progression of DM. Therefore, in this study, we aimed to investigate the expression of these two miRNAs across glucose tolerance status in a South African population previously reported to have a high prevalence of undiagnosed diabetes.15
Methods
Ethical Approval of the Study
This study was based on the Cape Town Vascular and Metabolic Health (VMH) project, which has been approved by the Cape Peninsula University of Technology Research Ethics Committee, as well as the Stellenbosch University Research Ethics Committee (respectively, NHREC: REC – 230 408–014 and N14/01/003). For this sub-study, ethical clearance was also sought from, and granted by the CPUT Research Ethics Committee (CPUT/HW– REC 2019/H3). The investigation was carried out in accordance with the Code of Ethics of the World Medical Association (Declaration of Helsinki 2013). All participants provided informed written consent.
Study Population and Study Design
This was a cross-sectional study, in which quantitative methods were used to investigate the expression of miRNAs in a total of 1270 subjects: 207 prediabetes, 94 screen-detected diabetes and 969 normotolerant individuals. Participants in the VMH study were enrolled between 2014 and 2016, from Bellville South community in Cape Town, South Africa. Participants without prior diabetes underwent an OGTT, and diagnosed as either normortolerant, pre-diabetes, or screen-detected diabetes, in accordance with World Health Organization (WHO) guidelines.16 Other study procedures which included anthropometric and blood pressure measurements were described in detail previously.17 Blood glucose, HbA1c, insulin, lipids, ultra-sensitive C-reactive protein (us-CRP) and serum cotinine levels were acquired in a routine pathology laboratory.
MicroRNA Quantification by Real-Time Quantitative-Polymerase Chain Reaction (RT q-PCR)
MicroRNA was isolated from whole blood that had been collected in a Tempus RNA tube (Applied Biosystems) using the MagMax Total RNA isolation kit (ThermoFisher Scientific) according to the manufacturer’s instructions. This was then converted to cDNA using the TaqMan MicroRNA Reverse Transcription Kit (Life Technologies, USA) then diluted 1:10 before determining the expression levels by TaqMan miRNA Assay primers on the QuantStudio 7 Flex real-time PCR instrument (Life Technologies, USA) as per manufacturer’s instructions. Data were obtained as Ct values and normalised to an endogenous control (miR-16 5p). The 2−ΔCt method was used to assess the miRNA expression level in each sample whilst the 2−ΔΔCt value was used as the measure of the miRNA expression in each sample analysed compared with control.18
Statistical Analysis
Analysis of data was performed using SPSS v.25 (IBM Corp, 2011). Count (and percentages), mean (and standard deviation) or median (25th-75th percentiles) were used to summarise variables. Baseline characteristics across glucose tolerance subgroups were compared using the chi square test, analysis of the variance (ANOVA), and Kruskal–Wallis test. Spearman’s partial correlations adjusted for age, sex and body mass index (BMI) was performed to assess the relationship between the miRNAs and other variables. Multivariable logistic regression models were used to evaluate the association of the miRNAs with prediabetes or screen-detected DM, with crude or adjusted odds ratio (OR). The area under the receiver operating characteristic curve (AUC) was used to assess and compare the ability of each miRNA to predict the presence of prediabetes or DM. A p-value <0.05 was used to characterize statistically significant results.
Results
Descriptive Characteristics of Participants
The basic characteristics according to sex are summarized in Table 1. In all, 924 (72.8%) of participants were women and were significantly older than men, mean age 49 versus 46 years, p=0.002. Women had significantly higher BMI, waist and hip circumferences compared to their men counterparts (all p<0.001). Fasting blood glucose, glucose 2-hour glucose, HbA1c, and insulin were all significantly higher in women (all of which, p≤0.001). Lipid variables (HDL and LDL cholesterol) were also significantly higher in women in comparison to men (both p<0.001). The expression levels of the miRNAs did not differ significantly by sex.
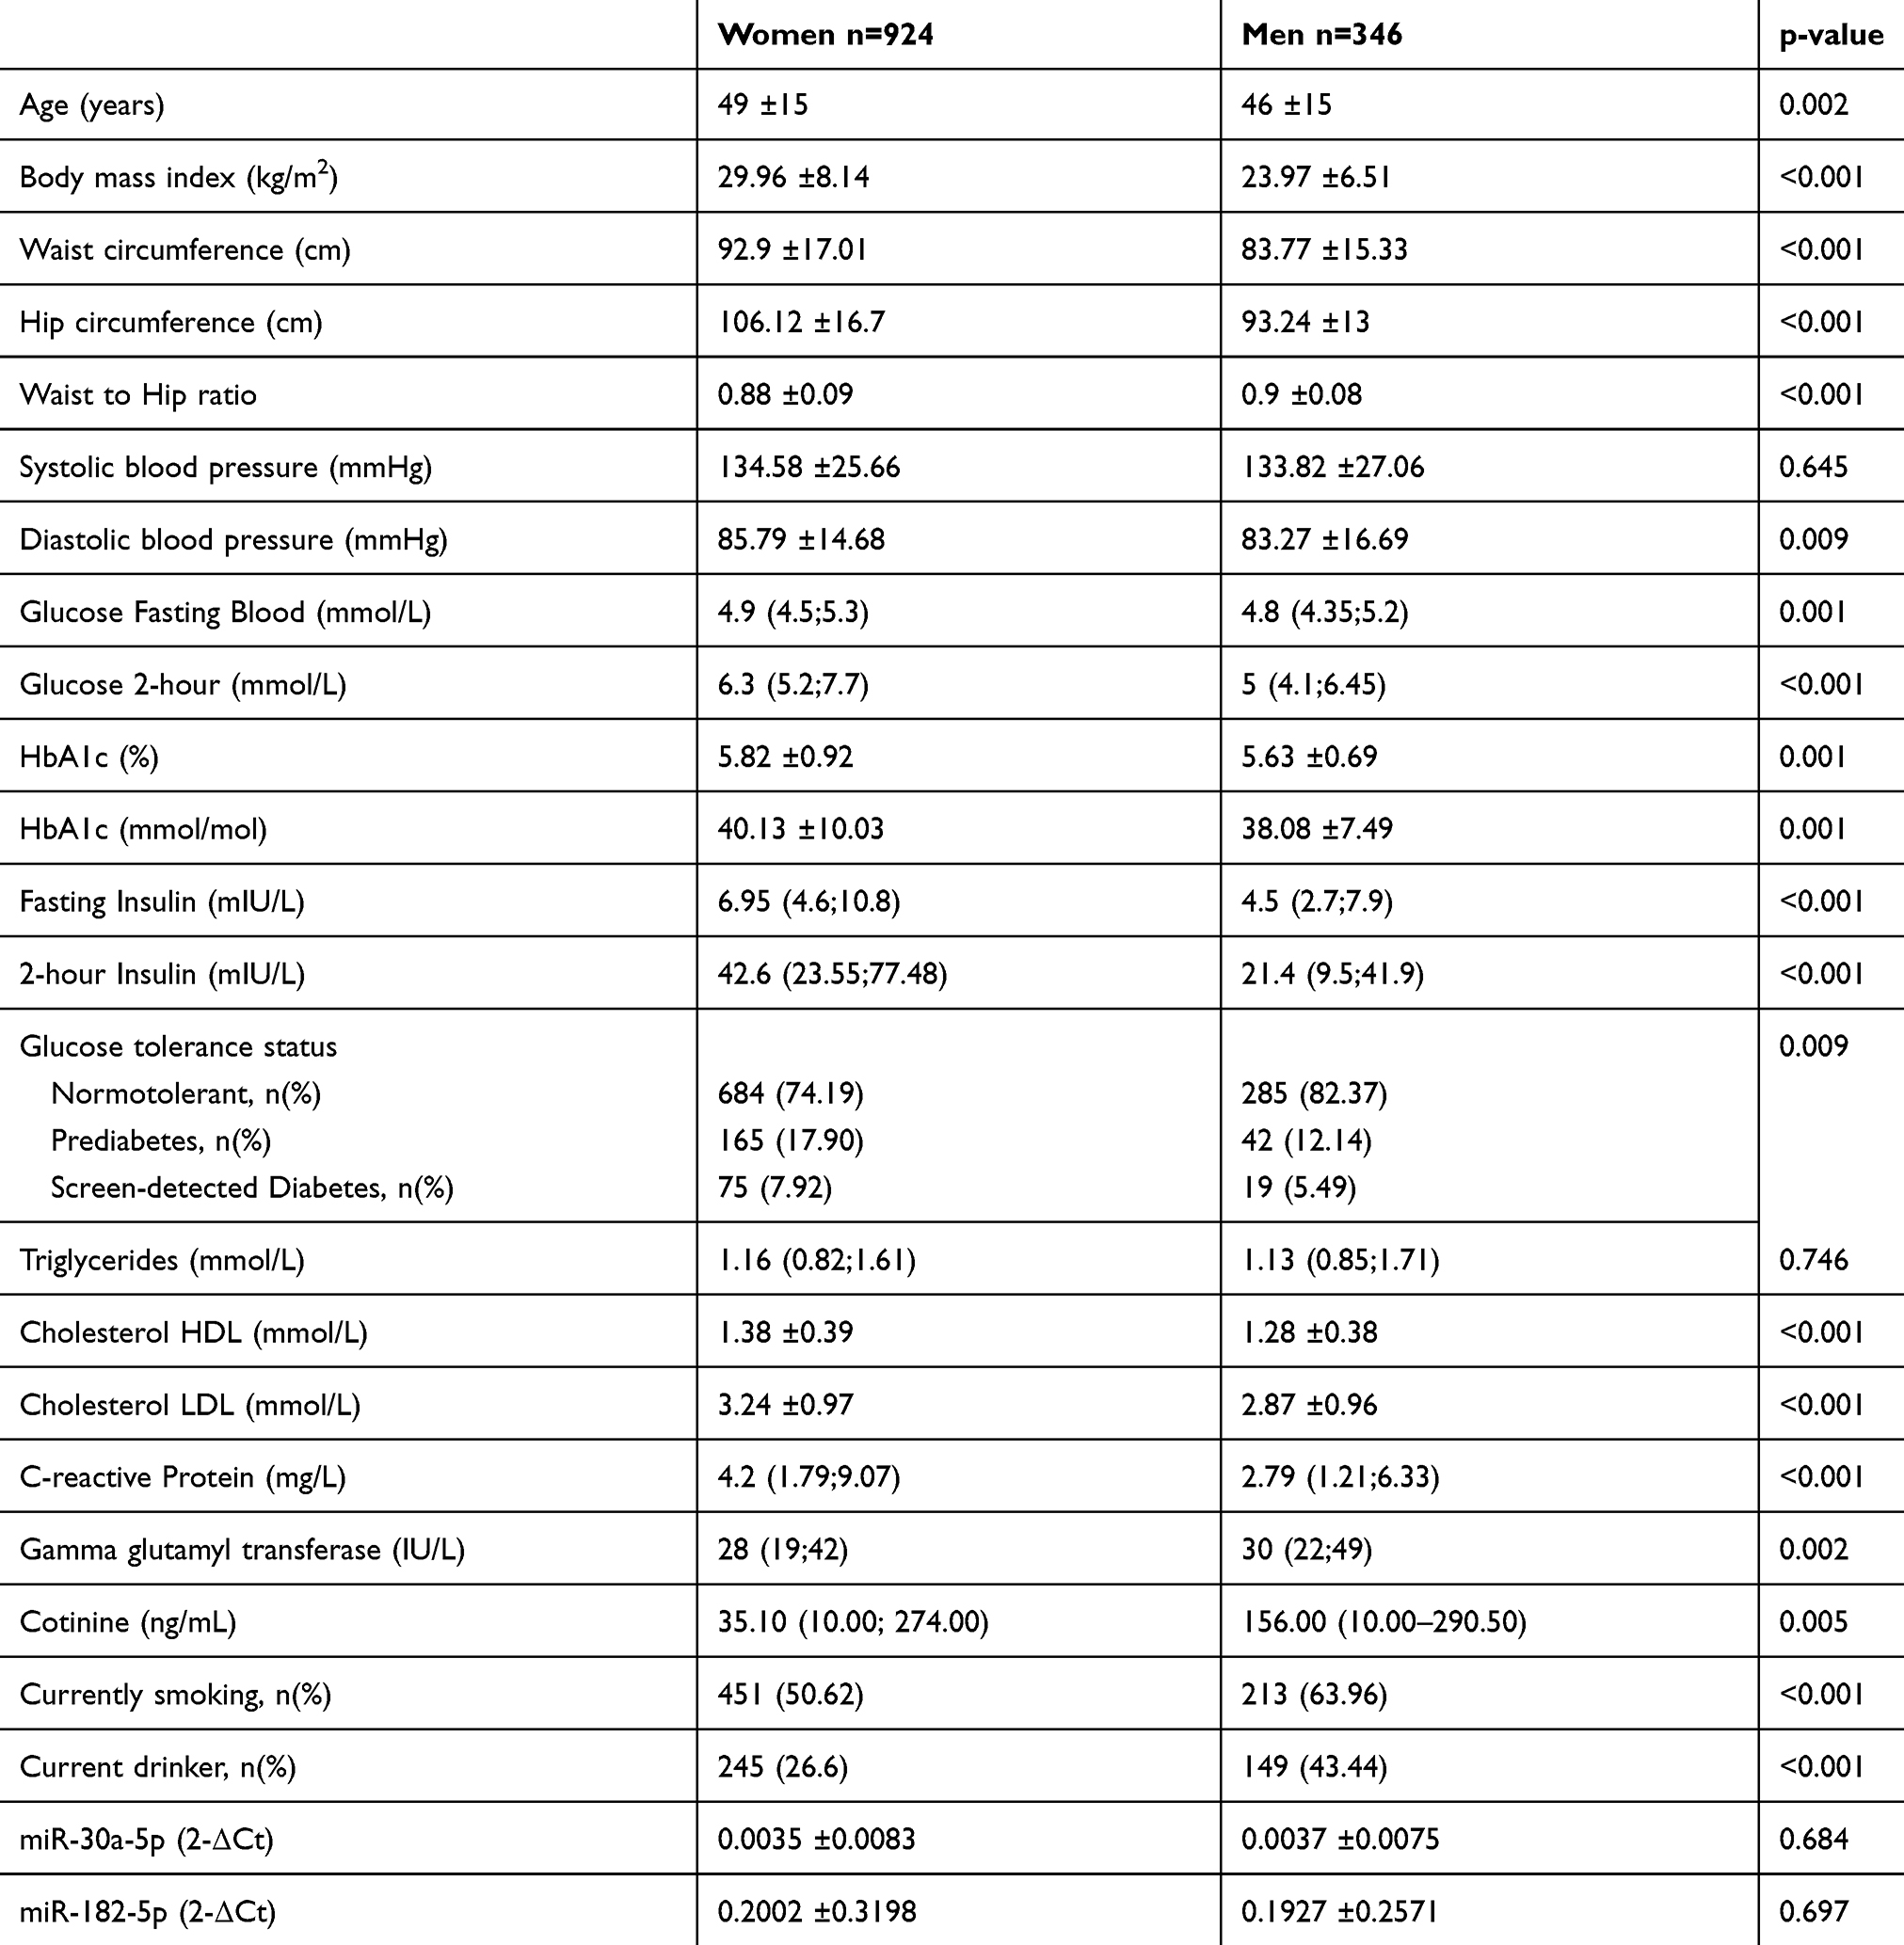 |
Table 1 Characteristics of the Study Participants |
Relative Expression of miR-30a-5p and miR-182-5p
The relative expression of miRNAs 30a-5p and 182–5p is illustrated in Figure 1. The expression levels of both miRNAs were markedly elevated in prediabetes and diabetes when compared with normotolerants, as well as in prediabetes compared to diabetes. miR-30a-5p was significantly upregulated in prediabetes versus NGT by 3.5-fold (p<0.001), whilst miR-182-5p was upregulated by 3.2-fold, p<0.001. Both miRNAs showed decreased expression in diabetes when compared to prediabetes (both ≤0.58-fold), however this under-expression was significant for miR-182-5p (0.49-fold, p=0.001), but not for miR-30a-3p (0.58-fold, p=0.097).
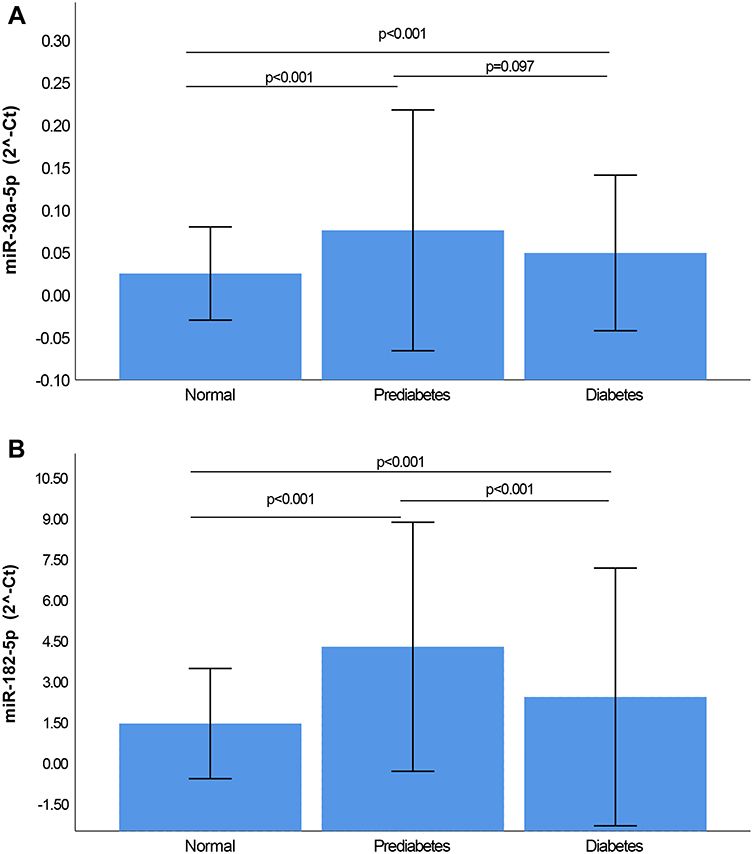 |
Figure 1 Relative Expression of miR-30a-5p (A) and miR-182-5p (B) according to glycaemic status. Normalization was relative to the expression of miR-16-5p. All Data is shown as mean ± standard deviation (SD). |
Partial Correlations Between miR-30a-5p and miR-182-5p and Biochemical Characteristics According to Glycaemic Status
Partial correlation coefficient analysis, adjusted for age, sex and BMI was performed to examine the link between miRNAs 30a-5p and 182–5p and other clinical variables. A significant positive correlation was observed between miR-30a-5p and miR-182-5p, across all glycaemic statuses (r≥0.932, p<0.001). In normotolerant individuals, miR-30a-5p and miR-182-5p showed a negative correlation with the waist circumference (r>-0.470, p≤0.042) and positive correlation with HDL-cholesterol (r≥0.527, p≤0.020). In individuals with prediabetes, only miR-30a-5p showed a positive correlation with LDL-cholesterol (r=0.460, p=0.048), whilst in newly diagnosed diabetes, both miRNAs correlated positively with hip circumference, 2-hour insulin, HDL- and LDL-cholesterol. In addition, miR-30a-5p also showed positive correlations with systolic and diastolic blood pressures, and Gamma GT (Table 2).
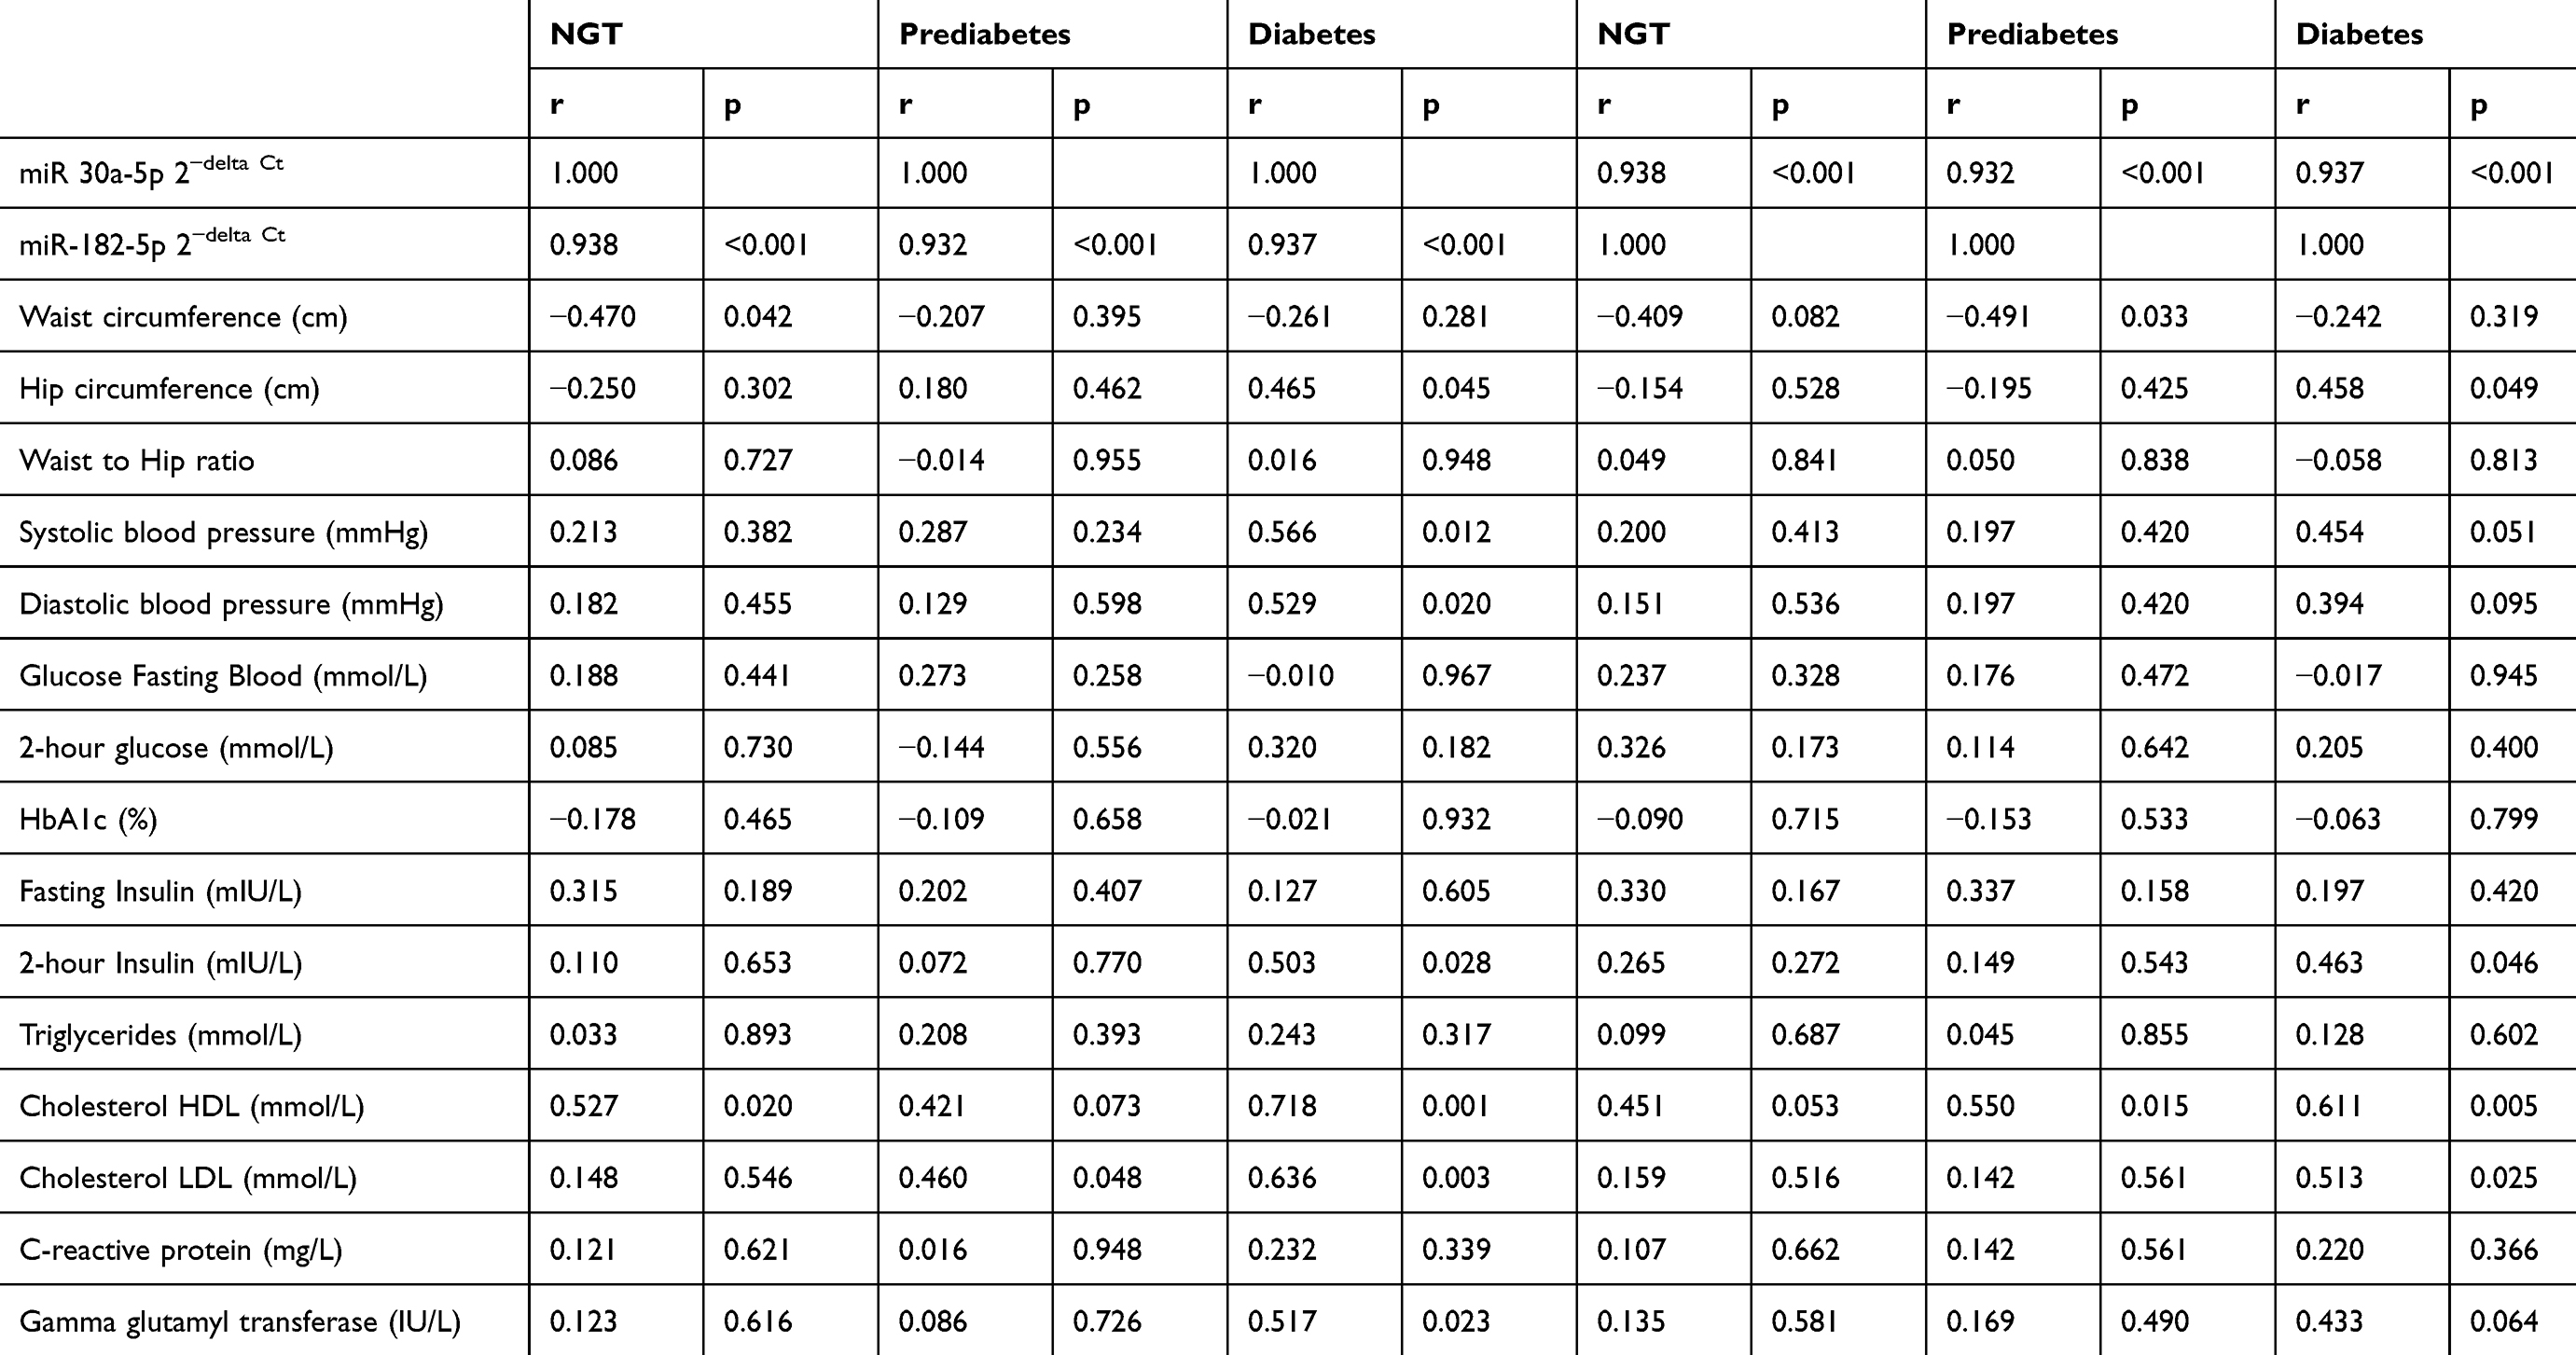 |
Table 2 Partial Correlation Coefficients Adjusted for Age, Gender and Body Mass Index for miR 30a-5p and miR-182-5p and Other Biochemical Parameters |
Multivariable Regression Analysis
When the normotolerant control was used as the reference group, it was observed that both miR-30a-5p and miR-182-5p were significantly associated with prediabetes and diabetes. In the crude model, for prediabetes the odds ratio (OR) was 2.24 (95% CI: 1.77–2.83 (p<0.001)) in relation with miR-30a-5p and 1.33 (1.25–1.40, p<0.001) in relation with miR-182-5p. For diabetes, the crude OR were 1.87 (1.40–2.50) in relation with miR-30a-5p and 1.18 (1.10–1.28) in relation with miR-182-5p. These significant associations remained when the models were adjusted for age, sex, BMI, systolic blood pressure, HbA1c, triglycerides, HDL-cholesterol and LDL-cholesterol. When the models were repeated with prediabetes as reference, only miR-182-5p was significantly associated with a reduced prevalence of diabetes (OR: 0.89, 95% CI: 0.83–0.96, p=0.003) in the crude model, and this association remained significant in multivariable models (all p<0.05; Table 3).
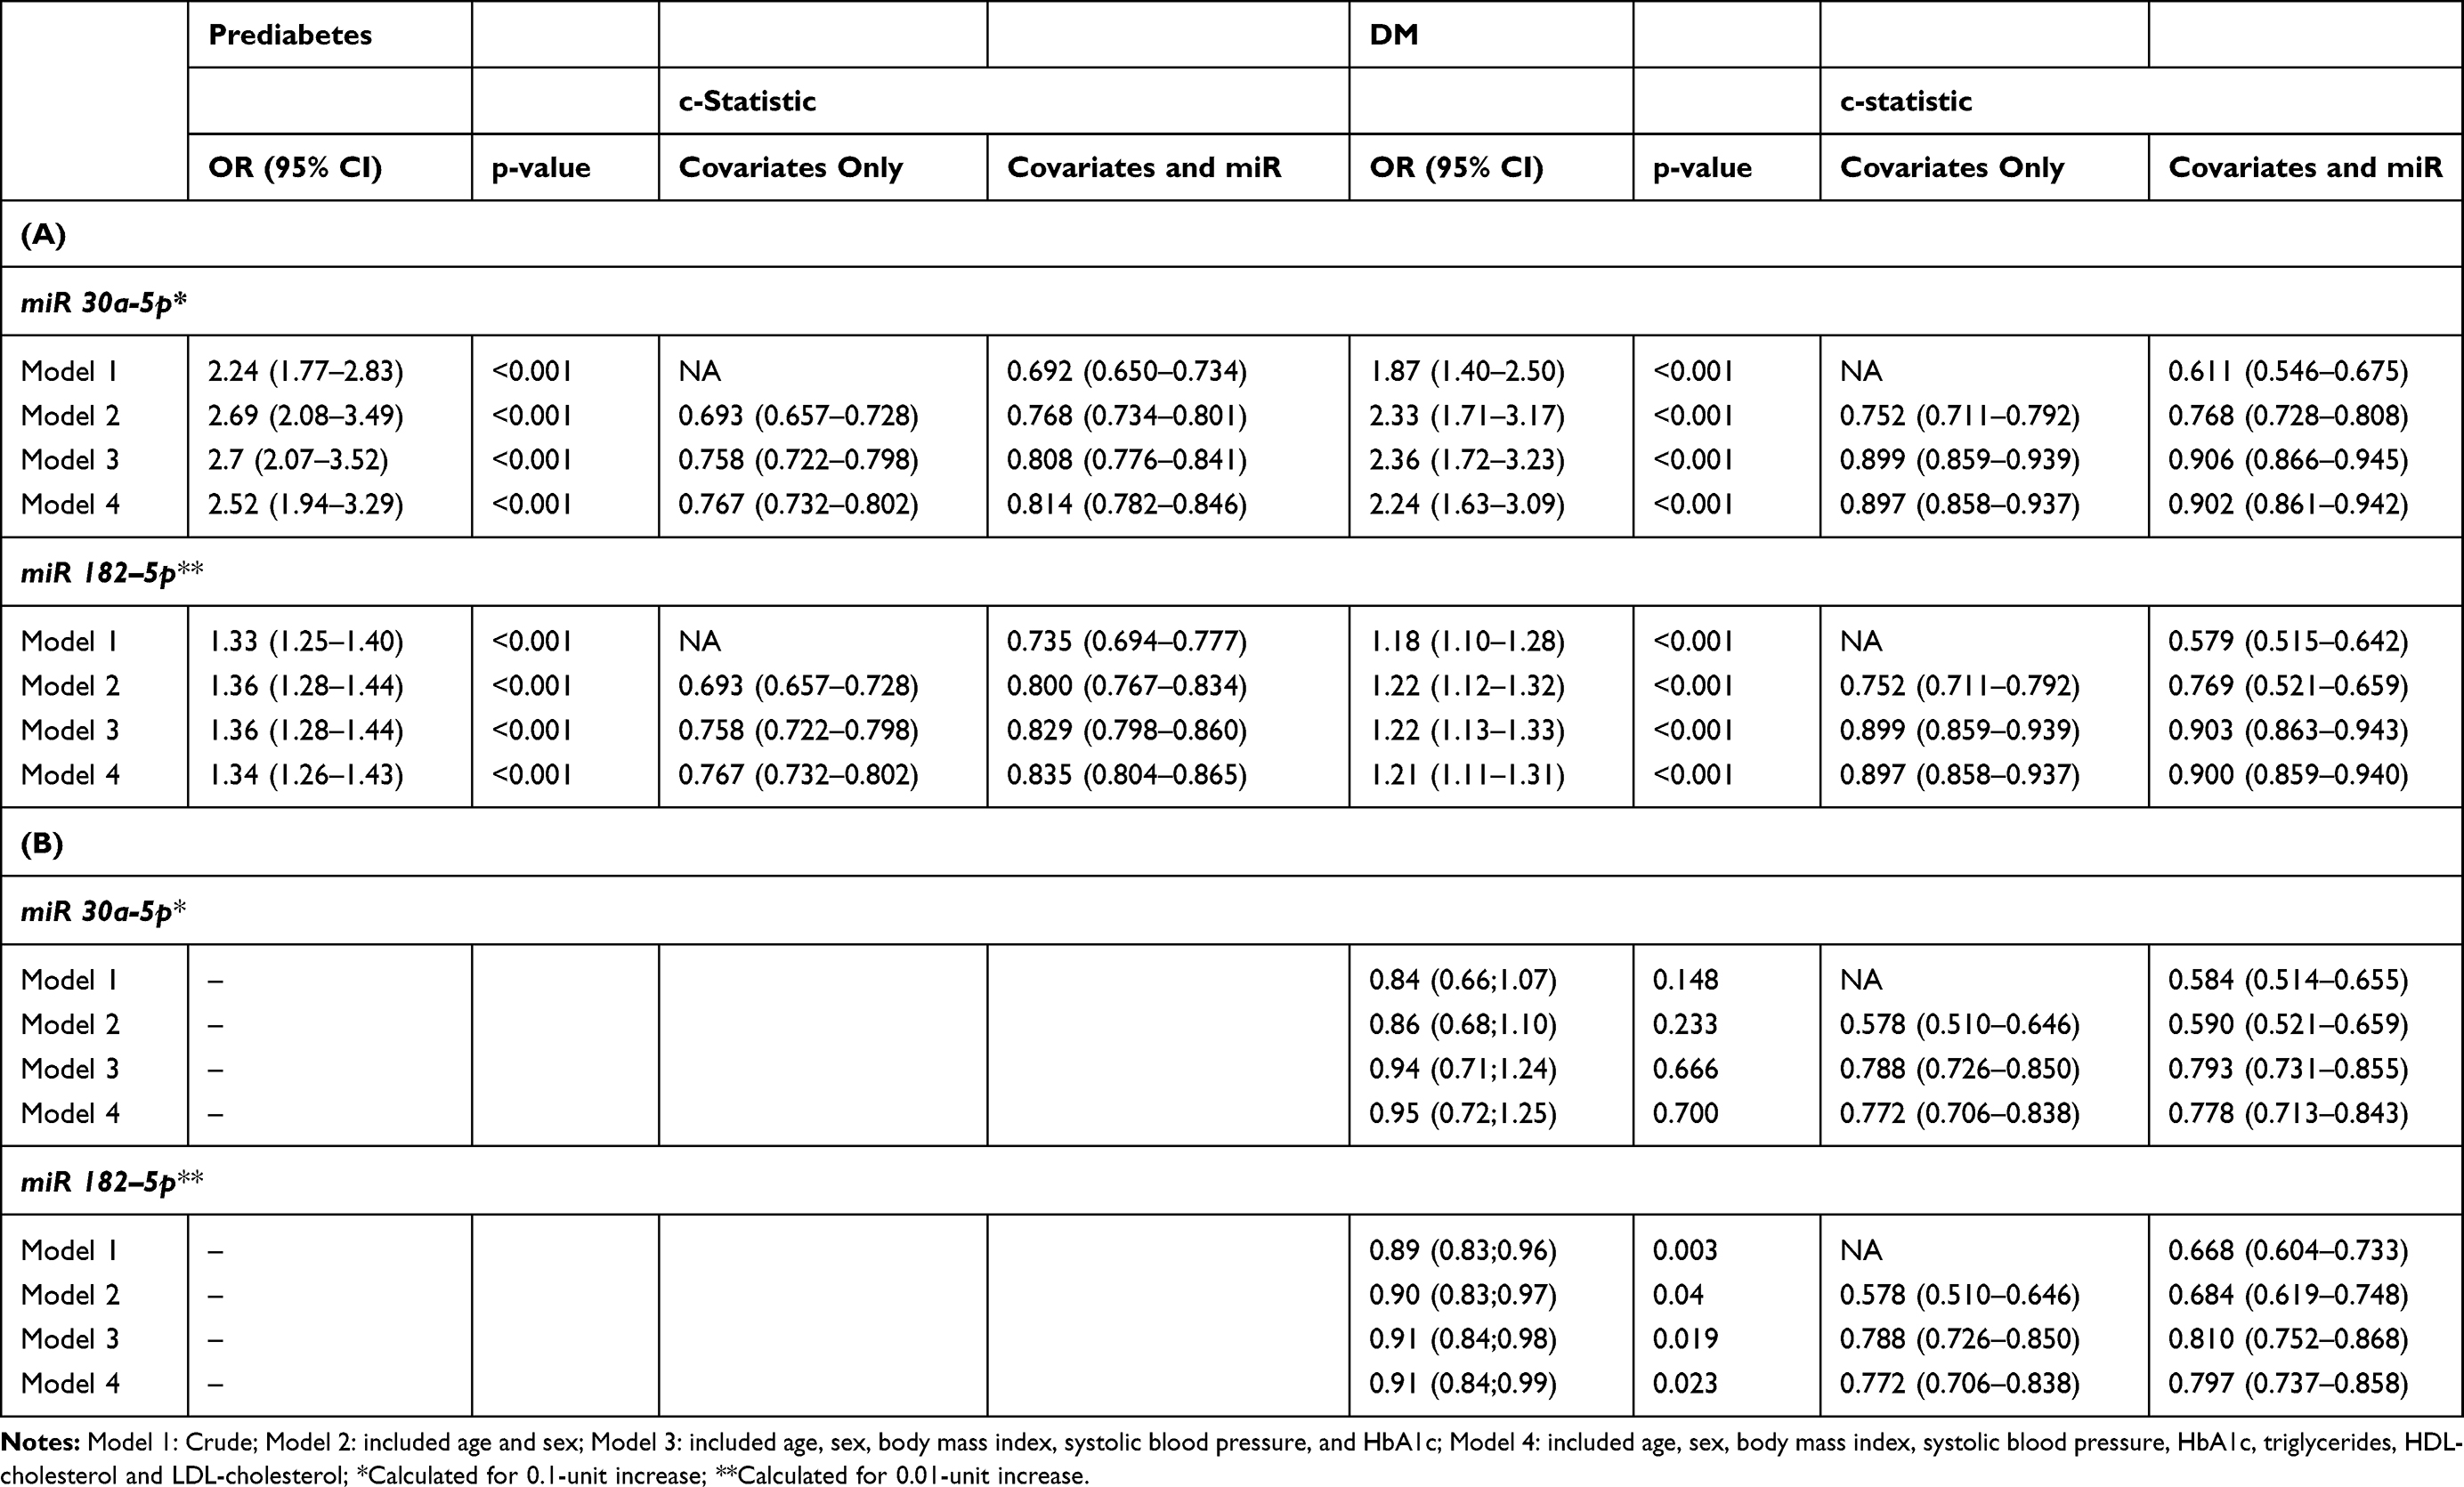 |
Table 3 (A) Multivariable Regression Analysis of miRNAs for the Presence of Prediabetes and Diabetes (B) Multivariate Regression Analysis of miRNAs for the Development of T2DM |
Diagnostic Performance of the miRNAs for Prediabetes and Diabetes
Figure 2A and B show that both miRNAs could acceptably discriminate prediabetes or dysglycaemia (combination of diabetes and prediabetes) from normal glucose tolerance with miR-182-5p outperforming HbA1c for prediabetes diagnosis, AUC of 0.74 for miR-182-5p, compared to 0.69 for HbA1c (p=0.217) which was also similar for miR-30a-5p. With regards to discriminating diabetes, the miRNAs performed poorly, AUC’s ≤ 0.61 (Figure 2C). In addition, we examined whether the miRNAs could act as markers to potentially discriminate between prediabetes and diabetes and found that these performed poorly, AUCs ≤ 0.41 (Figure 2D).
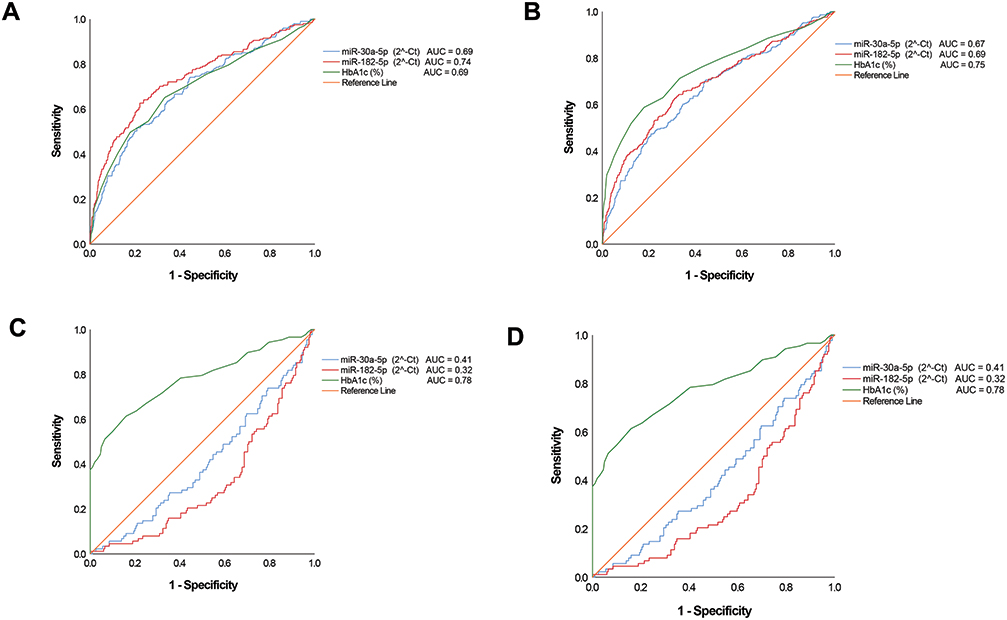 |
Figure 2 Receiver operating characteristic (ROC). ROCs were constructed for each miRNA and HbA1c to evaluate the diagnostic values for prediabetes, screen-detected diabetes, the combination of both (dysglycaemia) as positive cases and normotolerant as negative cases, as well as for diabetes as positive cases and prediabetes as negative cases. (A) Prediabetes versus normotolerant. (B) Dysglycaemia versus normotolerant. (C) newly diagnosed diabetes versus normotolerant. (D) screen-detected diabetes versus prediabetes. For this figure panel, the reverse levels of miRNA were used to account for their declining levels from normal glucose tolerance to diabetes, and accordingly obtaining ROC above the diagonal line of “no-discrimination”. |
C-statistics for the discriminatory power of regression models to predict prediabetes and diabetes are shown in Table 3, for model with covariates only, and for models with covariates and miRNA of interest. Discrimination of models always improved when miRNA were added to models with covariates only. For instance, the model containing age, sex, body mass index, systolic blood pressure, HbA1c, triglycerides, HDL-cholesterol and LDL-cholesterol had a c-statistic of 0.767 (0.732–0.802) for the prediction of prediabetes. This increased to 0.814 (0.782–0.846) and 0.835 (0.804–0.865) when miR-30a-5p and miR-182-5p were respectively added to the model.
Discussion
In this study, the profile of circulating miR-30a-5p and miR-182-5p was determined in 1270 peripheral blood mononuclear cell (PBMC) samples from individuals with prediabetes, screen-detected diabetes and normal glucose tolerance. Both miRNAs were markedly upregulated in prediabetes compared to normotolerant by more than 3-fold. Similarly, in screen-detected diabetes, the miRNAs were upregulated compared to normotolerants, but significantly downregulated versus prediabetes. The two miRNAs were significantly correlated with each other, as well as with HDL-cholesterol in age, sex and BMI adjusted analysis. In the prediabetic group, miR-30a-5p exhibited a significant positive correlation with LDL-cholesterol, and additionally, in newly diagnosed diabetes, both miRNAs showed positive correlations with LDL-cholesterol, as well as systolic and diastolic blood pressures. In multivariable logistic regression analysis both miRNAs were associated with prediabetes or screen-detected diabetes; however, only miR-182-5p was associated with reduced prevalent diabetes when prediabetes was used as a reference. Furthermore, miR-182-5p was superior to miR-30a-5p and HbA1c in discriminating between prediabetes and normal glucose tolerance, AUC, 0.74 and 0.69, respectively. Finally, the discrimination of regression models to predict diabetes and prediabetes was enhanced when miRNAs were added to models with covariates only.
Studies have established links between miRNAs 30a-5p and 182–5p and CVD.11,12 An investigation into possible diagnostic biomarkers for unprotected left main coronary artery disease (uLMCAD) revealed overexpression of circulating miR-182 in uLMCAD patients, compared to patients without coronary artery disease (CAD).19 In confluence, our study also illustrated similar associations with markers of CVD. Of all lipoproteins comprehensively studied to be involved in CAD risk, LDL-cholesterol has been the chief target for preventive strategies.20 In our investigation, miR-30a-5p exhibited a significant positive correlation with LDL-cholesterol in the prediabetic group, and both miRNAs showed positive correlations with LDL-cholesterol in newly diagnosed diabetes. Additionally, in newly diagnosed diabetes both miRNAs displayed positive correlations with systolic and diastolic blood pressures. Microvascular rarefaction, which is the loss of terminal blood vessels, is consistent with hypertension.21,22 The miR-30 family have been revealed to play a role in the regulation of arteriolar branching, and subsequent arteriole blood pressure.22 Furthermore, the miR-30 family have been linked with CVDs and have been proposed to act as predictors for acute myocardial infarction (AMI).11 Therefore, the correlations found between both miRNAs and CVD markers not only corroborate findings from other independent studies, but further promote a possible relationship with CVD risk assessment.
Human studies have suggested that altered miRNA patterns probably precede or appear at the early stages of diabetes.23–25 For instance, in a cohort of children with different durations of T1DM, levels of miR-454-3p were significantly elevated in children diagnosed during the first 42 days compared to those with longer diagnosed duration of the disease.24 In our study, both miR-30a-5p and miR-182-5p were elevated in prediabetes and screen-detected diabetes, however, the increase was more pronounced in those with prediabetes. Similar to our findings, miR-182-5p was shown was shown by Karolina and coworkers to be down-regulated in T2DM and slightly upregulated in subjects with impaired fasting glycaemia.26 Karolina et al reported miR-182 to be a potential modulator of FOXO1, with upregulation displayed in impaired fasting glycaemia. Downregulation of the FOXO1 messenger RNA (mRNA) in impaired fasting glycaemia was observed, with an upregulation in T2DM.26 FOXO proteins are major targets of insulin action, with FOXO1 mRNAs playing a key role in mediating the effects of hepatic insulin resistance (IR) signalling, by promoting glucose production.27 These findings suggest potential hepatic gluconeogenesis to have a compensatory reduction in impaired fasting glycaemia, whilst increased in T2DM.26 Additionally, high levels of miR-30a-5p were observed, and have been associated with a higher risk of T2DM development.13 Similar to our findings, the CORPIOPREV longitudinal study described elevated levels of miR-30a-5p in prediabetic subjects compared to normotolerant individuals, and that levels rose several years before the development of diabetes.13 In another study conducted by Kim et al, miR-30a-5p was shown to mediate beta-cell dysfunction induced glucotoxicity by suppressing Beta2/NeuroD gene expression in rats, and over-expression led to pancreatic beta-cell dysfunction.28 Persistent exposure of pancreatic beta-cells to elevated glucose levels results in the subsequent inhibition of glucose-induced insulin secretion, insulin gene expression impairment, as well as induced beta-cell death.29 Consequently, the inhibition of miR30a-5p in this animal model was shown to exhibit a protective effect on pancreatic islets and improved glucose tolerance.28
Despite the introduction of HbA1c in the diagnosis of prediabetes and diabetes, it has not improved the identification of these conditions due to various factors such as differences in ethnic thresholds, haemoglobinopathies and anaemia.30 Thus, the development of new biomarkers that would allow early and confident identification of patients is desirable. In this regard, circulating miRNAs that are known to be robust and stable in human body fluids have led to their investigation as potential biomarkers in many pathologies including DM. In our study, we have shown that the increased circulating levels of miR-30a-5p and miR-182-5p in whole blood have the potential to predict these conditions. However, when comparing the AUC of the ROC curves, we observed that these miRNAs performed poorly in predicting diabetes, but miR-182-5p exhibited greater potential to predict prediabetes. The AUC of miR-182-5p was higher than that of HbA1c for prediabetes, illustrating the diagnostic potential the miRNA possesses for intermediary glycaemic statuses. However, this diagnostic capability was inferior to that of HbA1c for screen-detected diabetes, and dysglycaemia as a whole. Nevertheless, our findings suggest that miR-182-5p has a potential use in clinical practice, as no known interferences with haemoglobinopathies or anaemia have been reported. Indeed, miR-30a-5p and miR-182-5p improved the predictive power of models based upon clinical or biochemical parameters for the outcome of prediabetes or diabetes.
A strength of this study is the large sample-size used compared to other studies, however, limited by the disproportionate representation of women versus men. Total RNA used for miRNA expression analysis was extracted from whole blood, while other studies used serum/plasma. Expression levels may vary between different tissue types, ultimately limiting accurate comparisons with studies that have used different tissues.
Conclusions
In conclusion, our study has revealed an important association between both miRNAs, more so miR-182-5p, and prediabetes and their potential ability to significantly discriminate prediabetes from normoglycaemia. Furthermore, our findings suggest that these miRNAs added to the predictive power of other known risk markers to predict diabetes or prediabetes. This discovery warrants validation in other study settings, to sanction the use of this miRNA in glucose tolerance screening, for risk estimation and classification.
Abbreviations
miRNAs, microRNAs; DM, diabetes mellitus; IFG, impaired fasting glucose; IGT, impaired glucose tolerance; OGTT, oral glucose tolerance test; T2DM, type 2 diabetes; CVD, cardiovascular disease; VMH, Cape Town Vascular and Metabolic Health; WHO, World Health Organization; us-CRP, ultra-sensitive C-reactive protein; ANOVA, analysis of the variance; BMI, body mass index; OR, odds ratio; AUC, receiver operating characteristic curve; PBMC, peripheral blood mononuclear cell; uLMCAD, unprotected left main coronary artery disease; CAD, coronary artery disease; AMI, myocardial infarction; mRNA, messenger RNA; IR, insulin resistance.
Data Sharing Statement
The datasets generated and/or analysed during the current study are not publicly available due to the terms of consent to which participants agreed but are available from the principal investigator (TEM) of the main study on reasonable request.
Acknowledgments
We thank the Bellville South community and their community Health Forum for supporting the study.
Author Contributions
All authors made substantial contributions to conception and design, acquisition of data, or analysis and interpretation of data; took part in drafting the article or revising it critically for important intellectual content; agreed to submit to the current journal; gave final approval of the version to be published; and agree to be accountable for all aspects of the work.
Funding
This research project was supported by grants from the South African Medical Research Council (SAMRC), with funds from National Treasury under its Economic Competitiveness and Support Package (MRC-RFA-UFSP-01-2013/VMH Study), South African National Research Foundation (SANRF) (Grant no. 115450). Any opinions, findings, conclusions or recommendations expressed in this article are those of the author(s), and the SAMRC and/or SANRF do not accept any liability in this regard.
Disclosure
The authors declare no conflicts of interest.
References
1. Vaishya S, Sarwade RD, Seshadri V. MicroRNA proteins, and metabolites as novel biomarkers for prediabetes, diabetes, and related complications. Front Endocrinol (Lausanne). 2018;9:180. doi:10.3389/fendo.2018.00180
2. International Diabetes Federation. IDF Diabetes Atlas.
3. World Health Organization (WHO) & International Diabetes Federation (IDF). Definition and Diagnosis of Diabetes Mellitus and Intermediate Hyperglycemia: Report of a WHO/IDF Consultation. 2006:1–50
4. Sayed AS, Xia K, Salma U, Yang T, Peng J. Diagnosis, prognosis and therapeutic role of circulating miRNAs in cardiovascular diseases. Heart Lung Circ. 2014;23(6):503–510. doi:10.1016/j.hlc.2014.01.001
5. Kumar M, Nath S, Prasad HK, Sharma GD, Li Y. MicroRNAs: a new ray of hope for diabetes mellitus. Protein Cell. 2012;3(10):726–738. doi:10.1007/s13238-012-2055-0
6. Feng J, Xing W, Xie L. Regulatory roles of microRNAs in diabetes. Int J Mol Sci. 2016;17(10):1729. doi:10.3390/ijms17101729
7. Pordzik J, Jakubik D, Jarosz-Popek J, et al. Significance of circulating microRNAs in diabetes mellitus type 2 and platelet reactivity: bioinformatic analysis and review. Cardiovasc Diabetol. 2019;18(1):113. doi:10.1186/s12933-019-0918-x
8. Kong L, Zhu J, Han W, et al. Significance of serum microRNAs in pre-diabetes and newly diagnosed type 2 diabetes: a clinical study. Acta Diabetol. 2011;48(1):61–69. doi:10.1007/s00592-010-0226-0
9. Grieco GE, Cataldo D, Ceccarelli E, et al. Serum levels of miR-148a and miR-21-5p are increased in type 1 diabetic patients and correlated with markers of bone strength and metabolism. Noncoding RNA. 2018;4(4):37. doi:10.3390/ncrna4040037
10. Patoulias DI. Is miRNA-375 a promising biomarker for early detection and monitoring of patients with type 2 diabetes? Arch Med Sci Atheroscler Dis. 2018;3(1):e119–e122. doi:10.5114/amsad.2018.78775
11. Maciejak A, Kostarska-Srokosz E, Gierlak W, et al. Circulating MIR-30a-5p as a prognostic biomarker of left ventricular dysfunction after acute myocardial infarction. Sci Rep. 2018;8(1):9883. doi:10.1038/s41598-018-28118-1
12. Zhang X, Dong S, Jia Q, et al. The microRNA in ventricular remodeling: the MIR-30 family. Biosci Rep. 2019;39(8):BSR20190788. doi:10.1042/BSR20190788
13. Jiménez-Lucena R, Camargo A, Alcalá-Diaz JF, et al. A plasma circulating miRNAs profile predicts type 2 diabetes mellitus and prediabetes: from the CORDIOPREV study. Exp Mol Med. 2018;50(12):1–12. doi:10.1038/s12276-018-0194-y
14. Matsha TE, Kengne AP, Hector S, Mbu DL, Yako YY, Erasmus RT. MicroRNA profiling and their pathways in South African individuals with prediabetes and newly diagnosed type 2 diabetes mellitus. Oncotarget. 2018;9(55):30485–30498. doi:10.18632/oncotarget.25271
15. Erasmus RT, Soita DJ, Hassan MS, et al. High prevalence of diabetes mellitus and metabolic syndrome in a South African coloured population: baseline data of a study in Bellville, Cape Town. S Afr Med J. 2012;102(11 Pt 1):841–844. doi:10.7196/samj.5670
16. Alberti KG, Zimmet PZ. Definition, diagnosis and classification of diabetes mellitus and its complications. Part 1: diagnosis and classification of diabetes mellitus. Provisional report of a WHO consultation. Diabet Med. 1998;15(7):539–553. doi:10.1002/(SICI)1096-9136(199807)15:7<539::AID-DIA668>3.0.CO;2-S
17. Kengne AP, Erasmus RT, Levitt NS, Matsha TE. Alternative indices of glucose homeostasis as biochemical diagnostic tests for abnormal glucose tolerance in an African setting. Prim Care Diabetes. 2017;11(2):119–131. doi:10.1016/j.pcd.2017.01.004
18. Livak KJ, Schmittgen TD. Analysis of relative gene expression data using real-time quantitative PCR and the 2(-delta delta C(T)) method. Methods. 2001;25(4):402–408. doi:10.1006/meth.2001.1262
19. Zhu L, Chen T, Ye W, et al. Circulating miR-182-5p and miR-5187-5p as biomarkers for the diagnosis of unprotected left main coronary artery disease. J Thorac Dis. 2019;11(5):1799–1808. doi:10.21037/jtd.2019.05.24
20. Sharma SB, Garg S. Small dense LDL: risk factor for coronary artery disease (CAD) and its therapeutic modulation. Indian J Biochem Biophys. 2012;49(2):77–85.
21. Goligorsky MS. Microvascular rarefaction: the decline and fall of blood vessels. Organogenesis. 2010;6(1):1–10. doi:10.4161/org.6.1.10427
22. Jiang Q, Lagos-Quintana M, Liu D, et al. miR-30a regulates endothelial tip cell formation and arteriolar branching. Hypertension. 2013;62(3):592–598. doi:10.1161/HYPERTENSIONAHA.113.01767
23. Tang X, Tang G, Ozcan S. Role of MicroRNAs in diabetes. Biochim Biophys Acta. 2008;1779(11):697–701. doi:10.1016/j.bbagrm.2008.06
24. Erener S, Marwaha A, Tan R, Panagiotopoulos C, Kieffer TJ. Profiling of circulating microRNAs in children with recent onset of type 1 diabetes. JCI Insight. 2017;2(4):e89656. doi:10.1172/jci.insight.89656
25. Arcidiacono B, Chiefari E, Foryst-Ludwig A, et al. Obesity-related hypoxia via miR-128 decreases insulin-receptor expression in human and mouse adipose tissue promoting systemic insulin resistance. EBioMedicine. 2020;59:102912. doi:10.1016/j.ebiom.2020.102912
26. Karolina DS, Armugam A, Tavintharan S, et al. MicroRNA 144 impairs insulin signaling by inhibiting the expression of insulin receptor substrate 1 in type 2 diabetes mellitus. PLoS One. 2011;6(8):e22839. doi:10.1371/journal.pone.0022839
27. O-Sullivan I, Zhang W, Wasserman DH, et al. FoxO1 integrates direct and indirect effects of insulin on hepatic glucose production and glucose utilization. Nat Commun. 2015;6(1):7079. doi:10.1038/ncomms8079
28. Kim JW, You YH, Jung S, et al. MiRNA-30a-5p-mediated silencing of Beta2/NeuroD expression is an important initial event of glucotoxicity-induced beta cell dysfunction in rodent models. Diabetologia. 2013;56(4):847–855. doi:10.1007/s00125-012-2812-x
29. Weir GC, Marselli L, Marchetti P, Katsuta H, Jung MH, Bonner-Weir S. Towards better understanding of the contributions of overwork and glucotoxicity to the beta-cell inadequacy of type 2 diabetes. Diabetes Obes Metab. 2009;11(Suppl 4):82–90. doi:10.1111/j.1463-1326.2009.01113.x
30. Florkowski C. HbA1c as a diagnostic test for diabetes mellitus - reviewing the evidence. Clin Biochem Rev. 2013;34(2):75–83.
 © 2020 The Author(s). This work is published and licensed by Dove Medical Press Limited. The full terms of this license are available at https://www.dovepress.com/terms.php and incorporate the Creative Commons Attribution - Non Commercial (unported, v3.0) License.
By accessing the work you hereby accept the Terms. Non-commercial uses of the work are permitted without any further permission from Dove Medical Press Limited, provided the work is properly attributed. For permission for commercial use of this work, please see paragraphs 4.2 and 5 of our Terms.
© 2020 The Author(s). This work is published and licensed by Dove Medical Press Limited. The full terms of this license are available at https://www.dovepress.com/terms.php and incorporate the Creative Commons Attribution - Non Commercial (unported, v3.0) License.
By accessing the work you hereby accept the Terms. Non-commercial uses of the work are permitted without any further permission from Dove Medical Press Limited, provided the work is properly attributed. For permission for commercial use of this work, please see paragraphs 4.2 and 5 of our Terms.