")
Back to Journals » Diabetes, Metabolic Syndrome and Obesity » Volume 13
Circulating Irisin Levels as a Marker of Osteosarcopenic-Obesity in Cushing’s Disease
Authors Guarnotta V, Prinzi A, Pitrone M, Pizzolanti G , Giordano C
Received 10 February 2020
Accepted for publication 26 March 2020
Published 11 May 2020 Volume 2020:13 Pages 1565—1574
DOI https://doi.org/10.2147/DMSO.S249090
Checked for plagiarism Yes
Review by Single anonymous peer review
Peer reviewer comments 3
Editor who approved publication: Prof. Dr. Antonio Brunetti
Valentina Guarnotta, Antonio Prinzi, Maria Pitrone, Giuseppe Pizzolanti, Carla Giordano
Dipartimento di Promozione Della Salute, Materno-Infantile, Medicina Interna e Specialistica di Eccellenza “G. D’Alessandro” (PROMISE), Sezione di Malattie Endocrine, del Ricambio e della Nutrizione, Università di Palermo, Palermo, Italy
Correspondence: Carla Giordano; Giuseppe Pizzolanti
Piazza Delle Cliniche 2, Palermo 90127, Italy
Tel +39 0916552110; +39 0916552138
Fax +39 0916552123
Email [email protected]; [email protected]
Purpose: To evaluate circulating irisin levels in patients with active and controlled Cushing’s disease (CD).
Design: Forty-four patients with CD evaluated during the active phase and after 12 months of biochemical remission and 40 controls were recruited.
Methods: Phenotypic, anthropometric, hormonal and metabolic parameters, including insulin sensitivity estimation by homeostatic model of insulin resistance, Matsuda index and oral disposition index and circulating irisin levels were evaluated.
Results: Patients with active CD showed lower irisin levels compared to controls (p< 0.001) and controlled CD (p< 0.001). The independent variables significantly associated with irisin were waist circumference (WC) (p=0.025), body fat percentage (BF%) (p=0.009), PTH (p=0.007) and chair rising test (CRT) (p< 0.001) in active CD and WC (p=0.013), BF% (p=0.014), PTH (p=0.038), CRT (p=0.029) and urinary-free cortisol (p< 0.001) in controlled CD.
Conclusion: Circulating irisin levels tend to be lower in patients with active CD compared to those with controlled CD and controls. They are strongly associated with osteosarcopenia and central obesity in CD and therefore may be a possible marker of diagnosis.
Keywords: irisin, osteoporosis, myopathy, Cushing’s disease
Introduction
Irisin is a molecule secreted from skeletal muscle and induced by over-expression of the peroxisome proliferator-activated receptor-gamma coactivator 1-alpha (PGC-1α).1 It is produced as a result of cleavage of the membrane protein fibronectin type III domain-containing protein 5 (FNDC5) and contributes to maintenance of metabolic homeostasis via induction of “browning” of white adipocytes through increased expression of uncoupling protein 1 (UCP1), leading to increased energy expenditure2,3 and reducing the risk of obesity and diabetes.2,4
Some studies report the role of FNDC5/irisin in several diseases, such as diabetes, hypothyroidism, atherosclerosis, non-alcoholic fatty liver disease, GHD, osteoporosis, obesity and acromegaly.5–11 Serum irisin levels are closely related to metabolic diseases and activation of FNDC5 showed beneficial clinical effects in animals and humans.12 In an animal study, FNDC5 knockout mice showed severe hepatic steatosis with impaired autophagy and fatty acid oxidation. In contrast, FNDC5 over-expression prevented hyperlipidaemia, hepatic lipid accumulation and autophagy impairment in the high-fat diet mouse.13
Cushing’s disease (CD) is caused by prolonged exposure to inappropriately high levels of cortisol as a consequence of a pituitary ACTH-secreting tumour. It is associated with an increased mortality rate compared to the general population mainly due to the metabolic, cardiovascular, psychiatric and musculoskeletal comorbidities associated with hypercortisolism.14–17 Skeletal muscle is strongly influenced by glucocorticoid levels, resulting in muscle atrophy and weakness in patients with CD. Muscle weakness has been reported in 40–70% of patients with Cushing’s syndrome (CS)18–20 commonly affecting the proximal musculature of the lower limbs. Accordingly, patients typically complain about inability to get up from a squatting position or to climb stairs whereas running or walking is less frequently affected.21 However, in patients with CD, the presence of sarcopenia is generally associated with obesity and osteoporosis, leading to a condition called osteosarcopenic obesity. The pathomechanism that leads to sarcopenic obesity has not yet been identified but is probably related to low-grade inflammation and insulin resistance. Because irisin is predominantly synthesized and secreted from skeletal muscle, there have been several studies investigating the association of irisin with muscle,22,23 with inconsistent results. A recent study documented a positive correlation of irisin and sarcopenia in postmenopausal women,24 showing a potential for the development of irisin-based early screening and of a staging tool for sarcopenia. A relationship between irisin and bone has also been demonstrated.25 Due to the wide effects of irisin on skeletal muscle, bone, adipose tissue and glucose metabolism, which are targets of cortisol action, changes in irisin levels may be correlated with cortisol excess.
The aim of the study was to evaluate circulating irisin levels in patients with CD before and after remission and to clarify whether circulating levels of irisin are positively associated with phenotypic, cardiovascular and metabolic parameters in CD.
Patients and Methods
Subjects and Study Design
A total of 44 patients with active CD, referred to the Division of Endocrinology of Palermo University from January 2013 to December 2018, 35 of them women (80%) and 9 men (20%) (mean age 48.5 ± 15 years; mean duration of disease 34.02 ± 22.3 years) were included in this observational real-life study. The diagnosis of CD was based on clinical features and laboratory assessments according to the clinical practice guidelines and a consensus statement.26,27
The control group was recruited in parallel between 2013 and 2018 and consisted of 40 patients, 33 of them women (82.5%) and 7 men (17.5%) (mean age 48.2 ± 13.2 years) referred with a suspicion of CS, subsequently ruled out by repeated biochemical assessments. Controls were matched for age and gender.
Clinical signs such as moon face, facial rubor, dorsal fat pad or buffalo hump, purple striae and myopathy were evaluated for active and controlled CD and controls. Fatty tissue deposits, particularly around the midsection and upper back, in the face and between the shoulders, were defined moon face and buffalo hump, respectively. Purple striae were defined as wide, reddish-purple streaks. Myopathy was defined as muscle weakness at the proximal level with the pelvic girdle muscle involved. In order better to evaluate muscle performance, the chair rising test was performed as previously described.28,29 Patients were instructed to rise from a sitting position on a chair 45 cm high as fast as possible. They kept their arms crossed over their chests while performing the chair rising test and rose until reaching full knee and hip extension. The seconds needed to execute this procedure were recorded, with higher numbers indicating more severe muscle impairment.
Cardiovascular, metabolic and bone comorbidities, such as visceral obesity, impaired fasting glucose (IFG) and impaired glucose tolerance (IGT), diabetes mellitus, metabolic syndrome, hypertension, hypercholesterolemia, hepatic steatosis and osteoporosis/osteopaenia were also evaluated in both active and controlled CD and in controls. The metabolic syndrome was diagnosed according to the NCEP ATP III criteria, whereas diabetes mellitus and prediabetes were diagnosed according to the ADA criteria.30,31
For patients with a previous diagnosis of diabetes (14 out of 44), hypoglycaemic agents were discontinued 24 h before metabolic evaluations, to avoid any interference with metabolic parameters. Among patients with diabetes, 11 were on treatment with metformin, while 2 were on combined metformin and sulphonylurea and 1 other with metformin and DPP-4 inhibitors. All of them were on good metabolic control (HbA1c ≤ 53 mmol/mol). Patients were not taking vitamin D supplementation.
In the active phase and after remission of CD and for controls, clinical parameters such as BMI and WC, measured at the midpoint between the lower rib and the iliac crest, were assessed. Body fat percentage (BF%) was calculated by prediction formula [BF%=1.20 x BMI - 10.8 x sex + 0.23 x age - 5.4 (males=1; females=0)].32 After an overnight fast, lipids [total cholesterol (TC), HDL cholesterol, LDL cholesterol and triglycerides (TG)], HbA1c, glycaemia, insulinaemia and circulating irisin levels were evaluated. As hormonal parameters, we evaluated UFC as the mean of three 24-h urine collections (mUFC), cortisol after a low dose of dexamethasone suppression test and plasma ACTH.
Insulin sensitivity was indirectly estimated using basal insulin and glucose values to calculate the homeostatic model of insulin resistance (HOMA2-IR) [glycaemia (mmol/l) x insulinemia (mU/mL)/22.5].33 The Matsuda index of insulin sensitivity (ISI-Matsuda) [10,000/glucose (mg/dl) x insulin (mU/mL) x glucose mean x insulin mean],34 the oral disposition index (DIo) [(ΔInsulin0–30/ΔGlucose0–30) x (1/fasting insulin)]35 and the area under the curve for insulin (AUC2h insulinemia) and glucose (AUC2h glycaemia) were derived from an oral glucose tolerance test (OGTT) performed in 30 patients with active CD and in 20 controls who had no previous diagnosis of diabetes.
In 28 patients with CD, the remission resulted from transsphenoidal surgery, in 12 patients from medical treatment (carried out after unsuccessful pituitary surgery) and in 4 patients from adrenalectomy (carried out after unsuccessful pituitary surgery and medical treatments). Corticosteroid replacement therapy was administered after transsphenoidal surgery starting at 25–37.5 mg cortisone acetate daily and then tapered up to suspension (mean duration of treatment 6.37 ± 2.11 months). In patients who developed adrenal insufficiency after adrenalectomy, cortisone acetate at the dose of 50 ± 12.5 mg/day was administered. In patients medically treated, 9 were treated with pasireotide and 3 with metyrapone.
All patients included in the study were instructed not to practice physical activity during the 2 weeks before the biochemical assays. To assess adherence to this instruction, a 7-day pedometer measurement was provided to each patient, with the instruction to take less than 5000 steps a day.
Exclusion criteria were adrenal-dependent hypercortisolism, pregnancy, women taking oral contraceptives and patients who developed multiple pituitary hormonal deficiency after pituitary surgery.
The study protocol was approved by the Ethics Committee of the Policlinico Paolo Giaccone hospital, in accordance with the Declaration of Helsinki and written informed consent was obtained from all patients.
Assays
Insulin, glycaemia, calcium, phosphorus and lipids were measured by standard methods (Modular P800, Roche, Milan). LDL-C levels were measured using the Friedewald formula [TC – (HDL + (TG/5)]. HbA1c levels were determined by HPLC with an ion-exchange resin (Bio-Rad Laboratories, Milan, Italy).
PTH, vitamin D, ACTH, cortisol and UFC levels were detected by electrochemiluminescence immunoassay (ECLIA, Elecsys, Roche, Milan) following the manufacturer’s instructions. Normal values for hormonal markers were defined as follows: ACTH 2.2–14 pmol/L and UFC 59–378 nmol/24 h.
Serum samples were analyzed for irisin concentration using a commercial enzyme immunoassay kit (EK-067-29; Phoenix Pharmaceuticals, Karlsruhe, Germany). The lowest detectable concentration of irisin was 6.8 ng/mL, and the highest was 19.1 ng/mL. The kit used in the current study was validated against Western blotting and mass spectrometry.36 Samples were assayed following the manufacturer’s instructions without a prior extraction step. Serum samples used for circulating irisin assays were collected from 2013. These samples were stored at −80°C without repeated freezing and thawing for not more than 2 years before the analysis.
The conversion factors for the International System (SI) were as follows: glucose mg/dl vs mmol/L: 0.0555; insulin mUI/mL vs pmol/L: 6.945; TC and HDL-cholesterol mg/dl vs mmol/L: 0.0259; triglycerides mg/dl vs mmol/L: 0.0113; HbA1c % vs mmol/mol: 10.93% - 23.5; cortisol µg/dl vs nmol/L: 27.59, UFC µg/24h vs nmol/24h: 2.76; ACTH pg/mL vs pmol/L: 0.22, vitamin D ng/mL vs nmol/L: 2.49.
Statistical Analysis
The Statistical Packages for Social Science SPSS version 19 (SPSS, Inc.) was used for data analysis. The normality of quantitative variables was tested with the Shapiro–Wilk test. Data were presented as mean ± SD for continuous variables. Rates and proportions were calculated for categorical variables. The differences between paired continuous variables (active vs remission CD and active CD vs controls) were analyzed using one-way ANOVA. Relations between the outcome variables and continuous variables were evaluated using univariate Pearson correlation coefficients. Multiple linear regression analysis was performed to identify independent predictors of the dependent variable irisin in active and controlled CD. The decision to keep the variables in the multivariate model was based on clinical and statistical significance. Variables having a potential clinical impact on irisin levels and significantly associated with irisin on univariate analysis (Pearson correlation) were included. A p-value of 0.05 was considered statistically significant.
Results
Patients with active CD showed higher percentages of myopathy (p<0.001), facial rubor (p=0.016), buffalo hump (p=0.002), hypertension (p=0.033), hypercholesterolemia (p=0.016) and osteoporosis/osteopaenia (p=0.014) than controls (Table 1). In addition, patients with active CD had higher percentages of moon face (p<0.001), myopathy (p=0.003), facial plethora (p<0.001), buffalo hump (p<0.001), purple striae (p=0.001), hypertension (p=0.032), hypercholesterolemia (p=0.001), metabolic syndrome (p=0.001), central obesity (p<0.001) and osteoporosis/osteopaenia (p=0.002) than those with remission (Table 1).
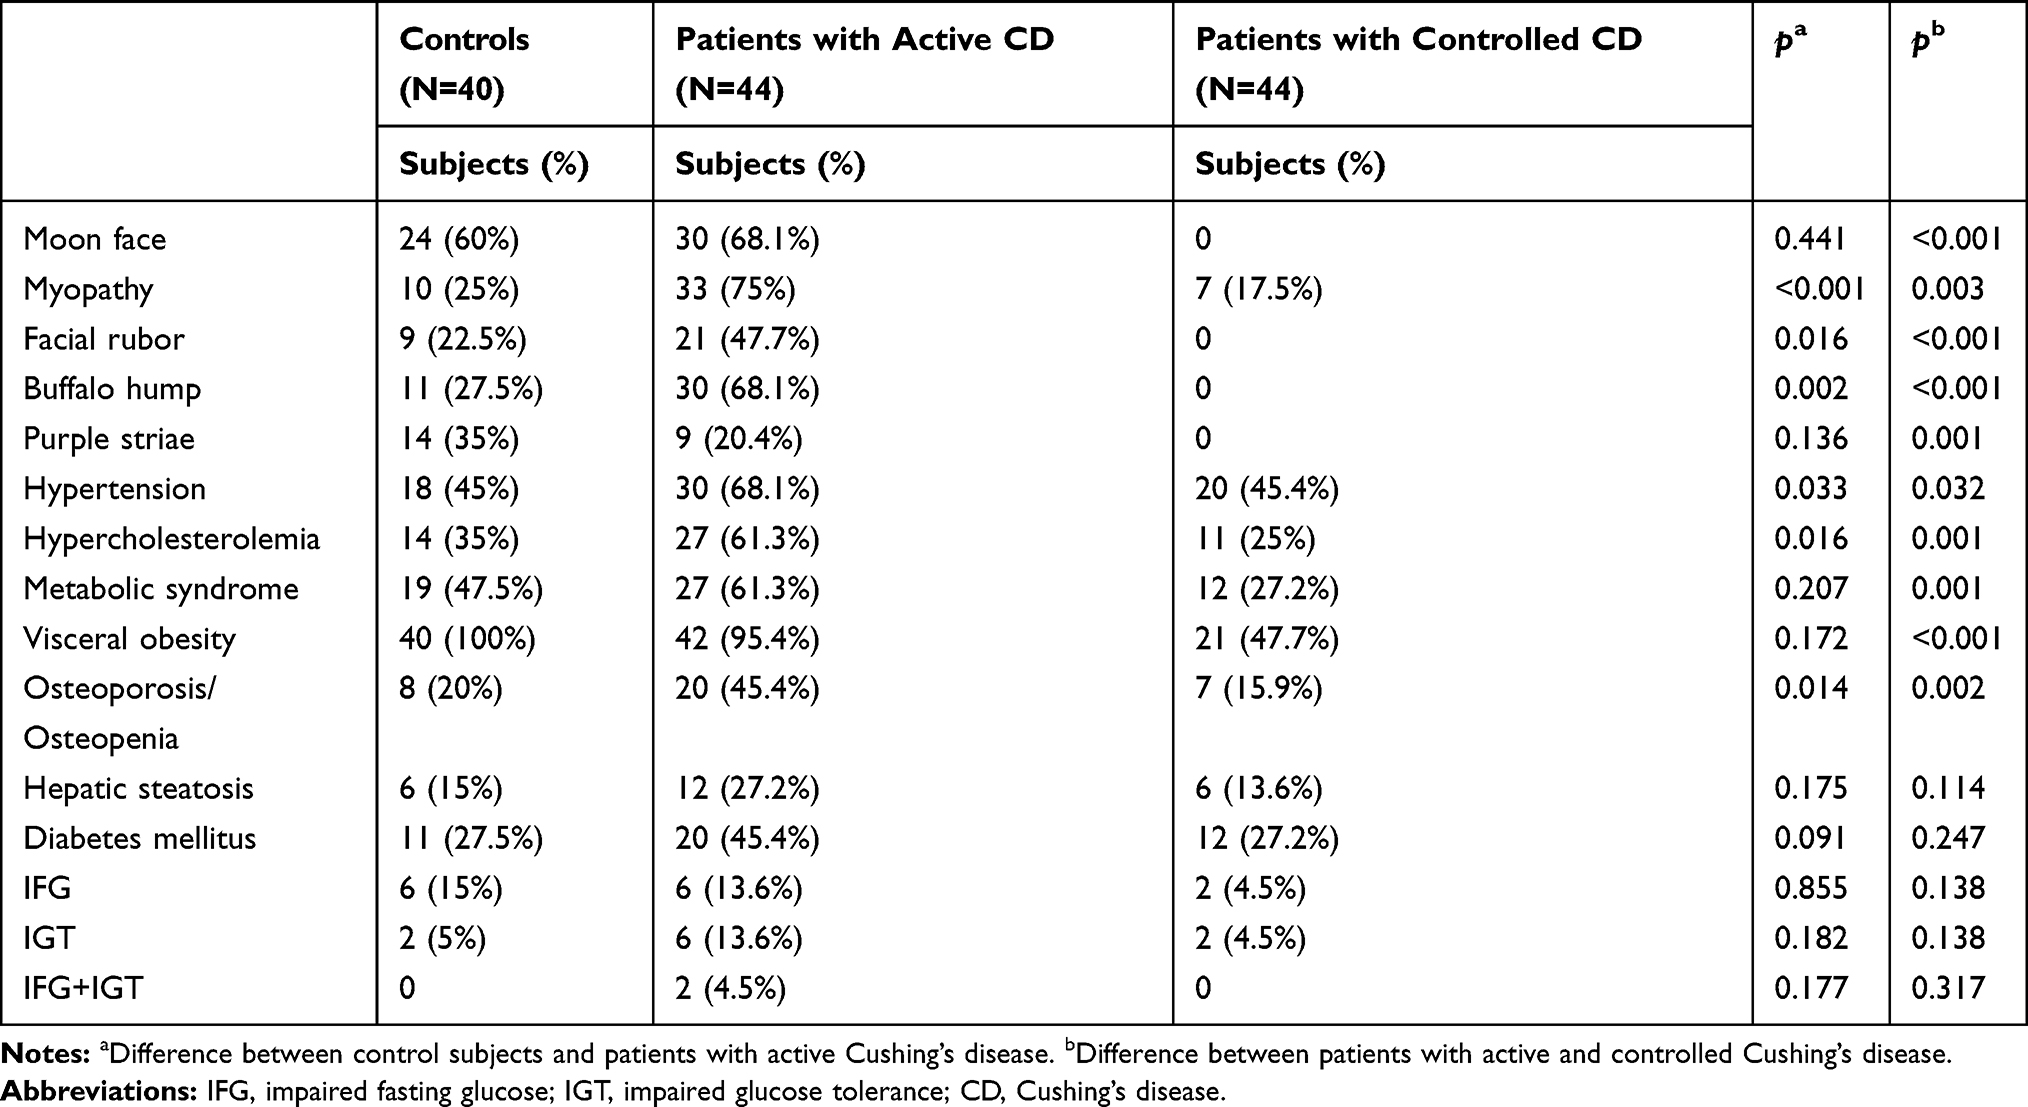 |
Table 1 Phenotypic Parameters and Comorbidities of Patients with Active and Controlled Cushing’s Disease and Controls |
Regarding anthropometric, metabolic and hormonal parameters, patients with active CD had higher BMI (p=0.001), WC (p=0.038), BF% (p=0.008), ACTH (p<0.001), mUFC (p=0.009), cortisol after low doses of dexamethasone suppression test (p=0.011), HbA1c (p=0.028), TC (p<0.001), LDL-cholesterol (p=0.016), PTH (p=0.005) and CRT (p<0.001) and lower vitamin D (p=0.018) and irisin (p<0.001) than controls (Table 2).
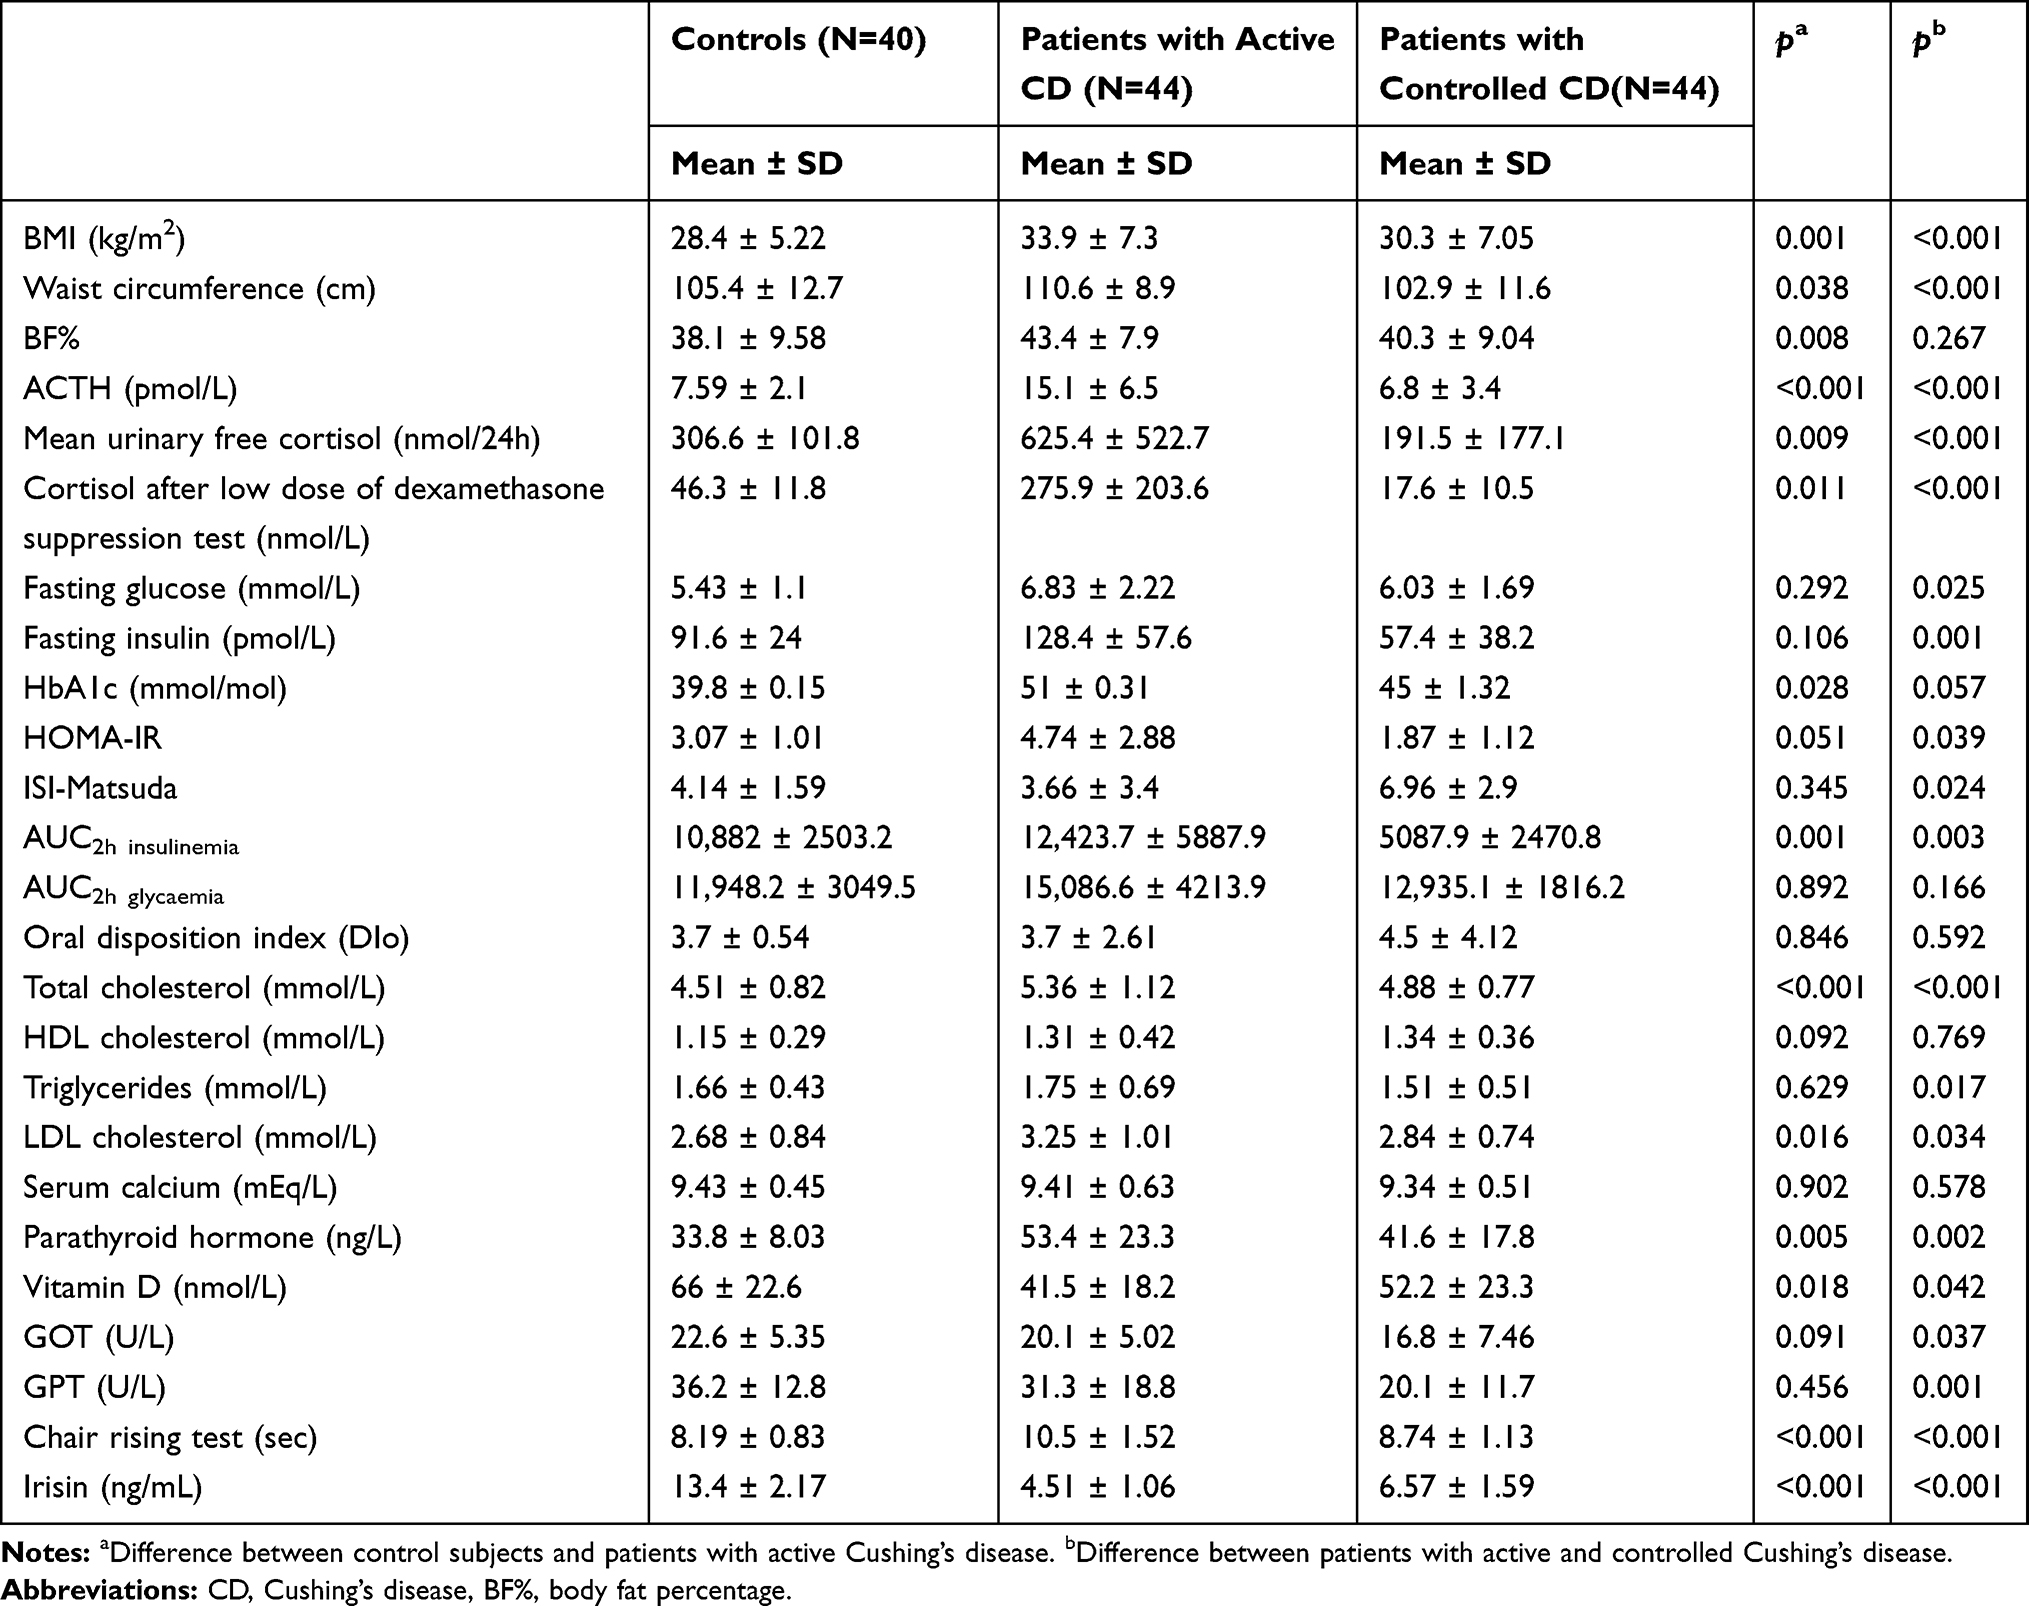 |
Table 2 Anthropometric, Metabolic and Hormonal Values of Patients with Active and Controlled Cushing’s Disease and Controls |
On the other side, patients with controlled CD showed lower BMI (p<0.001), WC (p<0.001), ACTH (p<0.001), mUFC (p<0.001), cortisol after low dose of dexamethasone suppression test (p<0.001), glycaemia (p=0.025), insulin (p=0.001), HOMA-IR (p=0.039), ISI-Matsuda (p=0.024), AUC 2hinsulinemia (p=0.003), TC (p<0.001), TG (p=0.017), LDL-cholesterol (p=0.034), PTH (p=0.002), GOT (p=0.037), GPT (p=0.001), CRT (p<0.001) and higher vitamin D (p=0.042) and irisin levels compared to those with active CD (Table 2).
In patients with active CD, irisin was inversely correlated with central obesity (r=−0.485; p=0.003), myopathy (r=0.388, p=0.019), BMI (r=−0.363, p=0.002), WC (r=−0.346, p=0.039), BF% (r=−0.298, p=0.003), PTH (r=−0.419, p=0.007), CRT (r=−0.833, p<0.001). In patients with controlled CD irisin was inversely correlated with central obesity (r=−0.771, p< 0.001), myopathy (r=0.379, p=0.021), BMI (p=−0.811, p=0.041), WC (p=−0.395, p=0.017), BF% (r=−0.282, p=0.014), mUFC (r=−0.797, p<0.001), cortisol after low dose of dexametasone suppression test (r=−0.337, p=0.045), PTH (r=−0.329, p=0.038) and CRT (r=−0.618, p< 0.001) (Table 3). No other significant correlations with clinical, phenotypic, hormonal and biochemical parameters were found (data not shown).
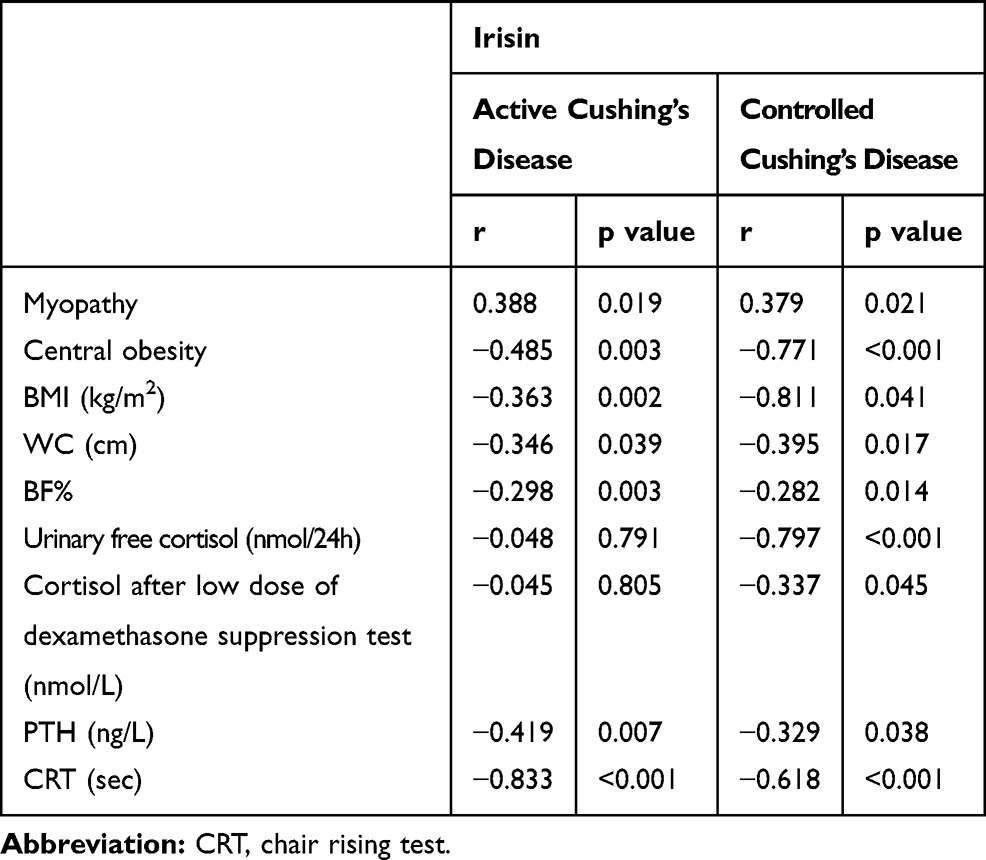 |
Table 3 Correlation Between Irisin and Clinical, Hormonal, and Metabolic Parameters (Univariate Analysis) in Patients with Active and Controlled Cushing’s Disease |
Multivariate analysis showed that WC (p=0.025), BF% (p=0.009), PTH (p=0.007) and CRT (p<0.001) were independently associated with irisin in patients with active CD (Figure 1). In patients with controlled CD, the multivariate analysis showed that WC (p=0.013), BF% (p=0.014), PTH (p=0.038), CRT (p=0.029) and mUFC (p<0.001) were independently associated with irisin (Figure 2).
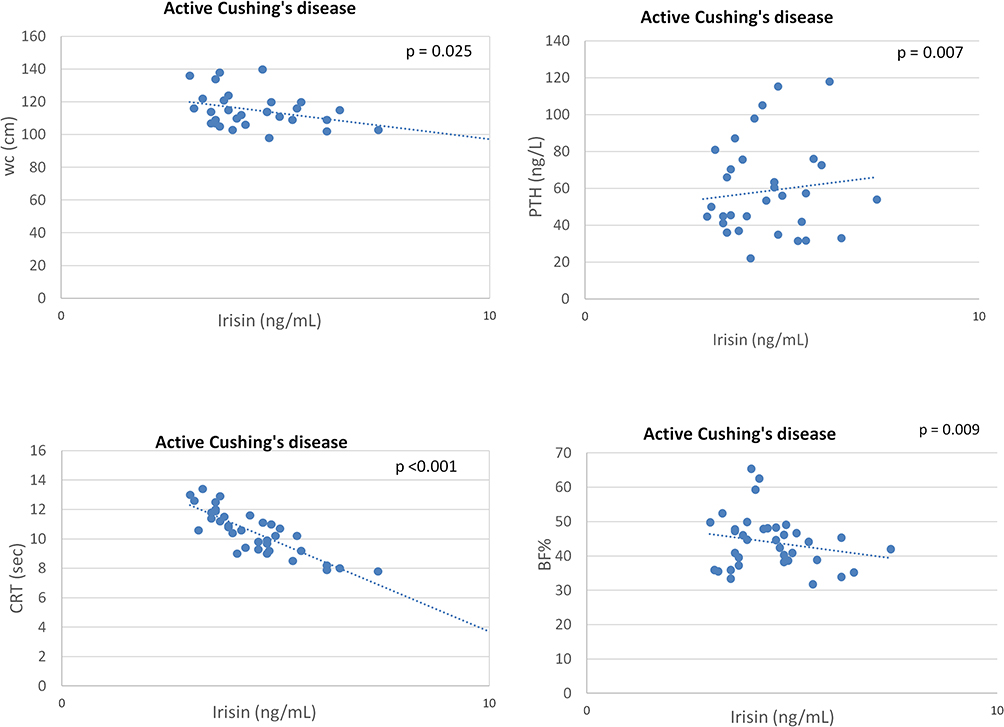 |
Figure 1 Independent variables associated with circulating irisin levels in patients with active CD at multivariate analysis. Abbreviations: WC, waist circumference; CRT, chair rising test; BF%, body fat percentage. |
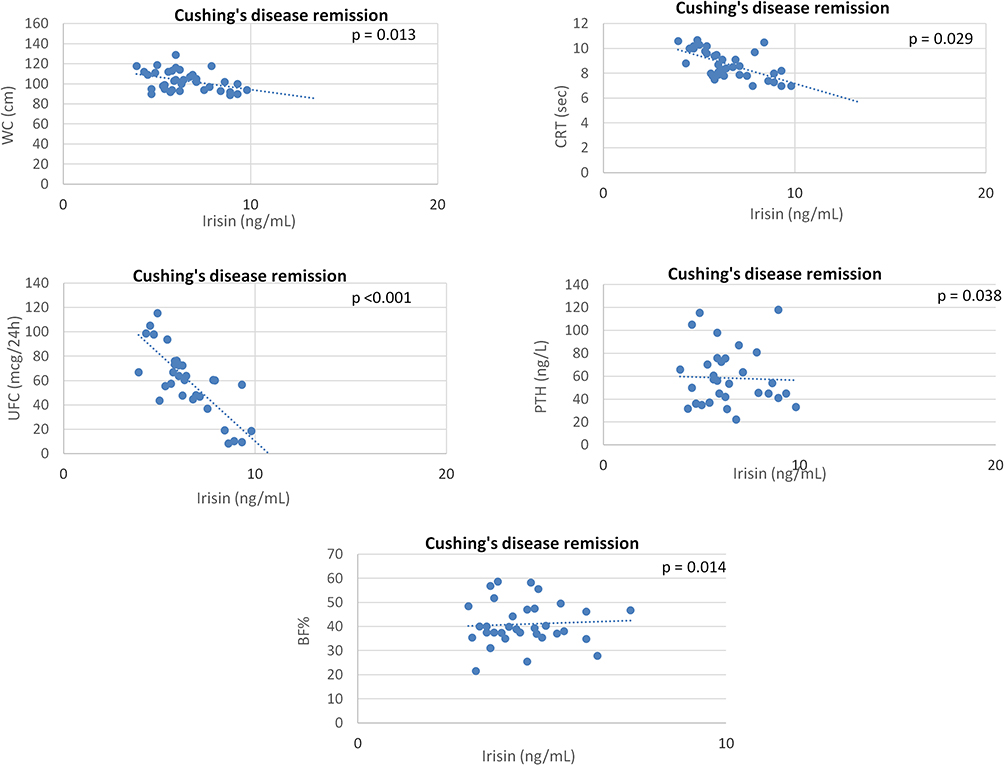 |
Figure 2 Independent variables associated with circulating irisin levels in patients with controlled CD at multivariate analysis. Abbreviations: WC, waist circumference; UFC, urinary free cortisol; CRT, chair rising test; BF%, body fat percentage. |
Discussion
This study shows that patients with CD have lower irisin values than controls and that remission of hypercortisolism is able to increase these values, even though patients with CD do not reach similar values to those of controls. Interestingly, circulating irisin levels are associated with the presence of myopathy, CRT, mUFC, PTH and WC in patients with controlled CD.
To the best of our knowledge, no other studies have evaluated circulating irisin levels in patients with CD, till now. Irisin has been reported to be related to the amount of muscular mass and insulin sensitivity, being considered a protective factor against diabetes and obesity.37,38 In the current study, we found lower irisin levels in patients with active CD compared to control subjects and controlled CD, showing that hypercortisolism and related comorbidities induce a decrease of circulating irisin levels than control subjects. On the other hand, remission of hypercortisolism is able to increase circulating irisin values, which are also associated with WC, PTH and myopathy, even though they remain lower than in control subjects. At multivariate analysis, we documented a significant negative correlation among circulating irisin values and WC and irisin values and BF%. The relationship between irisin and body composition has been widely evaluated, with discordant results. Some studies have shown a positive correlation between serum irisin levels, BMI and visceral obesity39–43 and a positive association between irisin and fat mass, waist circumference, waist-to-hip ratio and leptin levels, suggesting a strong correlation with the visceral disposition of adiposity.37,42,44 Furthermore, irisin levels were significantly reduced following weight loss due to bariatric surgery,37 suggesting that elevated irisin levels could be a compensatory mechanism for the abnormal metabolism and insulin sensitivity typical of obese individuals. These clinical data are supported by the evidence that irisin stimulates browning of white adipocytes, inhibiting adipogenesis,41 whereas blocking irisin gene expression reduces UCP1 expression and enhances adipogenesis in obesity.45 On the other hand, other studies have reported a negative correlation between irisin values and anthropometric parameters46 supporting the view that higher serum irisin values were associated with lower BMI and a greater reduction in body weight likely due to stimulation of energy expenditure.47
In our study, interesting data emerged from the correlation between irisin levels and mUFC. To our knowledge, this is the first time that this correlation has been reported in humans. Taking these aspects into account, evaluation of circulating irisin could be of interest in patients with CD. The relationship between irisin and cortisol has recently been evaluated in human cell lines and mouse liver tissue.48 Kim et al demonstrated that cortisol and corticosteroids are involved in transcription of FNDC5, even though the variants of the genes respond differently.48 However, no information is currently available on exogenous cortisol treatment effects on FNDC5 expression and additional investigations in an in vivo setting are lacking.
The current study also documented a correlation between irisin and CRT and presence of myopathy, suggesting that circulating irisin may be a biochemical marker of sarcopenia in patients with CD. CS is generally considered a model of sarcopenic obesity.49 Glucocorticoids induce myopathy by affecting protein metabolism via different signalling pathways. Their main effect seems to be by induction of type 2 muscle fibre atrophy and upregulation of protein catabolism by activating cellular proteolysis, ie, via the ubiquitin-proteasome, the lysosomal and the calcium-dependent system.50–52 However, patients with CD suffer from myopathy more as a severe decrease of muscle strength than as a loss of muscle mass,49 as also widely demonstrated by the loss of grip strength and the poor chair rising test performance.53 Decrease of muscle strength may be explained by increased intramuscular fat infiltration and obesity may be the triggering factor exacerbating sarcopenia development, as previously suggested.49,54 Although patients with controlled CD showed an increase of irisin values compared to those with active CD, they did not reach the values of control subjects, despite normalization of cortisol levels and an improvement in BMI and WC. The persistence of low levels of circulating irisin may also be associated with persistence of sarcopenic obesity, despite biochemical remission, as frequently found with many of the comorbidities of CD.29,55
An association between irisin and PTH levels was also found. A recent study documented an interesting interplay between irisin and PTH. Irisin produces several effects on bone mineral density (BMD), stimulating osteoblast activity with increase of the cortical bone.25,56,57 By contrast, PTH seems to act in the opposite way, since in endocrine diseases, such as primary hyperparathyroidism, the prolonged action of elevated pathological PTH blood levels causes BMD reduction. A recent research investigated the relationship between irisin and PTH both by “in vitro experiments” and by clinical evaluation in a cohort of patients with primary hyperparathyroidism.58 As a result, the authors showed that the two hormones inhibit one another. High PTH levels reduce the secretion of irisin in mouse muscle cells, while irisin treatment is able to reduce the PTH receptor expression in osteoblasts, thus blocking its action. Moreover, the same authors also found that in patients with primary hyperparathyroidism, irisin levels were reduced by up to one-third compared to controls.
Interestingly, in the current study, we did not find a significant correlation between circulating irisin levels and glucose homeostasis likely due to the inclusion in the study of patients with diabetes, prediabetes and normal glucose tolerance.
The present study has a number of limitations. The sample size of the study was relatively small. Myopathy was assessed based on clinical symptoms and CRT. Handgrip strength and instrumental techniques such as Computed Tomography (CT) and Magnetic Resonance Tomography (MRT) were not performed. Although irisin levels are altered in several endocrine disorders, control subjects were chosen among subjects who had visited the endocrinology department, so the groups were both matched based on metabolic disorders.
In conclusion, circulating irisin levels tend to be lower in patients with CD before and after correction of hypercortisolism compared to controls. Circulating irisin levels are associated with the presence of visceral obesity and osteosarcopenia in patients with CD, showing that irisin may be a molecular messenger in the complex axis formed by bone, muscle and adipose tissue. Therefore, irisin remains a metabolic marker that needs to be further investigated as a possible marker of diagnosis of osteosarcopenic obesity in patients with CD.
Data Sharing Statement
All data available have been published in this manuscript.
Ethics and Consent Statement
The study protocol was approved by the Ethics Committee of the Policlinico Paolo Giaccone Hospital, in accordance with the Declaration of Helsinki and written informed consent was obtained from all patients.
Author Contributions
All authors made substantial contributions to conception and design, acquisition of data, or analysis and interpretation of data; took part in drafting the article or revising it critically for important intellectual content; gave final approval of the version to be published; and agree to be accountable for all aspects of the work.
Funding
This research did not receive any specific grant from funding agencies in the public, commercial, or not-for-profit sectors.
Disclosure
Authors declare that there is no conflict of interest that could be perceived as prejudicing the impartiality of the research reported.
References
1. Bostrom P, Wu J, Jedrychowski MP, et al. A PGC1-alpha-dependent myokine that drives brown-fat-like development of white fat and thermogenesis. Nature. 2012;481(7382):463–468. doi:10.1038/nature10777
2. Moreno-Navarrete JM, Ortega F, Serrano M, et al. Irisin is expressed and produced by human muscle and adipose tissue in association with obesity and insulin resistance. J Clin Endocrinol Metab. 2013;98(4):E769–E778. doi:10.1210/jc.2012-2749
3. Timmons JA, Baar K, Davidsen PK, Atherton PJ. Is irisin a human exercise gene? Nature. 2012;488(7413):
4. Aydin S. Three new players in energy regulation: preptin, adropin and irisin. Peptides. 2014;56:94–110. doi:10.1016/j.peptides.2014.03.021
5. Du XL, Jiang WX, Lv ZT. Lower circulating irisin level in patients with diabetes mellitus: a systematic review and meta- analysis. Horm Metab Res. 2016;48(10):644–652. doi:10.1055/s-0042-108730
6. Zybek-Kocik A, Sawicka-Gutaj N, Wrotkowska E, Sowinski J, Ruchala M. Time-dependent irisin concentration changes in patients affected by overt hypothyroidism. Endokrynol Pol. 2016;67(5):476–480. doi:10.5603/EP.a2016.0030
7. Zhang Y, Mu Q, Zhou Z, et al. Protective effect of irisin on atherosclerosis via suppressing oxidized low density lipoprotein induced vascular inflammation and endothelial dysfunction. PLoS One. 2016;11(6):e0158038.
8. Polyzos SA, Kountouras J, Anastasilakis AD, Geladari EV, Mantzoros CS. Irisin in patients with nonalcoholic fatty liver disease. Metabolism. 2014;63(2):207–217. doi:10.1016/j.metabol.2013.09.013
9. Ciresi A, Pizzolanti G, Guarnotta V, Giordano C. Circulating Irisin levels in children with GH deficiency before and after 1 year of GH treatment. J Clin Endocrinol Metab. 2019;104(3):801–808. doi:10.1210/jc.2018-01440
10. Calan M, Demirpence M. Increased circulating levels of irisin are associated with cardiovascular risk factors in subjects with acromegaly. Hormones (Athens). 2019;6.
11. Palermo A, Strollo R, Maddaloni E, et al. Irisin is associated with osteoporotic fractures independently of bone mineral density, body composition or daily physical activity. Clin Endocrinol (Oxf). 2015;82(4):615–619. doi:10.1111/cen.12672
12. Yang Z, Chen X, Chen Y, Zhao Q. Decreased irisin secretion contributes to muscle insulin resistance in high-fat diet mice. Int J Clin Exp Pathol. 2015;8(6):6490–6497.
13. Liu TY, Xiong XQ, Ren XS, et al. FNDC5 alleviates hepatosteatosis by restoring AMPK/mTOR-mediated autophagy, fatty acid oxidation and lipogenesis in mice. Diabetes. 2016;65(11):3262–3275. doi:10.2337/db16-0356
14. Pivonello R, De Martino MC, Iacuaniello D, et al. Metabolic alterations and cardiovascular outcomes of cortisol excess. Front Horm Res. 2016;46:54–65.
15. Pivonello R, Isidori AM, De Martino MC, Newell-Price J, Biller BM, Colao A. Complications of Cushing’s syndrome: state of the art. Lancet Diabetes Endocrinol. 2016;4(7):611–629. doi:10.1016/S2213-8587(16)00086-3
16. Javanmard P, Duan D, Geer EB. Mortality in patients with endogenous cushing’s syndrome. Endocrinol Metab Clin North Am. 2018;47(2):313–333. doi:10.1016/j.ecl.2018.02.005
17. Giordano C, Guarnotta V, Pivonello R, et al. Is diabetes in Cushing’s syndrome only a consequence of hypercortisolism? Eur J Endocrinol. 2013;170(2):311–319. doi:10.1530/EJE-13-0754
18. Bolland MJ, Holdaway IM, Berkeley JE, et al. Mortality and morbidity in Cushing’s syndrome in New Zealand. Clin Endocrinol (Oxf). 2011;75(4):436–442. doi:10.1111/j.1365-2265.2011.04124.x
19. Ammini AC, Tandon N, Gupta N, et al. Etiology and clinical profile of patients with Cushing’s syndrome: a single center experience. Indian J Endocrinol Metab. 2014;18(1):99–105. doi:10.4103/2230-8210.126586
20. Guarnotta V, Amato MC, Pivonello R, et al. The degree of urinary hypercortisolism is not correlated with the severity of cushing’s syndrome. Endocrine. 2017;55(2):564–572. doi:10.1007/s12020-016-0914-9
21. Minetto MA, Lanfranco F, Motta G, Allasia S, Arvat E, D’Antona G. Steroid myopathy: some unresolved issues. J Endocrinol Invest. 2011;34(5):370–375. doi:10.1007/BF03347462
22. Choi HY, Kim S, Park JW, et al. Implication of circulating irisin levels with brown adipose tissue and sarcopenia in humans. J Clin Endocrinol Metab. 2014;99(8):2778–2785. doi:10.1210/jc.2014-1195
23. Pekkala S, Wiklund PK, Hulmi JJ, et al. Are skeletal muscle FNDC5 gene expression and irisin release regulated by exercise and related to health? J Physiol. 2013;591(21):5393–5400. doi:10.1113/jphysiol.2013.263707
24. Park HS, Kim HC, Zhang D, Yeom H, Lim SK. The novel myokine irisin: clinical implications and potential role as a biomarker for sarcopenia in postmenopausal women. Endocrine. 2019;64(2):341–348. doi:10.1007/s12020-018-1814-y
25. Colaianni G, Mongelli T, Cuscito C, et al. Irisin prevents and restores bone loss and muscle atrophy in hind-limb suspended mice. Sci Rep. 2017;7(1):2811. doi:10.1038/s41598-017-02557-8
26. Nieman LK, Biller BMK, Findling JW, et al. The diagnosis of Cushing’s syndrome: an Endocrine Society clinical practice guideline. J Clin Endocrinol Metab. 2008;93(5):1526–1540. doi:10.1210/jc.2008-0125
27. Arnaldi G, Angeli A, Atkinson AB, et al. Diagnosis and complications of Cushing’s syndrome: a consensus statement. J Clin Endocrinol Metab. 2003;88(12):5593–5602. doi:10.1210/jc.2003-030871
28. Guralnik JM, Simonsick EM, Ferrucci L, et al. A short physical performance battery assessing lower extremity function: association with self reported disability and prediction of mortality and nursing home admission. J Gerontol. 1994;49(2):M85–94. doi:10.1093/geronj/49.2.M85
29. Berr CM, Stieg MR, Deutschbein T, et al. Persistence of myopathy in Cushing’s syndrome: evaluation of the German Cushing’s Registry. Eur J Endocrinol. 2017;176(6):737–746. doi:10.1530/EJE-16-0689
30. Expert Panel on Detection, Evaluation and Treatment of High Blood Cholesterol in Adults. Executive summary of the third report of the National Cholesterol Education Program (NCEP) expert panel on detection, evaluation and treatment of high blood cholesterol in adults (Adult Treatment Panel III). JAMA. 2001;285(19):2486–2497. doi:10.1001/jama.285.19.2486
31. American Diabetes Association. Classification and diagnosis of diabetes: standards of medical care in diabetes-2020. Diabetes Care. 2020;43(Suppl 1):S14–S31. doi:10.2337/dc20-S002
32. Deurenberg P, Weststrate JA, Seidell JC. Body mass index as a measure of body fatness: age- and sex-specific prediction formulas. Br J Nutr. 1991;65(2):105–114. doi:10.1079/BJN19910073
33. Matthews D, Hosker J, Rudenski A, Naylor BA, Treacher DF, Turner RC. Homeostasis model assessment: insulin resistance and b-cell function from fasting plasma glucose and insulin concentration in man. Diabetologia. 1985;28(7):412–419. doi:10.1007/BF00280883
34. Matsuda M, DeFronzo R. Insulin sensitivity indices obtained from oral glucose tolerance testing: comparison with the euglycemic insulin clamp. Diabetes Care. 1999;22(9):1462–1470. doi:10.2337/diacare.22.9.1462
35. Utzschneider KM, Prigeon RL, Faulenbach MV, et al. Oral disposition index predicts the development of future diabetes above and beyond fasting and 2-h glucose levels. Diabetes Care. 2009;32(2):335–341. doi:10.2337/dc08-1478
36. Lee P, Linderman JD, Smith S, et al. Irisin and FGF21 are cold-induced endocrine activators of brown fat function in humans. Cell Metab. 2014;19(2):302–309. doi:10.1016/j.cmet.2013.12.017
37. Huh JY, Panagiotou G, Mougios V, et al. FNDC5 and irisin in humans: I.Predictors of circulating concentrations in serum and plasma and II. mRNA expression and circulating concentrations in response to weight loss and exercise. Metabolism. 2012;61(12):1725–1738. doi:10.1016/j.metabol.2012.09.002
38. Pardo M, Crujeiras AB, Amil M, et al. Association of irisin with fat mass, resting energy expenditure, and daily activity in conditions of extreme body mass index. Int J Endocrinol. 2014;2014:857270. doi:10.1155/2014/857270
39. Park KH, Zaichenko L, Brinkoetter M, et al. Circulating irisin in relation to insulin resistance and the metabolic syndrome. J Clin Endocrinol Metab. 2013;98(12):4899–4907. doi:10.1210/jc.2013-2373
40. Liu JJ, Wong MD, Toy WC, et al. Lower circulating irisin is associated with type 2 diabetes mellitus. J Diabetes Complications. 2013;27(4):365–369. doi:10.1016/j.jdiacomp.2013.03.002
41. Grygiel-Gorniak B, Puszczewicz M. A review on irisin, a new protagonist that mediates muscle-adipose-bone-neuron connectivity. Eur Rev Med Pharmacol Sci. 2017;21(20):4687–4693.
42. Crujeiras AB, Zulet MA, Lopez-Legarrea P, et al. Association between circulating irisin levels and the promotion of insulin resistance during the weight maintenance period after a dietary weight-lowering program in obese patients. Metabolism. 2014;63(4):520–531. doi:10.1016/j.metabol.2013.12.007
43. Stengel A, Hofmann T, Goebel-Stengel M, Elbelt U, Kobelt P, Klapp BF. Circulating levels of irisin in patients with anorexia nervosa and different stages of obesity–correlation with body mass index. Peptides. 2013;39:125–130. doi:10.1016/j.peptides.2012.11.014
44. Leung WKC, Yu AP, Lai CWK, Siu PM. Association of markers of proinflammatory phenotype and beige adipogenesis with metabolic syndrome in chinese centrally obese adults. J Diabetes Res. 2018;8956509.
45. Perez-Sotelo D, Roca-Rivada A, Baamonde I, et al. Lack of adipocyte-fndc5/irisin expression and secretion reduces thermogenesis and enhances adipogenesis. Sci Rep. 2017;7:16289. doi:10.1038/s41598-017-16602-z
46. Liu R, Shi L, Peng N, Zhang Q, Li H. Higher baseline serum irisin decreases risk for body mass index increment in chinese populations: a 3.2-year cohort study. Diabetes Ther. 2019;10(2):713–723. doi:10.1007/s13300-019-0588-4
47. Zhang Y, Li R, Meng Y, et al. Irisin stimulates browning of white adipocytes through mitogen activated protein kinase p38 MAP kinase and ERK MAP kinase signaling. Diabetes. 2014;63(2):514–525. doi:10.2337/db13-1106
48. Kim HK, Jeong YJ, Song IS, et al. Glucocorticoid receptor positively regulates transcription of FNDC5 in the liver. Sci Rep. 2017;7:43296. doi:10.1038/srep43296
49. Drey M, Berr CM, Reincke M, et al. Cushing’s syndrome: a model for sarcopenic obesity. Endocrine. 2017;57(3):481–485. doi:10.1007/s12020-017-1370-x
50. Schiaffino S, Dyar KA, Ciciliot S, Blaauw B, Sandri M. Mechanisms regulating skeletal muscle growth and atrophy. FEBS J. 2013;280(17):4294–4314. doi:10.1111/febs.12253
51. Cleasby ME, Jamieson PM, Atherton PJ. Insulin resistance and sarcopenia: mechanistic links between common co-morbidities. J Endocrinol. 2016;229(2):R67–81. doi:10.1530/JOE-15-0533
52. Cuthbertson DJ, Babraj J, Leese G, Siervo M. Anabolic resistance does not explain sarcopenia in patients with type 2 diabetes mellitus, compared with healthy controls, despite reduced mTOR pathway activity. Clin Nutr. 2017;36(6):1716–1719. doi:10.1016/j.clnu.2016.11.012
53. Stangl MK, Böcker W, Chubanov V, et al. Sarcopenia - endocrinological and neurological aspects. Exp Clin Endocrinol Diabetes. 2019;127(1):8–22. doi:10.1055/a-0672-1007
54. Polyzos SA, Mathew H, Mantzoros CS. Irisin: a true, circulating hormone. Metabolism. 2015;64(12):1611–1618. doi:10.1016/j.metabol.2015.09.001
55. Schernthaner-Reiter MH, Siess C, Gessl A, et al. Factors predicting long-term comorbidities in patients with Cushing’s syndrome in remission. Endocrine. 2019;64(1):157–168. doi:10.1007/s12020-018-1819-6
56. Colaianni G, Cuscito C, Mongelli T, et al. The myokine irisin increases cortical bone mass. Proc Natl Acad Sci USA. 2015;112(39):12157–12162. doi:10.1073/pnas.1516622112
57. Anastasilakis AD, Polyzos SA, Makras P, et al. Circulating irisin is associated with osteoporotic fractures in postmenopausal women with low bone mass but is not affected by either teriparatide or denosumab treatment for 3 months. Osteoporos Int. 2014;25(5):1633–1642. doi:10.1007/s00198-014-2673-x
58. Palermo A, Sanesi L, Colaianni G, et al. A novel interplay between irisin and PTH: from basic studies to clinical evidence in hyperparathyroidism. J Clin Endocrinol Metab. 2019;104(8):3088–3096. doi:10.1210/jc.2018-02216
 © 2020 The Author(s). This work is published and licensed by Dove Medical Press Limited. The full terms of this license are available at https://www.dovepress.com/terms.php and incorporate the Creative Commons Attribution - Non Commercial (unported, v3.0) License.
By accessing the work you hereby accept the Terms. Non-commercial uses of the work are permitted without any further permission from Dove Medical Press Limited, provided the work is properly attributed. For permission for commercial use of this work, please see paragraphs 4.2 and 5 of our Terms.
© 2020 The Author(s). This work is published and licensed by Dove Medical Press Limited. The full terms of this license are available at https://www.dovepress.com/terms.php and incorporate the Creative Commons Attribution - Non Commercial (unported, v3.0) License.
By accessing the work you hereby accept the Terms. Non-commercial uses of the work are permitted without any further permission from Dove Medical Press Limited, provided the work is properly attributed. For permission for commercial use of this work, please see paragraphs 4.2 and 5 of our Terms.