")
Back to Journals » International Journal of General Medicine » Volume 15
Circulating Bone Morphogenetic Protein-9 is Decreased in Patients with Type 2 Diabetes and Non-Alcoholic Fatty Liver Disease
Authors Hao J , Wang Y, Huo L, Sun T, Zhen Y, Gao Z, Chen S, Ren L
Received 17 August 2022
Accepted for publication 23 November 2022
Published 7 December 2022 Volume 2022:15 Pages 8539—8546
DOI https://doi.org/10.2147/IJGM.S385513
Checked for plagiarism Yes
Review by Single anonymous peer review
Peer reviewer comments 3
Editor who approved publication: Dr Scott Fraser
Jianan Hao,1,2,* Yichao Wang,1,* Lijing Huo,3 Tiantian Sun,1 Yunfeng Zhen,1 Zhe Gao,1 Shuchun Chen,1 Luping Ren1
1Endocrinology Department, Hebei General Hospital, Shijiazhuang, Hebei, 050000, People’s Republic of China; 2Graduate School of Hebei Medical University, Shijiazhuang, Hebei, 050000, People’s Republic of China; 3Laboratory Department, Hebei General Hospital, Shijiazhuang, Hebei, 050000, People’s Republic of China
*These authors contributed equally to this work
Correspondence: Luping Ren, Endocrinology Department, Hebei General Hospital, 348, Heping West Road, Shijiazhuang, Hebei, 050000, People’s Republic of China, Email [email protected]
Objective: We aimed to examine the association between bone morphogenetic protein-9 (BMP-9) and type 2 diabetes mellitus (T2DM) in conjunction with non-alcoholic fatty liver disease (NAFLD) and insulin resistance (IR) and to identify evidence supporting the potential role of BMP-9 in the clinical prevention and treatment of T2DM in conjunction with NAFLD.
Methods: One hundred and twenty subjects were included in this study. We sorted all of the subjects into four groups of equal size (n=30 each). A trained expert assessed the height, weight, systolic blood pressure (SBP), and diastolic blood pressure (DBP) of the subjects and computed the body mass index (BMI). All subjects had their fasting blood glucose (FBG), fasting insulin (FINS), serum BMP-9, and biochemical indices assessed.
Results: Significant variations were observed in BMI, SBP, DBP, ALT, TC, TG, HDL-C, LDL-C, ApoB, FBG, FINS, HOMA-IR, and serum BMP-9 among the four groups (P< 0.05). The level of serum BMP-9 was positively correlated with HDL-C, while the level of serum BMP-9 was negatively correlated with BMI, SBP, DBP, ALT, TC, TG, LDL-C, FBG, FINS, and HOMA-IR. Multiple stepwise regression analyses revealed that FINS, LDL-C, HDL-C, and BMI were independent factors impacting serum BMP-9 levels (P< 0.05). Logistic regression analyses revealed that BMP-9 was a protective factor for T2DM paired with NAFLD, while HOMA-IR was a risk factor.
Conclusion: Serum BMP-9 levels are significantly lower in the T2DM+NAFLD group when compared to other groups, and BMP-9 is an independent risk factor for T2DM paired with NAFLD.
Keywords: bone morphogenetic protein-9, type 2 diabetes mellitus, non-alcoholic fatty liver disease, insulin resistance, glucose and lipid metabolism
Introduction
Nowadays, non-alcoholic fatty liver disease (NAFLD) is the most common cause of chronic liver disease all over the world.1 Patients with type 2 diabetes mellitus (T2DM) frequently develop NAFLD. According to studies, up to 70% of individuals who are diabetic may have NAFLD.2 The close link between NAFLD and T2DM is bidirectional.3 T2DM may trigger the onset and progression of NAFLD. The disordered glycolipid metabolism attributes to a much higher risk of developing NAFLD in T2DM patients. Conversely, NAFLD may also promote the development of T2DM. There is evidence suggesting that NAFLD increases the risk of T2DM4 and leads to more disturbing glucolipid metabolism in T2DM patients. Insulin resistance (IR) and glycolipid metabolism dysfunction are often worse in patients with NAFLD and T2DM than in patients with only NAFLD or T2DM. As a result, much research effort has been devoted to investigating the underlying mechanisms that link NAFLD and T2DM. It is commonly assumed that IR plays a role in the onset and progression of both T2DM and NAFLD and that it may be the common underlying mechanism that links diabetes and NAFLD.3 However, the precise mechanism is still unknown.
Bone morphogenetic protein-9 (BMP-9) is an emerging discovery of a hepatocyte factor that was cloned from a liver cDNA library of the embryonic mouse. BMP-9 is highly expressed in the liver.5 It has been discovered to play an essential role in the regulation of lipid, glucose, and energy metabolism. By inhibiting hepatic gluconeogenesis, promoting myogenic glycogen synthesis, and stimulating insulin secretion, BMP-9 can lower blood glucose levels and improve insulin sensitivity.6 BMP-9 can also lower lipid levels and reduce lipid accumulation in the liver,7 regulating glucose homeostasis in the body while maintaining the dynamic balance of lipids. Studies have reported the variations of serum BMP-9 levels in diabetes mellitus as well as in metabolic syndrome (MetS).8,9 Luo et al8 showed that compared to healthy subjects, serum BMP-9 levels were significantly lower in patients with T2DM. Similarly, a study based on MetS patients showed that BMP-9 levels were significantly lower in MetS patients than in healthy controls.9 Both studies suggested a negative correlation between BMP-9 and HOMA-IR. However, no previous research has been conducted to investigate the relationship between serum BMP-9 levels and T2DM combined with NAFLD, a common condition that typically presents with more severe IR and glycolipid metabolism dysfunction than either T2DM or NAFLD alone. The relationship between BMP-9 and IR in patients with T2DM combined with NAFLD has also not been studied.
As a result, we examined the relationship between serum BMP-9 and indicators of glycolipid metabolism in T2DM with or without NAFLD as well as the change in serum BMP-9 in this study. We also evaluated IR and its correlation with serum BMP-9 in patients with single NAFLD, T2DM, or T2DM combined with NAFLD. With this research, we aim to shed more light on the pathophysiology of T2DM with NAFLD as well as any potential contributions BMP-9 might make to glycolipid metabolism.
Materials and Methods
Participants
The participants were sixty T2DM patients from the Endocrinology Department of Hebei General Hospital and sixty subjects from the Physical Examination Center of Hebei General Hospital. The above-mentioned participants were divided into four groups: Group 1: T2DM patients without NAFLD; Group 2: T2DM patients with NAFLD; Group 3: NAFLD patients without T2DM; and Group 4: normal controls. Each group contained 30 participants. This research was conducted in accordance with the Declaration of Helsinki and with the approval of the Hebei General Hospital’s medical ethics committee. All patients had signed the informed consent form before enrollment. Exclusion criteria were as follows:1) type 1 diabetes mellitus, gestational diabetes mellitus, and other special types of diabetes mellitus; 2) acute complications of diabetes; 3) viral hepatitis caused by hepatitis virus infection, direct or indirect damage to the liver by drugs, autoimmune liver disease caused by immune dysfunction in the body, etc; 4) alcohol consumption >70 g per week for women and >140 g per week for men; 5) malignant tumor; and 6) patients with severe hepatic or renal insufficiency.
Anthropometric and Biochemical Measurements
The following general details were collected: age, sex, occupation, drinking history, previous medical history, duration of diabetes, and family history. Height, weight, systolic blood pressure (SBP) and diastolic blood pressure (DBP) were measured by a medical professional, and body mass index (BMI) was computed. The formula was BMI = weight (kg)/height (m) squared. Blood samples were collected from the patients after 10–12h of overnight fasting. All subjects’ alanine aminotransferase (ALT), aspartate aminotransferase (AST), total cholesterol (TC), triglyceride (TG), high-density lipoprotein cholesterol (HDL-C), low -density lipoprotein cholesterol (LDL-C), apolipoprotein A1 (ApoA1) and apolipoprotein B (ApoB) levels were measured. In the interim, all subjects were subjected to an insulin release test and an oral glucose tolerance test (OGTT test). After consuming glucose water, blood was drawn at 30, 60, 120, and 180 min to measure blood glucose and insulin levels. Levels of fasting blood glucose (FBG) and fasting insulin (FINS) were determined using the glucose oxidase method and enzyme-linked immunosorbent assay (ELISA) respectively. The homeostasis model assessment of insulin resistance (HOMA-IR) was calculated as HOMA-IR= FBG (mmol/L)×FINS (μU/mL)/22.5.
Measurements of Circulating BMP-9 Levels
Fasting venous blood was retained in serum separator tubes and allowed to stand for 2 h at 18–25 °C. Thereafter, the blood was centrifuged for 20 min (1000×g) in an LDZ-2 automatic balancing centrifuge, and the supernatant obtained was collected in 500 μLEP tubes and stored in a low-temperature refrigerator at −80 °C for the detection of BMP-9. Human BMP-9 ELISA Kit was purchased from Cloud-Clone Corp, Wuhan, China. In addition, the ELISA procedure was carried out in accordance with the BMP-9 instructions.
Statistical Analysis
Data from our study were statistically analyzed using SPSS 21.0 software. The Shapiro–Wilk test was used to test the normality of the data. The measured data of the normal distribution is represented by mean ± standard deviation. Comparisons were made between the two groups, and the independent t-test was fully utilized to complete the comparison process. The analysis of variance (ANOVA) test was utilized to compare data from multiple groups. The 25th to 75th interquartile range was used to express measurement data for non-normal distributions, and the rank sum test was applied to compare groups. For categorical variables, data were expressed as numbers or percentages, and the chi-square test was used to compare categorical variables. The correlations between BMP-9 and clinical index were examined using linear correlation analysis and multiple linear regression analysis, and the relationship between BMP-9 and T2DM combined with NAFLD were examined using logistic regression. P < 0.05 or P < 0.01 was considered the threshold of significance.
Results
Comparative Analysis of the Clinical Characteristics of the Four Groups
Age, gender, and duration of diabetes were not substantially different among the four study groups, although BMI, SBP, and DBP were significantly different (P<0.05). When compared to the T2DM group, the BMI of the T2DM+NAFLD group was higher (P<0.01). The T2DM+NAFLD group exhibited higher BMI, SBP, and DBP (P<0.01), the T2DM group exhibited higher SBP and DBP (P<0.05 or P<0.01), and the NAFLD group exhibited higher BMI and DBP (P<0.05 or P<0.01) compared to the NC group (Table 1).
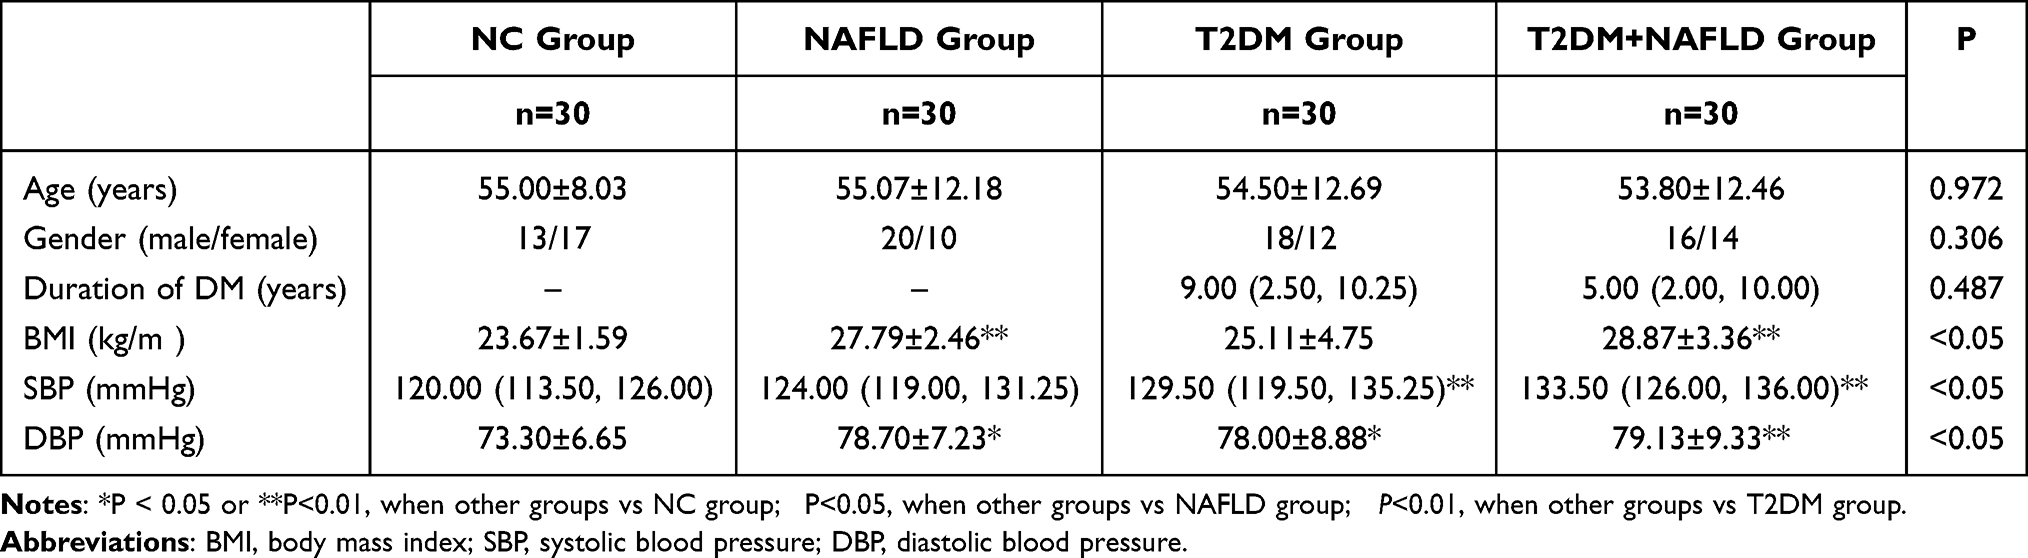 |
Table 1 Clinical Characteristics of the Four Groups |
Comparative Analysis of Serological Markers in the Four Groups
Between the four study groups, there were no statistically significant differences in AST and ApoA1 levels, but there were statistically differences in ALT, TC, TG, HDL-C, LDL-C, ApoB, FBG, FINS, and HOMA-IR levels (P<0.05). TC, ApoB, FINS, and HOMA-IR were higher in the T2DM+NAFLD group compared to the T2DM group (P<0.05). Compared to the NC group, the T2DM+NAFLD group had higher ALT, TC, TG, LDL-C, ApoB, FBG, FINS, and HOMA-IR, but lower HDL-C (P<0.05 or P<0.01), the T2DM group had higher FBG, FINS, and HOMA-IR, but lower HDL-C (P<0.01), and the NAFLD group had higher TG, ApoB, FINS, and HOMA-IR, but lower HDL-C (P<0.05 or P<0.01) (Table 2).
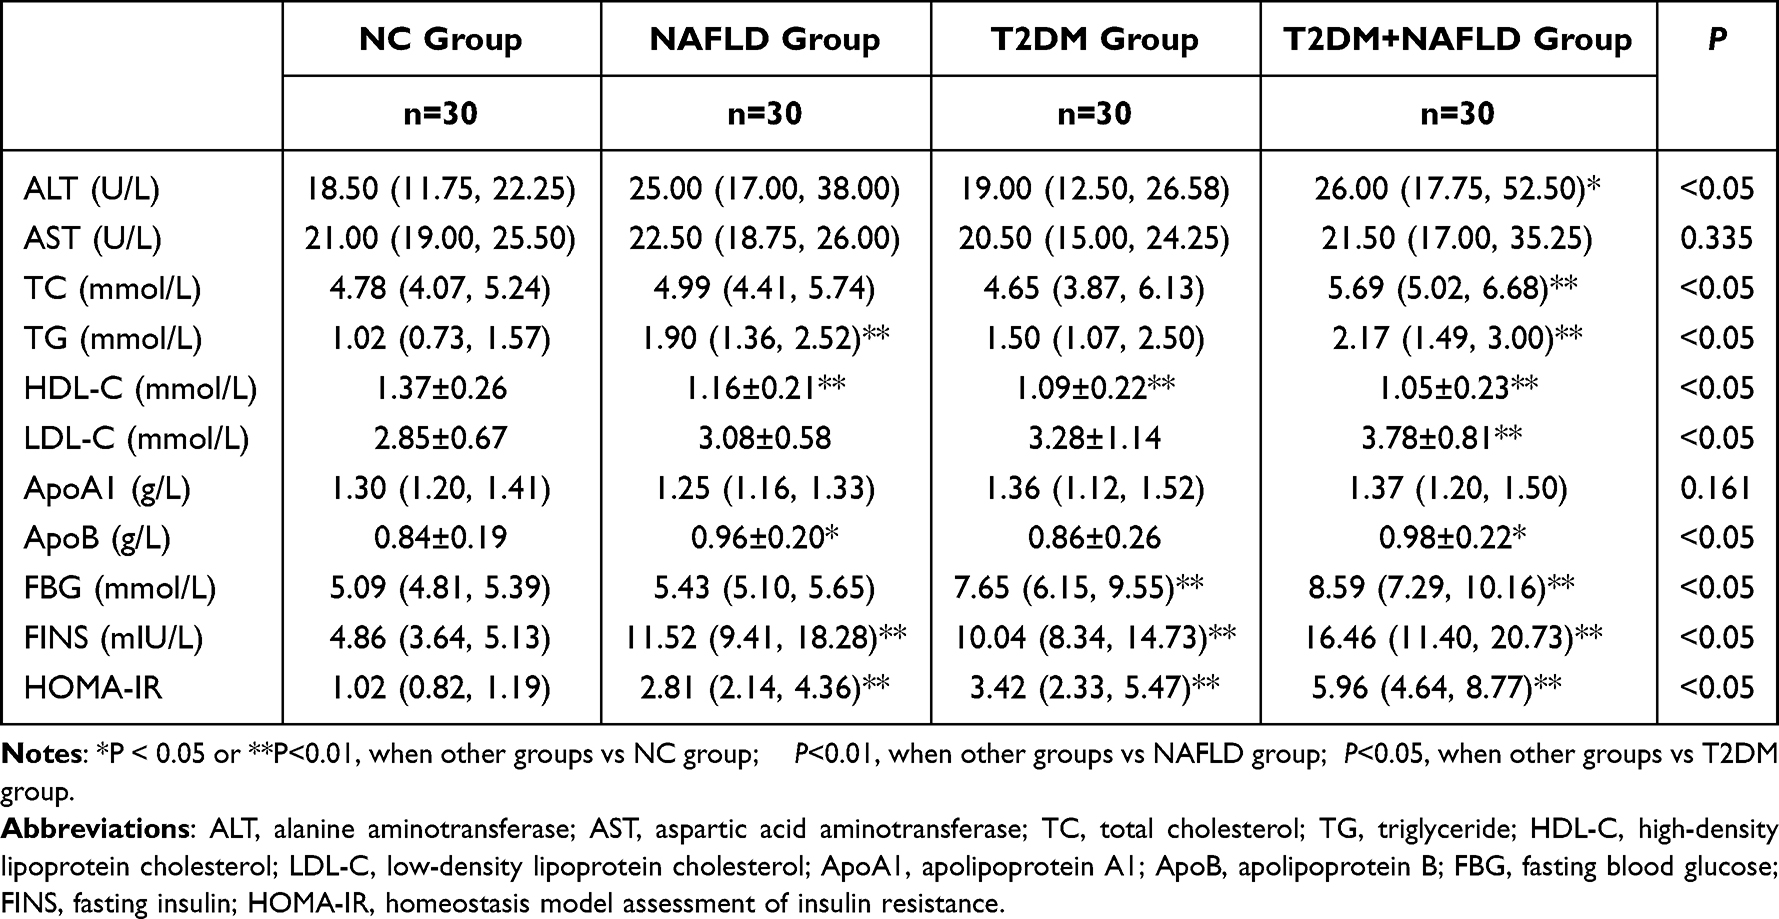 |
Table 2 Comparative Analysis of Serological Markers in the Four Groups |
Comparative Analysis of Serum BMP-9 Levels Across the Four Groups
The serum BMP-9 levels varied significantly among the four groups (P<0.05). Compared to the T2DM group, the T2DM+NAFLD group had a lower serum BMP-9 level. Compared to the NC group, the T2DM+NAFLD, T2DM, and NAFLD groups all had a lower serum BMP-9 level (P<0.01) (Table 3).
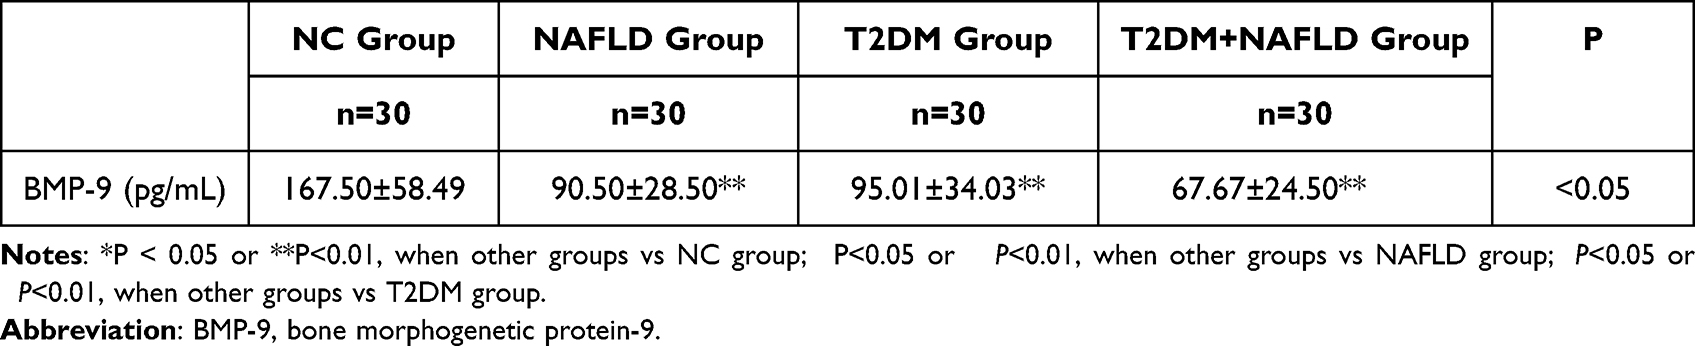 |
Table 3 Comparative Analysis of Serum BMP-9 Levels Across the Four Groups |
Relationship Between Circulating BMP-9 Levels and Other Clinical Parameters
Following that, the correlation between serum BMP-9 levels and anthropometric and biochemical markers was investigated further. The BMP-9 level was negatively correlated with BMI, SBP, DBP, ALT, TC, TG, LDL-C, FBG, FINS, and HOMA-IR, while it was positively correlated with HDL-C (P<0.01, Table 4). However, this correlation was not seen in males. There were no correlations found between circulating BMP-9 and AST, ApoA1, and ApoB. Multiple stepwise regression analysis revealed that serum BMP-9 levels were independently correlated with FINS, LDL-C, HDL-C, and BMI (P<0.05 or P<0.01, Table 5).
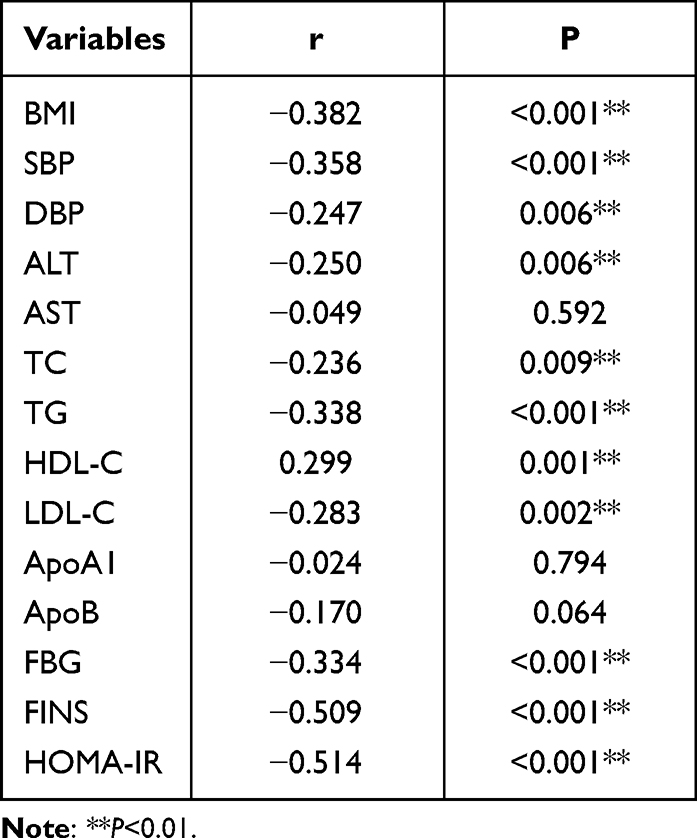 |
Table 4 Linear Association of BMP-9 and Other Clinical Parameters |
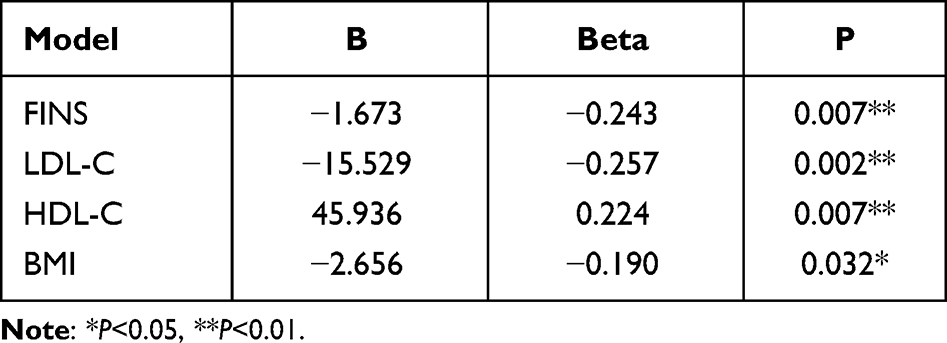 |
Table 5 Multiple Stepwise Regression Analyses of BMP-9 and Other Clinical Parameters |
Logistic Regression Analysis of T2DM Combined with NAFLD
In multivariate logistic regression analysis, HOMA-IR (OR=1.913, 95% CI 1.020–3.588, P=0.043) and BMP-9 (OR=0.939, 95% CI 0.899–0.981, P=0.005) were still found to be the independent influencing factors of T2DM combined with NAFLD even after adjusting for confounders (Table 6).
 |
Table 6 Logistic Regression Analysis of T2DM Combined with NAFLD |
Discussion
Our research is the first to examine the alterations in serum BMP-9 in T2DM paired with NAFLD. As is well known, patients with diabetes have a substantially higher prevalence of NAFLD.10 Patients with T2DM appear to be more susceptible to developing NAFLD than people without diabetes.11 In addition, diabetic patients are more likely to develop more severe forms of NAFLD, including nonalcoholic steatohepatitis (NASH), advanced fibrosis, and cirrhosis.12 The study by Luo and Xu demonstrated that BMP-9 is considerably decreased in T2DM and metabolic syndrome.8,9 Similar BMP-9 modifications were seen in the current investigation as in prior research. Serum BMP-9 levels are significantly lower in both the T2DM and NAFLD groups compared to healthy controls. However, no previous studies have been conducted to examine the alterations in BMP-9 in T2DM paired with NAFLD, which is a prevalent condition in T2DM and implies an even worse glycolipid metabolic disorder. Our investigation discovered a significant reduction in circulating BMP-9 levels in the T2DM+NAFLD group when compared to the T2DM or NAFLD group. According to logistic regression analysis, BMP-9 is an independent risk factor for T2DM paired with NAFLD.
Furthermore, our study discovered that HOMA-IR showed an overall upward trend, whereas serum BMP-9 levels showed a downward trend from the NC group, NAFLD group, or T2DM group, to the T2DM+NAFLD group. Correlation analysis showed a negative correlation between BMP-9 and HOMA-IR, suggesting that BMP-9 is associated with IR. Some previous studies have investigated the relationship between BMP-9 and IR. Caperuto et al13 established three different models of IR: rats with prolonged fasting (72 h), rats treated with dexamethasone (a known inducer of IR), and rats after pinealectomy. The results of Caperuto’s study revealed that BMP-9 mRNA expression was significantly decreased in the liver of three insulin-resistant rat models. Similarly, in human studies, it is found that BMP-9 levels were negatively correlated with HOMA-IR in T2DM and MetS patients.8,9 In our study, patients with T2DM+NAFLD had lower serum BMP-9 levels and higher HOMA-IR, demonstrating that IR is more severe in T2DM+NAFLD patients than in those with only T2DM or NAFLD and that BMP-9 is closely related to IR.
BMP-9 may be involved in IR via a variety of mechanisms. Some studies have suggested that BMP-9 may improve insulin sensitivity. In 2003, Chen et al screened 8000 human proteins using high-throughput cell-based assays for their ability to regulate glucose metabolism.6 BMP-9 was positive in two of these assays: reduction of phosphoenolpyruvate carboxykinase (PEPCK) expression in hepatocytes and activation of serine/threonine kinase (Akt) in differentiated myotubes. This suggests that BMP-9 inhibits hepatic gluconeogenesis as well as glycogen synthesis in muscle tissues. In addition, Sooho et al14 found that administration of MB109, a recombinant derivative of BMP-9, can increase the expression levels of CD137 and UCP1 and improve IR in adipose tissues in mice. These studies support that BMP-9 can regulate insulin sensitivity in the liver, skeletal muscles, and adipose tissues. However, another study indicates that insulin can conversely regulate the expression of BMP-9. Luo et al8 performed a euglycemic–hyperinsulinemic clamp (EHC) study and investigated the effect of hyperinsulinemia on circulating BMP-9 in healthy participants. The findings demonstrated that with increased insulin infusion, short-term hyperinsulinemia led to a gradual decline in BMP-9 levels, demonstrating an impact of insulin on the regulation of BMP-9. In the present study, we found that FINS had a negative correlation with BMP-9 and was an independent factor influencing serum BMP-9 levels. Taken together, current research findings suggest a correlation between BMP-9 and IR, but the causal relationship between BMP-9 and insulin sensitivity remains unknown. Further research is needed for illustrating the relationship between BMP-9 and insulin sensitivity.
Our study also showed a negative correlation between BMP-9 and FBG. This result is similar to previous studies. In Luo’s study,8 the level of circulating BMP-9 in T2DM patients was significantly lower than in healthy subjects. BMP-9 has been shown in animal studies to reduce blood glucose levels in both normal and diabetic mice.6 As stated in the preceding sentence, BMP-9 may improve insulin sensitivity in the liver, muscle, and adipose tissue via distinct mechanisms. These may explain the glucose-lowering effect of BMP-9. Furthermore, some studies have shown that BMP-9 can lower blood glucose levels by regulating insulin secretion. The administration of recombinant BMP-9 to normal rats resulted in significantly lower plasma glucose levels and significantly increased insulin secretion.6 Thus, the role of BMP-9 in regulating glucose metabolism may be mediated by both IR improvement and insulin release stimulation.
In our study, serum BMP-9 is lower in the NAFLD group than in the healthy control group, and it is even lower in the T2DM+NAFLD group than in the NAFLD group alone. Previous studies have suggested that BMP-9 is associated with the development of NAFLD. Yang et al15 discovered that serum BMP-9 levels are significantly lower in NAFLD patients, and hepatic BMP-9 expression is lower in db/db mice compared to wild-type (WT) mice. In Yang’s study,15 BMP-9-KO mice developed hepatic steatosis, which was accompanied by significantly reduced peroxisome proliferator-activated receptor α (PPARα) mRNA and protein expression in the liver. It has been reported that PPARα is highly expressed in the liver and promotes fatty acid oxidation. Decreased hepatic PPARα leads to reduced expression of fatty acid oxidation genes, which exacerbates TG accumulation and accelerates hepatic steatosis.16 However, BMP-9 may also play a compensatory role in the development of NAFLD. Breitkopf-Heinlein et al5 found that low levels of BMP-9 promoted healing and regeneration of liver wounds in a mouse model of acute liver injury, while the absence or inhibition of BMP-9 significantly improved fibrosis formation during chronic liver injury. This finding suggested that BMP-9 could be a promising NAFLD treatment target. Consequently, the lower levels of BMP-9 found in patients with T2DM+NAFLD may also represent a compensatory mechanism that promotes liver regeneration under stressful conditions. Further investigation is needed to intricate the effects of BMP-9 in the pathogenesis of NAFLD.
This study also found that BMP-9 levels were positively correlated with HDL-C and negatively correlated with BMI, TC, TG, and LDL-C, suggesting that BMP-9 is involved in the regulation of lipid metabolism. Animal studies have shown that up-regulation of BMP-9 levels reduces serum TC and TG levels in mice. Conversely, the down-regulation of BMP-9 levels in mice led to a remarkable increase in lipid levels, which further disrupted lipid metabolism.7 Similarly, human studies have found that BMP-9 is positively correlated with HDL-C and negatively correlated with the waist-to-hip ratio (WHR) and triglycerides in patients with MetS.9 All of the aforementioned investigations produced comparable outcomes to our own. Regarding the mechanism by which BMP-9 influences lipid metabolism, it has been demonstrated that BMP-9 can reduce body weight and prevent the development of obesity in obese animals, primarily by reducing intake, decreasing eating efficiency, shrinking the size of white adipocytes, and inducing browning of subcutaneous white adipose tissues.7 BMP-9 can also stimulate the proliferation of 3T3-L1 preadipocytes,6 which has a leptin-like effect.17 Leptin has beneficial effects on the regulation of lipid metabolism, such as increasing energy expenditure and inhibiting lipid deposition.18 However, these findings have not been validated in humans, and additional research is necessary.
The study we conducted has some limitations. First, because this study was cross-sectional, it was impossible to determine a causal link between BMP-9 and T2DM paired with NAFLD. However, our findings still provide novel insights into the potential role of BMP-9 in the prevention and management of T2DM combined with NAFLD. Second, the sample size of this study was relatively small and it was limited to the Chinese population. Finally, HOMA-IR may not be the most accurate indicator of IR. More precise measurement methods, such as the hyperinsulinemic–euglycemic clamp test, can provide a more accurate assessment.
In summary, our findings imply that serum BMP-9 levels in T2DM patients with NAFLD are significantly lower than in people with only T2DM or NAFLD. BMP-9 is an independent risk factor for T2DM combined with NAFLD and is closely associated with IR. Further studies are required to determine the role of BMP-9 in glucose and lipid metabolism. BMP-9 is expected to be a new target for preventing and treating T2DM combined with NAFLD.
Acknowledgments
The authors would like to thank all the reviewers who participated in the review, as well as MJEditor for providing English editing services during the preparation of this manuscript.
Funding
This research did not receive any specific grant from funding agencies in the public, commercial, or not-for-profit sectors.
Disclosure
The authors declare that they have no conflicts of interest in this work.
References
1. Stefan N, Haring HU, Cusi K. Non-alcoholic fatty liver disease: causes, diagnosis, cardiometabolic consequences, and treatment strategies. Lancet Diabetes Endocrinol. 2019;7:313–324. doi:10.1016/S2213-8587(18)30154-2
2. Williamson RM, Price JF, Glancy S, et al. Prevalence of and risk factors for hepatic steatosis and nonalcoholic Fatty liver disease in people with type 2 diabetes: the Edinburgh Type 2 Diabetes Study. Diabets Care. 2011;34:1139–1144. doi:10.2337/dc10-2229
3. Acierno C, Caturano A, Pafundi PC, et al. Nonalcoholic fatty liver disease and type 2 diabetes: pathophysiological mechanisms shared between the two faces of the same coin. Explor Med. 2020;1. doi:10.37349/emed.2020.00019
4. Chen GY, Cao HX, Li F, et al. New risk-scoring system including non-alcoholic fatty liver disease for predicting incident type 2 diabetes in East China: shanghai Baosteel Cohort. J Diabetes Investig. 2016;7:206–211. doi:10.1111/jdi.12395
5. Breitkopf-Heinlein K, Meyer C, Konig C, et al. BMP-9 interferes with liver regeneration and promotes liver fibrosis. Gut. 2017;66:939–954. doi:10.1136/gutjnl-2016-313314
6. Chen C, Grzegorzewski KJ, Barash S, et al. An integrated functional genomics screening program reveals a role for BMP-9 in glucose homeostasis. Nat Biotechnol. 2003;21:294–301. doi:10.1038/nbt795
7. Yang M, Liang Z, Yang M, et al. Role of bone morphogenetic protein-9 in the regulation of glucose and lipid metabolism. FASEB J. 2019;33:10077–10088. doi:10.1096/fj.201802544RR
8. Luo Y, Li L, Xu X, et al. Decreased circulating BMP-9 levels in patients with Type 2 diabetes is a signature of insulin resistance. Clin Sci. 2017;131:239–246. doi:10.1042/CS20160543
9. Xu X, Li X, Yang G, et al. Circulating bone morphogenetic protein-9 in relation to metabolic syndrome and insulin resistance. Sci Rep. 2017;7:17529. doi:10.1038/s41598-017-17807-y
10. Younossi ZM, Golabi P, de Avila L, et al. The global epidemiology of NAFLD and NASH in patients with type 2 diabetes: a systematic review and meta-analysis. J Hepatol. 2019;71:793–801. doi:10.1016/j.jhep.2019.06.021
11. Targher G, Bertolini L, Rodella S, et al. Non-alcoholic fatty liver disease is independently associated with an increased prevalence of chronic kidney disease and proliferative/laser-treated retinopathy in type 2 diabetic patients. Diabetologia. 2008;51:444–450. doi:10.1007/s00125-007-0897-4
12. Mantovani A, Rigolon R, Mingolla L, et al. Nonalcoholic fatty liver disease is associated with an increased prevalence of distal symmetric polyneuropathy in adult patients with type 1 diabetes. J Diabetes Complications. 2017;31:1021–1026. doi:10.1016/j.jdiacomp.2017.01.024
13. Caperuto LC, Anhe GF, Cambiaghi TD, et al. Modulation of bone morphogenetic protein-9 expression and processing by insulin, glucose, and glucocorticoids: possible candidate for hepatic insulin-sensitizing substance. Endocrinology. 2008;149:6326–6335. doi:10.1210/en.2008-0655
14. Kim S, Choe S, Lee DKBMP-9. enhances fibroblast growth factor 21 expression and suppresses obesity. Biochim Biophys Acta. 2016;1862:1237–1246. doi:10.1016/j.bbadis.2016.04.006
15. Yang Z, Li P, Shang Q, et al. CRISPR-mediated BMP9 ablation promotes liver steatosis via the down-regulation of PPARalpha expression. Sci Adv. 2020;6. doi:10.1126/sciadv.abc5022
16. Chakravarthy MV, Lodhi IJ, Yin L, et al. Identification of a physiologically relevant endogenous ligand for PPARalpha in liver. Cell. 2009;138:476–488. doi:10.1016/j.cell.2009.05.036
17. Blagoev B, Kratchmarova I, Nielsen MM, et al. Inhibition of adipocyte differentiation by resistin-like molecule alpha. Biochemical characterization of its oligomeric nature. J Biol Chem. 2002;277:42011–42016. doi:10.1074/jbc.M206975200
18. Mrozinska S, Cieslik J, Broniatowska E, et al. Elevated leptin and decreased adiponectin independently predict the post-thrombotic syndrome in obese and non-obese patients. Sci Rep. 2018;8:6938. doi:10.1038/s41598-018-25135-y
 © 2022 The Author(s). This work is published and licensed by Dove Medical Press Limited. The full terms of this license are available at https://www.dovepress.com/terms.php and incorporate the Creative Commons Attribution - Non Commercial (unported, v3.0) License.
By accessing the work you hereby accept the Terms. Non-commercial uses of the work are permitted without any further permission from Dove Medical Press Limited, provided the work is properly attributed. For permission for commercial use of this work, please see paragraphs 4.2 and 5 of our Terms.
© 2022 The Author(s). This work is published and licensed by Dove Medical Press Limited. The full terms of this license are available at https://www.dovepress.com/terms.php and incorporate the Creative Commons Attribution - Non Commercial (unported, v3.0) License.
By accessing the work you hereby accept the Terms. Non-commercial uses of the work are permitted without any further permission from Dove Medical Press Limited, provided the work is properly attributed. For permission for commercial use of this work, please see paragraphs 4.2 and 5 of our Terms.