")
Back to Journals » OncoTargets and Therapy » Volume 13
Circular RNA Hsa_circ_0004018 Inhibits Wnt/β-Catenin Signaling Pathway by Targeting microRNA-626/DKK3 in Hepatocellular Carcinoma
Authors Zhu P, Liang H, Huang X, Zeng Q, Liu Y, Lv J, Ming L
Received 22 March 2020
Accepted for publication 29 June 2020
Published 22 September 2020 Volume 2020:13 Pages 9351—9364
DOI https://doi.org/10.2147/OTT.S254997
Checked for plagiarism Yes
Review by Single anonymous peer review
Peer reviewer comments 2
Editor who approved publication: Dr Federico Perche
Pengfei Zhu,1 Han Liang,2 Xiangbo Huang,1 Qinglei Zeng,2 Yanmin Liu,2 Jun Lv,2 Liang Ming1
1Department of Clinical Laboratory, The First Affiliated Hospital of Zhengzhou University, Zhengzhou, People’s Republic of China; 2Department of Infectious Diseases, The First Affiliated Hospital of Zhengzhou University, Zhengzhou, People’s Republic of China
Correspondence: Jun Lv
Department of Infectious Diseases, the First Affiliated Hospital of Zhengzhou University, 1 # Jianshe East Road, Zhengzhou, Henan 450052, People’s Republic of China
Email [email protected]
Liang Ming
Department of Clinical Laboratory, the First Affiliated Hospital of Zhengzhou University, 1 # Jianshe East Road, Zhengzhou, Henan 450052, People’s Republic of China
Email [email protected]
Background and Aim: Dysexpression of circular RNAs has been identified in multiple types of cancer. Hsa_circ_0004018 was reported to be significantly downregulated in hepatocellular carcinoma (HCC) and to display HCC-stage-specific expression features. However, the role of hsa_circ_0004018 in HCC progression remains unclear.
Methods: The expression of hsa_circ_0004018 or microRNA-626 (miR-626) was detected in tumor tissues and paired non-tumor tissues from HCC patients, as well as in one normal human liver cell line and 5 HCC cell lines by reverse transcription-quantitative polymerase chain reaction (RT-qPCR). 3-(4, 5-dimethylthiazol-2-yl)-2, 5-diphenyltetrazolium bromide (MTT) assay, dye exclusion assay, clonogenic assay, scratch migration assay and transwell assay were used to measure cell proliferation and migration capacity, respectively. Luciferase report assay and RNA pull down assay were performed to explore the regulatory effect of certain molecules on the expression of target genes.
Results: We found that the expression of hsa_circ_0004018 was lower in tumor tissues than in their paired non-tumor tissues from 28 out of 41 HCC patients. The difference in the expression between tumor tissues and non-tumor tissues was statistically significant (p< 0.001). Further analysis revealed that such lower expression in tumor tissues was much more common in bigger tumor size group (≥ 5cm) compared with the smaller tumor size group (< 5cm) (85% vs 42%, p=0.0007). Similarly, hsa_circ_0004018 was downregulated in HCC cell lines. Additionally, a negative correlation between hsa_circ_0004018 and miR-626 expression was noticed in HCC tissues. Moreover, we observed that hsa_circ_0004018 interacted with miR-626/DKK3 and contributed to HCC cell proliferation and migration through inhibiting Wnt/β-catenin signaling pathway in vitro. Furthermore, hsa_circ_0004018 blocked xenograft tumor growth in vivo through inhibiting Wnt/β-catenin signaling pathway by targeting miR-626/DKK3.
Conclusion: We revealed that hsa_circ_0004018/miR-626/DKK3 regulatory axis may be a possible novel therapeutic target for HCC.
Keywords: circular RNA, competing endogenous RNA, Wnt/β-catenin signaling pathway, hepatocellular carcinoma
Introduction
Hepatocellular carcinoma (HCC) is the 4th leading cause of cancer-associated deaths in the world, while half of the cases and deaths occur in China.1 In recent years, diagnostic and therapeutic strategies developed rapidly. HCC can be diagnosed at a very early stage.2 However, about 70% of HCC patients are diagnosed at the most advanced stage and miss the best opportunity for surgical treatments.3 Although large quantity achievements have been accomplished in the treatments for HCC, the long-term prognosis remains unsatisfactory. The 5-year overall survival (OS) rate was less than 30%.4 Therefore, these challenges give rise to much research on identifying novel and specific biomarkers for diagnosis and new targets for the treatment of HCC.5
Circular RNA (CircRNA) is a class of non-coding RNAs, which have high stability, forms a covalently closed continuous loop. It is resistant to exonuclease-mediated degradation due to the lack of 5ʹ or 3ʹ ends and is supposed to be more stable compared to linear RNA. In different cell types or developmental stages circRNAs display a specific expression profile.6 This characteristic reveals that circRNAs may play crucial roles in numerous physiological and pathophysiological processes.7 Much work proved that endogenous circRNAs embody selectively conserved microRNA (miRNA) binding sites.8 Therefore, circRNAs may act as competing endogenous RNAs (ceRNAs) or miRNA sponges by interacting with miRNA to regulate gene expression.9 Recent work has shown that circRNAs served as miRNA sponges in several cancers. Such as circPVT1 was reported to be upregulated in gastric cancer and act as a sponge for the miR-125 family.10 Similarly, a previous work showed that circHIPK3 could regulate cell proliferation and migration via the miR-124-AQP3 (Aquarium 3) axis in HCC.4
The Wnt/β-catenin signaling pathway participates in multiple cellular processes, such as cell fate determination, cell differentiation and proliferation in several developmental stages.11 In the presence of Wnt signaling, β-catenin is accumulated in the cytosol and then translocate into the nucleus to form complexes with lymphocyte enhancer factor (LEF)/T-cell factor (TCF) family of transcription factors to activate target genes (c-myc, Cyclin D, Axin-2 et al), many of which are involved in development and oncogenesis.12 Conversely, inhibition of Wnt signaling results in decreased accumulation of cytosolic β-catenin and its nuclear translocation, which consequently downregulates the expression of Wnt-target genes.13 So far as we know, Wnt/β-catenin signaling pathway plays a key role in numerous human malignancies, including HCC,14 osteosarcoma,15 melanoma16 and lung cancer.17
Dickkopf 3 (DKK3) encodes a secreted protein that contains two cysteine-rich regions and is involved in embryonic development through its interactions with the Wnt signaling pathway. Previous work mentioned that DKK3 is a powerful inhibitor of the Wnt signal transduction pathway.18 DKK3 inhibits β-catenin nuclear translocation in osteosarcoma cells resulting in suppression of downstream Wnt-mediated LEF/TCF activation.19
Previous work reported that hsa_circ_0004018 was significantly lower in tumor tissues compared with para-tumorous tissue from HCC patients.20 In this study, we showed that hsa_circ_0004018 interacted with miR-626/DKK3 and contributed to repress HCC progression through inhibiting the Wnt/β-catenin signaling pathway in vitro and in vivo. So, we believe that hsa_circ_0004018/miR-626/DKK3 regulatory axis is a hopeful novel therapeutic target for HCC.
Materials and Methods
Tissue Samples
Tumor tissues and paired non-tumor tissues were obtained from a total of 41 HCC patients who underwent hepatectomy from April 2015 to September 2016 in the Department of Hepatobiliary Surgery of the First Affiliated Hospital of Zhengzhou University. All histological slides were diagnosed by two pathologists independently and all tumors originated from patients who had a background of chronic hepatitis B infection and cirrhosis without any other hepatotropic virus infections. The tissues were frozen in liquid nitrogen immediately after surgical removal and then stored at −80°C until further analysis. The written informed consents from patients were obtained. The experiments were approved by ethics committee of the First Affiliated Hospital of Zhengzhou University and carried out in accordance with The Code of Ethics of the World Medical Association (Declaration of Helsinki) for experiments involving humans.
Cell Culture and Transfection
Normal human liver cell line HL7702 and HCC cell lines (Huh7, Bel7402, SNU182, Hep3B and SNU449) were obtained from the Cell Bank of the Chinese Academy of Sciences (Shanghai, China). They were cultured in Dulbecco’s modified Eagle’s (DMEM) medium or RPMI-1640 medium (Thermo Fisher Scientific, Inc., Waltham, MA, USA) with 10% fetal bovine serum (Thermo Fisher Scientific, Inc.) in a 5% CO2 incubator at 37°C. SiRNAs specifically targeting hsa_circ_0004018 (siR-hsa_circ_0004018-1 and siR-hsa_circ_0004018-2), siRNA scrambled control (siR-control), miR-626 mimics (miR-626), miRNA scrambled control (miR-control) were obtained from Shanghai GenePharma Co., Ltd. (Shanghai, China). The full length of hsa_circ_0004018 embodying wild type or mutated binding sites was separately cloned into pcDNA3.1 vector (Invitrogen, Carlsbad, CA, USA) to generate pcDNA-hsa_circ_0004018-WT (hsa_circ_0004018-WT) and pcDNA-hsa_circ_0004018-MUT (hsa_circ_0004018-MUT). The pcDNA3.1 empty vector (control) was used as the negative control. SNU449 and Hep3B cells at 75% confluence were transfected with these plasmids or oligonucleotides by using LipofectamineTM 2000 reagent (Invitrogen, Carlsbad, CA).
Reverse Transcription-Quantitative Polymerase Chain Reaction (RT-qPCR)
RT-qPCR was performed as described before.21 The relative expressions of mRNA and miRNA were detected using the Fast SYBR Green Master Mix (Thermo Fisher Scientific, Inc., Waltham, MA, USA) and TaqMan MicroRNA Assay kit (Applied Biosystem, USA) on an ABI7500 system (Applied Biosystem, USA), respectively. β-actin and U6 were used as internal reference controls for mRNA and miRNA, respectively. The PCR conditions were as follows: 95°C for 5 min, followed by 40 cycles of 95°C for 10 s and 60°C for 15 s. The relative fold changes of mRNA and miRNA were calculated using the 2−ΔΔCt method. The primer sequences used are listed in Table 1.
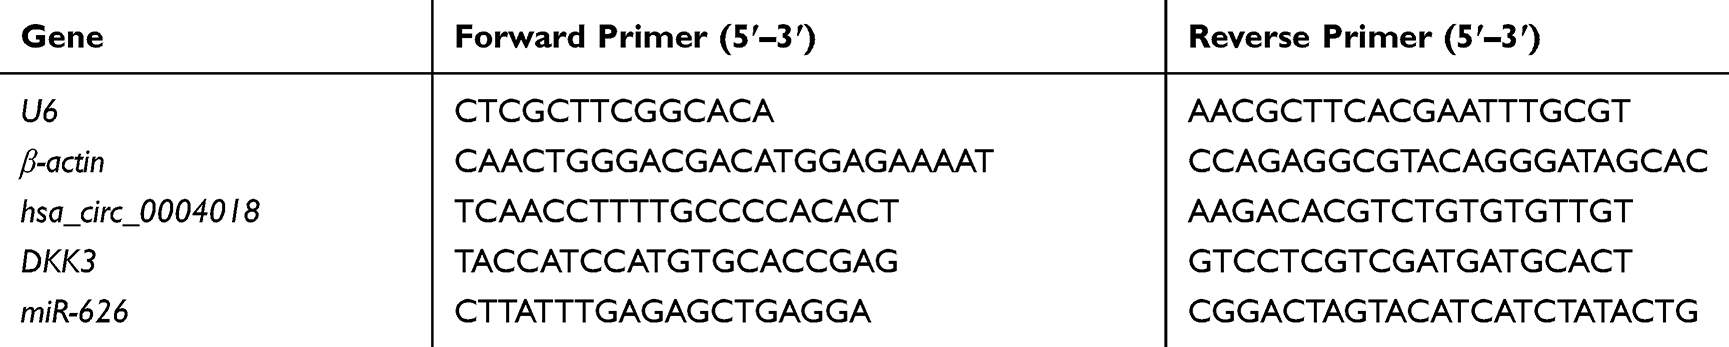 |
Table 1 The Primer Sequences Used in This Paper |
Western Blot Analysis
Proteins extraction and separation were performed as previously described.22 The primary antibodies anti-c-myc (1:1000 dilution) and anti-β-catenin (1:2000 dilution) were purchased from Abcam (Cambridge, MA, USA). Anti-DKK3 was purchased from Invitrogen (1:500 dilution, Carlsbad, CA). Anti-GAPDH was purchased from MBL (1:3000 dilution, Nagoya, Japan). Then, the membranes were incubated with horseradish peroxidase (HRP)-conjugated goat anti-mouse or anti-rabbit IgG secondary antibody (1:1000 dilution; Abcam, Cambridge, MA, USA) for 1h. Further, the immunoreactive bands were detected by enhanced chemiluminescence detection kit (GE Healthcare Life Sciences, Little Chalfont, UK).
MTT Assay
Cell proliferation was measured by using the 3-(4,5-dimethylthiazol-2-yl)-2,5-diphenyltetrazolium bromide (MTT) method as previously described.22 SNU449 and Hep3B cells were seeded in 96-well plates (3×10³ cells/well) and transfected with control, hsa_circ_0004018, miR-control, miR-626, control + miR-control, or hsa_circ_0004018 + miR-626. Following incubated with medium at 37°C for 3 days and cell number was detected every 24 hours by reading the absorbance at 570 nm using a microplate reader (Bio-Rad Laboratories, Inc., Hercules, CA, USA).
Dye Exclusion Assay
SNU449 and Hep3B cells were seeded in 96-well plates (3×10³ cells/well) and transfected with control, hsa_circ_0004018, miR-control, miR-626, control + miR-control, or hsa_circ_0004018 + miR-626. After 1, 2, or 3 days, the cells were detached with 0.05% trypsin and counted in Neubauer chamber in 0.4% trypan blue to determine the number of viable cells. The cell survival rate represented the survival ((unstained cells)/death (stained cells)) rate on each day. All experiments were performed in triplicates.
Clonogenic Assay
Cells were transfected with control, hsa_circ_0004018, miR-control, miR-626, control + miR-control or hsa_circ_0004018 + miR-626. After 24 h post-transfected, cells were seeded at 103 cells per well in 6-well plates and grown in normal growth media for 10 days and stained by crystal violet solution (0.5 in 25% methanol) to assess colony growth. A colony is defined as a cluster of at least 50 cells that can often be determined only through the microscope.
Scratch Migration Assay
Cells were seeded into a 12-well plate to form a confluent monolayer on the following day. The cell layers were carefully wounded using a sterile 20 μL tip to create a straight “scratch”. After PBS washing to discard the fallen cells by scratching, the plate was added with medium and incubated until scratch disappeared. Images of the wound monolayer were acquired on a phase contrast microscope linked to a charge-coupled device camera, and the wound area was measured using CT-AS software (Nikon, Tokyo, Japan) to count the number of pixels after the photographs had been converted to TIFF images.
Transwell Assay
Cell migration was carried out as previously described.21 The upper chambers were filled with 2×10⁴ transfected SNU449 and Hep3B cells with FBS-free RPMI-1640 or DMEM. The bottom chambers were filled with RPMI-1640 containing 10% FBS and incubated at 37°C. After incubation for 48 h, non-migratory cells in the top of the transwell were removed with a cotton swab. The cells migrated to the bottom side of the membrane were fixed by methanol, stained with 5% crystal violet and counted using a light microscope (Olympus Corporation, Tokyo, Japan) at least six random fields.
Luciferase Reporter Assay
Hsa_circ_0004018 luciferase reporter plasmids were constructed by inserting hsa_circ_0004018 sequence embodying the wild-type or mutated miR-626 binding sites into the downstream of psiCHECK luciferase reporter vector (Promega, Madison, WI, USA), named as hsa_circ_0004018-WT and hsa_circ_0004018-MUT. Similarly, psiCHECK luciferase reporter plasmids embodying the wildtype or mutated miR-626 binding sites in the 3ʹUTR fragment of DKK3 (DKK3-WT and DKK3-MUT) were also generated. For luciferase reporter assays, SNU449 and Hep3B cells were cotransfected with 100 nM miR-626 or miR-control and 100 ng psiCHECK luciferase reporter constructs, as well as 20 ng internal control vector pRL-SV40 (Promega, Madison, WI, USA) using LipofectamineTM 2000 (Invitrogen, Carlsbad, CA). At 48h post-transfection, the luciferase activities were detected by a dual-luciferase reporter (DLR) assay system (Promega, Madison, WI, USA), according to the supplier’s recommendations. Renilla luciferase activity was used as the normalization.
To determine the effects of hsa_circ_0004018 on TCF transcriptional activity, reporter constructs containing 3 repeats of the wild-type (TOP-flash) or mutant (FOP-flash) TCF-binding sites were used.23 SNU449 and Hep3B cells were seeded at the density of 5×10³ cells per well in 96-well plates 24h before transfection. Then, 48h after transfection, the luciferase activity was measured with a DLR assay system.
RNA Pull Down Assay
SNU449 and Hep3B cells were transfected with biotinylated miR-NC (Bio-NC) or biotinylated miR-626-WT (Bio-miR-626-WT) or biotinylated miR-626-MUT (Bio- miR-626-MUT), which were commercially synthesized by RiboBio (Guangzhou, China). At 48 h post-transfection, SNU449 and Hep3B cells were collected and lysed in lysis buffer containing 20 mM pH 7.5TRIS-HCl, 5 mM MgCl2, 100 mM NaCl, and 0.05% Igepal, protease inhibitors, 1 mM DTT, and 60 U/mL Superase-In. The cell lysates were cultured with M-280 streptavidin magnetic beads (Sigma) for 3 h at 4°C and washed five times by ice-cold lysis buffer. The bound RNAs were subjected to RT-qPCR analysis.
Tumor Xenograft Assay
The animal experimental procedures were approved by animal Ethics Committee of the First Affiliated Hospital of Zhengzhou University and were complied with the ARRIVE guidelines and the UK Animals (Scientific Procedures) Act. Transfect cells at 60–80% confluency with hsa-circ-0004018 vector. After 48h post-transfection, the cells were detached with 0.05% trypsin and split cells so that they ~25% confluent, then add fresh media containing G418 at a concentration of 800 µg/mL. Every 3–4 days, add fresh media containing G418 at a concentration of 800 µg/mL. After 10–14 days, we could see single foci throughout the plate. Transfer pooled foci to a 35mm dish and expand the cells. Hep3B cells (1×10⁶) stably transfected with hsa_circ_0004018 or control were suspended in 100 µL PBS, and then subcutaneously injected into either side of the posterior flank of the same male BALB/c nude mouse at age of 7 weeks. Tumor volume (V) was observed by measuring the length (L) and width (W) with calipers and calculated with the formula (L×W2) ×0.5. Tumor growth was monitored for 5 weeks. All mice were euthanized at 7th week after injection and tumors were dissected and weighted. The expressions of miR-626, DKK3, β-catenin, c-myc in excised tumors were detected by RT-qPCR or Western blot.
Statistical Analysis
Statistical analyses were performed using SPSS 18.0 (SPSS Inc., Chicago, IL, USA) software. Student’s t-test or one-way analysis of variance (ANOVA) was performed to evaluate the statistical significance. All results were presented as mean ± standard deviation (SD). p < 0.05 was considered statistically significant.
Results
Hsa_circ_0004018 Was Downregulated in HCC Tissues and Cell Lines
Initially, we analyzed the expression profile of hsa_circ_0004018 in 41 pairs HCC tissues samples (HCC tissues and paired non-tumor tissues) by using RT-qPCR. Our data showed that the level of hsa_circ_0004018 was lower in about 68% (28/41) of the HCC tumor compared to the paired non-tumor tissues. The expression difference was statistically significant (p<0.001) (Figure 1A). Moreover, we noticed that the reduced expression occurred much more frequently in tumor tissues with bigger tumor size group (≥5cm) compared to that with the small tumor size group (<5cm) (85% vs 42%, p=0.0007) (Table 2). Then, we examined the expression of hsa_circ_0004018 in normal human liver cell line HL7702 and 5 HCC cells. The results showed that hsa_circ_0004018 expression was remarkably decreased in 5 HCC cell lines (Huh7, Bel7402, SNU182, Hep3B and SNU449) compared with HL7702 (Figure 1B). For succeeding analysis we chose SNU449 and Hep3B cell lines as they showed the highest level of hsa_circ_0004018 among the 5 HCC cell lines.
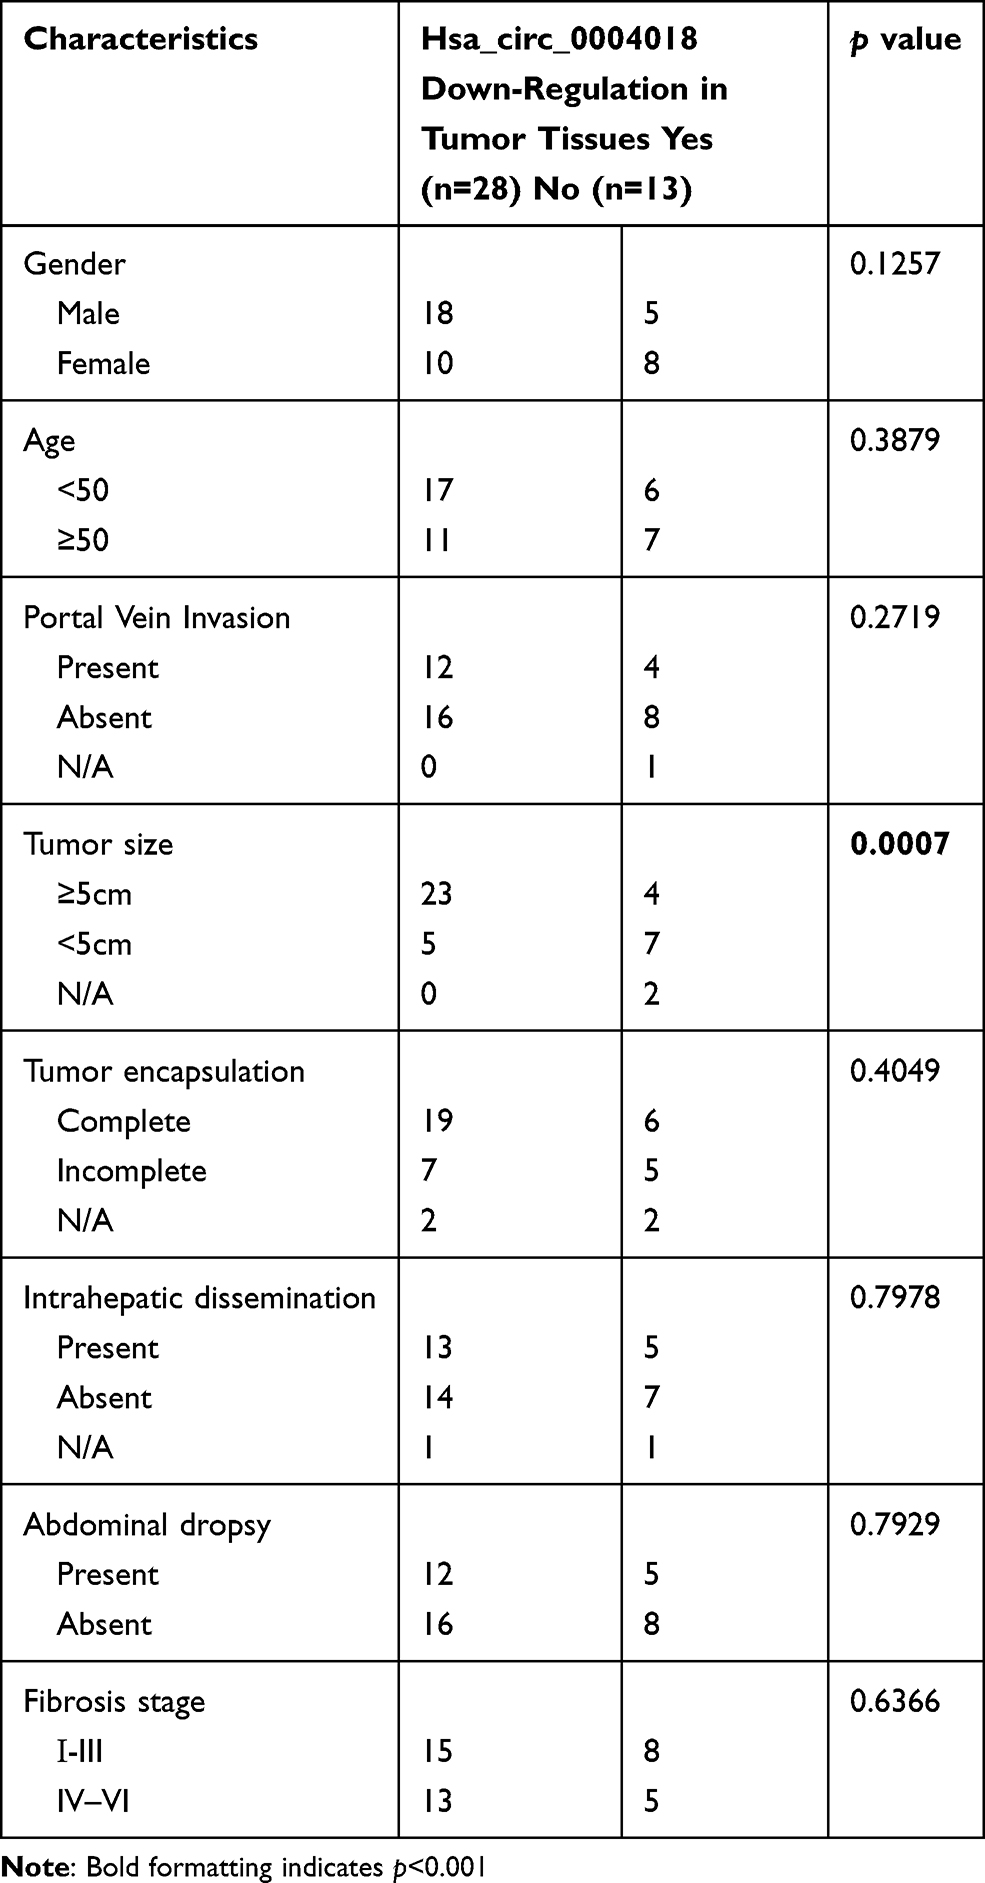 |
Table 2 Correlation Between Hsa_circ_0004018 mRNA Level and Clinicopathologic Characteristics |
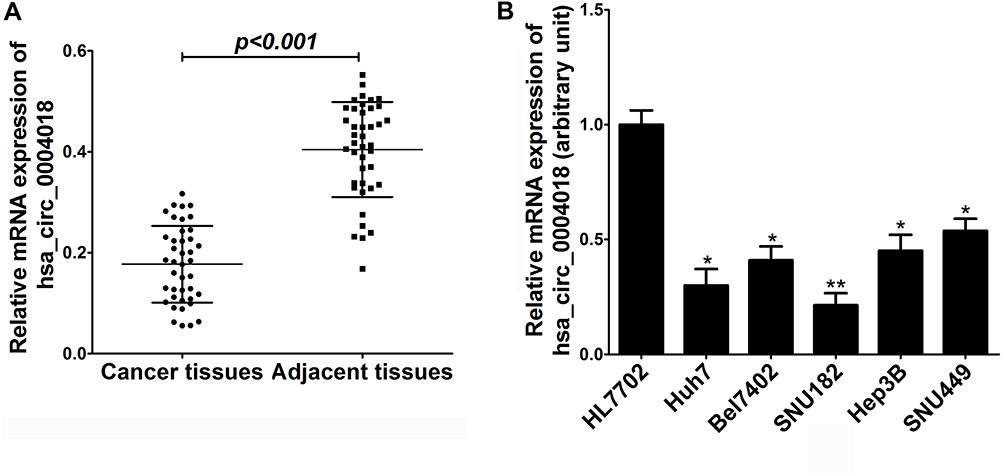 |
Figure 1 The expression of hsa_circ_0004018 in HCC tissues and cells. (A) The expression of hsa_circ_0004018 in 41 paired HCC tissues and matched non-tumor tissues was assessed by RT-qPCR. (B) The expression of hsa_circ_0004018 in five HCC cell lines (Huh7, Bel7402, SNU182, Hep3B and SNU449) and normal human liver cell line HL7702 was estimated by RT-qPCR. *p<0.05, **p<0.01. |
Hsa_circ_0004018 Negatively Regulated miR-626 Expression in HCC Cells
To elucidate the molecular mechanism by which hsa_circ_0004018 exerted its function during HCC development, we searched for the potential miRNA targets of hsa_circ_0004018 by using the Circbase (http://www.circbase.org/) and miRanda (http://www.microrna.org/). MiR-626 was predicted to contain the sequence complementary to the seed region of hsa_circ_0004018. The predicted binding sites are shown in Figure 2A. RT-qPCR results showed that miR-626 expression was remarkably higher in tumor tissues from 41 HCC patients compared to the matched adjacent non-tumor tissues (Figure 2B). Moreover, further analysis showed a significant negative correlation between hsa_circ_0004018 and miR-626 expression in HCC tissues (R2=0.4941, p=0.0001) (Figure 2C). To confirm the interaction between hsa_circ_0004018 and miR-626, we performed the luciferase reporter assays. Plasmids expressing hsa_circ_0004018 containing wild type or mutated binding sites for miR-626 (psiCHECK-hsa_circ_0004018-WT and psiCHECK-hsa_circ_0004018-MUT, respectively) were constructed. Either of was cotransfected with miR-626 or miR-control into SNU449 and Hep3B cells. We found that cotransfection of miR-626 resulted in a distinctive decrease of the luciferase activity in both SNU449 and Hep3B cells transfected with hsa_circ_0004018-WT but not transfected with hsa_circ_0004018-MUT (Figure 2D).
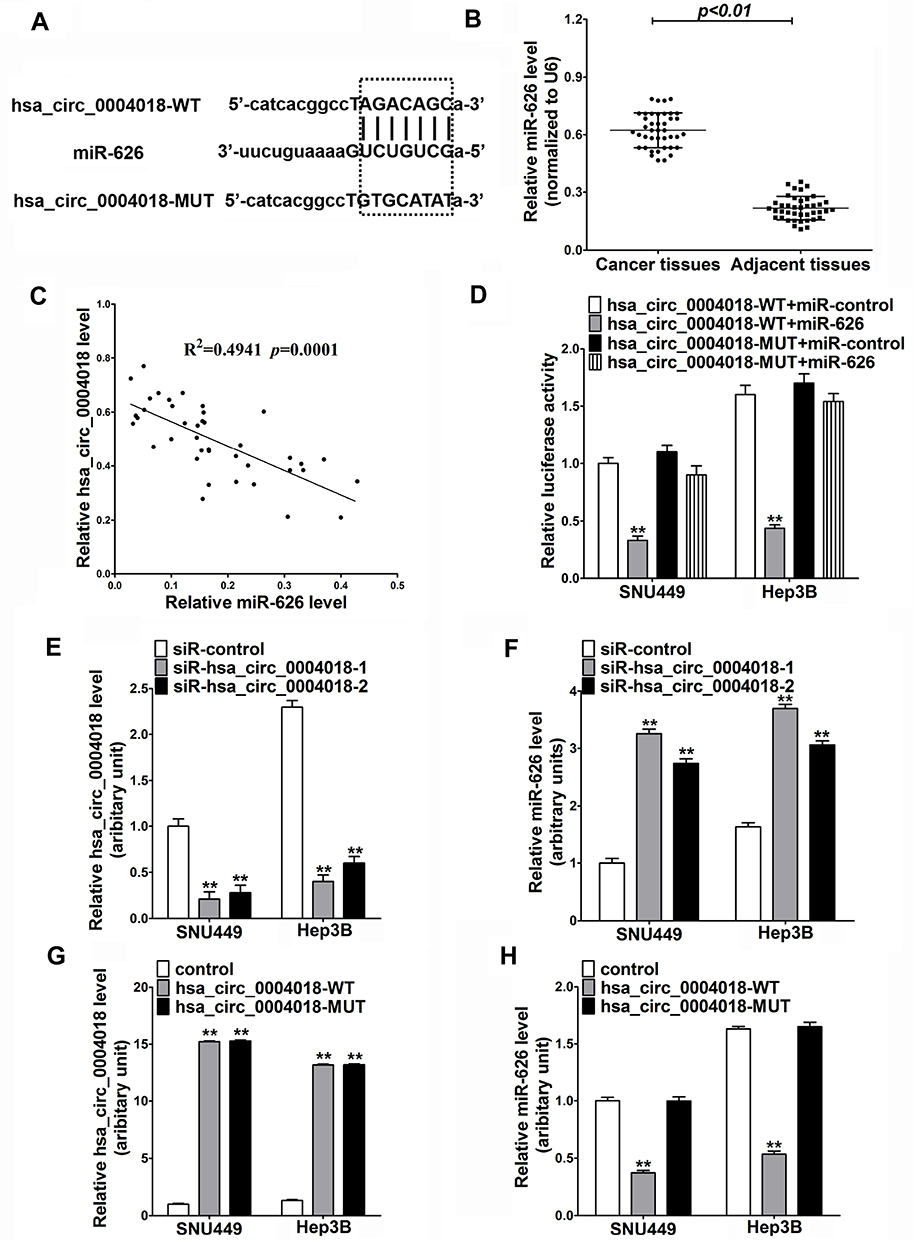 |
Figure 2 The interaction between hsa_circ_0004018 and miR-626 in HCC cells. (A) The wild-type (WT) or mutated (MUT) hsa_circ_0004018 fragments containing the predicted miR-626 binding sites. (B) The expression level of miR-626 in 41 paired HCC tissues and matched adjacent normal tissues was examined by RT-qPCR. (C) The correlation between hsa_circ_0004018 and miR-626 expression in HCC tissues. (D) Luciferase reporter assay was carried out to detect the luciferase activity in SNU449 and Hep3B cells after co-transfection with hsa_circ_0004018-WT (pcDNA-hsa_circ_0004018) or hsa_circ_0004018-MUT and miR-626 or miR-control. (E and F) The expression levels of hsa_circ_0004018 (E) and miR-626 (F) in SNU449 and Hep3B cells transfected with siR- hsa_circ_0004018-1, siR-hsa_circ_0004018-2, or siR-control were examined using RT-qPCR. (G and H) The expression levels of hsa_circ_0004018 (G) and miR-626 (H) in SNU449 and Hep3B cells transfected with hsa_circ_0004018-WT, hsa_circ_0004018-MUT, or control were assessed by RT-qPCR. **p<0.01. |
In addition, to further verify the regulatory relationship betweenhsa_circ_0004018 and miR-626, SNU449 and Hep3B cells were transfected with siR-hsa_circ_0004018-1, siR-hsa_circ_0004018-2, hsa_circ_0004018-WT, hsa_circ_0004018-MUT or respective controls. Hsa_circ_0004018 expression was remarkably reduced after transfection with siR-hsa_circ_0004018-1 or siR-hsa_circ_0004018-2 in SNU449 and Hep3B cells (Figure 2E), while, miR-626 expression was distinctively promoted in siR-hsa_circ_0004018-1 or siR-hsa_circ_0004018-2 transfected SNU449 and Hep3B cells (Figure 2F). Besides, we discovered that the endogenous expression of hsa_circ_0004018 could be dramatically increased after transfected with hsa_circ_0004018-WT or hsa_circ_0004018-MUT in both SNU449 and Hep3B cells (Figure 2G). Conversely, miR-626 level in both SNU449 and Hep3B cells was dramatically dropped when transfected with hsa_circ_0004018-WT but not with hsa_circ_0004018-MUT (Figure 2H). To sum up, hsa_circ_0004018 directly negatively regulated miR-626 in HCC cells.
DKK3, a Target of miR-626, Was Positively Regulated by Hsa_circ_0004018 in HCC Cells
We used Targetscan (http://www.targetscan.org/) and miRanda (http://www.microrna.org/) algorithms to predict the potential targets of miR-626. According to CircBank (http://www.circbank.cn/), there is only one binding site (positions 973) of miR-626 in hsa_circ_0004018. As shown in Figure 3A, DKK3 was predicted to be a potential target of miR-626 due to its low expression and plays an essential role in carcinogenesis of HCC.24 Next, to further confirm the function of miR-626, SNU449 and Hep3B cells were transfected with miR-626 and miR-control. MiR-626 expression was greatly elevated after transfection with miR-626 in SNU449 and Hep3B cells (Figure 3B). Moreover, further analysis showed a significant correlation between hsa_circ_0004018 and DKK3 expression in HCC tissues (R2=0.3358, p<0.0001) (Figure 3C).Results from luciferase reporter assay showed that overexpression of miR-626 dramatically decreased the luciferase activity of DKK3-WT, but not DKK3-MUT in both SNU449 and Hep3B cells, which was remarkably restored by cotransfection with hsa_circ_0004018 (Figure 3D and E). In addition, exogenous expression of hsa_circ_0004018 could dramatically elevate mRNA and protein expression levels of DKK3 by RT-qPCR and Western blot analysis (Figure 3F–I). Furthermore, ectopic expression of miR-626 remarkably reduced the mRNA and protein levels of DKK3 as well as greatly rescued hsa_circ_0004018-mediated elevation of DKK3 mRNA and protein expression (Figure 3F–I). Consequently, we supposed that hsa_circ_0004018 could regulate DKK3 expression by functioning as a ceRNA for miR-626 in HCC cells.
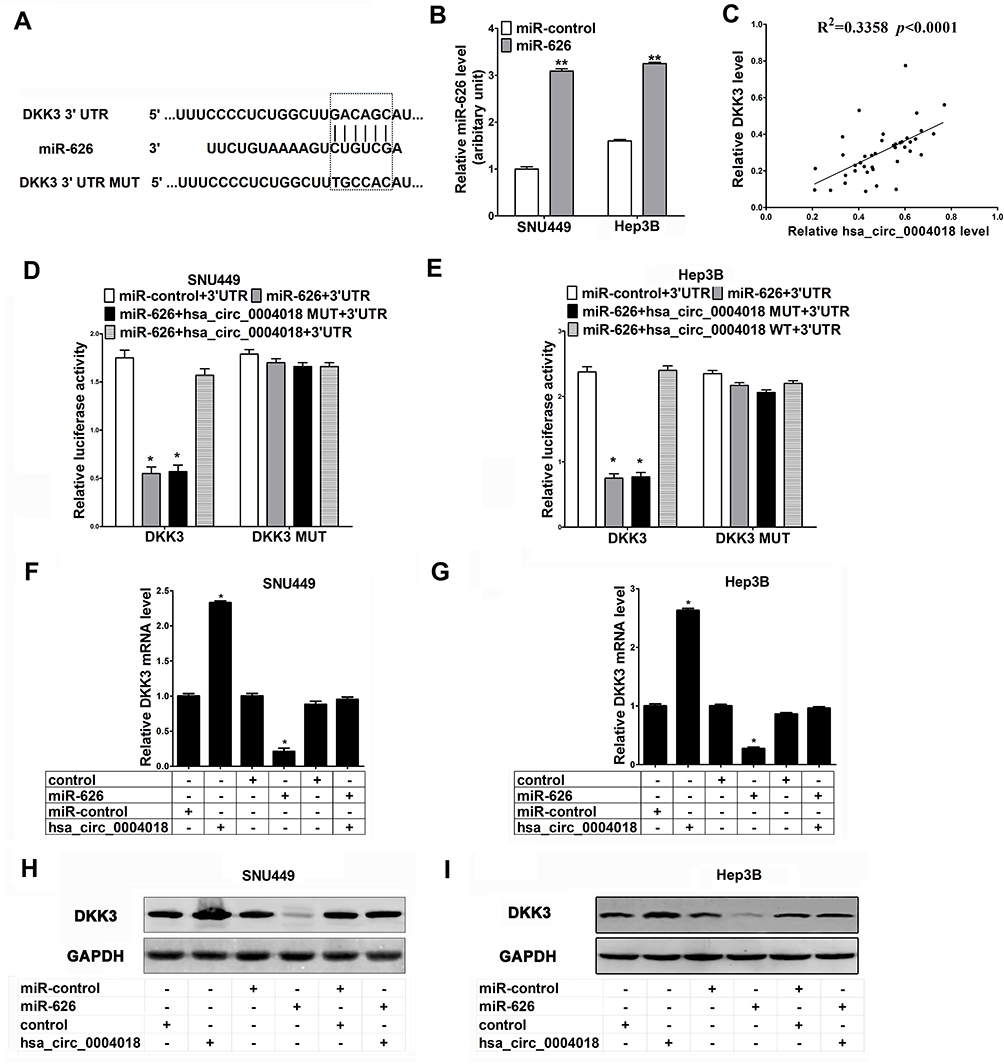 |
Figure 3 The interaction among hsa_circ_0004018, DKK3 and miR-626 in HCC cells. (A) Bioinformatics analysis showed the predicted binding sites between DKK3 and miR-626. (B) The expression levels of miR-626 in SNU449 and Hep3B cells transfected with miR-control or miR-626 were examined using RT-qPCR. (C) The correlation between hsa_circ_0004018 and DKK3 expression in HCC tissues. (D and E) Luciferase reporter assay was performed to measure the luciferase activity in SNU449 and Hep3B cells after transfection with miR-626 + DKK3 3ʹUTR, miRNA-control + DKK3 3ʹUTR, miR-626 + hsa_circ_0004018-MUT + DKK3 3ʹUTR, or miR-626 + hsa_circ_0004018-WT +DKK3 3ʹUTR. Or transfection with miR-626 + DKK3 MUT 3ʹUTR, miRNA-control + DKK3 MUT 3ʹUTR, miR-626 + hsa_circ_0004018-MUT + DKK3 MUT 3ʹUTR, or miR-626 + hsa_circ_0004018-WT +DKK3 MUT 3ʹUTR. (F and G) The mRNA levels of DKK3 were examined by RT-qPCR in SNU449 and Hep3B cells transfected with hsa_circ_0004018, control, miR-626 or miR-control. (H and I) The protein levels of DKK3 were examined by Western blot in SNU449 and Hep3B cells transfected with hsa_circ_0004018, control, miR-626 or miR-control. *p<0.05.**p<0.01 |
Hsa_circ_0004018 Suppressed HCC Cell Proliferation and Migration by Interacting with miR-626
To reveal the function of hsa_circ_0004018 in HCC carcinogenesis, we further assessed the effects of hsa_circ_0004018 on cell proliferation and migration abilities of SNU449 and Hep3B cells. MTT assay showed that proliferation of SNU449 and Hep3B cells was dramatically suppressed when transfected with hsa_circ_0004018 compared with transfected with control. Conversely, transfection of miR-626 significantly promoted proliferation of SNU449 and Hep3B cells. Furthermore, there was no difference between cells transfected with miR-control + control and hsa_circ_0004018 + miR-626 (Figure 4A and B). To emphasize on the observation that hsa_circ_0004018 inhibited cell proliferation while miR-626 promoted cell proliferation of HCC cells, we also do a Dye exclusion assay as well as a clonogenic assay for long-term proliferation assay. Dye exclusion assay showed that cell viability of SNU449 and Hep3B cells was no difference between cells transfected with hsa_circ_0004018 compared with transfected with control. Similarly, cell viability of SNU449 and Hep3B cells was no difference between cells transfected with miR-626, miR-control + control and hsa_circ_0004018 + miR-626 (Figure 4C and D). Moreover, clonogenic assay showed that long-term proliferation of SNU449 and Hep3B cells was remarkably suppressed when transfected with hsa_circ_0004018 compared with transfected with control. Conversely, transfection of miR-626 significantly promoted long-term proliferation of SNU449 and Hep3B cells. Moreover, there was no difference between cells transfected with miR-control + control and hsa_circ_0004018 + miR-626 (Figure 4E and F). These data suggested that hsa_circ_0004018 suppressed cell proliferation by interacting with miR-626.In addition, cell migration assay revealed that exogenous expression of hsa_circ_0004018 distinctively reduced the ability of cell migration of SNU449 and Hep3B (Figure 4G and H). Moreover, cotransfected with miR-626 neutralized the anti-migratory effect of hsa_circ_0004018. Similarly, for emphasizing on cell migration, we also do a scratch migration assay, the data showed that exogenous expression of hsa_circ_0004018 evidently reduced the ability of cell migration of SNU449 and Hep3B (Figure 4I and J). Furthermore, cotransfected with miR-626 neutralized the anti-migratory effect of hsa_circ_0004018.
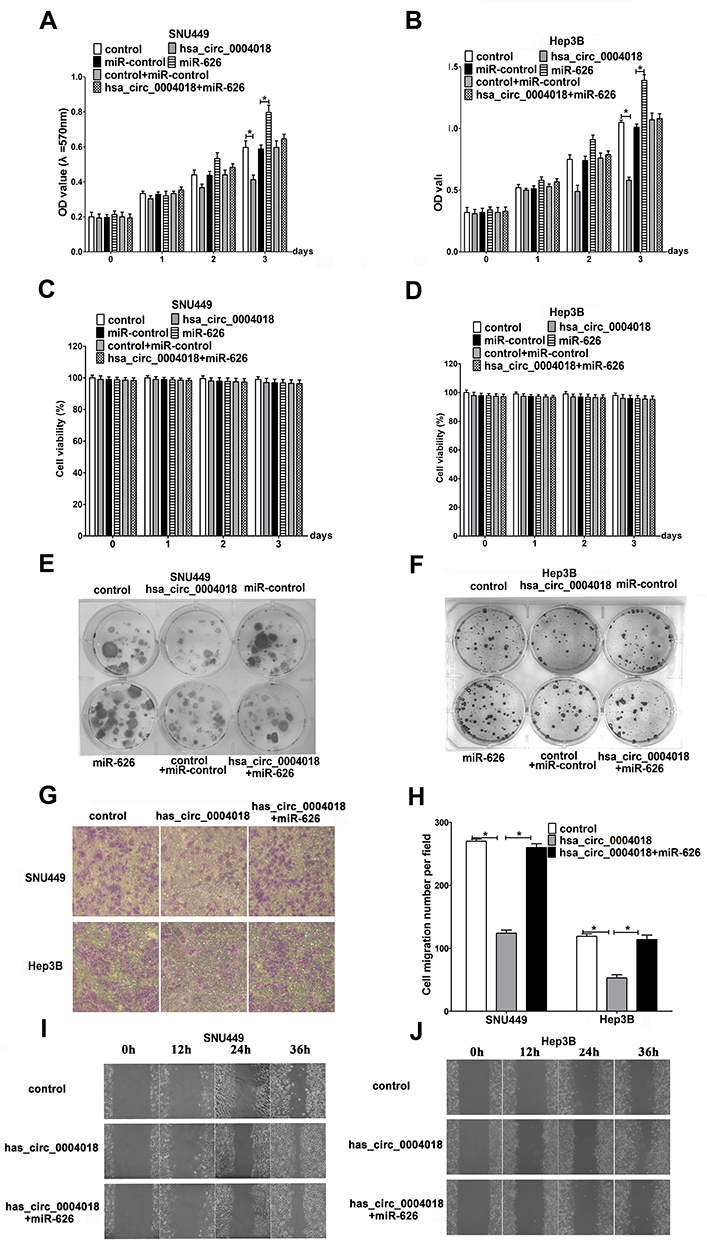 |
Figure 4 Hsa_circ_0004018 remarkably hindered HCC cell proliferation and migration. SNU449 and Hep3B cells were introduced with hsa_circ_0004018, control or hsa_circ_0004018 + miR-626. (A and B) MTT assay was applied to measured cell proliferation at 1 day, 2 days, and 3 days in transfected SNU449 and Hep3B cells. (C and D) Dye exclusion assay was applied to detected cell viability at 1 day, 2 days, and 3 days in transfected SNU449 and Hep3B cells. (E and F) Clonogenic assay was performed to detected long-term proliferation capacity. (G–J) Cell migration assay was conducted to evaluate the ability of cell migration in transfected SNU449 and Hep3B cells. (G and H) Transwell assay was carried out after incubation for 48 h and scratch migration assay (I and J) was carried out at 0 h,12 h, 24 h and 36 h. *p<0.05. |
These data indicated, hsa_circ_0004018 significantly prevented cell migration by interacting with miR-626 in HCC.
Hsa_circ_0004018 Interacted with miR-626 to Inhibit Wnt/β-Catenin Signaling Pathway
To uncover the underlying molecular mechanism by which hsa_circ_0004018 regulated the progression of HCC, we performed TOP/FOP FLASH experiment in SNU449 and Hep3B cells. These data manifested overexpression of hsa_circ_0004018 distinctively decreased the transcriptional activity of β-catenin/TCF while ectopic expression of miR-626 remarkably increased luciferase activity in SNU449 and Hep3B cell. Moreover, cells cotransfected with hsa_circ_0004018 and miR-626 showed equal luciferase activity compared with cells cotransfected with control and miR-control (Figure 5A and B). These data suggest that hsa_circ_0004018 could inhibit Wnt/β-catenin signaling pathway by interacted with miR-626.
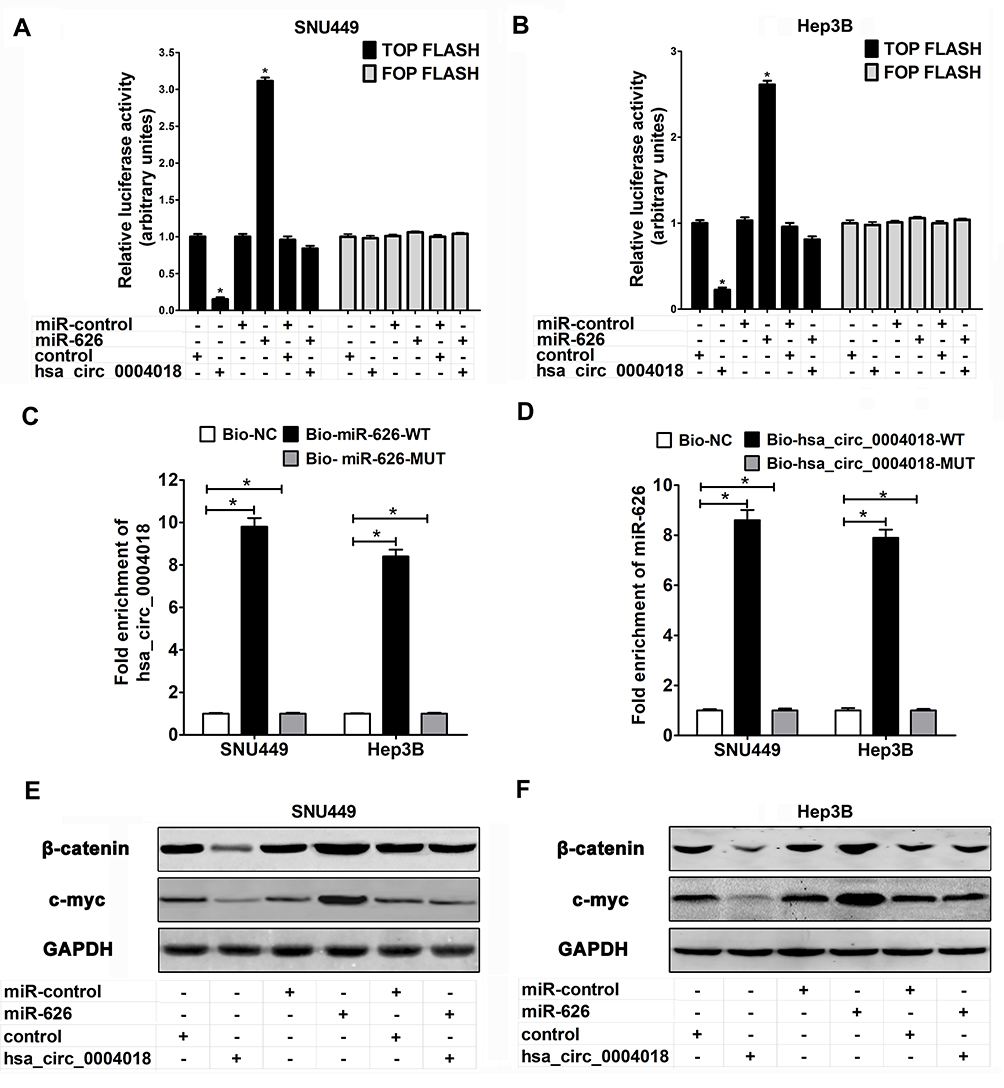 |
Figure 5 Hsa_circ_0004018 interacting with miR-626 contributed to HCC cell proliferation and migration through inhibition of the Wnt/β-catenin pathway. SNU449 and Hep3B cells were introduced with hsa_circ_0004018, control or hsa_circ_0004018 + miR-626. (A and B) TOP/FOP FLASH luciferase assay was performed to evaluate the relative Luciferase activity in the transfected SNU449 and Hep3B cells. (C and D) Detection of the interaction between hsa_circ_0004018 and miR-626 using an RNA pull down assay. (E and F) Western blot was utilized to analyze the protein levels of β-catenin and c-myc after transfected 48 h in SNU449 and Hep3B cells. *p<0.05. |
In order to strengthen evaluated the relationship between hsa_circ_0004018 and miR-626, we performed RNA pull down assay to evaluate targeted binding between hsa_circ_0004018 and miR-626. A biotinylated hsa_circ_0004018 probe was designed and incubated with lysates from SNU449 and Hep3B cells. RNA pull down assay verified hsa_circ_0004018 was combined with bio-miR-626-WT probe but not bio-miR-626-MUT probe (Figure 5C); MiR-626 was specifically combined with bio-hsa_circ_0004018-WT probe correspondingly but not bio-hsa_circ_0004018-MUT probe (Figure 5D). Therefore, we further analyzed the effects and combined effects of hsa_circ_0004018 and miR-626 on Wnt/β-catenin signaling pathway in HCC cells. Western blot manifested that ectopic expression of hsa_circ_0004018 markedly reduced the protein levels of β-catenin and c-myc, while overexpressing miR-626 remarkably increased the protein levels of β-catenin and c-myc in SNU449 and Hep3B cells. These data suggested that overexpression of hsa_circ_0004018 inhibited the activation of the Wnt/β-catenin signaling pathway in HCC cells while overexpress miR-626 increased the activation by targeting DKK3. However, there was no difference in the protein levels of DKK3, β-catenin and c-myc between cells cotransfected with hsa_circ_0004018 and miR-626 and cells cotransfected with control and miR-control (Figure 5E and F). These data manifested that hsa_circ_0004018 interacted with miR-626/DKK3to inhibit of the Wnt/β-catenin signaling pathway.
Hsa_circ_0004018 Inhibited HCC Tumor Growth in vivo Through Interacting with miR-626 to Inhibit the Wnt/β-Catenin Signaling Pathway
We further confirmed the role of hsa_circ_0004018 and its underlying mechanism in vivo using nude mice xenograft model. Compared with the control group, HCC xenografts injected with hsa_circ_0004018 group had remarkably decreased tumor growth (Figure 6A) and weight (Figure 6B and C). Moreover, the expression of miR-626 was also significantly reduced than that in control group (Figure 6D). Furthermore, Western blot showed that DKK3 increased, while β-catenin and c-myc decreased in hsa_circ_0004018-injected HCC xenografts compared with control group. These data indicated that hsa_circ_0004018 suppressed the Wnt/β-catenin signaling pathway by targeting miR-626/DKK3 (Figure 6E). To summarize, these data suggested that hsa_circ_0004018 blocked HCC tumor growth in vivo through inhibition of Wnt/β-catenin signaling pathway via interacting with miR-626/DKK3 (Figure 6F).
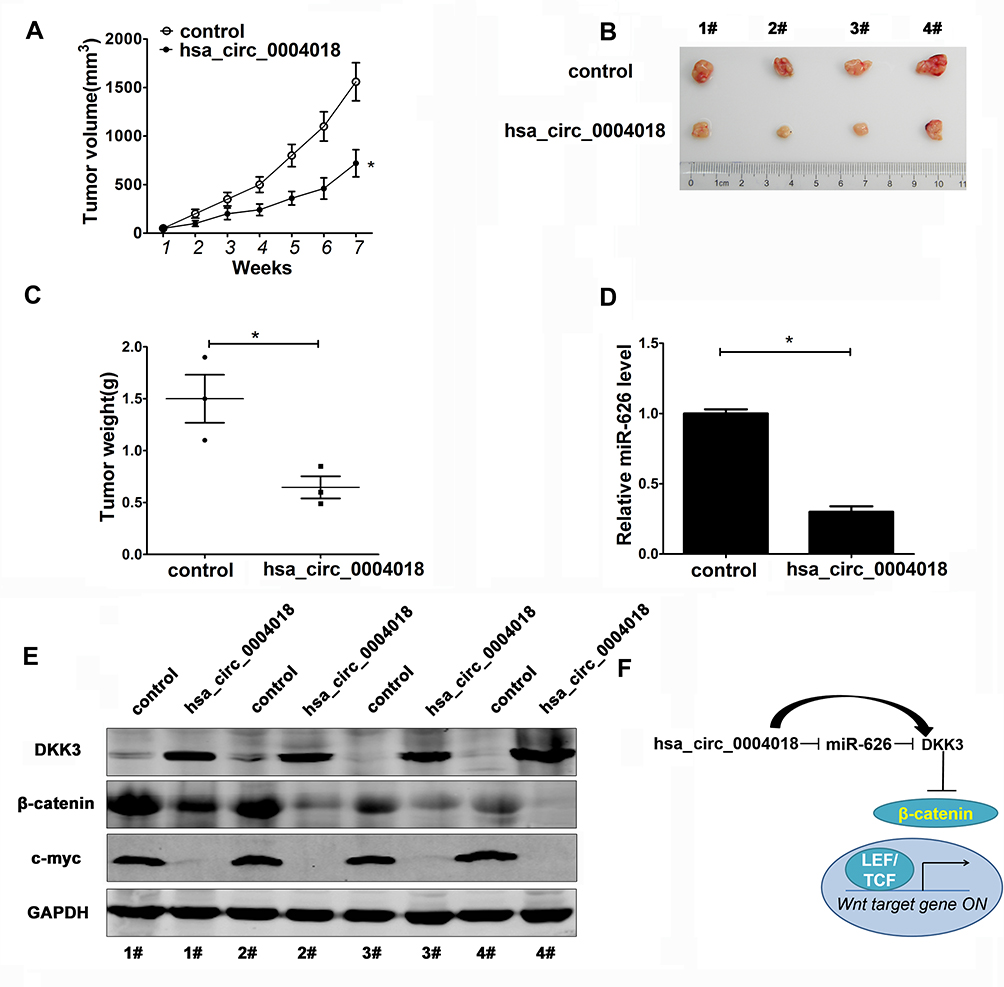 |
Figure 6 Hsa_circ_0004018 overexpression inhibited HCC tumor growth in vivo through downregulating miR-626 via inhibition of the Wnt/β-catenin pathway. Xenograft nude mice model was established by subcutaneously injecting Hep3B cells stably transfected with hsa_circ_0004018 or control into the nude mice. (A) Tumor volume were measured once a week for 7 weeks using a caliper and plotted as mean ± s.d. The curve of tumor growth were shown (n=4/group). The resected tumor (B) and tumor weight (C) was measured at 7th week after injection. (D) The expression of miR-626 in the excised tumor xenografts was detected by RT-qPCR. (E) The protein levels of DKK3, β-catenin and c-myc in the excised tumor xenografts were detected by Western blot. N=4 mice/group, *p<0.05. (F) The Intracellular signaling cascades of Wnt/β-catenin signaling pathway inhibition triggered by hsa_circ_0004018. “→”means positive regulation, “–|” means negative regulation. |
Discussion
Wnt/β-catenin signaling pathway plays a crucial role during embryonic development by controlling the polarity, proliferation, differentiation and migration of cells.25 Previous reports have shown that aberrations in Wnt signaling are common events during human carcinogenesis.26 Therefore, Wnt/β-catenin signaling is a principal target for cancer therapy.
Currently, as a novel member of noncoding RNAs, the functions of circRNAs in tumor progression have attracted great attention.6 Numerous evidences showed that circRNAs could regulate the expression of a certain gene through a circRNAs/microRNA/mRNA axis in multi-type of cancers. Working as miRNA sponges, they can bind certain miRNAs, modulate the suppressive effect of miRNA on its target mRNAs and consequently regulate the expression of a functional protein.27 It was reported that Circ-TCF25 promoted proliferation and migration by downregulating miR-103a-3p and miR-107 and consequently increasing Cyclin-Dependent Kinase 6 (CDK6) expression in bladder cancer.28 Additionally, CircMTO1 was demonstrated to act as a sponge of miR-9 and upregulated p21WAF1/CIP1 expression in HCC.29 Similarly, CircCdr1 was reported to work as an oncogene in HCC by combining with miR-7 and suppressed CCNE1 expression. It was reported that the expression of hsa_circ_0004018 in HCC was distinctively downregulated compared with paired non-tumor tissue and miR-30e-5p or miR-626 was predicted to be the target miRNAs.20 However, more work is needed to be done to verify these discovery and to elucidate the mechanism.
In this study, we performed luciferase reporter assay and proved that hsa_circ_0004018 contained a miR-626-binding site. What is more, we found that the negative regulated miR-626 expression in HCC cells. Therefore, we have reasons to believe that hsa_circ_0004018 may act as a sponge for miR-626. Functional experiments demonstrated that overexpress hsa_circ_0004018 suppressed the proliferation and migration in HCC cells. Moreover, we found that cotransfected hsa_circ_0004018 and miR-626 could rescue the hsa_circ_0004018-mediated suppression of cell migration and migration. To summarize, we concluded that hsa_circ_0004018 significantly prevented HCC cell proliferation and migration by interacting with miR-626.
DKK3, located on chromosome 11p15.1, is a member of gene family encoding secreted proteins that control cell fate during embryonic development.19 Previous reports found that DKK3 is a crucial gene in Wnt/β-catenin signaling pathway, which encodes a Wnt complex receptor antagonist.6 Therefore, DKK3 could inactivate the Wnt pathway and inhibit cell proliferation and differentiation.
By bioinformatics analysis, DKK3 was predicted as the potential target gene of miR-626. So we performed luciferase reporter assay and demonstrated that miR-626 could regulate the expression of DKK3. Furthermore, we validated that overexpressing hsa_circ_0004018 could inhibit the Wnt/β-catenin signaling pathway by interaction with miR-626/DKK3 in HCC cells in vitro. Moreover, in vivo experiments proved that overexpression of hsa_circ_0004018 downregulated miR-626 and inactivated the Wnt/β-catenin signaling pathway in HCC. Therefore, these data suggested that though hsa_circ_0004018/miR-626/DKK3 axis, hsa_circ_0004018 worked as a molecular sponge of miR-626, which resulted in upregulation of DKK3 and inactivation of the Wnt/β-catenin signaling pathway in HCC both in vitro and in vivo.
Conclusions
In summary, our findings revealed that hsa_circ_0004018 was remarkably downregulated and correlated with bigger tumor size in HCC. Hsa_circ_0004018 suppressed proliferation and migration of HCC cells in vitro by the working as a sponge for miR-626. What is more, ectopic expression of hsa_circ_0004018 blocked the growth of HCC xenograft tumors in nude mice through downregulating miR-626 and upregulating DKK3 in vivo. To summarize, we first uncovered the function of the hsa_circ_0004018/miR-626/DKK3 axis in HCC, which provided a considerable and potential therapeutic target for HCC.
Disclosure
The authors report no conflicts of interest for this work.
References
1. Bray F, Ferlay J, Soerjomataram I, Siegel RL, Torre LA, Jemal A. Global cancer statistics 2018: GLOBOCAN estimates of incidence and mortality worldwide for 36 cancers in 185 countries. CA Cancer J Clin. 2018;68(6):394–424.
2. Bruix J, Reig M, Sherman M. Evidence-based diagnosis, staging, and treatment of patients with hepatocellular carcinoma. Gastroenterology. 2016;150(4):835–853.
3. Grandhi MS, Kim AK, Ronnekleiv-Kelly SM, Kamel IR, Ghasebeh MA, Pawlik TM. Hepatocellular carcinoma: from diagnosis to treatment. Surg Oncol. 2016;25(2):74–85.
4. Zheng Q, Bao C, Guo W, et al. Circular RNA profiling reveals an abundant circHIPK3 that regulates cell growth by sponging multiple miRNAs. Nat Commun. 2016;7:11215.
5. Llovet JM, Hernandez-Gea V. Hepatocellular carcinoma: reasons for Phase III failure and novel perspectives on trial design. Clin Cancer Res. 2014;20(8):2072–2079.
6. Meng S, Zhou H, Feng Z, et al. CircRNA: functions and properties of a novel potential biomarker for cancer. Mol Cancer. 2017;16(1):94.
7. Anastasiadou E, Jacob LS, Slack FJ. Non-coding RNA networks in cancer. Nat Rev Cancer. 2018;18(1):5.
8. Jens M, Rajewsky N. Competition between target sites of regulators shapes post-transcriptional gene regulation. Nat Rev Genet. 2015;16(2):113.
9. Chen -L-L. The biogenesis and emerging roles of circular RNAs. Nat Rev Mol Cell Biol. 2016;17(4):205.
10. Chen J, Li Y, Zheng Q, et al. Circular RNA profile identifies circPVT1 as a proliferative factor and prognostic marker in gastric cancer. Cancer Lett. 2017;388:208–219.
11. Moon RT, Bowerman B, Boutros M, Perrimon N. The promise and perils of Wnt signaling through β-catenin. Science. 2002;296(5573):1644–1646.
12. Clevers H. Wnt/β-catenin signaling in development and disease. Cell. 2006;127(3):469–480.
13. Luu HH, Zhang R, Haydon RC, et al. Wnt/β-catenin signaling pathway as novel cancer drug targets. Curr Cancer Drug Targets. 2004;4(8):653–671.
14. Thompson MD, Monga SP. WNT/β‐catenin signaling in liver health and disease. Hepatology. 2007;45(5):1298–1305.
15. Cai Y, Mohseny AB, Karperien M, Hogendoorn PC, Zhou G, Cleton‐Jansen AM. Inactive Wnt/β‐catenin pathway in conventional high‐grade osteosarcoma. J Pathol. 2010;220(1):24–33.
16. Xue G, Romano E, Massi D, Mandalà M. Wnt/β-catenin signaling in melanoma: preclinical rationale and novel therapeutic insights. Cancer Treat Rev. 2016;49:1–12.
17. Li D, Beisswenger C, Herr C, et al. Myeloid cell RelA/p65 promotes lung cancer proliferation through Wnt/β-catenin signaling in murine and human tumor cells. Oncogene. 2014;33(10):1239.
18. Yue W, Sun Q, Dacic S, et al. Downregulation of Dkk3 activates β-catenin/TCF-4 signaling in lung cancer. Carcinogenesis. 2007;29(1):84–92.
19. Lee EJ, Jo M, Rho SB, et al. Dkk3, downregulated in cervical cancer, functions as a negative regulator of β‐catenin. Int j Cancer. 2009;124(2):287–297.
20. Fu L, Yao T, Chen Q, Mo X, Hu Y, Guo J. Screening differential circular RNA expression profiles reveals hsa_circ_0004018 is associated with hepatocellular carcinoma. Oncotarget. 2017;8(35):58405.
21. Lv J, Zhu P, Yang Z, et al. PCDH 20 functions as a tumour‐suppressor gene through antagonizing the W nt/β‐catenin signalling pathway in hepatocellular carcinoma. J Viral Hepat. 2015;22(2):201–211.
22. Lv J, Kong Y, Gao Z, Liu Y, Zhu P, Yu Z. LncRNA TUG1 interacting with miR-144 contributes to proliferation, migration and tumorigenesis through activating the JAK2/STAT3 pathway in hepatocellular carcinoma. Int J Biochem Cell Biol. 2018;101:19–28.
23. Fukumoto S, Hsieh C-M, Maemura K, et al. Akt participation in the Wnt signaling pathway through Dishevelled. J Biol Chem. 2001;276(20):17479–17483.
24. Osipo C, Miele L. Hedgehog signaling in hepatocellular carcinoma: novel therapeutic strategy targeting hedgehog signaling in HCC. Cancer Biol Ther. 2006;5(2):238–239.
25. Clevers H. Wnt/beta-catenin signaling in development and disease. Cell. 2006;127(3):469–480.
26. Hans C. Wnt/β-catenin signaling and disease. Cell. 2012;6:149.
27. Qu S, Yang X, Li X, et al. Circular RNA: a new star of noncoding RNAs. Cancer Lett. 2015;365(2):141–148.
28. Zhong Z, Lv M, Chen J. Screening differential circular RNA expression profiles reveals the regulatory role of circTCF25-miR-103a-3p/miR-107-CDK6 pathway in bladder carcinoma. Sci Rep. 2016;6:30919.
29. Han D, Li J, Wang H, et al. Circular RNA circMTO1 acts as the sponge of microRNA‐9 to suppress hepatocellular carcinoma progression. Hepatology. 2017;66(4):1151–1164.
 © 2020 The Author(s). This work is published and licensed by Dove Medical Press Limited. The full terms of this license are available at https://www.dovepress.com/terms.php and incorporate the Creative Commons Attribution - Non Commercial (unported, v3.0) License.
By accessing the work you hereby accept the Terms. Non-commercial uses of the work are permitted without any further permission from Dove Medical Press Limited, provided the work is properly attributed. For permission for commercial use of this work, please see paragraphs 4.2 and 5 of our Terms.
© 2020 The Author(s). This work is published and licensed by Dove Medical Press Limited. The full terms of this license are available at https://www.dovepress.com/terms.php and incorporate the Creative Commons Attribution - Non Commercial (unported, v3.0) License.
By accessing the work you hereby accept the Terms. Non-commercial uses of the work are permitted without any further permission from Dove Medical Press Limited, provided the work is properly attributed. For permission for commercial use of this work, please see paragraphs 4.2 and 5 of our Terms.