")
Back to Journals » Cancer Management and Research » Volume 12
Circ_101341 Deteriorates the Progression of Clear Cell Renal Cell Carcinoma Through the miR- 411/EGLN3 Axis
Authors Yue Y, Cui J, Zhao Y, Liu S, Niu W
Received 15 July 2020
Accepted for publication 25 November 2020
Published 31 December 2020 Volume 2020:12 Pages 13513—13525
DOI https://doi.org/10.2147/CMAR.S272287
Checked for plagiarism Yes
Review by Single anonymous peer review
Peer reviewer comments 3
Editor who approved publication: Dr Sanjeev K. Srivastava
Yongjun Yue,1 Jinsheng Cui,1 Yu Zhao,2 Shangying Liu,3 Weixing Niu1
1Department of Urology, Heji Hospital, Changzhi Medical College, Changzhi, Shanxi 046000, People’s Republic of China; 2Department of Ophthalmology, Peace Hospital, Changzhi Medical College, Changzhi, Shanxi 046000, People’s Republic of China; 3Department of Urology, First Affiliated Hospital of Shanxi Medical University, Taiyuan, Shanxi 030001, People’s Republic of China
Correspondence: Jinsheng Cui
Department of Urology, Heji Hospital, Changzhi Medical College, No. 271 Taihang East Street, Changzhi, Shanxi 046000, People’s Republic of China
Tel +86-355-2193479
Email [email protected]
Background: Clear cell renal cell carcinoma (ccRCC) is one of the main subtypes of renal cell carcinoma, with intense aggressiveness. The involvement of circular RNAs (circRNAs) in human cancers attracts much concern. The intention of this study was to investigate the expression of circ_101341 and explore its function in ccRCC.
Materials and Methods: The expression of circ_101341, miR-411 and Egl nine homolog 3 (EGLN3) was measured using quantitative real-time polymerase chain reaction (qRT-PCR). Cell proliferation was assessed by cell counting kit-8 (CCK-8) assay and colony formation assay. Cell migration and invasion were monitored by transwell assay. Xenograft model was established to explore the role of circ_101341 in vivo. The protein levels of E-cadherin (E-cad), N-cadherin (N-cad), matrix metalloprotein-9 (MMP9) and EGLN3 were detected by Western blot. Bioinformatic analysis was conducted using Circinteractome and starBase. The targeted relationship was verified using dual-luciferase reporter assay, RNA-binding protein immunoprecipitation (RIP) assay and RNA pull-down assay.
Results: The expression of circ_101341 was elevated in ccRCC tissues and cells. Functionally, circ_101341 knockdown depleted proliferation, migration and invasion of ccRCC cells in vitro and restricted tumor growth in vivo. Circ_101341 directly targeted miR-411, and miR-411 inhibition revised the inhibitory effects of circ_101341 knockdown on proliferation, migration and invasion in ccRCC cells. Moreover, miR-411 directly bound to EGLN3, and EGLN3 overexpression also rescued the effects of circ_101341 knockdown.
Conclusion: Circ_101341 functioned as a tumor promoter to strengthen proliferation, migration and invasion by regulating EGLN3 via sponging miR-411, indicating that circ_101341 was a potential diagnostic and therapeutic biomarker of ccRCC.
Keywords: circ_101341, miR-411, EGN3, ccRCC
Introduction
Renal cell carcinoma (RCC) represents the most common primary malignant tumor in the kidney, accounting for around 2–3% of all cancers, and is one of the ten common cancers worldwide.1–3 Clear cell renal cell carcinoma (ccRCC) is the most aggressive subtype of this cancer, accounting for 70–80% of RCC.4 A clear morphological hallmark of ccRCC is the strong accumulation of lipids and glycogen in the cytoplasm of tumor cells, hence terming as “clear cells”.5,6 Generally, early RCC is asymptomatic, and patients diagnosed at the early stage have better survival rates after surgical resection or nephrectomy.2,5 However, advanced tumors are associated with local or systemic spread, leading to high mortality.5,7 Therefore, identifying potential biomarkers is of great value for the diagnosis and treatment of ccRCC.
Recently, the diverse role of circular RNAs (circRNAs) arouses much attention, particularly in cancers.8 CircRNA is a novel type of non-coding RNA without 5ʹ caps and 3ʹ tails different from linear RNAs, and its unique structure gives it high stability.9 Growing studies insist that circRNA dysregulation substantially affects the biological progression of human cancers.10 In ccRCC, numerous differently expressed circRNAs in ccRCC tissues compared with normal samples were identified by RNA microarray assay.11 Besides, the functions of several circRNAs during the development of ccRCC have been investigated, such as circ-AKT3, circPCNXL2 and circHIAT1.12–14 However, the research of circRNA in ccRCC is still limited, and several functionally unknown circRNAs need to be explored, such as circ_101341 (circ_0031594). The expression of circ_101341 was documented to be aberrantly upregulated in the RCC dataset (GSE100186). Unfortunately, its role is not explored until now.
MicroRNAs (miRNAs) are a kind of extensively regulated RNA molecules with ~22 nucleotides.15 With further study of miRNAs, the regulatory role of miRNAs in a variety of biological processes has been demonstrated, including the initiation and progression of cancer. A canonical regulatory mode of circRNA is to function as miRNAs “sponge” to mediate the activity of miRNAs.16,17 Herein, bioinformatic analysis displayed that miR-411 was a potential target of circ_101341. MiR-411 has been mentioned to be involved in several cancers.18–20 However, its function in ccRCC is limitedly investigated, and the interaction between circ_101341 and miR-411 is not addressed. Generally, miRNAs exert their biological functions by interacting with the target sites at the 3ʹ untranslated regions (3ʹ UTR) of message RNAs (mRNAs), leading to the expression repression and function restriction of mRNAs.21 Egl nine homolog 3 (EGLN3), also known as PHD3, is a widely expressed enzyme that hydroxylates proline residues on target proteins, including HIF-1 alpha,22 and it was predicted to be a target of miR-411 by bioinformatic analysis. The involvement of EGLN3 in the development of cancers introduced that EGLN3 was a vital regulator of cancer pathogenesis.23,24 However, the association between EGLN3 and miR-411 needs further confirmed.
In the present study, we mainly determined the expression of circ_101341 in ccRCC tissues and cells and investigated its functions in ccRCC development. Besides, the relationship between miR-411 and circ_101341 or EGLN3 was established to reveal a potential regulatory mechanism of circ_101341 in ccRCC. This study aimed to provide several useful biomarkers to improve the diagnosis and treatment of ccRCC.
Materials and Methods
Tissues
A total of 60 pairs of ccRCC tissues and matched normal tissues were obtained from ccRCC patients recruited from Heji Hospital, Changzhi Medical College. Before surgery, all patients had signed informed consent about this study. All excised tissues were embrittled using liquid nitrogen and then stored at −80°C freezer. All procedures in studies involving patient participants were conducted in accordance with the Declaration of Helsinki. This research was performed in line with the Ethics Committee of Heji Hospital, Changzhi Medical College.
Data Collection
The expression profiles of circRNAs were screened from Gene Expression Omnibus (GEO) repository (https://www.ncbi.nlm.nih.gov/gds/). The dataset involving ccRCC was obtained from the GSE100186 dataset, containing 4 pairs of ccRCC tissues and paired normal tissues. The expression files were downloaded and processed using the R language package after filtering the unqualified data. Afterwards, the heat map was generated.
Cell Lines
Human RCC cell lines and ccRCC cell lines, including A498, Caki-1 and 786-O, were purchased from Bena Culture Collection (Suzhou, China). SW839 cells were purchased from HonSun Biological (Shanghai, China). The proximal convoluted tubule cells of human kidney (HK-2) were also purchased from Bena. HK-2 cells were cultured in 90% Dulbecco’s Modified Eagle Medium (DMEM; Gibco, Grand Island, NY, USA) containing 10% fetal bovine serum (FBS; Gibco). Caki-1 cells were maintained in 90% McCoy’s 5a medium (Sigma-Aldrich, St. Louis, MO, USA) containing 10% FBS (Gibco). A498, 786-O and SW839 cells were kept in 90% Roswell Park Memorial Institute 1640 (RPMI 1640; Gibco) containing 10% FBS (Gibco). All cells were cultured at 37°C with 5% CO2 in a wet condition.
Quantitative Real-Time Polymerase Chain Reaction (qRT-PCR)
Tissues or cells were subjected to a TRIquick total RNA extract kit (Solarbio, Beijing, China). For circRNA and mRNA, qRT-PCR was performed using the riboSCRIPT mRNA/lncRNA qRT-PCR Starter Kit (Ribobio, Guangzhou, China). For miRNA, qRT-PCR was performed using the Bulge-Loop miRNA qRT-PCR Starter Kit (Ribobio). All experiments were conducted three times. The relative expression was calculated using the 2−ΔΔCt method and normalized by Glyceraldehyde-3-phosphate dehydrogenase (GAPDH) or U6. The primers were listed as follows: circ_101341, forward: 5ʹ-CTTACGCAACCAGGCAATGG-3ʹ and reverse: 5ʹ-CATCACCGTTGGGGTTGTCC-3ʹ; EGLN3, forward: forward: 5ʹ-TCAAGGAGAGGTCTAAGGCAA-3ʹ and reverse: 5ʹ-ATGCAGGTGATGCAGCGA-3ʹ; miR-411, forward: forward: 5ʹ-CCATGUAUGUAACACGGUCCAC-3ʹ and reverse: 5ʹ-GGUUAGUGGACCGGTCACC-3ʹ; GAPDH, forward: 5ʹ-CCCCTTCATTGACCTCAACTACAT-3ʹ and reverse: 5ʹ-CGCTCCTGGAAGATGGTGA-3ʹ; U6, forward: 5ʹ-CTTCGGCAGCACATATACT-3ʹ and reverse: 5ʹ-AAAATATGGAACGCTTCACG-3ʹ;
Cell Transfection
Lentiviral particles containing short hairpin RNA targeting circ_101341 (sh-circ_101341) and negative control (sh-NC) were synthesized by Genomeditech (Shanghai, China). MiR-411 mimics (miR-411), miR-411 inhibitors (anti-miR-411) and controls (miR-NC and anti-miR-NC) were purchased from Ribobio. EGLN3 overexpression fusion vector pcDNA3.1-EGLN3 (EGLN3) and empty vector (vector) were assembled by Genomeditech. Lipofectamine 3000 (Invitrogen, Carlsbad, CA, USA) was utilized for transfection following the manufacturer’s instructions.
Cell Counting Kit-8 (CCK-8) Assay
CCK-8 (Solarbio) was used for cell proliferation analysis. In short, SW839 and A498 cells after corresponding transfection were harvested and planted into 96-well plates (10,000 cells/well). Subsequently, 10 μL of CCK8 reagent was pipetted to each well at the specific time points (0, 24, 48 and 72 h) and incubated for 2 h. Then, the absorption value at 450 nm was detected by a microplate reader (Thermo Fisher Scientific, Waltham, MA, USA).
Colony Formation Assay
SW839 and A498 cells after corresponding transfection were seeded into 6-well plates (1000 cells/well). Then, cells were incubated at 37°C containing 5% CO2 for 12 d. Next, the systems were stained with 0.1% crystal violet until the colonies were visible and photographed.
Animal Experiment
The procedures of the animal experiments were approved by the Animal Care and Use Committee of Heji Hospital, Changzhi Medical College and followed by the Guide for the Care and Use of Laboratory Animals (GB/T 35,892–2018). A total of 8 nude mice (BALB/c, Male, 4-weeks-old) were purchased from Vital River Company (Beijing, China). A498 cells infected with sh-circ_101341 were subcutaneously implanted in the flanks of mice (n=4), and sh-NC acted as the control (n=4). The tumor volume (V) was calculated according to the formula: V = long axis ×short axis2/2. After 35 days, all tumor was excised, and tumor weight was examined.
Transwell Assay
24-well transwell chambers (8 μm pore size; BD Biosciences, San Jose, CA, USA) were used for migration and invasion assay. Generally, SW839 and A498 cells after corresponding transfection were resuspended in serum-free medium and then added into the top of chambers coated with or without Matrigel (BD Biosciences) for invasion assay or migration assay. Fresh RPMI 1640 medium containing 10% FBS was filled with the bottom of chambers. The reaction was lasting for 24 h, and next, the migrated or invaded cells into the low surface were fixed and stained with 0.1% crystal violet for morphological observation under a microscope (Olympus, Tokyo, Japan).
Western Blot
The expression of E-cadherin (E-cad), N-cadherin (N-cad), matrix metalloprotein-9 (MMP9) and EGLN3 was measured by Western blot. The procedures of Western blot were consistent with the previous description.25 The antibodies used were listed as follows: anti-E-cad (ab40772; Abcam, Cambridge, MA. USA), anti-N-cad (ab76011, Abcam), anti-MMP9 (ab137867, Abcam), anti-EGLN3 (anti-PHD3; ab30782, Abcam), anti-GAPDH (ab181602, Abcam) and Goat-anti-Rabbit horseradish peroxidase (HRP; ab205718, Abcam).
Subcellular Distribution
Nuclear RNAs and cytoplasmic RNAs were isolated using the PARIS kit (Life Technologies, Danvers, MA, USA). Then, qRT-PCR was performed to detect the expression of circ_101341 in the nucleus or cytoplasm. GAPDH or U6 acted as cytoplasm or nucleus internal reference, respectively.
Bioinformatic Analysis
The online databases or tools, including Circinteractome (https://circinteractome.nia.nih.gov/) and starBase (http://starbase.sysu.edu.cn/), were utilized to predict the potential targets of circRNA or miRNA.
Dual-Luciferase Reporter Assay
The pGL4-based luciferase reporter plasmids containing wild-type circ_101341 (circ_101341-WT) or mutant-type circ_101341 (circ_101341-MUT, mutated at the putative miR-411 binding site) were designed and assembled by Ribobio. Similarly, EGLN3-WT and EGLN3-MUT were also constructed. A498 and SW839 cells were cotransfected with miR-411 and circ_101341-WT, circ_101341-MUT, EGLN3-WT or EGLN3-MUT, and miR-NC transfection acted as the control. After 48 h of transfection, the cells were collected for firefly and renilla luciferase activity detection using the Dual-Luciferase Reporter Assay System (Promega, Madison, WI, USA).
RNA-Binding Protein Immunoprecipitation (RIP) Assay
A498 and SW839 cells were subjected to RIP lysis buffer (Thermo Fisher Scientific), and the lysate was collected and incubated with the RIP buffer containing magnetic beads coated with Ago2 antibody (Thermo Fisher Scientific) or IgG antibody (negative control; Thermo Fisher Scientific) at 4°C for 4 h. Subsequently, the immunoprecipitated RNAs were isolated and used for qRT-PCR.
RNA Pull-Down Assay
We used biotin-labeled miRNA to detect the expression level of circRNA. In brief, biotinylated miR-411 (Bio-miR-411) and negative control (Bio-NC) were constructed by Ribobio. Afterwards, A498 and SW839 cells were transfected with Bio-miR-411 or Bio-NC and used for pull-down assay using the Pierce™ Magnetic RNA-Protein Pull-Down Kit (Thermo Fisher Scientific) in line with the manual. The RNAs were extracted and eluted for qRT-PCR analysis.
Statistical Analysis
GraphPad Prism 7.0 (Graphpad Software Inc., La Jolla, CA, USA) was used to process data from 3 parallel experiments. All data were exhibited as mean ± standard deviation (S.D.). The survival curve was generated by Kaplan–Meier plot and analyzed by Log rank test. To determine the significance of difference between the two groups, Student’s t-test was used. Analysis of variance (ANOVA) test was used to assess the differences between more than two groups. P value < 0.05 was considered statistically significant.
Result
Circ_101341 Was Significantly Upregulated in ccRCC Tissues and Cell Lines
Analysis of the ccRCC dataset GSE100186, downloaded from the Gene Expression Omnibus (GEO) repository (https://www.ncbi.nlm.nih.gov/gds/), presented dozens of differentially expressed circRNAs. Heat map analysis screened the leading top 10 upregulated or downregulated circRNAs (Figure 1A). The schematic diagram showed that circ_101341 was derived from precursor EGLN3 mRNA exon2 and exon3 (Figure 1B). In the data from GSE100186 dataset, circ_101341 was significantly upregulated in ccRCC tissues (n=4) compared with normal tissues (n=4) (Figure 1C). Next, the expression of circ_101341 was verified in clinical ccRCC tissues, and the data showed that the expression of circ_101341 was notably enhanced in ccRCC tissues (n=60) relative to normal tissues (n=60) (Figure 1D). Moreover, Kaplan–Meier survival curve revealed that the overall survival of ccRCC patients with high circ_101341 expression was always lower than with low circ_101341 expression (Figure 1E). Not surprisingly, the expression of circ_101341 in ccRCC cell lines, including SW839, A498, Caki-1 and 786-O, was strikingly elevated compared with that in HK-2 cells (Figure 1F). Obviously, the expression of circ_101341 in SW839 and A498 cells was relatively higher than that in Caki-1 and 786-O cells. Hence, we chose SW839 and A498 cells for the following experiments. Moreover, we noticed that RNase R treatment hardly affected the expression of circ_101341 but significantly diminished the RNA expression of its linear mRNA (EGLN3) (Figure 1G), suggesting that circ_101341 harbored a circular structure and stably expressed in A498 and SW839 cells. These data suggested that circ_101341 was highly expressed in ccRCC.
 |
Figure 1 Circ_101341 was highly expressed in ccRCC tissues and cells. (A) The differential expression of several circRNAs in ccRCC tissues identified from the GSE100186 dataset was shown in the heat map. (B) Schematic diagram illustrated that circ_101341 was generated from EGLN3 pre-mRNA. (C) Circ_101341 was highly expressed in ccRCC from the GSE100186 dataset. (D) The expression of circ_101341 in ccRCC tissues (n=60) and normal tissues (n=60) was measured by qRT-PCR. (E) The overall survival curve was generated by Kaplan–Meier plot and analyzed by Log rank test. (F) The expression of circ_101341 in ccRCC cell lines (SW839, A498, Caki-1 and 786-O) was detected by qRT-PCR. (G) The circularity and stability of circ_101341 were detected using RNase R by qRT-PCR. *P < 0.05. |
Circ_101341 Knockdown Inhibited Proliferation of ccRCC Cells in vitro and Suppressed Tumor Growth in vivo
The endogenous level of circ_101341 was sequestered to explore the role of circ_101341 in ccRCC. The data from qRT-PCR displayed that the expression of circ_101341 dwindled most in A498 and SW839 cells transfected with sh-circ#2 relative to #1 and #3 (Figure 2A and B). Hence, A498 and SW839 cells with the transfection of sh-circ#2 were used for functional experiments. The analysis of CCK-8 exhibited that circ_101341 knockdown prominently inhibited the proliferation of A498 and SW839 cells (Figure 2C and D). Likewise, colony formation assay presented that circ_101341 knockdown pronouncedly diminished the number of colonies of A498 and SW839 cells (Figure 2E). Xenograft models were established to determine the role of circ_101341 in vivo. As shown in Figure 2F and G, the stable knockdown of circ_101341 weakened both tumor volume and tumor weight, leading to decreased tumor size. These data manifested that circ_101341 knockdown limited the development of ccRCC in vitro and in vivo.
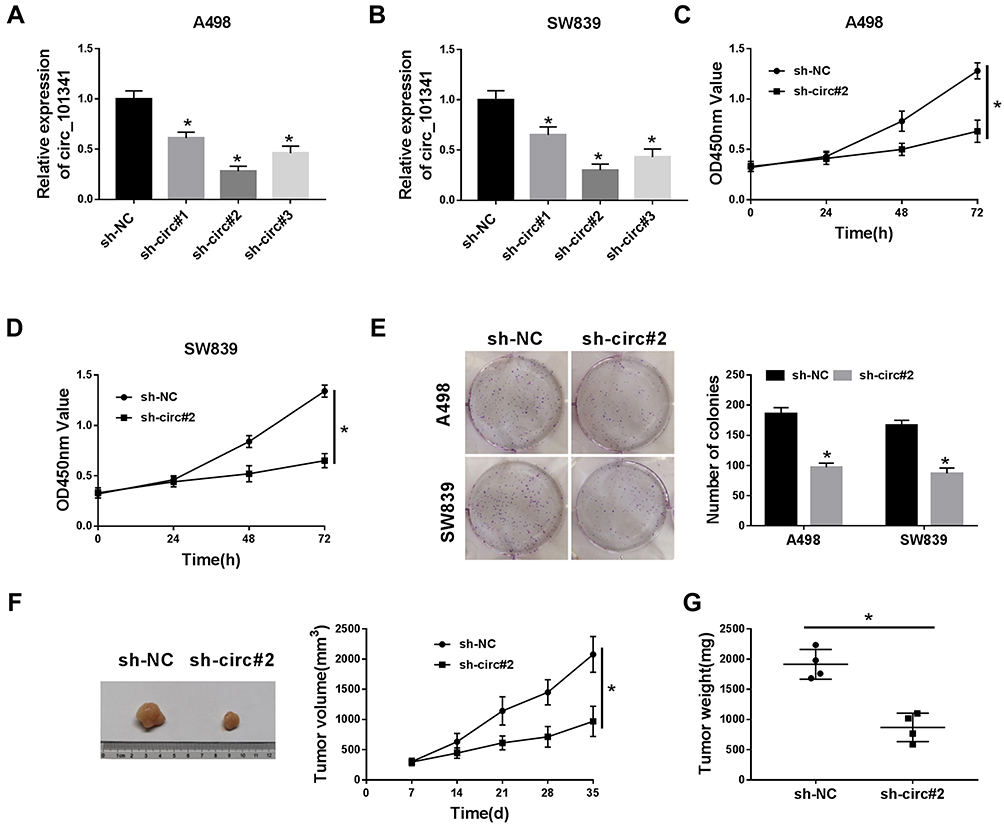 |
Figure 2 Circ_101341 knockdown inhibited proliferation and colony formation in vitro and repressed tumor growth in vivo. A498 and SW839 cells were transfected with sh-circ to observe the role of circ_101341. (A and B) The transfection efficiency was checked using qRT-PCR. (C and D) Cell proliferation was assessed by CCK-8 assay. (E) The ability of cell proliferation was monitored by colony formation assay. (F and G) The animal experiment was conducted to assess the role of circ_101341 knockdown in tumor growth (tumor volume and weight). *P < 0.05. |
Circ_101341 Knockdown Suppressed Migration, Invasion and EMT of A498 and SW839 Cells
To explore the effect of circ_101341 knockdown on cell moveability, transwell assay was performed. Noticeably, the number of migrated and invaded cells was substantially declined in A498 and SW839 cells with the transfection of sh-circ_101341#2 compared with sh-NC (Figure 3A and B). The expression levels of EMT indicators were examined by Western blot, and the result showed that the expression of E-cad was significantly reinforced with the knockdown of circ_101341, while the expression of N-cad and MMP9 was reduced with the knockdown of circ_101341 in A498 and SW839 cells (Figure 3C and D). These observations illustrated that circ_101341 knockdown sequestered cell migration, invasion and EMT.
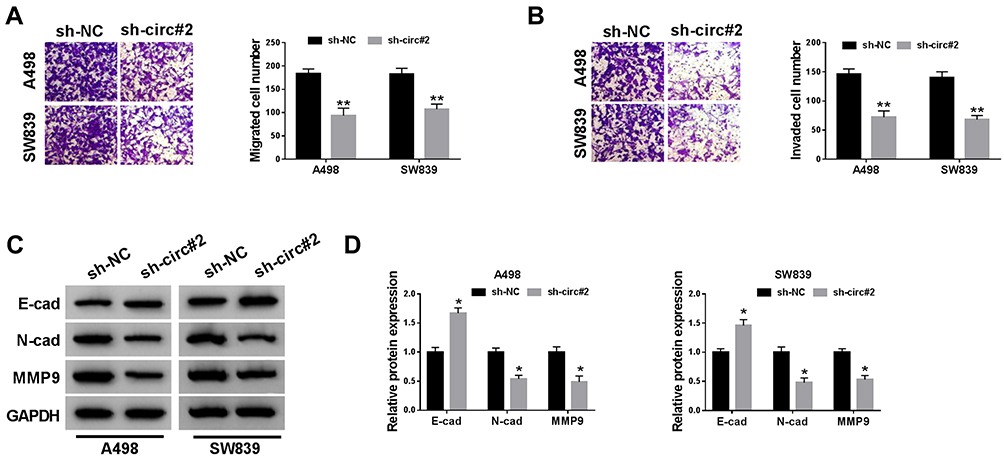 |
Figure 3 Circ_101341 knockdown inhibited cell migration, invasion and EMT. (A and B) Cell migration and invasion were investigated by the transwell assay. (C and D) The expression of E-cad, N-cad and MMP9 was quantified by Western blot. *P < 0.05 and **P < 0.01. |
Circ_101341 Targeted miR-411 to Suppress miR-411 Expression
Subcellular fraction localization presented that circ_101341 was mainly distributed in cytoplasmic fraction but not nuclear fraction in A498 and SW839 cells (Figure 4A). This result supported that circ_101341 served as competing endogenous RNA (ceRNA) to mediate gene expression of its target miRNAs.17 Hence, the putative target miRNAs of circ_101341 were analyzed by the online tool Circinteractome. Pull-down assay showed that miR-411 could be abundantly enriched by circ_101341 probe compared to oligo probe (Figure S1). Circinteractome presented that there was a specific binding site between circ_101341 and miR-411 (Figure 4B). Next, the fusion plasmids circ_101341-WT and circ_101341-MUT were constructed to perform dual-luciferase reporter assay, and the result showed that the reintroduction of miR-411 markedly reduced the luciferase activity in A498 and SW839 cells transfected with circ_101341-WT but not circ_101341-MUT (Figure 4C). Besides, RIP assay showed that both circ_101341 and miR-411 were remarkably enriched in the anti-Ago2 group compared with that in the anti-IgG group (Figure 4D). In addition, RNA pull-down assay was conducted using Bio-miR-411 in A498 and SW839 cell lysates, and the result demonstrated that circ_101341 was significantly enriched in Bio-miR-411 relative to Bio-NC (Figure 4E). Moreover, the expression of miR-411 was markedly strengthened by circ_101341 knockdown in A498 and SW839 cells (Figure 4F). All data maintained that circ_101341 directly targeted miR-411.
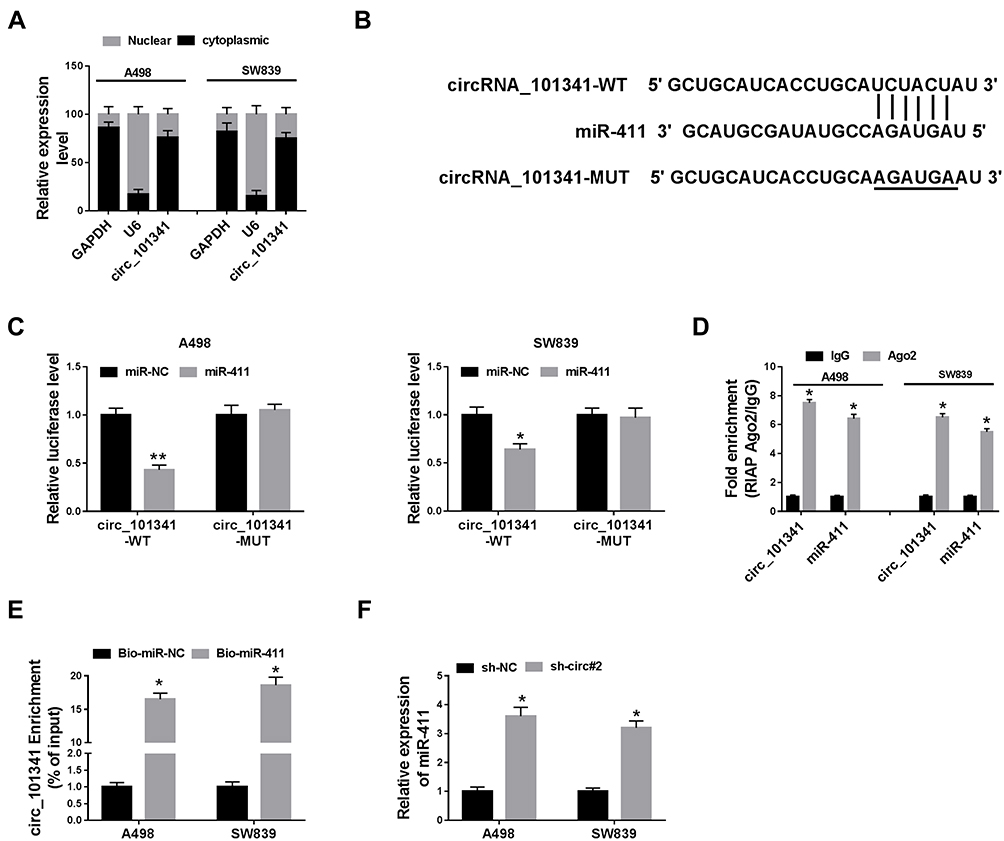 |
Figure 4 Circ_101341 directly targeted miR-411. (A) Subcellular localization was performed to examine the distribution of circ_101341, GAPDH or U6 acting as the cytoplasmic control or nuclear control. (B) The interaction between circ_101341 and miR-411 was predicted by the online tool Circinteractome. (C–E) The interaction between circ_101341 and miR-411 was further verified by dual-luciferase reporter assay, RIP assay and RNA pull-down assay. (F) The effect of circ_101341 knockdown on the expression of miR-411 was detected by qRT-PCR. *P < 0.05 and **P < 0.01. |
MiR-411 Deficiency Overturned the Effects of Circ_101341 Knockdown on Proliferation, Colony Formation, Migration, Invasion and EMT
Subsequently, the effects of the interaction between circ_101341 and miR-411 were observed in A498 and SW839 cells. The qRT-PCR data displayed that the expression of miR-411 was significantly declined in A498 and SW839 cells transfected with anti-miR-411 compared with anti-NC, indicating the desired transfection efficiency (Figure 5A). The abilities of cell proliferation and colony formation were recovered in sh-circ#2 transfected A498 and SW839 cells with the transfection of anti-miR-411 compared with anti-NC (Figure 5B and C). The number of migrated and invaded cells was promoted in A498 and SW839 cells with the transfection of sh-circ#2+anti-miR-411 relative to sh-circ#2+anti-NC (Figure 5D and E). Furthermore, the levels of E-cad were depleted in A498 and SW839 cells with the transfection of sh-circ#2+anti-miR-411 relative to sh-circ#2+anti-NC, while the levels of N-cad and MMP9 were opposite to that of E-cad (Figure 5F and G). These results concluded that the anti-tumor role of circ_101341 knockdown was abolished by miR-411 absence.
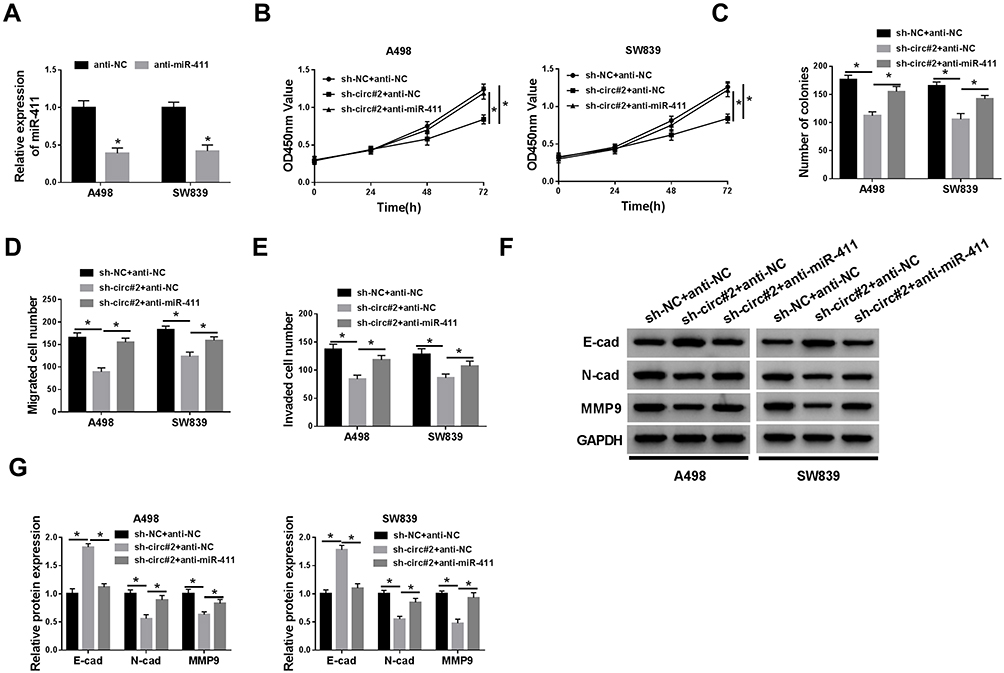 |
Figure 5 The inhibition of miR-411 reversed the effects of circ_101341 knockdown. A498 and SW839 cells with circ_101341 knockdown were transfected with anti-miR-411, anti-NC acting as the control. (A) The efficiency of miR-411 inhibition was checked by qRT-PCR. (B and C) The capacity of cell proliferation was assessed by CCK-8 assay and colony formation assay. (D and E) Cell migration and cell invasion were determined by transwell assay. (F and G) The expression of E-cad, N-cad and MMP9 was detected by Western blot. *P < 0.05. |
EGLN3 Was a Target of miR-411, and Its Expression Was Regulated by Circ_101341 Through miR-411
In view of the acknowledged action mode of miRNA that miRNA interacts with the 3ʹUTR of downstream mRNAs to mediate mRNAs expression, we screened and identified the target mRNAs of miR-411. It was obtained that EGLN3 was one of the targets of miR-411 with a specific binding site between its 3ʹUTR and miR-411 (Figure 6A). The result from dual-luciferase reporter assay confirmed their interaction and presented that miR-411 enrichment in A498 and SW839 cells significantly diminished the luciferase activity with the transfection of EGLN3-WT rather than EGLN3-MUT (Figure 6B and C). Expression analysis introduced that the expression of EGLN3 was prominently depleted in A498 and SW839 cells with miR-411 overexpression at both mRNA and protein levels (Figure 6D and E), while the expression of EGLN3 was markedly enhanced in A498 and SW839 cells with miR-411 inhibition (Figure 6F and G). Moreover, the expression of EGLN3 at both mRNA and protein levels was markedly decreased in A498 and SW839 cells transfected with sh-circ#2 alone but recovered with the reintroduction of anti-miR-411 (Figure 6H and I). These analyses deemed that EGLN3 was a target of miR-411, and circ_101341 regulated the expression of EGLN3 via sponging miR-411.
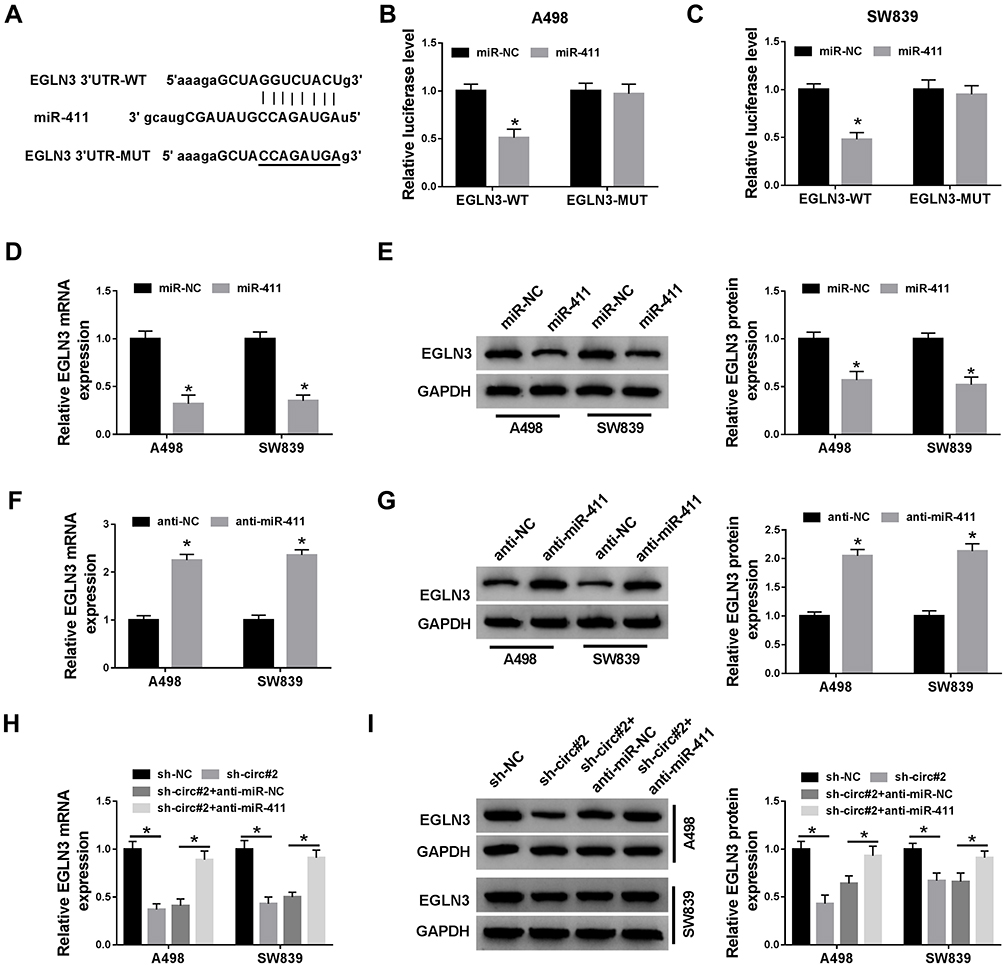 |
Figure 6 EGLN3 was a target of miR-411, and its expression was regulated by circ_101341 through miR-411. (A) The targeted relationship between miR-411 and EGLN3 was predicted by the online tool starBase. (B and C) Their relationship was further confirmed by dual-luciferase reporter assay. (D and E) The expression of EGLN3 in A498 and SW839 cells with miR-411 recruitment was detected by qRT-PCR and Western blot. (F and G) The expression of EGLN3 in A498 and SW839 cells with miR-411 inhibition was detected by qRT-PCR and Western blot. (H and I) The expression of EGLN3 in A498 and SW839 cells with transfection of sh-circ#2 or sh-circ#2+anti-miR-411 was detected by qRT-PCR and Western blot, sh-NC or sh-circ#2+anti-NC acting as the control. *P < 0.05. |
EGLN3 Overexpression Rescued the Inhibitory Effects of Circ_101341 Knockdown on Proliferation, Colony Formation, Migration, Invasion and EMT
The endogenous level of EGLN3 was enhanced to monitor whether EGLN3 overexpression could reverse the effects of circ_101341 knockdown. The examination of transfection efficiency suggested that the expression of EGLN3 was significantly reinforced in A498 and SW839 cells transfected with EGLN3 relative to vector (Figure 7A). The capacities of cell proliferation and colony formation were partly regained in A498 and SW839 cells with the transfection of sh-circ#2+EGLN3 compared with the transfection of sh-circ#2+vector (Figure 7B and C). The activities of cell migration and invasion were higher in A498 and SW839 cells introduced with sh-circ#2+EGLN3 compared with sh-circ#2+vector (Figure 7D and E). The transfection of sh-circ#2+EGLN3 dwindled the protein level of E-cad relative to the transfection of sh-circ#2+vector in A498 and SW839 cells, while the expression tendency of N-cad and MMP9 was opposite to E-cad expression (Figure 7F and G). The above data indicated that circ_101341 knockdown blocked the progression of ccRCC by decreasing the expression of EGLN3.
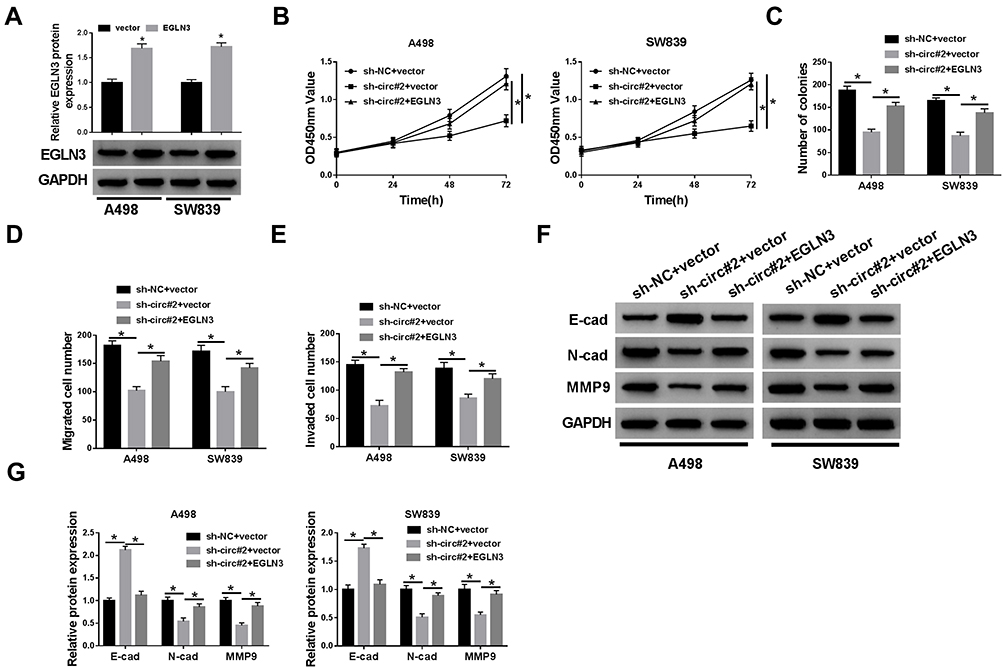 |
Figure 7 Circ_101341 knockdown suppressed ccRCC progression by restraining the expression of EGLN3. (A) The efficiency of EGLN3 overexpression was quantified by Western blot. (B) Cell proliferation was monitored by CCK-8 assay. (C) The number of colonies was investigated by colony formation assay. (D and E) Cell migration and invasion were assessed by transwell assay. (F and G) The expression of E-cad, N-cad and MMP9 was measured by Western blot. *P < 0.05. |
Discussion
The pathogenesis of ccRCC is complex and involves the alteration of a variety of intracellular gene expression. The research for novel diagnostic and prognostic markers is still largely necessary to antagonize the metastatic ccRCC.26 Recently, the function and clinical significance of circRNAs have been widely identified, and circRNAs are regarded as new frontiers for cancer diagnosis and therapy.27,28 In ccRCC, circAKT3 was proved to be a tumor inhibitor to defend cell metastasis.14 CircPCNXL2 was summarized to function as an oncogene to accelerate the proliferation and migration of renal cancer cells.13 Current studies suggested that the dysregulation of circRNAs is closely associated with tumorigenesis and progression. Interestingly, the dataset GSE100186 presented that circ_101341 was a significantly upregulated circRNA in ccRCC tissues compared with normal tissues. Hence, we speculated that circ_101341 might implicate in ccRCC progression. Molecular experiments discovered that the expression of circ_101341 was aberrantly enhanced in ccRCC tissues and cells, and circ_101341 knockdown functionally suppressed cell proliferation, migration and invasion in vitro and limited tumor growth in vivo. These findings manifested that circ_101341 served as a tumor promoter in ccRCC progression.
Relative to linear mRNAs and long non-coding RNAs, it is more toilless for circRNAs to sponge miRNAs because of high stability.25 Following this regulatory manner, the potential action mechanism of several circRNAs was revealed. For example, circ_0039569 contributed to the formation and metastasis of RCC by adsorbing miR-34a-5p.29 Circ_001895 promoted ccRCC progression in vitro and in vivo via targeting miR-296-5p.30 In this study, miR-411 was identified as a target of circ_101341 using the bioinformatic tool, dual-luciferase reporter assay, RIP assay and RNA pull-down assay. Besides, we found that the inhibition of miR-411 overturned the effects of circ_101341 knockdown, aggravating the malignant behaviors in ccRCC cells. The potential role of miR-411 has been partly reported in previous studies. Zhang et al concluded that miR-411 was targeted by circ_000926, and miR-411 depletion abolished the anti-tumor role of circ_000926 downregulation in RCC progression.31 Another report declared that the expression of miR-411 was declined in RCC tissues and cells, and miR-411 enrichment significantly weakened the proliferation and migration of RCC cells.32 All evidence mentioned above indicated that miR-411 was a tumor suppressor at least in RCC. Therefore, it could be concluded that circ_101341 triggered ccRCC progression by inhibiting the expression of miR-411.
Further, the online tool starBase predicted a special binding site between miR-411 and EGLN3 3ʹUTR, and their interaction was verified by dual-luciferase reporter assay, suggesting that EGLN3 was a target of miR-411. EGLN3, also named PHD3, is closely linked to cancer development. The previous study reported that PHD3 was highly expressed in serum from RCC patients and could be a novel biomarker with the valuable diagnostic performance,33 and its high level might reinforce ccRCC aggressiveness.34 Moreover, a tissue-wide expression profiling was generated using cDNA subtraction and microarrays, and EGLN3 was discovered to be highly regulated in RCC samples.35 These observations suggested that RCC was associated with a high level of EGLN3. In our study, functional analyses monitored that EGLN3 overexpression rescued cell proliferation, migration and invasion suppressed by circ_101341 knockdown, hinting that EGLN3 was an oncogene in RCC. On the contrary, EGLN3 was recorded to be deficient in breast cancer, pancreatic cancer and gastric cancer, and EGLN3 overexpression suppressed the tumorigenesis of these cancers,36–38 which exhibited the opposite expression pattern and functional role of EGLN3 in ccRCC, suggesting that the function of EGLN3 is various in different cancers.
Conclusion
Circ_101341 was strikingly upregulated in ccRCC tissues and cells. Circ_101341 knockdown inhibited proliferation, migration and invasion of ccRCC cells, and inhibited tumor growth in vivo. Mechanically, circ_101341 aggravated the progression of ccRCC via the miR-411/EGLN3 pathway, hinting that circ_101341 might be a promising biomarker for diagnosis and therapy of ccRCC.
Funding
There is no funding to report.
Disclosure
The authors declare that they have no financial or non-financial conflicts of interest.
References
1. Ljungberg B, et al. EAU guidelines on renal cell carcinoma: 2014 update. Eur Urol. 2015;67(5):913–924.
2. Tsili AC. Argyropoulou, Advances of multidetector computed tomography in the characterization and staging of renal cell carcinoma. World J Radiol. 2015;7(6):110–127. doi:10.4329/wjr.v7.i6.110
3. Hsieh JJ, et al. Renal cell carcinoma. Nat Rev Dis Primers. 2017;3:17009.
4. Rini BI, Campbell SC, Escudier B. Renal cell carcinoma. Lancet. 2009;373(9669):1119–1132. doi:10.1016/S0140-6736(09)60229-4
5. Sanchez DJ. Simon, Genetic and metabolic hallmarks of clear cell renal cell carcinoma. Biochim Biophys Acta Rev Cancer. 2018;1870(1):23–31. doi:10.1016/j.bbcan.2018.06.003
6. Wettersten HI, et al. Metabolic reprogramming in clear cell renal cell carcinoma. Nat Rev Nephrol. 2017;13(7):410–419. doi:10.1038/nrneph.2017.59
7. Lee CT, et al. Mode of presentation of renal cell carcinoma provides prognostic information. Urol Oncol. 2002;7(4):135–140. doi:10.1016/S1078-1439(01)00185-5
8. Liu J, et al. Circular RNAs: the star molecules in cancer. Mol Aspects Med. 2019;70:141–152. doi:10.1016/j.mam.2019.10.006
9. Yin Y, et al. Emerging roles of circRNA in formation and progression of cancer. J Cancer. 2019;10(21):5015–5021. doi:10.7150/jca.30828
10. Bachmayr-Heyda A, et al. Correlation of circular RNA abundance with proliferation–exemplified with colorectal and ovarian cancer, idiopathic lung fibrosis, and normal human tissues. Sci Rep. 2015;5:8057. doi:10.1038/srep08057
11. Ma C, et al. Construction and analysis of circular RNA molecular regulatory networks in clear cell renal cell carcinoma. Mol Med Rep. 2019. doi:10.3892/mmr.2019.10811
12. Wang K, et al. Androgen receptor (AR) promotes clear cell renal cell carcinoma (ccRCC) migration and invasion via altering the circHIAT1/miR-195-5p/29a-3p/29c-3p/CDC42 signals. Cancer Lett. 2017;394:1–12. doi:10.1016/j.canlet.2016.12.036
13. Zhou B, et al. CircPCNXL2 sponges miR-153 to promote the proliferation and invasion of renal cancer cells through upregulating ZEB2. Cell Cycle. 2018;17(23):2644–2654. doi:10.1080/15384101.2018.1553354
14. Xue D, et al. Circ-AKT3 inhibits clear cell renal cell carcinoma metastasis via altering miR-296-3p/E-cadherin signals. Mol Cancer. 2019;18(1):151.
15. Liu H, et al. Nuclear functions of mammalian MicroRNAs in gene regulation, immunity and cancer. Mol Cancer. 2018;17(1):64. doi:10.1186/s12943-018-0765-5
16. Kristensen LS, et al. Circular RNAs in cancer: opportunities and challenges in the field. Oncogene. 2018;37(5):555–565. doi:10.1038/onc.2017.361
17. Ragan C, et al. Insights into the biogenesis and potential functions of exonic circular RNA. Sci Rep. 2019;9(1):2048. doi:10.1038/s41598-018-37037-0
18. Liu Y, et al. MiR-411 suppresses the development of bladder cancer by regulating ZnT1. Onco Targets Ther. 2018;11:8695–8704. doi:10.2147/OTT.S173750
19. Wei W, Liu C. Prognostic and predictive roles of microRNA411 and its target STK17A in evaluating radiotherapy efficacy and their effects on cell migration and invasion via the p53 signaling pathway in cervical cancer. Mol Med Rep. 2019. doi:10.3892/mmr.2019.10826
20. Zhang C, et al. Oncogenic microRNA-411 promotes lung carcinogenesis by directly targeting suppressor genes SPRY4 and TXNIP. Oncogene. 2019;38(11):1892–1904.
21. Gu S, et al. Biological basis for restriction of microRNA targets to the 3ʹ untranslated region in mammalian mRNAs. Nat Struct Mol Biol. 2009;16(2):144–150. doi:10.1038/nsmb.1552
22. Zhong C, et al. Polymorphisms in the Egl nine homolog 3 (EGLN3) and Peroxisome proliferator activated receptor-alpha (PPARalpha) genes and their correlation with hypoxia adaptation in Tibetan chickens. PLoS One. 2018;13(3):e0194156. doi:10.1371/journal.pone.0194156
23. Wang Y, et al. MicroRNA-1205, encoded on chromosome 8q24, targets EGLN3 to induce cell growth and contributes to risk of castration-resistant prostate cancer. Oncogene. 2019;38(24):4820–4834. doi:10.1038/s41388-019-0760-3
24. Li S, et al. EglN3 hydroxylase stabilizes BIM-EL linking VHL type 2C mutations to pheochromocytoma pathogenesis and chemotherapy resistance. Proc Natl Acad Sci U S A. 2019;116(34):16997–17006.
25. Geng Y, et al. Hsa_circ_0009361 acts as the sponge of miR-582 to suppress colorectal cancer progression by regulating APC2 expression. Clin Sci. 2019;133(10):1197–1213. doi:10.1042/CS20190286
26. Braga EA, et al. Molecular mechanisms in clear cell renal cell carcinoma: role of miRNAs and hypermethylated miRNA genes in crucial oncogenic pathways and processes. Front Genet. 2019;10:320. doi:10.3389/fgene.2019.00320
27. Geng Y, Jiang J, Wu C. Function and clinical significance of circRNAs in solid tumors. J Hematol Oncol. 2018;11(1):98.
28. Zhang M, Xin Y. Circular RNAs: a new frontier for cancer diagnosis and therapy. J Hematol Oncol. 2018;11(1):21. doi:10.1186/s13045-018-0569-5
29. Jin C, et al. Circ_0039569 promotes renal cell carcinoma growth and metastasis by regulating miR-34a-5p/CCL22. Am J Transl Res. 2019;11(8):4935–4945.
30. Chen Z, et al. CircRNA hsa_circ_001895 serves as a sponge of miR-296-5p to promote cell carcinoma progression via regulating SOX12. Cancer Sci. 2019.
31. Zhang D, et al. Down-regulation of circular rna_000926 attenuates renal cell carcinoma progression through miRNA-411-Dependent CDH2 Inhibition. Am J Pathol. 2019;189(12):2469–2486. doi:10.1016/j.ajpath.2019.06.016
32. Zhang X, et al. MiR-411 functions as a tumor suppressor in renal cell cancer. Int J Biol Markers. 2017;32(4):e454–e460. doi:10.5301/ijbm.5000261
33. Kim KH, et al. Prolyl hydroxylase-3 is a novel renal cell carcinoma biomarker. Investig Clin Urol. 2019;60(6):425–431. doi:10.4111/icu.2019.60.6.425
34. Miikkulainen P, et al. Hypoxia-inducible factor (HIF)-prolyl hydroxylase 3 (PHD3) maintains high HIF2A mRNA levels in clear cell renal cell carcinoma. J Biol Chem. 2019;294(10):3760–3771. doi:10.1074/jbc.RA118.004902
35. Amatschek S, et al. Tissue-wide expression profiling using cDNA subtraction and microarrays to identify tumor-specific genes. Cancer Res. 2004;64(3):844–856. doi:10.1158/0008-5472.CAN-03-2361
36. Fox SB, et al. The prolyl hydroxylase enzymes are positively associated with hypoxia-inducible factor-1alpha and vascular endothelial growth factor in human breast cancer and alter in response to primary systemic treatment with epirubicin and tamoxifen. Breast Cancer Res. 2011;13(1):R16.
37. Su Y, et al. PHD3 regulates differentiation, tumour growth and angiogenesis in pancreatic cancer. Br J Cancer. 2010;103(10):1571–1579. doi:10.1038/sj.bjc.6605936
38. Cui L, et al. Prolyl hydroxylase 3 inhibited the tumorigenecity of gastric cancer cells. Mol Carcinog. 2014;53(9):736–743. doi:10.1002/mc.22025
 © 2020 The Author(s). This work is published and licensed by Dove Medical Press Limited. The full terms of this license are available at https://www.dovepress.com/terms.php and incorporate the Creative Commons Attribution - Non Commercial (unported, v3.0) License.
By accessing the work you hereby accept the Terms. Non-commercial uses of the work are permitted without any further permission from Dove Medical Press Limited, provided the work is properly attributed. For permission for commercial use of this work, please see paragraphs 4.2 and 5 of our Terms.
© 2020 The Author(s). This work is published and licensed by Dove Medical Press Limited. The full terms of this license are available at https://www.dovepress.com/terms.php and incorporate the Creative Commons Attribution - Non Commercial (unported, v3.0) License.
By accessing the work you hereby accept the Terms. Non-commercial uses of the work are permitted without any further permission from Dove Medical Press Limited, provided the work is properly attributed. For permission for commercial use of this work, please see paragraphs 4.2 and 5 of our Terms.