")
Back to Journals » Drug Design, Development and Therapy » Volume 15
Cinnamaldehyde Improves Metabolic Functions in Streptozotocin-Induced Diabetic Mice by Regulating Gut Microbiota
Authors Zhao H, Wu H, Duan M, Liu R, Zhu Q, Zhang K, Wang L
Received 23 October 2020
Accepted for publication 4 December 2020
Published 1 June 2021 Volume 2021:15 Pages 2339—2355
DOI https://doi.org/10.2147/DDDT.S288011
Checked for plagiarism Yes
Review by Single anonymous peer review
Peer reviewer comments 2
Editor who approved publication: Professor Anastasios Lymperopoulos
Honglei Zhao,1 Hongyan Wu,2 Meitao Duan,2 Ruixuan Liu,2 Quanhong Zhu,1 Kai Zhang,2 Lili Wang1
1Fuwai Hospital, Chinese Academy of Medical Sciences, Shenzhen, People’s Republic of China; 2Research Center for Biomedical Information Technology, Shenzhen Institutes of Advanced Technologies, Chinese Academy of Sciences, Shenzhen, People’s Republic of China
Correspondence: Kai Zhang
Research Center for Biomedical Information Technology, Shenzhen Institutes of Advanced Technologies, Chinese Academy of Sciences, Shenzhen, People’s Republic of China
Tel +86-13076878540
Email [email protected]
Lili Wang
Fuwai Hospital, Chinese Academy of Medical Sciences, Shenzhen, People’s Republic of China
Email [email protected]
Purpose: The aim of the present study was to examine the protective effects of cinnamaldehyde (CA) on type 1 diabetes mellitus (T1DM) and explore the underlying molecular mechanisms by using multiple omics technology.
Methods: T1DM was induced by streptozotocin in the mice. Immunostaining was performed to evaluate glycogen synthesis in the liver and morphological changes in the heart. Gut microbiota was analyzed using 16S rRNA gene amplification sequencing. The serum metabolomics were determined by liquid chromatography–mass spectrometry. The relevant gene expression levels were determined by quantitative real-time PCR.
Results: CA treatment significantly improved the glucose metabolism and insulin sensitivity in T1DM mice. CA increased glycogen synthesis in the liver and protected myocardial injury in T1DM mice. CA affected the gut microbiota particularly by increasing the relative abundance of Lactobacillus johnsonii and decreasing the relative abundance of Lactobacillus murinus in T1DM mice. The glucose level was positively correlated with 88 functional pathways of gut microbiota and negatively correlated with 2 functional pathways of gut microbiota. Insulin resistance was positively correlated with 11 functional pathways. The analysis of serum metabolomics showed that CA treatment significantly increased the levels of taurochenodeoxycholic acid, tauroursodeoxycholic acid, tauro-α-muricholic acid and tauro-β-muricholic acid, taurodeoxycholic acid, taurocholic acid and taurohyodeoxycholic acid in T1DM mice. Taurohyodeoxycholic acid level was highly correlated with the blood glucose levels. Furthermore, the abundance of Faecalibacterium prausnitzii was positively correlated with AKT2, insulin like growth factor 1 receptor, E2F1 and insulin receptor substrate 1 mRNA expression levels, while taurohyodeoxycholic acid level was negatively correlated with IRS1 mRNA expression level.
Conclusion: Our results indicated that CA may interfere with gut microbiota to affect host metabolomics, especially the bile acids, so as to directly or indirectly modulate the expression levels of glucose metabolism-related genes, thus subsequently reducing the blood glucose level in the T1DM mice.
Keywords: cinnamaldehyde, type 1 diabetes, glucose, insulin, gut microbiota, serum metabolomics
Introduction
Diabetes mellitus (DM) is characterized by the insufficient insulin production in the pancreas or the body can not effectively utilize the insulin.1 DM represents a chronic disease with serious implications, and its prevalence and incidence have been rapidly increased.2 It is estimated that the DM-related death rates will increased by one-fold between 2006 and 2025.3 DM can be classified into type 1 diabetes mellitus (T1DM) and type 2 diabetes mellitus (T2DM).2 T1DM belongs to a type of autoimmune disease and is featured by high blood glucose levels, which was caused by the insulin deficiency or the low sensibility of target organs toward insulin.2 Various factors such as inflammation, oxidative stress, dysfunction of gut microbiota have been found to be associated with the pathophysiology of T1DM;4–6 however, the detailed molecular mechanisms underlying T1DM development and progression remain elusive.
Gut microbiota plays an essential role in modulating host metabolism, systemic and local immunity.7–9 There is growing evidence showing that gut dysbiosis, an imbalanced microbial communities, is associated with celiac disease, obesity, insulin resistance, T2DM, inflammatory bowel disease and immune dysfunction.10–12 Recently, studies find that gut microbiota involves in the pathophysiology of T1DM.13–15 However, the role of gut microbiota in the pathophysiology of T1DM is largely unknown. Un-targeted and targeted metabolomics studies have been employed to examine the early and late stage changes in metabolic profile of patients with T1DM.16 In the animal studies, streptozotocin (STZ) induced a variety of metabolic changes including metabolites in the citric acid cycle, glucose metabolism, choline turnover and amino acids.17 The changes of these metabolites have also been detected in patients with T1DM. In addition, metabolomics have been performed to discriminate T1DM patients with early stage kidney disease from those without.18 Thus, the investigation of metabolomics is of paramount importance to uncover the pathophysiology of T1DM.
Cinnamaldehyde (CA) belongs to a type of aldehyde and is commonly found in the bark of Cinnamomum trees.19 CA has many pharmacological actions including anti-cancer, anti-bacteria, anti-oxidant, immunomodulation, anti-inflammation and anti-diabetes.19 There is growing evidence showing that CA can lower the blood glucose levels and has been found to ameliorate streptozotocin-induced rat diabetes.20–22 However, the protective effects and underlying molecular mechanisms of CA in the T1DM remain elusive. In the present study, we examined the protective effects of CA on the STZ-induced T1DM in the mice, and profiled the gut microbiota and metabolic changes in the mice. In addition, several key genes associated with T1DM were also analysed to uncover the molecular mechanisms underlying CA-mediated protective effects in T1DM.
Materials and Methods
Animals
Animal experiments were performed following the Guide for the Care and Use of Laboratory Animals of Ministry of Science and Technology, China, and were approved by the Ethics Committee of Southern Medical University. The male C57 mice (6 weeks old) were purchased from Southern Medical University. The animals were kept at 23 ± 1°C, ~40% relative humidity and a light/dark cycle of 12 h, and the animals had free access to food and water. The animals were acclimated for at least 7 days before experiments.
STZ-Induced T1DM Model Model and CA Intervention
The T1DM mice model was induced by treating the animals with multiple doses of STZ (Sigma-Aldrich, St. Louis, USA). Briefly, the animals were fasted overnight, and were intraperitoneally injected with STZ at a dose of 150 mg/kg/day (dissolved in 0.1 mol/L citrate buffer, pH 4.5) for 3 consecutive days. The normal control mice were injected with an equal volume of 0.1 mol/L citrate buffer, pH 4.5. To observe the diabetic status of the mice, the non-fasting glucose levels from tail blood sampling were monitored by a glucose meter (#HEA-231, OMRON). T1DM was diagnosed when blood glucose levels were >16.7 mmol on 2 consecutive tests.
For the CA treatment, the normal mice and T1DM mice were received oral administration of CA or the vehicle (0.5% CMC) at 5 weeks after T1DM onset. Group A: Normal mice were orally administered with 0.5% CMC (2 mL/kg/day) for consecutive 7 weeks; Group B: Normal mice were orally administered with CA (20 mg/kg/day) for consecutive 7 weeks; group C: T1DM mice were orally administered with 0.5% CMC (2 mL/kg/day) for consecutive 7 weeks; Group D: T1DM mice were orally administered with CA (20 mg/kg/day) for consecutive 7 weeks.
Oral Glucose Tolerance Tests (OGTTs)
After consecutive 7 weeks CA or vehicle treatment, the animals were subjected to OGTTs. Briefly, after fasting for 12 h, the animals were orally administered with glucose (1.5 g/kg, Sigma–Aldrich). The glucose levels of tail vein blood were measured at 0, 30, 60, 90 and 120 min after glucose load using a glucometer (#HEA-231, OMRON).
Intraperitoneal Insulin Tolerance Tests (IPITTs)
After consecutive 7 weeks CA or vehicle treatment, the animals were subjected to IPITTs. Briefly, fasting for 12 h, the animals were intraperitoneally injected with insulin (0.75 U/kg, Sigma–Aldrich). The blood glucose level was measured at 0, 30, 60, 90 and 120 min after glucose load from tail at indicated times using a glucometer (#HEA-231, OMRON).
Haematoxylin and Eosin (H&E), Masson Staining and Periodic Acid–Schiff (PAS) for Heart Tissues
A portion of heart tissues was fixed in 10% neutral buffered formalin overnight, embedded in paraffin and serially sectioned (4 μm sections). Tissue sections were stained with H&E to assess the morphology of the heart tissues. For the Masson staining, the sections were stained with Masson’s trichrome at room temperature for 2 h. For the PSA staining, tissue sections were stained with PAS according to the manufacturer’s protocol. The stained sections were imaged under a light microscope.
Analysis of Gut Microbiota
Analysis of gut microbiota was performed using 16S rRNA gene amplification sequencing. Briefly, total microbial DNA was extracted using a QIAamp DNA stool Minikit (Qiagen, Germany). The extracted genomic DNA was PCR amplified with barcoded primers (forward primer, 5′-CCT ACG GGA GGC AGC AG-3′; reverse primer, 5′-GGA CTA CHV GGG TWT CTA AT-3′) targeting the 16S rRNA V3-V4 region. An equal amount of DNA from each sample was pooled and verified using an Agilent 2100 bioanalyzer (Agilent, USA). Sequencing was performed using an Illumina MiSeq platform at HRK Bio-Tech Co., Ltd. (Shenzhen, China). Data processing was performed by using the USEARCH (version 10.0.240) program (37) with an open-source bioinformatics pipeline described at http://www.drive5.com/usearch. We applied the Unoise error correction (denoising) algorithm to reconstruct a set of correct biological sequences in the reads and generate zero-radius operational taxonomic units (OTUs). Taxonomic assignment was performed by using the Ribosomal Database Project (RDP) classifier. Statistical analysis was performed with the Calypso web server. The alpha diversity of the fecal microbiome was measured by use of the Shannon and Chao1 indexes. The overall differences in microbiome structure were evaluated through principal-coordinate analysis (PCoA) of a Bray–Curtis distance. BugBase was applied to predict the organism-level microbiome phenotypes. The Kyoto Encyclopedia of Genes and Genomes (KEGG) ortholog functional profiles of the microbial communities were predicted by PICRUSt (Phylogenetic Investigation of Communities by Reconstruction of Unobserved States) pipeline. The linear discriminant analysis (LDA) effect size method (LEfSe) was applied to determine the PICRUSt-predicted functions that were enriched in the different groups.
Targeted Metabolomics Assay
Targeted metabolomics profiling was performed to measure the concentrations of bile acids in fecal samples of the mice with different treatments. Briefly, each accurately weighed lyophilized fecal sample (~10 mg) was homogenized with 50 μL of water using a Bullet Blender tissue homogenizer (Next Advance, Inc., Averill Park, NY). An aliquot of 150 μL of acetonitrile containing 9 internal standards was added, and the extraction was performed using the homogenizer. After centrifugation, 50 μL of each supernatant was transferred to a 96-well plate and diluted with 150 μL of a mobile phase mixture (mobile phase B-mobile phase A [50:50, vol/vol]). The injection volume was 5 μL. After centrifugation, 5 μL supernatant was used for measurement by liquid chromatography-tandem mass spectrometry analysis (LC-TQMS). An Acquity ultraperformance liquid chromatography (UPLC) system (Waters Corp., Milford, MA, USA) coupled with a Xevo TQ-S mass spectrometer (Waters Corp., Milford, MA, USA) was used to quantitate the BAs. MassLynx software (version 4.1; Waters Corp., Milford, MA, USA) was used for instrument control and data processing. Chromatographic separation was achieved with a Waters BEH C18 column (particle size, 1.7 μm; 2.1 mm by 100 mm [internal dimensions]). The UPLC-mass spectrometry (MS) raw data were acquired in negative mode and were processed using the TargetLynx application manager (Waters Corp., Milford, MA, USA) to obtain calibration equations and the measured concentrations of each bile acid in the samples.
Quantitative Real-Time PCR (qRT-PCR)
Total RNA from tissues was extracted with TRIzol reagent (Invitrogen, Shanghai, China) according to the manufacturer’s protocol. Reverse transcription was performed using the PrimeScript™ RT reagent Kit (Takara, Dalian, China). Real-time PCR was performed on an ABI7900 PCR equipment (Applied Biosystems, Foster City, USA) using the SYBR® Premix Ex Taq™ kit (Takara). The primers for real-time PCR were summarized in Table 1. GAPDH was used as the internal control for gene expression, and the relative gene expression levels were determined by the comparative Ct method.
 |
Table 1 Primers for qRT-PCR Analysis |
Statistical Analysis
All the data analysis was performed by using the GraphPad Prism Software (V7.0, GraphPad Software, La Jolla, USA). The in vitro experiments were performed 3 times with triplicate samples for each individual experiment. Data in the animal study were obtained from at least 5 mice. All the data were expressed as the mean ± standard deviation. Unpaired Student’s t-test or one-way ANOVA followed by Bonferroni’s post hoc test was used to determine the statistical significance between/among treatment groups. The correlation between two parameters were evaluated using Spearman correlation test. Statistical significance was set at P < 0.05.
Results
CA Alleviates the Diabetic Complications of T1D Mice
CA treatment had no effects on the body weight of control mice; the body weight of the T1DM mice was significantly reduced when compared to normal mice, whereas the CA treatment partially increased the body weight of the T1DM mice when compared to vehicle-treated T1DM mice (Figure 1A). CA treatment had no effects on the fasting glucose levels in normal mice; whereas the fasting glucose levels were significantly increased in T1DM mice, which was partially attenuated by the intervention of CA (Figure 1B). The glucose tolerance test results showed that T1DM mice showed increased glucose levels after the glucose load when compared to normal mice, and CA treatment significantly reduced the glucose levels in T1DM mice when compared to vehicle-treated T1DM mice (Figure 1C). In addition, T1DM mice showed increased insulin resistance, which was attenuated by CA treatment (Figure 1D).
 |
Figure 1 CA exhibits protective effects in T1DM mice. (A and B) Effects of CA on the body weight (A) and fasting glucose levels (B) of normal and T1DM mice. (C) Glucose tolerance test and (D) insulin resistance were measured in normal mice and T1DM mice treated with vehicle or CA. (E) PAS analysis of glycogen synthesis in the liver tissues from mice and T1DM mice treated with vehicle or CA. (F) H&E staining of the heart tissues from normal mice and T1DM mice treated with vehicle or CA. (G) Masson staining of the heart tissues from normal mice and T1DM mice treated with vehicle or CA. N = 6. *P<0.05. Abbreviations: CA, cinnamaldehyde; T1DM, type 1 diabetes mellitus. |
The glycogen synthesis in the liver tissues was evaluated by PAS staining. As shown in Figure 1E, the glycogen synthesis was markedly impaired in the liver tissues from T1DM mice when compared to control mice; CA treatment significantly increased the glycogen synthesis in the liver tissues of the T1DM mice (Figure 1E). The H&E staining showed that CA treatment showed protective effects on the heart tissues of T1DM mice (Figure 1F). Moreover, Masson staining results showed that myocardial fibrosis was increased in T1DM mice, which was significantly attenuated by CA treatment (Figure 1G).
Alpha and Beta Diversity of the Gut Microbiota of Mice Subjected to Vehicle or CA Treatment
The alpha diversity of gut microbiota was evaluated by Shannon index, Chao1, Simpson’s index and Inverse Simpson’s index; there is no significant difference in the alpha diversity among these treatment groups (Figure 2A–D). The beta diversity of the gut microbiota was evaluated by PCA, PCoA, NMDS and DAPC. As shown in Figure 2E–H, the beta diversity of gut microbiota between CA-treated normal mice and vehicle-treated normal mice is greater than that vehicle-treated normal mice and vehicle-treated T1DM mice; the beta diversity of gut microbiota of CA-treated T1DM mice and vehicle-treated T1DM mice is greater than that between CA-treated normal mice and CA-treated T1DM mice. These results suggest CA treatment affects the composition of the gut microbiota in the T1DM mice.
 |
Figure 2 Alpha and beta diversity of the gut microbiota of mice subjected to vehicle or cinnamaldehyde (CA) treatment. Common indicators including (A) Shannon index, (B) Chao1, (C) Simpson’s index and (D) Inverse Simpson’s index were used to measure alpha diversity of gut microbiota in all mice groups. (E) Principal coordinate analysis (PCoA) of microbiota based on weighted UniFrac distances. (F) Principal coordinate analysis (PCoA) of microbiota based on weighted UniFrac distances at the OTU level. (G) Non-metric multidimensional scaling (NMDS) analysis of gut microbiota based on Bray–Curtis distances. (H) Discriminant analysis of principal components (DAPC) plot at OTUs level. Canonical loading plot showing differentially abundant bacterial genera. The individual peaks show the magnitude of the influence of each variable on separation of the groups (0.05 threshold level). A = control + vehicle group; B = control + CA group; C = T1DM + vehicle group; D = T1MD + CA group. |
Comparative Analysis of Gut Microbiota in the Mice with Different Treatments
The comparative analysis of the gut microbiota at the phylum level was presented as heatmap across different groups (Supplemental Figure S1A). The majority of the gut microbiota was classified as Firmicutes. The abundance of Deferribacteres was significantly in the normal mice than that in the T1DM mice regardless of treatments (Supplemental Figure S1B). At the class level, the abundance of Clostridia, Betaproteobacteria and Deltaproteobacteria was significantly higher and the abundance of Gammaproteobacteria significantly lower in normal mice than that in T1DM mice, which was not affected by CA treatment (Supplemental Figure S2A and S2B). At the order level, the abundance of Betaproteobacteria, Clostridia, Deferribacteres and Deltaproteobacteria was significantly higher and the abundance of Gammaproteobacteria significantly lower in the normal mice than that in the T1DM mice, which was not affected by the CA treatment (Supplemental Figure S3A and S3B). At the family level, the abundance of Anaerotruncus, Oscillibacter, Subdoligranulum, unclassified Lachnospiracea, OlsenellaRoseburia, Desulfovibrio, Mucispirillum, Faecalibacterium and Prevotella was significantly reduced in the T1DM mice; while CA treatment increased the abundance of Clostridiaceae, Enterococcaceae, Enterobacteriaceae and Bifidobacteriaceae in the T1DM mice, and decreased the abundance of Oscillospiraceae, Peptpstreptococcaceae, Prevotellaceae and Pseudomonadaceae in normal mice (Supplemental Figure S4A and S4B). At the genus level, the abundance of Anaerotruncus, Oscillibacter, Subdoligranulum, unclassified Lachnospiracea, OlsenellaRoseburia, Desulfovibrio, Mucispirillum, Faecalibacterium and Prevotella was significantly higher in the normal mice than that in the T1DM group (Figures 3B). CA treatment increased the abundance of Parasutterella, Odoribacter and unclassified Burkholderiales, but decreased the abundance of Dorea and Mucispirillum in normal mice (Figure 3A and B). In addition, CA treatment increased the abundance of Enterococcus and Enterorhabdus, but decreased the abundance of Bacteroides in the T1DM mice (Figure 3A and B).
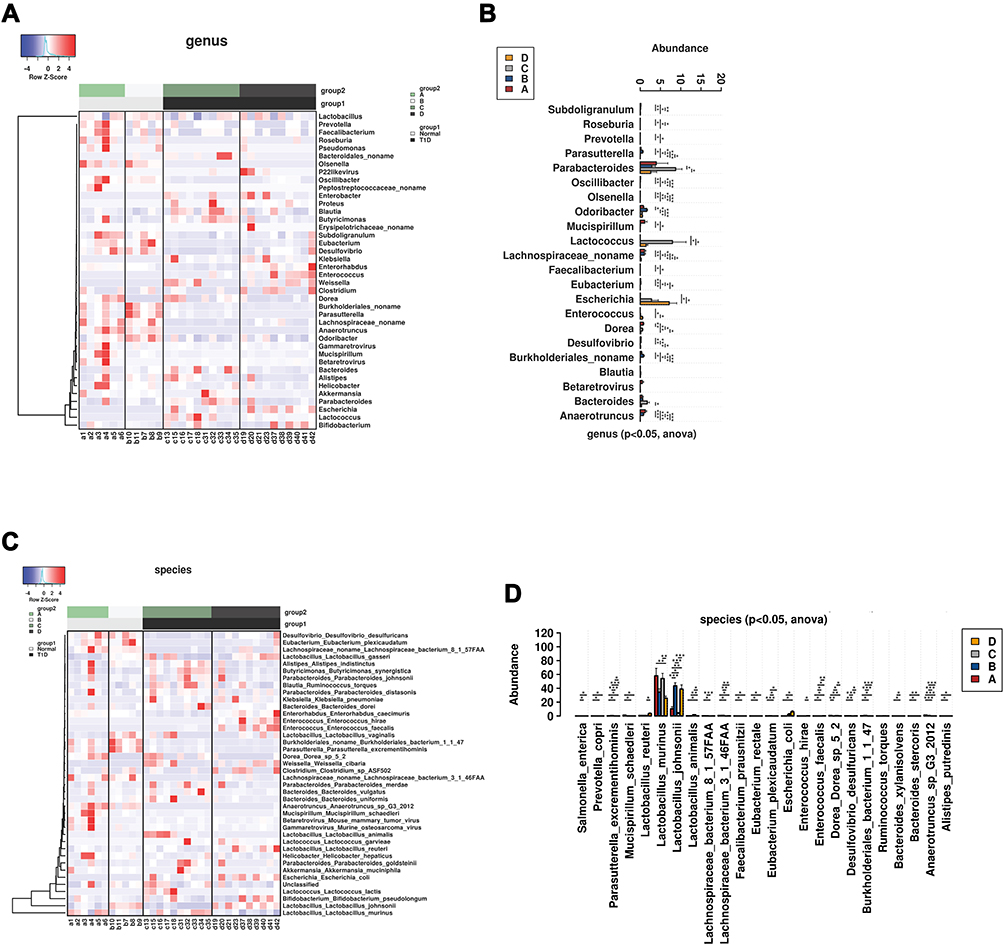 |
Figure 3 Comparative analysis of gut microbiota in the mice from all groups. (A) Heatmap of gut microbiota at the genus level in the normal or T1DM mice treated with vehicle or cinnamaldehyde (CA). (B) Comparative analysis of gut microbiota abundance at the genus level in the normal or T1DM mice treated with vehicle or CA. (C) Heatmap of gut microbiota at the species level in the normal or T1DM mice treated with vehicle or CA. (D) Comparative analysis of gut microbiota abundance at the species level in the normal or T1DM mice treated with vehicle or CA. A = control + vehicle group; B = control + CA group; C = T1DM + vehicle group; D = T1MD + CA group. *P<0.05, **P<0.01 and ***P<0.001. |
At the species level, the abundance of Anaerotruncus sp G3 2012, Lachnospiraceae bacterium 8 1 57FAA, Desulfovibrio desulfuricans, Mucispirillum schaedleri, Bacteroides stercoris, Alistipes putredinis, Faecalibacterium prausnitzii, Eubacterium rectale, Prevotella copri and Lachnospiraceae bacterium 3146FAA was significantly higher in normal mice than that in T1DM mice (Figure 3C and D); while the abundance of Bacteroides xylanisolvens and Lactobacillus animalis was significantly higher in T1DM mice than that in normal mice (Figure 3C and D). In addition, CA treatment increased the abundance of Lactobacillus animalis in both normal and T1DM mice; in addition, CA treatment increased the abundance of Parasutterella excrementihominis, Dorea sp52, Burkholderiales bacterium1147and Mucispirillum schaedleri in normal mice and increased the abundance of Enterococcus faecalis, Lactobacillus reuteri and Enterorhabdus caecimuris in T1DM mice (Figure 3C and D). Notably, CA treatment significantly decreased the abundance of Lactobacillus murinus in the T1DM mice.
Correlation Analysis Between Gut Microbiota and Glucose/Insulin Levels
The correlation between glucose levels/insulin resistance and gut microbiota/functionals genes of gut microbiota was determined by Spearman correlation analysis. At the genus level, the postprandial blood glucose levels and glucose at 120 min after glucose load were positively correlated with the abundance of Lactococcus, Klebsiella, Escherichia, Parabacteroides, Enterococcus, Butyricimonas and Blautia, but negatively correlated with the abundance of Odoribacter, Faecalibacterium, Parasutterella, Subdoligranulum, Burkholderiales_noname, Enterorhabdus, Desulfovibrio, unclassified Lachnospiraceae, Eubacterium and Oscillibactera (Figure 4A). At the species level, the postprandial blood glucose levels and glucose at 120 min after glucose load were positively correlated with the abundance of Lactococcus garvieae, Escherichia coli, Enterococcus faecalis, Butyricimonas synergistica, Lactococcus lactis and Ruminococcus torques, but negative correlated with the abundance of Lactobacillus johnsonii, Faecalibacterium prausnitzii, Parasutterella excrementihominis, Burkholderiales bacterium 1147, Enterorhabdus caecimuris, Desulfovibrio desulfuricans, Lachnospiraceae bacterium 3146FAA and Eubacterium plexicaudatum (Figure 4B). Insulin resistance was not correlated with the abundance of gut microbiota (Figure 4A and B).
 |
Figure 4 Correlation analysis between gut microbiota and glucose/insulin levels. (A) The correlation between abundance of gut microbiota at genus level and glucose/insulin levels were determined by Spearman correlation analysis. (B) The correlation between abundance of gut microbiota at species level and glucose/insulin levels were determined by Spearman correlation analysis. (C) Heatmap and clustering of all samples based on functional composition of the metatranscriptome. (D) The correlation between functional composition of the metatranscriptome and glucose/insulin levels were determined by Spearman correlation analysis. |
In the analysis of functional composition of the metatranscriptome, great difference in the functional composition of the metabolomics between normal and T1DM mice, and heatmap and clustering of all samples based on functional composition of the metatranscriptome were shown in Figure 4C. CA treatment significantly changed the functional composition of the metatranscriptome in the T1DM mice (Figure 4C). The correlation analysis showed that the postprandial blood glucose levels and glucose at 120 min after glucose load were positively correlated with 88 functional pathways and negatively correlated with 2 functional pathways (Figure 4D). In addition, the insulin resistance was negatively correlated with 11 functional pathways (Figure 4D).
Beta Diversity of the Serum Metabolomics of Mice Subjected to Vehicle or CA Treatment
The beta diversity of serum metabolomics was evaluated by PCA, PCoA, NMDS and DAPC. As shown in Figure 5A–D, the beta diversity of metabolics between vehicle-treated normal mice and vehicle-treated T1DM mice is greater than that between vehicle-treated normal mice and CA-treated normal mice; the beta diversity of metabolics between CA-treated normal mice and CA-treated T1DM mice is greater than vehicle-treated T1DM mice and CA-treated T1DM mice. These results suggest T1DM has a greater impact on serum metabolomics than CA. Heatmap clustering of the serum metabolomics in the mice was shown in Supplemental Figure S5, and a total of 215 serum metabolomics were shown.
 |
Figure 5 Beta diversity of the serum metabolomics of mice subjected to vehicle or cinnamaldehyde (CA) treatment. (A) Principal coordinate analysis (PCoA) of serum metabolomics based on weighted UniFrac distances. (B) Principal coordinate analysis (PCoA) of serum metabolomics based on weighted UniFrac distances at the OTU level. (C) Non-metric multidimensional scaling (NMDS) analysis of serum metabolomics based on Bray–Curtis distances. (D) Discriminant analysis of principal components (DAPC) plot at OTUs level. Canonical loading plot showing differentially serum metabolomics. The individual peaks show the magnitude of the influence of each variable on separation of the groups (0.05 threshold level). A = control + vehicle group; B = control + CA group; C = T1DM + vehicle group; D = T1MD + CA group. |
As shown in Figure 6A, the levels of glucose, benzoic acid, nonadecenoic acid, 2-hydroxybutyric acid, 3-hydroxybutyric acid, 3-hydroxybutyrylcarnitine, phenylacetic acid, 3-hydroxyisovaleri acid, cholic acid, methylglutaric acid, mandelic acid, taurocholic acid, isovalerylcarnitine, taurohyodeoxycholic acid, palmitoleic acid and myristoleic acid were significantly higher, but the aminoadipic acid level was lower in T1DM mice than that in normal mice (Figure 6A). The pathway enrichment analysis showed that glucose-alanine cycle, sphingolipid metabolism, galactose synthesis, glycolysis, lactose synthesis, lactose degradation and transfer of acetyl groups into mitochondria were significantly reduced in the T1DM mice when compared to normal mice (Figure 6B). As shown in Figure 6C, CA treatment increased the levels of myristoleic acid and 3-hydroxybutyric acid, but decreased the levels of hydrocinnamic acid and 2-phenylpropionate in normal mice (Figure 6C). CA had no effects on the metabolic pathway in normal mice (Figure 6D). As shown in Figure 6E, CA treatment significantly increased the levels of taurochenodeoxycholic acid, Tauroursodeoxycholic acid, tauro-α-muricholic acid and tauro-β-muricholic acid, taurodeoxycholic acid, taurocholic acid and taurohyodeoxycholic acid in T1DM mice (Figure 6E). CA had no effects on the metabolic pathway in the T1DM mice (Figure 6F).
 |
Figure 6 Comparative analysis of serum metabolomics in the mice. (A) Volcano plot and (B) metabolite pathway enrichment analysis of the differential serum metabolomics between normal mice and T1DM mice treated with vehicle. (C) Volcano plot and (D) metabolite pathway enrichment analysis of the differential serum metabolomics between vehicle-treated normal mice and CA-treated normal mice. (E) Volcano plot and (F) metabolite pathway enrichment analysis of the differential serum metabolomics between vehicle-treated T1DM mice and CA-treated T1DM mice. (G) The correlation between serum metabolomics and glucose/insulin levels were determined by Spearman correlation analysis. (H) The correlation between serum metabolomics levels and gut microbiota abundance were determined by Spearman correlation analysis. Abbreviations: FC, fold change; NS, non-significant; Spearman cor, Spearman correlation. |
The correlation analysis showed that the postprandial blood glucose levels and blood glucose levels at 120 min after glucose load were positively correlated with the levels of 3-hydroxyisovalerylcarnitine, pentadecanoic acid, D-glucose, homocysteine, methylcysteine, eicosadienoic acid, 2 2-Hydroxy-3-methylbutyric acid, D-fructose, linoleic acid and L-valine, but negatively correlated with the levels of aminoadipic acid, beta alanine, carnitine, erythronic acid, glycine, L-glutamic acid, L-glutamine, lysine, myristoleic acid, palmitoleic acid, pyroglutamic acid and taurohyodeoxycholic acid (Figure 6G). The insulin resistance index was positively correlated with the levels of (Z)-nonadec-10-enoic acid, D-ribulose, N-acetyl-L-aspartic acid, L-glutamine, docosapentaenoic acid (22n 6), oleic acid, ricinoleic acid, pyroglutamic acid, 10Z heptadecenoic acid, aminoadipic acid, arachidonic acid, 9 pentadecenoic acid and 81,114 eicosatrienoic acid; but was negatively correlated with the levels of phenylacetic acid, benzoic acid, but 2-enoic acid, 3-hydroxyisovaleric acid, ethylmethylacetic acid, phenylglycine and sebacic acid (Figure 6G).
Further analysis revealed that the abundance of Escherichia coli, Enterococcus faecalis and Lactococcus garvieae were positively correlated with the levels of 25 metabolomics, but negatively correlated with the levels of palmitoleic acid, myristoleic acid, aminoadipic acid and taurohyodeoxycholic acid (Figure 6H). In addition, the abundance of Helicobacter hepaticus, Burkholderiales bacterium 1147, Parasutterella excrementihominis and Eubacterium plexicaudatum were positively correlated with the levels of palmitoleic acid, myristoleic acid, aminoadipic acid and taurohyodeoxycholic acid (Figure 6H).
Analysis of Differentially Expressed Genes in the Mice Subjected to Vehicle or CA Treatment
As shown in Figure 7, there is no significant difference in the AKT1, AKT2, interleukin-2 receptor alpha chain (IL2RA) and insulin-1 (INS1) mRNA expression levels among different treatment groups. In terms of AMP-activated protein kinase (AMPK), CA treatment only up-regulated AMPK mRNA expression in normal mice (Figure 7A). In terms of insulin receptor (INSR), CA treatment up-regulated INSR mRNA expression in normal mice but not in T1DM mice; the expression of INSR was up-regulated in the T1DM mice when compared to normal mice (Figure 7A). Moreover, the expression of IGF1R and IRS1 was up-regulated in T1DM mice when compared to normal mice; whereas CA treatment had no effects on the insulin Like growth factor 1 receptor (IGF1R) and insulin receptor substrate 1 (IRS1) mRNA expression levels (Figure 7A). The mRNA expression of E2F1 was up-regulated in T1DM mice when compared to the normal mice; whereas CA had no effects on the E2F1 mRNA expression levels (Figure 7A). In terms of endothelial nitric oxide synthase 3 (eNOS), CA treatment only up-regulated eNOS mRNA expression in T1DM mice (Figure 7A).
 |
Figure 7 Analysis of differentially expressed genes in the mice subjected to vehicle or CA treatment. The mRNA expression levels of (A) AKT1, AKT2, IL2RA, INS1, AMPK, INSR, IGF1R, IRS1, E2F1 and eNOS in the mice from all groups. (B) The correlation between mRNA expression levels and gut microbiota abundance were determined by Spearman correlation analysis. (C) The correlation between serum metabolomics levels and mRNA expression levels were determined by Spearman correlation analysis. *P < 0.05 and **P < 0.01. Abbreviation: Spearman cor, Spearman correlation. |
As show in Figure 7B, the correlation analysis showed that the mRNA expression level of eNOS was negatively correlated with the abundance of Dorea sp. 5–2, Lactobacillus animalis, Prevotella copri, Klebsiella oxytoca, Bacteroides xylanisolvens, Bacteroidales bacterium ph8, Butyricimonas synergistica. The mRNA expression level of IRS1 was negatively correlated with the abundance of Eubacterium plexicaudatum, Anaerotruncus sp G3 2012, Mucispirillum schaedleri, Faecalibacterium prausnitzii. The mRNA expression level of AKT1 was negatively correlated with the abundance of Lactobacillus gasseri and Lactococcus lactis. The mRNA expression level of AKT2 was negatively correlated with the abundance of Eubacterium plexicaudatum, Anaerotruncus sp G3 2012, Mucispirillum schaedleri and Faecalibacterium prausnitzii, and was negatively correlated with the abundance of Lactococcus garvieae. The mRNA expression level of INS1 was negatively correlated with the abundance of Desulfovibrio desulfuricans and Lachnospiraceae bacterium 8157FAA, and was positively correlated with the abundance of Lactococcus garvieae, Bacteroides dorei, Enterobacter aerogenes, Proteus mirabilis, Lactobacillus reuteri, Weissella cibaria, Enterococcus faecalis and Klebsiella pneumoniae (Figure 7B). Notably, the abundance of Faecalibacterium prausnitzii was negatively correlated with the mRNA expression levels of AKT2, IGF1R, E2F1 and IRS1. The mRNA expression level of E2F1 was negatively correlated with the abundance of Lactobacillus murinus (Figure 7B).
The correlation between serum metabolomics levels and mRNA expression levels were determined by Spearman correlation analysis. As shown in Figure 7C, the AMPK mRNA expression levels were negatively correlated with the levels of N-acetyltryptophan, N-acetylserine and L-aspartic acid; but was positively correlated with the levels of eicosapentaenoic acid, eicosadienoic acid, docosapentaenoic acid and alpha linolenic acid (Figure 7C). The E2F1 mRNA expression level was negatively correlated with the levels of N-acetylserine and formic acid; but was positively correlated with 3-phenylbutyric acid level (Figure 7C). The eNOS mRNA expression level was negatively correlated with the levels of citrulline, p-hydroxymandelic acid, ursodeoxycholic acid, N-acetyltryptophan and D-xylose; but was positively correlated with the levels of 5-dodecenoic acid, adipoylcarnitine, hexanylcarnitine, myristelaidic acid, stearylcarnitine, oleylcarnitine-C18-1 and linoleylcarnitine (Figure 7C). The IGF1R mRNA expression level was negatively correlated with the levels of acetylserine, N-acetyltryptophan and formic acid; but was positively correlated with the levels of phenylbutyric acid and eicosapentaenoic acid (Figure 7C). The IRS1 mRNA expression level was negatively correlated with the levels of N-acetylserine, taurohyodeoxycholic acid and formic acid; but was positively correlated with the levels of azelaic acid, D-fructose, cholic acid and mandelic acid (Figure 7C). The AKT1 mRNA expression level was negatively correlated with isovaleric acid level, and positively correlated with ornithine level (Figure 7C). The AKT2 mRNA expression level was negatively correlated with the levels of N-acetylserine, taurohyodeoxycholic acid, phenylpyruvic acid, palmitoleic acid, myristoleic acid, L-glutamic acid, formic acid, glycylproline and dodecanoic acid; but was positively correlated with phenylacetic acid, methylcysteine, D-fructose, cholic acid and mandelic acid (Figure 7C). The IL2RA mRNA expression level was positively correlated with phthalic acid level (Figure 7C). The INSR mRNA expression level was correlated with the levels of 3-phenylbutyric acid, mandelic acid and 4-hydroxybenzoic acid; while the INS1 mRNA expression level was negatively correlated with the levels of 9-pentadecenoic acid, dodecanoic acid, 10Z-heptadecenoic acid, and myristoleic acid; but was positively correlated with the levels of 3-hydroxyisovaleric acid, 3-hydroxyisovalerylcarnitine, 2-hydroxy-3-methylbutyric acid, methylcysteine, ortho-hydroxyphenylacetic acid, hippuric acid, D-glucose, itaconic acid, phenylacetic acid and pentadecanoic acid (Figure 7C).
Discussion
In the present study, CA treatment partially restored the blood glucose levels and reduced insulin resistance in T1DM mice, suggesting the protective effects of CA against STZ-induced T1DM. The liver is the key organ responsible for glycogen storage and gluconeogenesis, and glucose metabolism is regulated by various glucose metabolism-related enzymes (glucose-6-phosphatase, glycogenase, glycogen synthase-3, etc.). During diabetes onset, various pathogenic factors affect the activities of enzymes related to glucose metabolism and gene expression, resulting in glucose metabolism disorder. Therefore, restoring the abnormality of glucose metabolism-related enzymes is an important strategy to treat diabetes. CA is the main active component of cinnamon, which can protect pancreatic islet cells, promote the transport of skeletal muscle cell transporter-4 (GLUT-4), and regulate blood glucose levels.23,24 CA can significantly reduce the levels of fasting blood glucose and fasting serum insulin in mice, and can reduce blood lipids and increase liver glycogen content,24 which is consistent with our findings. In addition, CA can also improve myocardial function in diabetic mice and reduce cardiac fibrosis,23,25 which is in agreement with our findings.
Gut microbiota plays an important role in regulating insulin resistance and postprandial glucose response.26 In human trials, the intake of prebiotics has been shown to affect the composition of gut microbiota, change intestinal permeability, increase plasma GLP-1 concentration, and reduce postprandial glucose level.27 Implantation of lean donor fecal preparations can temporarily reduce insulin resistance in obese individuals with metabolic syndrome.28 A randomized double-blind clinical trial found that 136 patients with type 2 diabetes ingestion of Lactobacillus acidophilus could maintain insulin sensitivity without systemic inflammation.29 Another study found that drinking yogurt containing Lactobacillus acidophilus La5 and Bifidobacterium Bb12 for 6 consecutive weeks can improve the oxidation and glucose metabolism of patients with T2DM.30 Al-Salami et al, found that feeding rats with probiotics containing Lactobacillus acidophilus, Bifidobacterium lactis and Rhamnobacterium rhamnosus can reduce the blood glucose levels of diabetic rats, indicating that probiotics stimulate the gut microbiota to produce insulin-promoting peptides and glucagon-like peptide-1, thereby reducing blood glucose concentration in diabetic rats.31 The administration of Lactobacillus johnsonii N6.2 isolated from anti-biodegradation diabetic rats can delay or inhibit the onset of T1DM.32 These data suggested that gut microbiota are potential factors affecting the development of T1DM. These data also support therapeutic efforts that try to modulate disease progression by changing gut microbiota. A recent study showed that fexaramine may activate intestinal FXR and TGR5/GLP-1 signals through the activation of gut microbiota, thereby preventing obesity and related metabolic diseases.33 Studies also demonstrated that changes in the gut microbiota could alter the levels of bile acids, which affect the metabolism of the host. The present study explored the effects of CA on gut microbiota from normal mice and T1DM mice using shotgun metagenomics technology. At the lower level of classification (phyla, class, order), the gut microbiota of normal mice and T1DM mice are different, and the effects of CA were not obvious; at the level of family and species, the differences gradually increased with significance. The most important findings were that Lactobacillus johnsonii was significantly increased after CA intervention, especially in T1DM mice, which increased by 10.4 times, suggesting that CA exerts its protective effects against STZ-induced T1DM via modulating gut microbiota.
Studies have shown that deoxycholic acid, especially ursodeoxycholic acid, has a variety of beneficial effects including (a) increasing the secretion of bile acid, leading to changes in bile acid composition and increasing the content of bile; (b) inhibiting the synthesis of cholesterol in the liver; (c) promoting the formation of liquid cholesterol crystal complexes, which can accelerate the excretion and clearance of cholesterol from the gallbladder to the intestine; (d) reducing liver fat, increasing liver catalase activity, promoting liver glycogen accumulation, and improving liver detoxification ability. Recent studies have shown that gut microbiota play a key role in regulating bile acid biosynthesis and FXR signaling.34 FXR is a ligand-activated receptor, which is expressed in liver, intestinal epithelium, adipose tissue, kidney, pancreas, stomach, gallbladder, macrophages and other tissues.35 It is noteworthy that gut microbiota regulates bile acid metabolism, which leads to activation of FXR in the liver and intestine. Activating FXR can prevent obesity, diabetes, fatty liver and other diseases, and improve hyperlipidemia and hyperglycemia.36,37 Recent studies have also shown that intestinal FXR agonists can inhibit bacterial overgrowth, prevent bacterial translocation and epithelial cell degradation.38 Studies have shown that a variety of deoxycholic acids are antagonists of FXR, including glyuroursodeoxycholic acid (GUDCA) and tauroursodeoxycholic acid (TUDCA). In addition, GUDCA inhibits intestinal FXR signaling in a way that does not depend on intestinal AMPK, and plays a role in improving glucose metabolism.39 CA and CDCA are FXR receptor agonists, which can activate small heterodimers of FXR in the liver and inhibit the expression of sterol 12α-hydroxylase (CYP8B1) and bile acid synthesis.40 However, inhibition of intestinal FXR can prevent obesity-related metabolic dysfunction in mice. Paradoxically, FXR antagonists have similar beneficial effects on improving obesity, insulin resistance, and reducing non-alcoholic fatty liver.41 Our results suggest that CA may improve metabolic dysfunction through the gut microbe-deoxycholic acid-FXR axis, which may require further investigations.
AMP-activated protein kinase (AMPK) is an evolutionarily conserved serine/threonine kinase. Its activation can cause insulin sensitization and is an ideal therapeutic target for diabetes. AMPK disorders exist in animals and humans with metabolic syndrome or diabetes. Previous showed that CA increased the levels of phosphorylated AMPK and phosphorylated acetyl-coenzyme A carboxylase by reducing fatty acid synthase (FAS) expression.19 Our experimental results found that the CA can increase the AMPK expression level in mice, which is consistent with previous studies.19 E2F1 participates in metabolic functions of pancreas, adipose tissue, muscle and liver. E2F1/E2F2 mutant mice showed severe exocrine pancreatic β-cell apoptosis, leading to insulin-dependent diabetes.42 At the same time, E2F1 promotes β cell proliferation and differentiation, a regulatory endocrine marker PDX-1 Neurogenin.43 Our experimental results found that cinnamaldehyde can increase the expression level of E2F1 in mice, indicating that cinnamon can reduce blood sugar levels through targeting E2F1. Through correlation analysis, our results showed that the expression of Lactobacillus murinus and E2F1 in the intestinal tract was negatively correlated, and Lactobacillus murinus was significantly reduced after the CA treatment. We speculate that Lactobacillus murinus can regulate E2F1 through its metabolites, such as organic acids/short-chain fatty acids. In fact, some studies have found that butyric acid in short-chain fatty acids down-regulated E2F1 expression and attenuated the activation of its promoters.44 Insulin-like growth factors (IGF) is an active protein peptide substance necessary for the physiological action of growth hormone. The activation of IGF is mainly mediated by IGF-1 receptor (IGF-1R). This study found that IGF-1R increased after CA intervention, suggesting that IGF-1-related function can be affected by CA. The classic pathway of insulin in glucose metabolism is the phosphatidylinositol 3-kinase (PI3K)/protein kinase B (AKT) signaling pathway, which plays a role in the uptake of glucose by the liver, skeletal muscle and adipose tissue.45 This pathway activates the PI3K enzyme through the insulin receptor substrates IRS1 and IRS2. Insulin receptor (INSR) is a transmembrane receptor activated by insulin, IGF-1, and IGF-II, and belongs to the broad category of tyrosine kinase receptors. In terms of metabolism, INSR plays a key role in regulating glucose homeostasis, and its abnormal expression has been found to be associated with diabetes and cancer. In the insulin signaling pathway, insulin induces insulin receptor substrate 1/2 (IRS-1, IRS-2), which in turn stimulates the PI3K pathway, leading to AKT phosphorylation and glycogen synthase kinase-3 inhibition; while AKT2 may stimulate other transcription factors that inhibit gluconeogenesis and glycogen accumulation in the liver.46 This study demonstrated that CA affects the expression level of IRS1, suggesting that CA may improve insulin sensitivity through the PI3K/Akt pathway. Furthermore, we found that the levels of taurohyodeoxycholic acid and IRS1 showed a significant negative correlation. The levels of taurohyodeoxycholic acid and IRS1 both showed an upward trend after CA intervention, suggesting that the two molecules may not directly interact with each other, but independently regulate glucose metabolism. On the other hand, IRS1 plays a key role in the coupling of insulin receptors to PI3K signaling and the activation of eNOS.47 Previous studies have clearly confirmed that a complete biochemical pathway including IRS1, PI3K and eNOS can explain the physiological role of insulin in stimulating nitric oxide production.48 CA treatment increased the expression levels of IRS1, PI3K, and AKT2 genes. These results suggest that CA may increase expression levels of these genes through the insulin signaling pathway (IRS1/PI3K/AKT2 pathway). This study found that eNOS expression in T1DM mice increased after CA intervention. Combined with the pathological results, CA may improve the myocardial function of T1DM mice by increasing the expression of eNOS. In addition, the expression of eNOS is positively correlated with ursodeoxycholic acid, suggesting that there may be a correlation between the two mediators.
The present study has several limitations. Firstly, though the present study examined the effects of CA on gut microbiota and metabolomics in the T1DM mice, the detailed molecular mechanisms underlying CA-mediated protective effects require further investigation. Secondly, the present study demonstrated the beneficial effects of CA on the T1DM development, while the toxicity of CA should be considered in the future studies. Thirdly, the present study only used the STZ-induced T1DM mice model, while other T1DM animal model with gene mutations should be performed to consolidate the protective effects of CA.
Conclusions
In conclusion, through multiple omics techniques, our results indicated that CA may interfere with gut microbiota to affect host metabolomics, especially the bile acids, so as to directly or indirectly modulate the expression levels of glucose metabolism-related genes, thus subsequently reducing the blood glucose level in the T1DM mice. This study provides novel insights into exploring new targets for the treatment and control of diabetes based on gut microbiota and/or its metabolites.
Data Sharing Statement
All the data in the manuscript are available upon reasonable request from the corresponding author.
Author Contributions
All authors made substantial contributions to conception and design, acquisition of data, or analysis and interpretation of data; took part in drafting the article or revising it critically for important intellectual content; agreed to submit to the current journal; gave final approval of the version to be published; and agree to be accountable for all aspects of the work.
Funding
This study was supported by Shenzhen Key Medical Discipline Construction Fund (No. SZXK019).
Disclosure
The authors report no conflicts of interest for this work.
References
1. Norris JM, Johnson RK, Stene LC. Type 1 diabetes-early life origins and changing epidemiology. Lancet Diabetes Endocrinol. 2020;8(3):226–238. doi:10.1016/S2213-8587(19)30412-7
2. Howard SG, Sargis RM. Type 1 diabetes-origins and epidemiology. Lancet Diabetes Endocrinol. 2020;8(5):367–368. doi:10.1016/S2213-8587(20)30106-6
3. Zimmet P, Alberti KG, Magliano DJ, Bennett PH. Diabetes mellitus statistics on prevalence and mortality: facts and fallacies. Nat Rev Endocrinol. 2016;12(10):616–622. doi:10.1038/nrendo.2016.105
4. Huang J, Huang G, Li X, et al. Altered systemic and intestinal IgA immune responses in individuals with type 1 diabetes. J Clin Endocrinol Metab. 2020;105(12):e4616–e4625. doi:10.1210/clinem/dgaa590
5. Perna-Barrull D, Gieras A, Rodriguez-Fernandez S, Tolosa E, Vives-Pi M. Immune system remodelling by prenatal betamethasone: effects on β-cells and type 1 diabetes. Front Endocrinol (Lausanne). 2020;11:540. doi:10.3389/fendo.2020.00540
6. Sur S. In silico analysis reveals interrelation of enriched pathways and genes in type 1 diabetes. Immunogenetics. 2020;72(8):399–412. doi:10.1007/s00251-020-01177-3
7. Celiker C, Kalkan R. Genetic and epigenetic perspective of microbiota. Appl Microbiol Biotechnol. 2020;104(19):8221–8229. doi:10.1007/s00253-020-10849-9
8. Steinway SN, Saleh J, Koo BK, Delacour D, Kim DH. Human microphysiological models of intestinal tissue and gut microbiome. Front Bioeng Biotechnol. 2020;8:725. doi:10.3389/fbioe.2020.00725
9. Yang Q, Wang Y, Jia A, Wang Y, Bi Y, Liu G. The crosstalk between gut bacteria and host immunity in intestinal inflammation. J Cell Physiol. 2020. doi:10.1002/jcp.30024
10. Gérard P. Gut microbiota and obesity. Cell Mol Life Sci. 2016;73(1):147–162. doi:10.1007/s00018-015-2061-5
11. Patterson E, Ryan PM, Cryan JF, et al. Gut microbiota, obesity and diabetes. Postgrad Med J. 2016;92(1087):286–300. doi:10.1136/postgradmedj-2015-133285
12. Thursby E, Juge N. Introduction to the human gut microbiota. Biochem J. 2017;474(11):1823–1836. doi:10.1042/BCJ20160510
13. Han H, Li Y, Fang J, et al. Gut microbiota and type 1 diabetes. Int J Mol Sci. 2018;19(4):995. doi:10.3390/ijms19040995
14. Jamshidi P, Hasanzadeh S, Tahvildari A, et al. Is there any association between gut microbiota and type 1 diabetes? A systematic review. Gut Pathog. 2019;11(1):49. doi:10.1186/s13099-019-0332-7
15. Siljander H, Honkanen J, Knip M. Microbiome and type 1 diabetes. EBioMedicine. 2019;46:512–521. doi:10.1016/j.ebiom.2019.06.031
16. Haukka JK, Sandholm N, Forsblom C, Cobb JE, Groop PH, Ferrannini E. Metabolomic profile predicts development of microalbuminuria in individuals with type 1 diabetes. Sci Rep. 2018;8(1):13853. doi:10.1038/s41598-018-32085-y
17. Rehni AK, Dave KR. Impact of hypoglycemia on brain metabolism during diabetes. Mol Neurobiol. 2018;55(12):9075–9088. doi:10.1007/s12035-018-1044-6
18. Abbiss H, Maker GL, Trengove RD. Metabolomics approaches for the diagnosis and understanding of kidney diseases. Metabolites. 2019;9(2):34. doi:10.3390/metabo9020034
19. Zhu R, Liu H, Liu C, et al. Cinnamaldehyde in diabetes: a review of pharmacology, pharmacokinetics and safety. Pharmacol Res. 2017;122:78–89. doi:10.1016/j.phrs.2017.05.019
20. Abdelmageed ME, Shehatou GS, Abdelsalam RA, Suddek GM, Salem HA. Cinnamaldehyde ameliorates STZ-induced rat diabetes through modulation of IRS1/PI3K/AKT2 pathway and AGEs/RAGE interaction. Naunyn Schmiedebergs Arch Pharmacol. 2019;392(2):243–258. doi:10.1007/s00210-018-1583-4
21. Jawale A, Datusalia AK, Bishnoi M, Sharma SS. Reversal of diabetes-induced behavioral and neurochemical deficits by cinnamaldehyde. Phytomedicine. 2016;23(9):923–930. doi:10.1016/j.phymed.2016.04.008
22. Khare P, Jagtap S, Jain Y, et al. Cinnamaldehyde supplementation prevents fasting-induced hyperphagia, lipid accumulation, and inflammation in high-fat diet-fed mice. Biofactors. 2016;42(2):201–211. doi:10.1002/biof.1265
23. Yang L, Wu QQ, Liu Y, Hu ZF, Bian ZY, Tang QZ. Cinnamaldehyde attenuates pressure overload-induced cardiac hypertrophy. Int J Clin Exp Pathol. 2015;8(11):14345–14354.
24. Zuo J, Zhao D, Yu N, et al. Cinnamaldehyde ameliorates diet-induced obesity in mice by inducing browning of white adipose tissue. Cell Physiol Biochem. 2017;42(4):1514–1525. doi:10.1159/000479268
25. Wang D, Hou J, Yang Y, et al. Cinnamaldehyde ameliorates high-glucose-induced oxidative stress and cardiomyocyte injury through transient receptor potential ankyrin 1. J Cardiovasc Pharmacol. 2019;74(1):30–37. doi:10.1097/FJC.0000000000000679
26. Cani PD, Amar J, Iglesias MA, et al. Metabolic endotoxemia initiates obesity and insulin resistance. Diabetes. 2007;56(7):1761–1772. doi:10.2337/db06-1491
27. Silk DB, Davis A, Vulevic J, Tzortzis G, Gibson GR. Clinical trial: the effects of a trans-galactooligosaccharide prebiotic on faecal microbiota and symptoms in irritable bowel syndrome. Aliment Pharmacol Ther. 2009;29(5):508–518. doi:10.1111/j.1365-2036.2008.03911.x
28. Andreasen AS, Larsen N, Pedersen-Skovsgaard T, et al. Effects of lactobacillus acidophilus NCFM on insulin sensitivity and the systemic inflammatory response in human subjects. Br J Nutr. 2010;104(12):1831–1838. doi:10.1017/S0007114510002874
29. Ejtahed HS, Mohtadi-Nia J, Homayouni-Rad A, Niafar M, Asghari-Jafarabadi M, Mofid V. Probiotic yogurt improves antioxidant status in type 2 diabetic patients. Nutrition. 2012;28(5):539–543. doi:10.1016/j.nut.2011.08.013
30. Jung SP, Lee KM, Kang JH, et al. Effect of lactobacillus gasseri BNR17 on overweight and obese adults: a randomized, double-blind clinical trial. Korean J Fam Med. 2013;34(2):80–89. doi:10.4082/kjfm.2013.34.2.80
31. Al-Salami H, Butt G, Tucker I, Skrbic R, Golocorbin-Kon S, Mikov M. Probiotic pre-treatment reduces gliclazide permeation (ex vivo) in healthy rats but increases it in diabetic rats to the level seen in untreated healthy rats. Arch Drug Inf. 2008;1(1):35–41. doi:10.1111/j.1753-5174.2008.00006.x
32. Valladares R, Sankar D, Li N, et al. Lactobacillus johnsonii N6.2 mitigates the development of type 1 diabetes in BB-DP rats. PLoS One. 2010;5(5):e10507. doi:10.1371/journal.pone.0010507
33. Pathak P, Xie C, Nichols RG, et al. Intestine farnesoid X receptor agonist and the gut microbiota activate G-protein bile acid receptor-1 signaling to improve metabolism. Hepatology. 2018;68(4):1574–1588. doi:10.1002/hep.29857
34. Zhang L, Xie C, Nichols RG, et al. Farnesoid X receptor signaling shapes the gut microbiota and controls hepatic lipid metabolism. mSystems. 2016;1(5). doi:10.1128/mSystems.00070-16.
35. Forman BM, Goode E, Chen J, et al. Identification of a nuclear receptor that is activated by farnesol metabolites. Cell. 1995;81(5):687–693. doi:10.1016/0092-8674(95)90530-8
36. Zhang Y, Lee FY, Barrera G, et al. Activation of the nuclear receptor FXR improves hyperglycemia and hyperlipidemia in diabetic mice. Proc Natl Acad Sci U S A. 2006;103(4):1006–1011. doi:10.1073/pnas.0506982103
37. Ali AH, Carey EJ, Lindor KD. Recent advances in the development of farnesoid X receptor agonists. Ann Transl Med. 2015;3(1):5. doi:10.3978/j.issn.2305-5839.2014.12.06
38. Inagaki T, Moschetta A, Lee YK, et al. Regulation of antibacterial defense in the small intestine by the nuclear bile acid receptor. Proc Natl Acad Sci U S A. 2006;103(10):3920–3925. doi:10.1073/pnas.0509592103
39. Sun L, Xie C, Wang G, et al. Gut microbiota and intestinal FXR mediate the clinical benefits of metformin. Nat Med. 2018;24(12):1919–1929. doi:10.1038/s41591-018-0222-4
40. Gonzalez FJ, Jiang C, Patterson AD. An intestinal microbiota-farnesoid x receptor axis modulates metabolic disease. Gastroenterology. 2016;151(5):845–859. doi:10.1053/j.gastro.2016.08.057
41. Jiang C, Xie C, Li F, et al. Intestinal farnesoid X receptor signaling promotes nonalcoholic fatty liver disease. J Clin Invest. 2015;125(1):386–402. doi:10.1172/JCI76738
42. Li FX, Zhu JW, Tessem JS, et al. The development of diabetes in E2f1/E2f2 mutant mice reveals important roles for bone marrow-derived cells in preventing islet cell loss. Proc Natl Acad Sci U S A. 2003;100(22):12935–12940. doi:10.1073/pnas.2231861100
43. Kim SY, Rane SG. The Cdk4-E2f1 pathway regulates early pancreas development by targeting Pdx1+ progenitors and Ngn3+ endocrine precursors. Development. 2011;138(10):1903–1912. doi:10.1242/dev.061481
44. Abramova MV, Pospelova TV, Nikulenkov FP, Hollander CM, Fornace AJ
45. Cusi K, Maezono K, Osman A, et al. Insulin resistance differentially affects the PI 3-kinase- and MAP kinase-mediated signaling in human muscle. J Clin Invest. 2000;105(3):311–320. doi:10.1172/JCI7535
46. Cordero-Herrera I, Martín MA, Bravo L, Goya L, Ramos S. Cocoa flavonoids improve insulin signalling and modulate glucose production via AKT and AMPK in HepG2 cells. Mol Nutr Food Res. 2013;57(6):974–985. doi:10.1002/mnfr.201200500
47. Montagnani M, Ravichandran LV, Chen H, Esposito DL, Quon MJ. Insulin receptor substrate-1 and phosphoinositide-dependent kinase-1 are required for insulin-stimulated production of nitric oxide in endothelial cells. Mol Endocrinol. 2002;16(8):1931–1942. doi:10.1210/me.2002-0074
48. Alameddine A, Fajloun Z, Bourreau J, et al. The cardiovascular effects of salidroside in the goto-kakizaki diabetic rat model. J Physiol Pharmacol. 2015;66(2):249–257.
 © 2021 The Author(s). This work is published and licensed by Dove Medical Press Limited. The full terms of this license are available at https://www.dovepress.com/terms.php and incorporate the Creative Commons Attribution - Non Commercial (unported, v3.0) License.
By accessing the work you hereby accept the Terms. Non-commercial uses of the work are permitted without any further permission from Dove Medical Press Limited, provided the work is properly attributed. For permission for commercial use of this work, please see paragraphs 4.2 and 5 of our Terms.
© 2021 The Author(s). This work is published and licensed by Dove Medical Press Limited. The full terms of this license are available at https://www.dovepress.com/terms.php and incorporate the Creative Commons Attribution - Non Commercial (unported, v3.0) License.
By accessing the work you hereby accept the Terms. Non-commercial uses of the work are permitted without any further permission from Dove Medical Press Limited, provided the work is properly attributed. For permission for commercial use of this work, please see paragraphs 4.2 and 5 of our Terms.