")
Back to Journals » Neuropsychiatric Disease and Treatment » Volume 16
Chronic Stress in a Rat Model of Depression Disturbs the Glutamine–Glutamate–GABA Cycle in the Striatum, Hippocampus, and Cerebellum
Authors Xu S, Liu Y, Pu J, Gui S, Zhong X, Tian L, Song X, Qi X, Wang H, Xie P
Received 8 January 2020
Accepted for publication 17 February 2020
Published 24 February 2020 Volume 2020:16 Pages 557—570
DOI https://doi.org/10.2147/NDT.S245282
Checked for plagiarism Yes
Review by Single anonymous peer review
Peer reviewer comments 2
Editor who approved publication: Dr Yuping Ning
Shaohua Xu, 1–3,* Yiyun Liu, 2, 3,* Juncai Pu, 2, 3,* Siwen Gui, 2–4,* Xiaogang Zhong, 2, 3 Lu Tian, 2, 3 Xuemian Song, 2–4 Xunzhong Qi, 2, 3 Haiyang Wang, 2, 3 Peng Xie 1–3, 5
1Department of Neurology, Yongchuan Hospital, Chongqing Medical University, Chongqing 402160, People’s Republic of China; 2NHC Key Laboratory of Diagnosis and Treatment on Brain Functional Diseases, The First Affiliated Hospital of Chongqing Medical University, Chongqing 400016, People’s Republic of China; 3Chongqing Key Laboratory of Neurobiology, Chongqing 400016, People’s Republic of China; 4College of Biomedical Engineering, Chongqing Medical University, Chongqing 400016, People’s Republic of China; 5Department of Neurology, The First Affiliated Hospital of Chongqing Medical University, Chongqing, People’s Republic of China
*These authors contributed equally to this work
Correspondence: Peng Xie
NHC Key Laboratory of Diagnosis and Treatment on Brain Functional Diseases, The First Affiliated Hospital of Chongqing Medical University, Chongqing 400016, People’s Republic of China
Tel +86-023-68485490
Fax +86-023-68485111
Email [email protected]
Background: Major depressive disorder (MDD) is a complex psychiatric illness involving multiple brain regions. Increasing evidence indicates that the striatum is involved in depression, but the molecular mechanisms remain unclear.
Methods: In this study, we performed a gas chromatography–mass spectrometer (GC/MS)-based metabolomic analysis in the striatum of depressed rats induced by chronic unpredictable mild stress (CUMS). We then compared striatal data with our previous data from the hippocampus and cerebellum to systematically investigate the potential pathogenesis of depression.
Results: We identified 22 differential metabolites in the striatum between the CUMS and control groups; these altered metabolites were mainly involved in amino acid, carbohydrate, and nucleotide metabolism. Pathway analysis revealed that the shared metabolic pathways of the striatum, hippocampus, and cerebellum were mainly involved in the glutamine–glutamate metabolic system. Four genes in the striatum (GS, GLS2, GLT1, and SSADH), six genes in the hippocampus (GS, SNAT1, GAD1, SSADH, VGAT, and ABAT), and five genes in the cerebellum (GS, ABAT, SNAT1, VGAT, and GDH) were found to be significantly altered using RT-qPCR. Correlation analysis indicated that these differential genes were strongly correlated.
Conclusion: These results suggest that chronic stress might induce depressive behaviors by disturbing the glutamine–glutamate–GABA cycle in the striatum, hippocampus, and cerebellum, and that the glutamine–glutamate–GABA cycle among these three brain regions might generate cooperative action in response to chronic stress.
Keywords: chronic unpredictable mild stress, glutamine–glutamate–GABA cycle, depression, striatum, GC/MS
Introduction
Major depressive disorder (MDD) is a ubiquitous and complex psychiatric condition, with a lifetime prevalence of 16.2%.1 So far, numerous researches have investigated the pathogenesis of MDD,2–6 but the precise pathogenic mechanisms remain unclear. Increasing evidence indicates that the striatum plays a critical role in neuropsychiatric disorders.7,8
The striatum is the largest component of the basal ganglia, and mainly receives various excitatory inputs from the cortex, hippocampus, and cerebellum. Positron emission tomography (PET) imaging of the striatum in MDD patients indicated alterations in transporters and receptors of dopamine and serotonin signaling.9,10 A transcriptome study of the striatum suggested that dysfunction of dopaminergic synapses, GABAergic synapses, and neurotransmitter synthesis is involved in the pathogenesis of chronic unpredictable mild stress (CUMS)-induced depression.11 It has also been reported that the use of deep brain stimulation in the striatum could reduce 50% of depression symptoms in patients with refractory depression.12 In addition, depression severity and the antidepressant effects of ketamine have been shown to depend on the structure and function of the striatum.10,13 Anhedonia is a core symptom of depression, and anhedonia severity was associated with volume reduction in the striatum,14 further highlighting the importance of this brain region. These preliminary findings suggest that the striatum plays a critical role in the pathogenesis of depression; however, the mechanism remains unclear.
Depression is a complex brain disease involving multiple brain regions. The cerebellum of depressed individuals shows obvious atrophy and volume reduction, and that stimulation targeting the cerebellum could reduce stress-induced depression-like behaviors.15 Chronic stress could reduce hippocampal synaptogenesis and increase hippocampal neuronal and glial atrophy in depressed patients and in animal models of depression.16 Moreover, the cerebellum and hippocampus also have strong interactions with the HPA axis, which makes them more vulnerable to stress and depression.17,18
Currently, studies have shown that metabolic changes are strongly associated with psychological and behavioral changes in depressed patients.19,20 Metabolomics, a powerful systematic biological analysis method, is widely used to capture the altered metabolites in various diseases and elucidate disease-specific biological regulatory mechanisms.21,22 Based on metabolomics technology, our previous studies found both a disturbance in energy metabolism in the cerebellum and a dysfunction of amino acid and lipid metabolism in the hippocampus of CUMS model rats.23,24 These preliminary findings suggest that depression involves metabolic alterations in multiple brain regions. However, previous studies have mostly focused on a single brain region, thus ignoring the systemic metabolic alterations that occur in multiple brain regions during the pathology of depression. It is therefore necessary to investigate the systemic alterations of metabolites and metabolic pathways in different brain regions.
In this study, a non-targeted GC/MS approach was performed on the striatum of depression-like rats induced by CUMS to reveal metabolic alterations and potential regulatory mechanisms. We also compared the striatal data with our previous data from the hippocampus24 and cerebellum25 of a CUMS model. We then focused specifically on the shared metabolites and metabolic pathways, and validated the relevant transporters/enzymes using real-time quantitative polymerase chain reaction (RT-qPCR). Our study will provide a new perspective for further understanding of the pathogenesis of depression.
Materials and Methods
Animals
Adult male Sprague–Dawley (SD) rats aged 6–7 weeks and weighing 210–230 g were purchased from Beijing Vital River Laboratory Animal Technology Co., Ltd. (Beijing, China). All rats were allowed to acclimatize to the environment for 5 weeks and were housed individually in the animal facility under ambient temperature (23 ± 1°C) and humidity (50% ± 5%), and under a 12 hrs light/dark cycle (lights on at 8:00, lights off at 20:00). All experimental procedures were approved by the Ethics Committee of Chongqing Medical University (approval number: 2017013) and adhered to both institutional guidelines and international policies (the National Institutes of Health Guidelines for Animal Research).
Chronic Mild Unpredictable Stress (CUMS) Procedure
The CUMS procedure was as described in our previous studies,24 with minor modifications. In brief, during the 5 weeks of acclimatization, all rats were trained to consume 1% sucrose solution until the sucrose preference (SP) of all rats was stable. All the experimental rats were then randomly divided into the non-stress control group (CON, n = 8) and CUMS group (CUMS, n = 8). Food and water were available ad libitum except during a 24 hrs food and water deprivation procedure. The CUMS procedure consisted of daytime darkness (3 hrs), damp sawdust (12 hrs), overnight illumination (12 hrs), 45° tilted cage (24 hrs), foot shock (1 mA, 110 v, 10 s), cold exposure (5 mins), restraint (3 hrs), food and water deprivation (24 hrs), tail clamp (1 mins), and paired housing (24 hrs). Rats in the CUMS group received two stressors at random per day for 4 weeks. The experimental schedule is shown in Figure 1A.
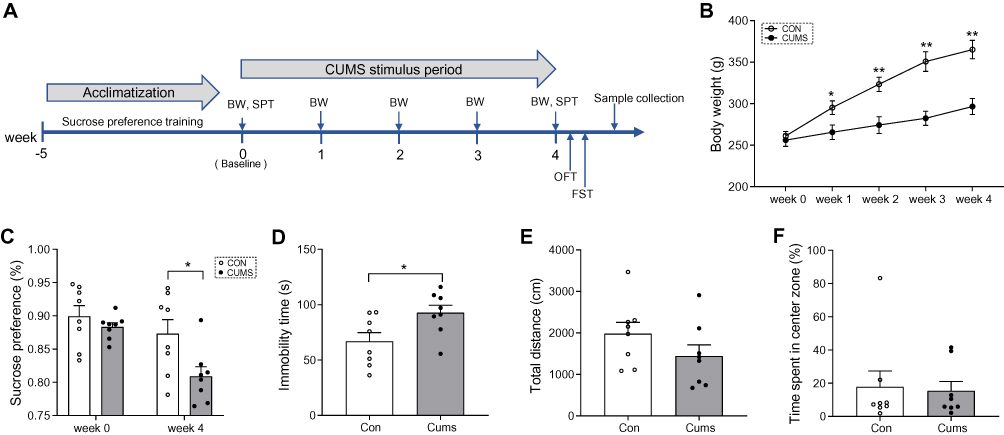 |
Figure 1 Behavioral and body weight results. (A) A simplified time schedule for the chronic unpredictable mild stress (CUMS) protocol. SPT, sucrose preference test. BW, body weight. OFT, open field test. FST, forced swimming test. (B) Bodyweight changes during CUMS stress. (C) Sucrose preference at baseline (day 0) and at week 4. (D) Immobility time in the FST at week 4. (E) Total distance travelled in the OFT at week 4. (F) Time spent in the center area at week 4. Data displayed as means ± standard error of the mean (SEM) (CUMS, n = 8; CON, n = 8), *P < 0.05, **P < 0.01. |
Behavioral Tests
The behavioral tests were the same as in our previous study.24 To minimize interference, the testing facility was cleaned after each test. Behavioral videos were analyzed using Ethovision 3.0 software (Noldus, Netherlands). The sucrose preference test (SPT) is most commonly used to evaluate anhedonia in animal models of depression. After 24 hrs water and food deprivation, rats received 1% sucrose solution and tap water for 1 hr. SPT results were estimated as sucrose consumption/(sucrose consumption + water consumption) × 100%. The open field test (OFT) was used to evaluate spatial exploration ability in depression animal model, and mimic the states of anxiety in depressed patients. In this test, rats were allowed to explore freely for 5 mins in an open field (100 cm × 100 cm × 40 cm). OFT results were evaluated as the total distance traveled and the time spent in a predefined center zone. The forced swimming test (FST) was used to evaluate behavioral despair or depression-like states in animals undergoing various stressors. All rats first underwent swim training for 15 mins. After 24 hrs, they were placed individually in a transparent Plexiglas cylinder (20 cm diameter, 50 cm high) filled with tap water (25 ± 2°C, 40 cm depth) and monitored for 5 mins. FST results were assessed as the immobility time, defined as the time spent floating on the surface of the water.
Sample Preparation
The procedures for sample pretreatment referred to previous studies.26,27 After behavioral tests, rats were sacrificed by decapitation. The whole bilateral striatum, hippocampus, and cerebellum tissues were rapidly dissected from the brain and randomly divided into two equal parts, which were then stored at –80°C until later analysis. Each rat’s brain tissue was analyzed separately in subsequent experiments. For GC/MS analysis of the striatum tissues (CUMS, n = 8; CON, n = 8), 30-mg striatum tissues were homogenized after adding 20 μl internal standard (L-3,4-Dichlorophenylalanine in methanol; 0.3 mg/mL) and 500 μl methanol-water-chloroform (chromatographic grade; 5:2:2, v/v/v). The mixture was extracted by ultrasonication (10 mins; ice bath), incubated for 30 mins at 4°C, and centrifuged (14,000 × g for 10 mins at 4°C). Subsequently, 300 μl of supernatant was transferred into derivative vials and evaporated to dryness in a speed-vacuum (Concentrator plus, Eppendorf, Hamburg, Germany), then resuspended with 80 μl methoxamine hydrochloride (15 mg/mL pyridine) and derivatized (90 mins; 37°C) with continuous shaking. After adding BSTFA with 1% TMCS and hexane, the mixture was left to react for 60 min at 70°C to form derivatives. After cooling to room temperature for 30 mins, the samples were used for GC/MS analysis.
GC/MS Analysis of Striatum Samples
The procedures essentially referred to previous studies.26,27 Briefly, each 1 μl of derivative sample was injected into an Agilent 7890A/5975C GC/MSD system (Agilent Technologies Inc., USA) with an injector temperature of 280°C. A HP-5MS capillary column (30 m × 0.25 mm × 0.25 m; Agilent) was utilized to separate the derivatives. The flow rate of helium carrier gas was set to 6.0 mL/min. The column temperature was initially maintained at 60°C for 2 mins, and then increased from 60°C to 310°C through four heating gradients (60°C to 125°C at 8°C/min; 125°C to 190°C at 10°C/min; 190 to 210°C at 4°C/min; 210°C to 310°C at 20°C/min, respectively), and finally maintained for 8.5 mins. The MS quadrupole temperature and the ion source temperature were set to 150°C and 230°C, respectively. The collision energy was 70 eV. Mass data were acquired in the full scan model from 50 to 600 m/z. Moreover, quality control (QC) samples were prepared by mixing aliquots of the all samples to be a pooled sample, and then analyzed using the same method with the analytic samples. The QCs were injected at regular intervals (every 8 samples) throughout the analytical run to provide a set of data from which repeatability can be assessed. A random order of continuous sample analysis was used to avoid the error resulting from instrument signal fluctuations.
GC/MS Data Analysis
The acquired raw MS files were analyzed by ChromaTOF software (v 4.34, LECO, St Joseph, MI). First, the raw MS data were simply screened by retention time and mass to charge ratio, and peak alignment is carried out. Then, the precise molecular weight of the compound is determined by the mass to charge ratio in the XIC plot, and the molecular formula is predicted according to the deviation of mass number and the information of adduct ions. The metabolites in the biological system were identified by matching with the fragment ions, collision energy, and other information of each compound in the Fiehn database. The raw chromatogram of QC sample is used to check whether there is any deviation in peak strength and retention time. The response intensity of sample mass peaks was firstly normalized by internal standard substance (L-3,4-Dichlorophenylalanine), and the expression values of each sample were once again normalized by sum of 10,000. Besides, the data quality and the detection stability were evaluated by Pearson correlation coefficient between QC samples, which was calculated based on the peak area value.
Principal component analysis (PCA) was used to observe the distributions of all samples and obtain a general overview of metabolic pattern changes. Partial least squares discriminant analysis (PLS-DA) was carried out to predict and separate the detected sample categories. The quality of the models is described by the R2X or R2Y and Q2Y values. R2X and R2Y (goodness of fit: percentage of variance explained by the model) and Q2Y (goodness of prediction: percentage of variance predicted after 7-fold cross validation) were considered to evaluate the validity of PLS-DA model. A 199-iteration permutation test and a typical 7-fold cross-validation were performed to determine the optimal number of principal components and to avoid model overfitting. A threshold of variable influence on projection (VIP), which describes the overall contribution of each variable to the model, was obtained from PLS-DA model. Next, the metabolites with VIP > 1 and P-values < 0.05 (Mann–Whitney U-tests) were defined as the significantly differential metabolites.
Biological Function Analysis of Differential Metabolites
The biological function of differential metabolites was further analyzed using Ingenuity Pathway Analysis (IPA; http://www.ingenuity.com) and MetaboAnalyst4.0.28 The altered canonical pathways and molecular networks were analyzed using IPA software. The molecular network score was based on a hypergeometric distribution and calculated using the Fisher exact test. The higher the score, the more molecules from experimental data set appear in the network. Enrichment analysis module and pathway analysis module in MetaboAnalyst4.0 were used to identify the significantly disturbed metabolite sets and metabolic pathways, respectively. “Hypergeometric tests” and “relative-betweenness centrality” were used for the overrepresentation analysis and the pathway topology analysis, respectively.
Real-Time Quantitative Polymerase Chain Reaction (RT-qPCR)
Total mRNA was extracted from the striatum, hippocampus, cerebellum of rats (CUMS, n = 5; CON, n = 5) using Trizol reagent (Invitrogen, CA, USA), respectively. The cDNA was synthesized from total RNA using a PrimeScript® RT Reagent Kit (Takara, RR047A, Japan). SYBR® Premix Ex Taq™ II (Takara, RR820A, Japan) was used for RT-qPCR reaction on a Light Cycler 96 System (Roche, Germany). RT-qPCR data were analyzed using the comparative CT method (2−ΔΔCT). The primers were designed using BLAST (https://blast.ncbi.nlm.nih.gov/Blast.cgi) and synthesized by Sangon Biotech (Shanghai) Co., Ltd.
Statistical Analysis
All statistical analyses were performed using SPSS 21.0 (IBM, New York, USA) or R software (version 3.5.1, R project). The normality of data was evaluated using the Kolmogorov–Smirnov test. The Student’s t-test or Mann–Whitney U-tests were used to analyze behavioral tests and gene expression between the two groups. The differences in metabolites between the two groups were preliminarily assessed using non-parametric Mann–Whitney U-tests. Bodyweight data were analyzed using a repeated measure analysis of variance (stress × time). Spearman’s rank correlation analysis was conducted among genes, metabolites, and depression-like behaviors. The results of behavioral tests and gene expression levels were expressed as the mean ± SEM. The significance level was set at P < 0.05 (two-tail).
Results
CUMS-Induced Depression-Like Behaviors
At baseline, there were no significant differences in body weight (Figure 1B) or sucrose preference (Figure 1C) between the two groups. During the consecutive 4 weeks of CUMS procedures, body weight was significantly lower in CUMS rats than in CON rats (F = 200.775, P < 0.001; Figure 1B). In the SPT, sucrose consumption in CUMS rats was significantly reduced compared with CON rats (t = 2.512, P = 0.025; Figure 1C), indicating anhedonia and depression-like behaviors in this model. In the FST, the immobility time of CUMS rats was longer than that of CON rats (t = −2.478, P = 0.027; Figure 1D), indicating despair and depression-like behaviors in this model. In contrast, in the OFT, the total distance traveled (t = 1.403, P = 0.182; Figure 1E) and the time spent in the center zone (t = 0.213, P = 0.834; Figure 1F) did not show a clear difference between the two groups, indicating no anxiety-related exploratory behaviors in this model. However, the bodyweight of CUMS rats was significantly lower than that of CON rats at the first week (t = −2.479, P = 0.027; Figure 1B), and this difference in weight widened as the experiment progressed. These data show that the CUMS procedure successfully induced depression-like behaviors, but no anxiety-related exploratory behaviors, in this study.
Identification of Differential Metabolites in the Striatum
A GC/MS-based metabolomic analysis was conducted using striatal tissue from 16 rats (n = 8 per group). A volcano plot of all detected metabolites is displayed in Figure 2A, with the red dots representing metabolites with P < 0.05. The PCA score plots showed obvious discrimination between the two groups (R2X = 0.664, Q2= 0.340; Figure 2B), representing the strong explanatory power of the data. The PLS-DA score plots revealed a clear separation in metabolic profiles between two groups (R2X = 0.481, R2Y = 0.957, Q2 = 0.875; Figure 2C), indicating good predictive ability of the model. The 200-iteration permutation tests showed that the PLS-DA model was valid and stable (R2 = (0; 0.596), Q2 = (0; −0.066); Figure 2D). A total of 22 differential metabolites (VIP > 1 and P < 0.05) were identified in the striatum between CUMS and CON group, and these differential metabolites were mainly involved in amino acid, carbohydrate, and nucleotide metabolism (Table 1). Compared with CON rats, 13 differential metabolites were significantly upregulated and 9 differential metabolites were downregulated in CUMS rats (Figure 2E).
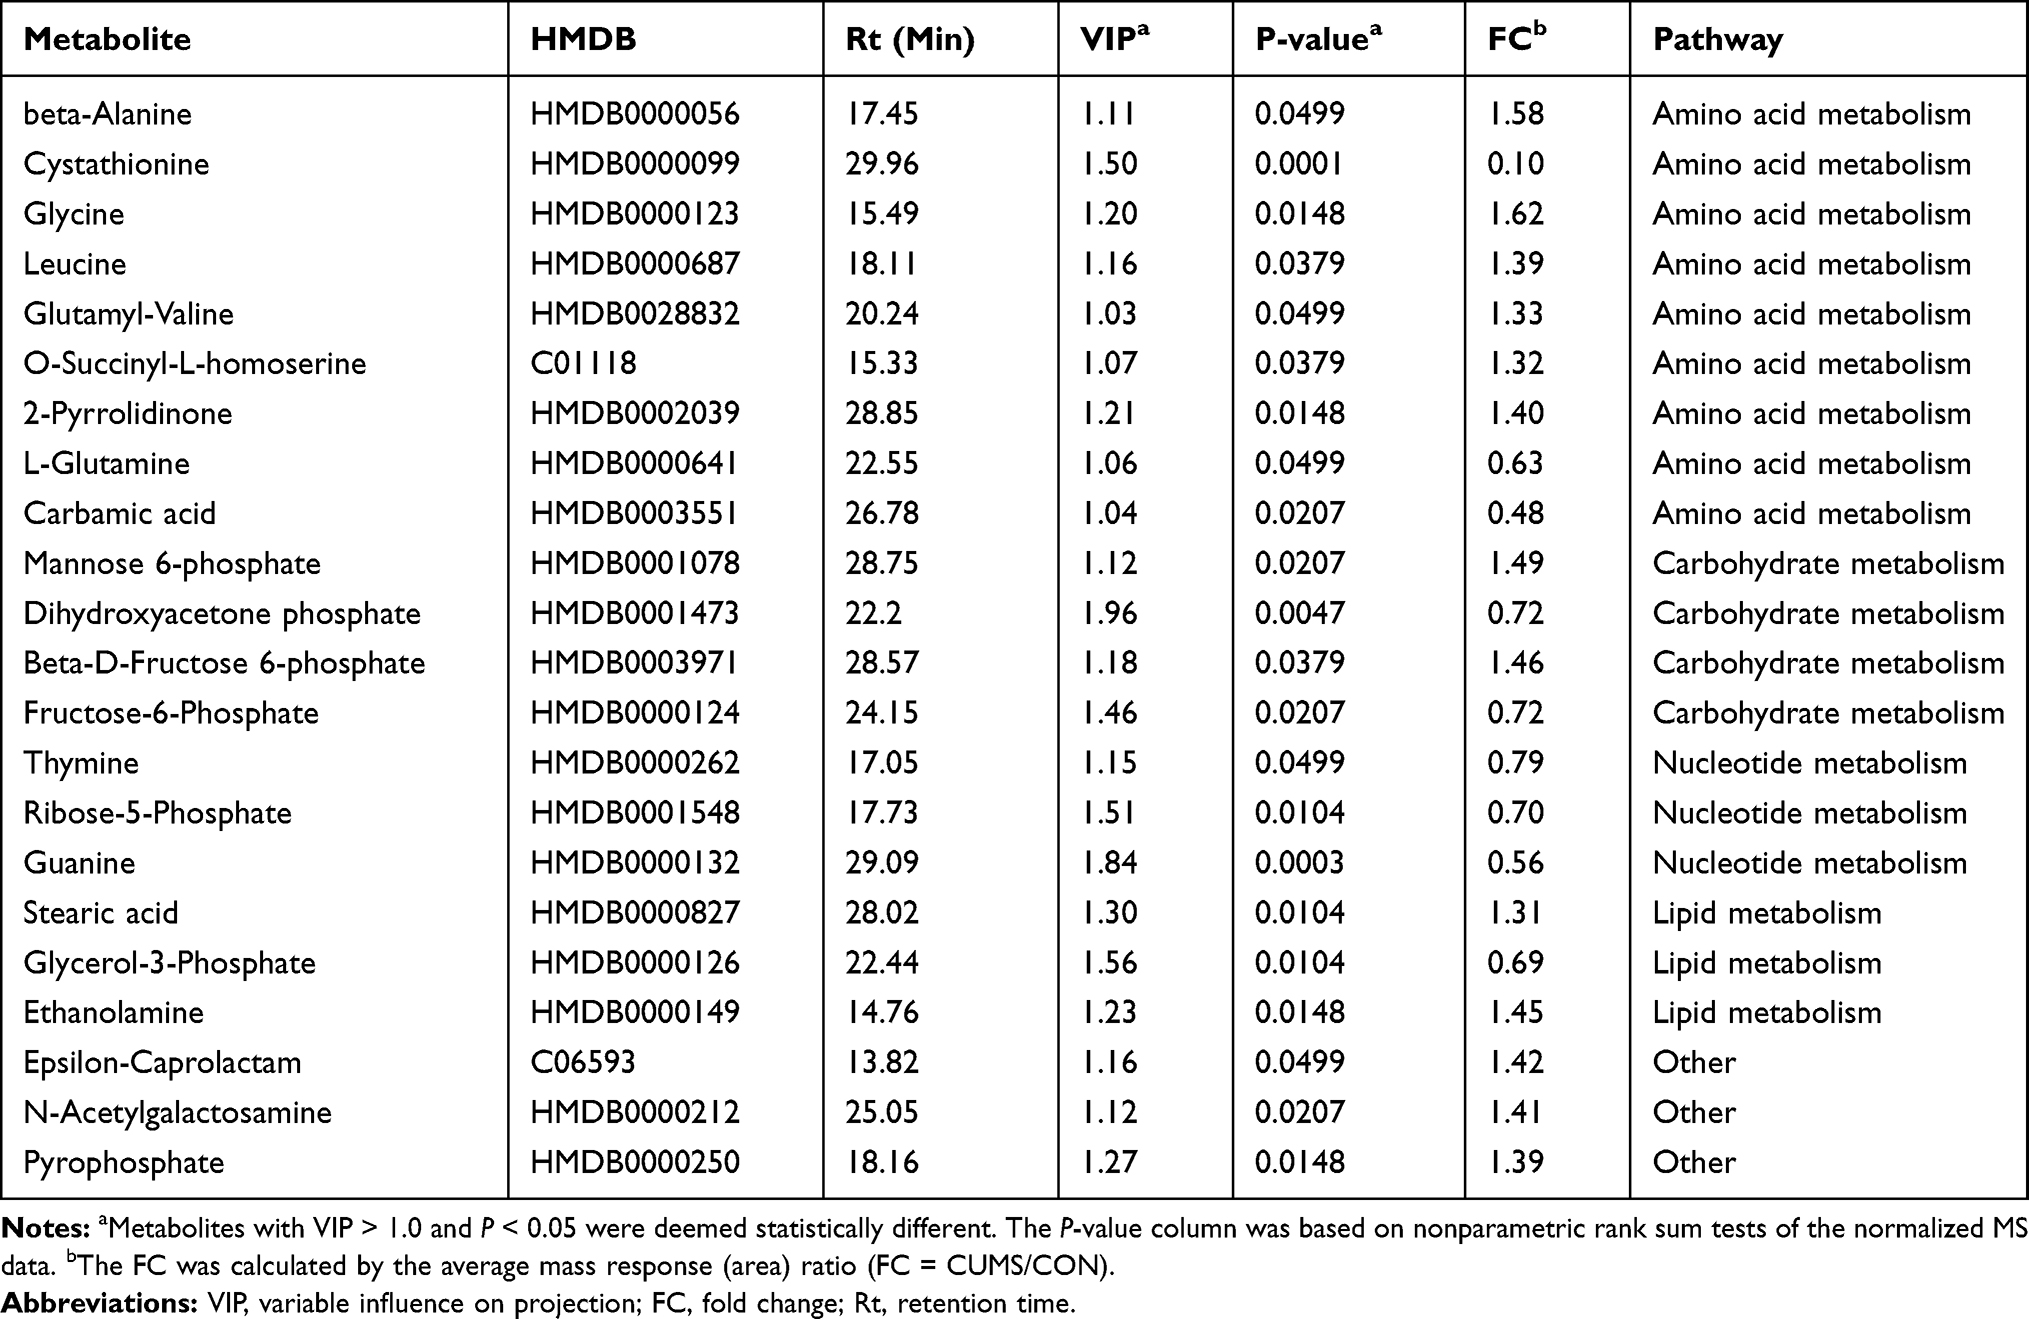 |
Table 1 Differential Metabolites in the Striatum Between the Chronic Unpredictable Mild Stress (CUMS) and Control (CON) Groups |
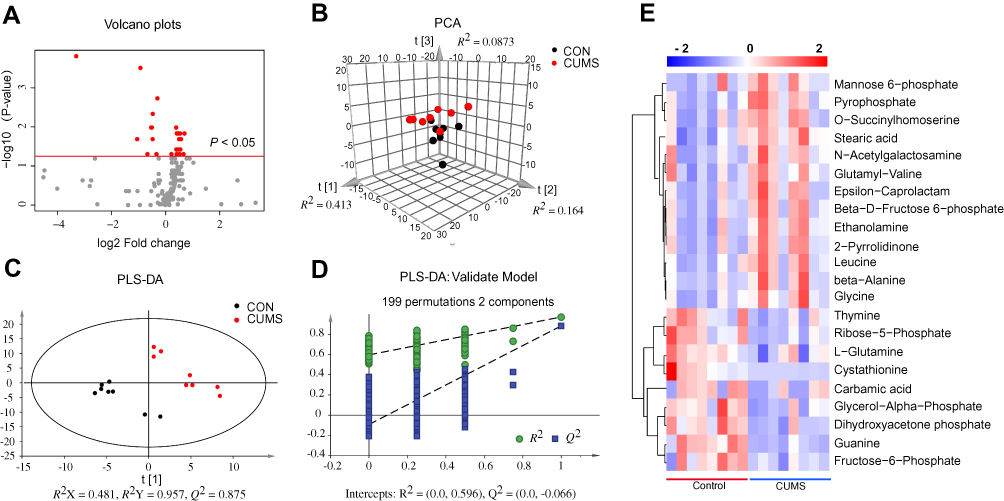 |
Figure 2 Identification of differential metabolites in the striatum. (A) Volcano plots of all detected metabolites. Red represents metabolites with P < 0.05. (B) The principal component analysis (PCA) score plot of all detected metabolites. (C) Partial least squares discriminant analysis (PLS-DA) score plots of all detected metabolites. (D) 199-iteration permutation plot for the PLS-DA model. The values of R2 and Q2 (bottom left) were lower than the corresponding original R2 and Q2 values (top right), suggesting that PLS-DA model was valid. (E) The heatmap visualization was constructed based on the differential metabolites in the striatum (P < 0.05 and VIP > 1). Red indicates upregulation and blue indicates downregulation. Rows represent metabolites and columns represent samples. |
Comparative Analysis of the Differential Metabolites in the Striatum, Hippocampus, and Cerebellum
To further understand the commonalities and differences of metabolite disturbances in different brain regions of the CUMS model, we compared the current data from the striatum with our previous metabolomic data from the hippocampus24 and cerebellum25 of CUMS model rats. The overview of differential metabolites from the three brain regions is shown in Figure 3A. L-glutamine was the only overlapping differential metabolite in the striatum, hippocampus, and cerebellum (Figure 3B), and was significantly down-regulated.
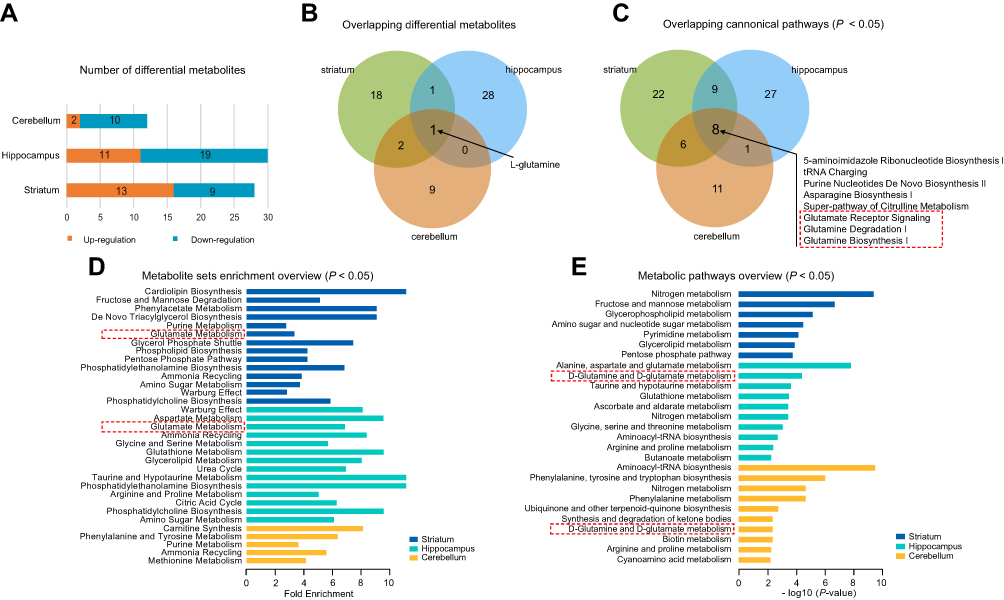 |
Figure 3 Comparative analysis of the differential metabolites in different brain regions. (A) The number of differential metabolites in three tissue types in chronic unpredictable mild stress (CUMS) rats compared with controls. (B) Venn diagram of the differential metabolites in the three tissues. (C) Venn diagram of the differential canonical pathways of the three tissues. The canonical pathways (P < 0.05) of each tissue from IPA were used. The dotted box represents the pathways that we were interested in. (D) The results of metabolite set enrichment analyses of the three tissues using MetaboAnalyst 4.0 (P < 0.05). The dotted box represents the enrichment of glutamate metabolite sets, further supporting IPA results. (E) The results of metabolic pathway analyses of the three tissues using MetaboAnalyst 4.0 (P < 0.05). The dotted box represents glutamine metabolic pathways, further supporting IPA results. |
Next, we performed pathway and molecular network analyses using IPA, and the results showed that eight shared pathways were significantly disturbed in the striatum, hippocampus, and cerebellum (Figure 3C). These eight shared pathways were all associated with L-glutamine; for example, glutamate receptor signaling, glutamine degradation I, and glutamine biosynthesis I. “Developmental Disorder, Hereditary Disorder, Metabolic Disease” was the significantly disturbed molecular network in the striatum and cerebellum, with a score of 38 and 29, respectively. “Hereditary Disorder, Neurological Disease, Organismal Injury and Abnormalities” was the disturbed molecular network in the hippocampus, with a score of 38. These significantly disrupted molecular networks all involved L-glutamine.
We also conducted enrichment metabolite sets and pathway analyses using MetaboAnalyst4.0. Enriched metabolite sets (Figure 3D) and metabolic pathways (Figure 3E) also showed that glutamate and glutamine metabolism was significantly altered in these three brain regions. These findings showed an important role of the glutamate system in CUMS-induced depression-like behaviors, which further supports previous researches that glutamate receptors are potential therapeutic targets for depression.29,30 Therefore, we speculated that the combined effects of dysregulation of the glutamate system in multiple brain regions might be the key to the pathogenesis of depression. Besides, to better understand the interactive relationships between the differential metabolites of the three studied brain regions, we constructed a simplified pathway diagram (Figure 4).
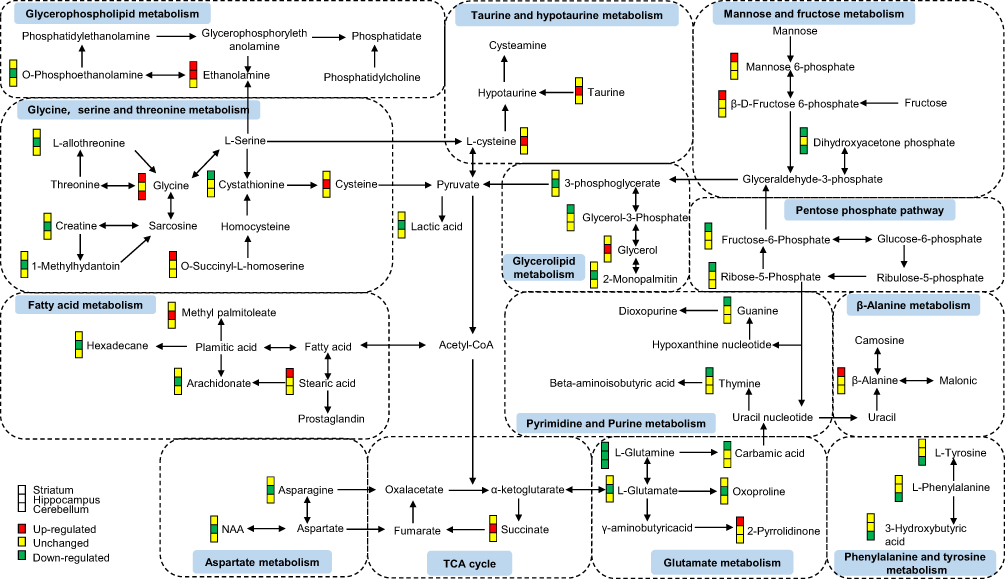 |
Figure 4 A simplified interaction diagram of the differential metabolites in the striatum, hippocampus, and cerebellum. Dotted frames represent the significantly altered Kyoto Encyclopedia of Genes and Genomes (KEGG) pathways. The small colored squares represent the striatum, hippocampus, and cerebellum, respectively, from top to bottom. Red indicates a significant upregulation, yellow indicates no change, and green indicates a significant downregulation. |
RT-qPCR for Glutamate Metabolic System Related Gene Changes in the Striatum, Hippocampus, and Cerebellum
As mentioned above, the significant disruption of glutamate metabolic system might play an important role in CUMS-induced depression-like behaviors, and thus, we evaluated the effects of chronic stress on the key enzymes or transporters involved in the glutamine–glutamate–GABA (Gln–Glu–GABA) cycle using RT-qPCR. Based on the Kyoto Encyclopedia of Genes and Genomes (KEGG) metabolic pathway, a simplified diagram of the Gln–Glu–GABA cycle in the brain was constructed (Figure 5A). The relative expression levels of GS (P = 0.002, Figure 5B), SSADH (P = 0.030, Figure 5C), GLS2 (P = 0.002, Figure 5E), and GLT1 (for SLC1a2) (P = 0.022, Figure 5I) were significantly decreased in the striatum of CUMS rats compared with CON rats. The relative expression levels of GS (P = 0.010, Figure 5B), SSADH (P = 0.011, Figure 5C), 4-ABAT (P = 0.008, Figure 5D), SNAT1 (for SLC38a1) (P = 0.044, Figure 5F), VGAT (for SLC32a1) (P = 0.014, Figure 5G), and GAD1 (P = 0.033, Figure 5H) in the hippocampus of CUMS rats were also significantly lower than those of CON rats. Furthermore, the relative expression levels of GS (P = 0.022, Figure 5B), 4-ABAT (P = 0.024, Figure 5D), SNAT1 (P = 0.034, Figure 5F), VGAT (P = 0.016, Figure 5G), and GDH (P = 0.020, Figure 5J) were significantly altered in the cerebellum of CUMS rats. Other crucial transporters or enzymes (SNAT2, SNAT3, SNAT5, GAD2, GAT2, GAT3) involved in Gln–Glu–GABA cycle were found no significant difference. These data further supported the results of metabolomics analysis that CUMS induced the dysregulation of the Gln–Glu–GABA cycle in the striatum, hippocampus, and cerebellum. The sequences of all primers used are listed in Table 2
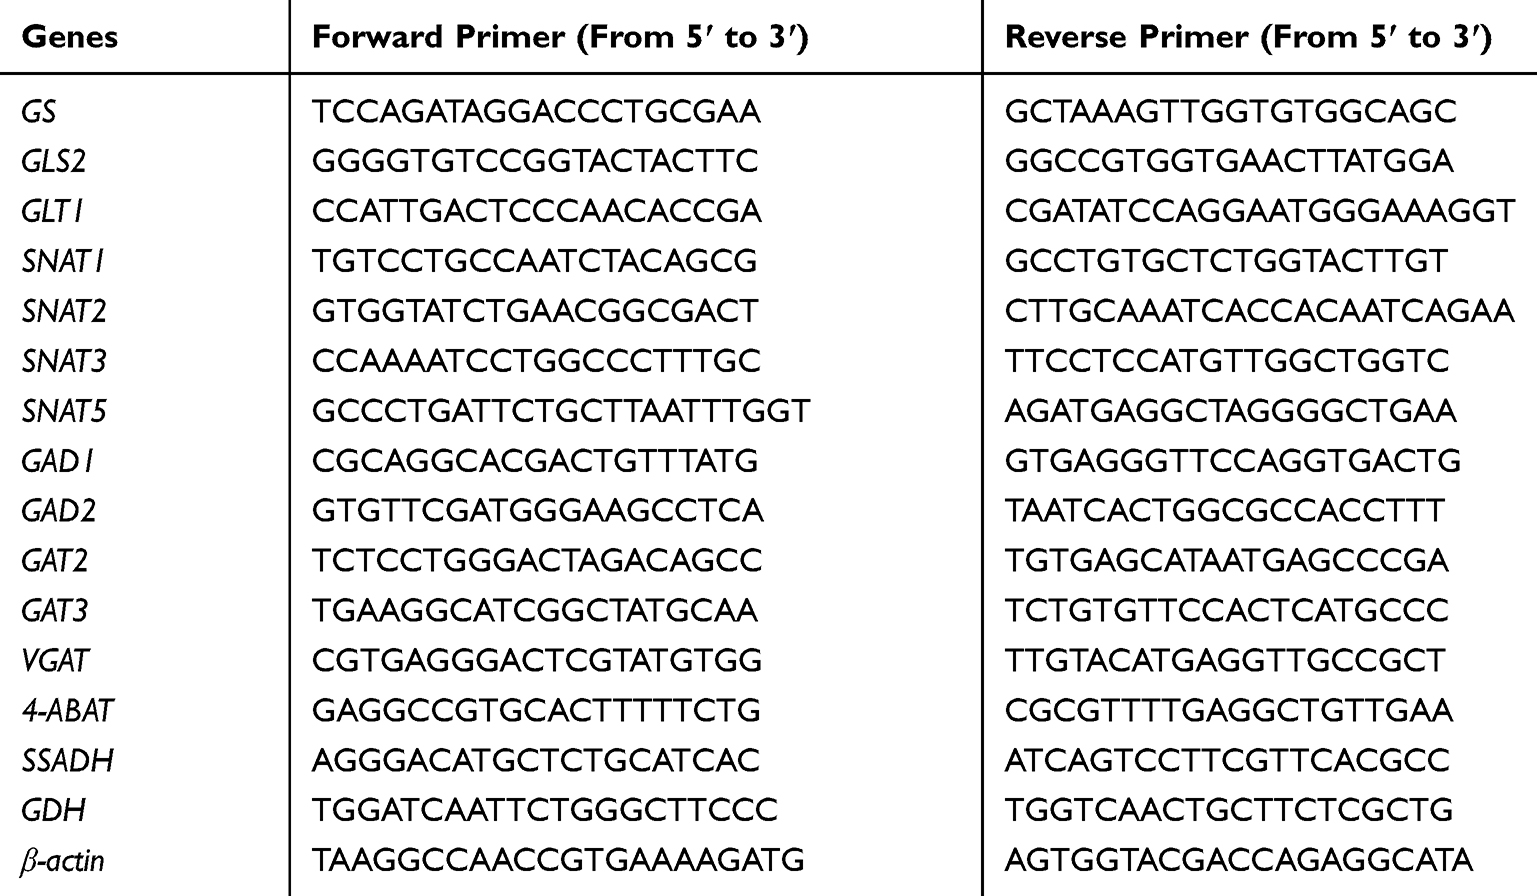 |
Table 2 Primer Sequences Used for Real-Time Quantitative Polymerase Chain Reaction (RT-qPCR) |
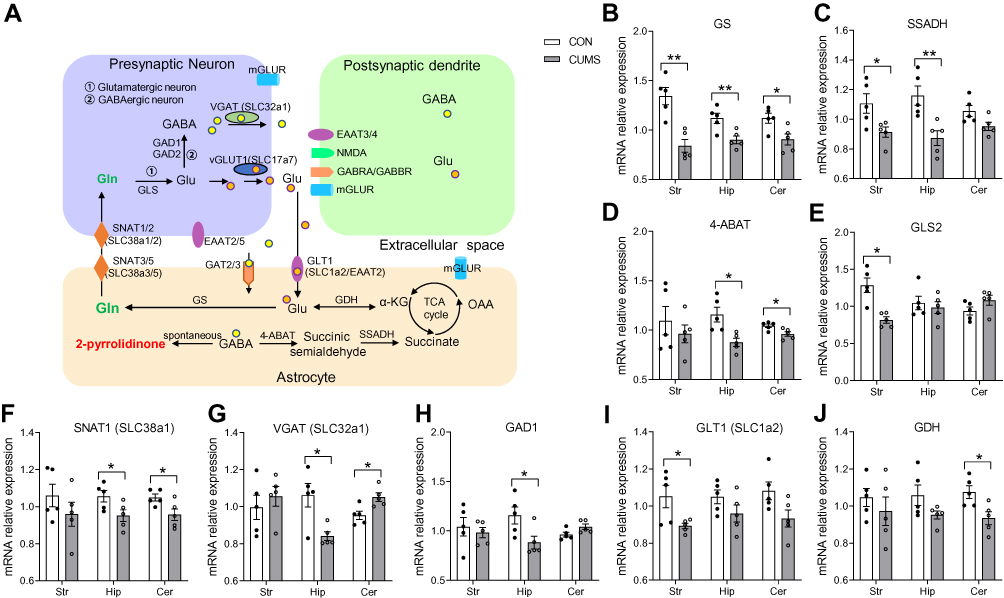 |
Figure 5 The expression levels of Gln–Glu–GABA cycle-related key transporters or enzymes in the striatum, hippocampus, and cerebellum. (A) A simplified schematic of the Gln–Glu–GABA cycle in the brain. (B–J) The expression levels of Gln–Glu–GABA cycle-related key transporters or enzymes. Data are displayed as mean ± standard error of the mean (SEM) (n = 5 per group), *P < 0.05, **P < 0.01. Abbreviations: GLT1 (for SLC1a2), glutamate transporter 1; Glu, glutamate; Gln, glutamine; GS, glutamine synthetase; GLS, glutaminase; SNAT (for SLC38a), sodium-coupled neutral amino acid transporter; mGLUR, metabotropic glutamate receptors; vGLUT1 (for SLC17a7), vesicular glutamate transporter-1; GAD, glutamic acid decarboxylases; GABA, γ-aminobutyric acid; GABRA, γ-aminobutyric acid A receptor; NMDA, N-methyl-D-aspartic acid receptor; α-KG, alpha-ketoglutaric acid; TCA, the tricarboxylic acid cycle; GDH, glutamate dehydrogenase; OAA, oxaloacetic acid; GAT, GABA transporter; 4-ABAT, 4-aminobutyric acid transaminase; SSADH, succinate-semialdehyde dehydrogenase; VGAT (for SLC32a1), vesicular GABA transporter. |
Correlation Analysis Among Genes, Metabolites, and Depression-Like Behaviors
To assess the relationships between differential metabolites in the striatum and depression-like behaviors (SPT and FST results), Spearman’s rank correlation analysis was performed. We observed that the level of guanine was significantly positively correlated with sucrose preference, and the levels of ethanolamine, cystathionine, and 2-pyrrolidinone were significantly correlated with immobility time (Figure 6A).
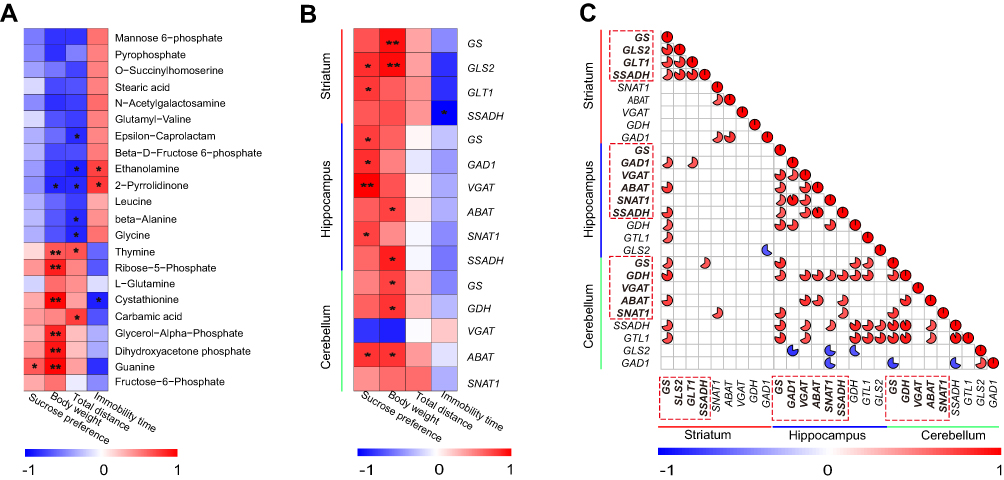 |
Figure 6 Spearman correlation analysis among genes, differential metabolites, and depression-like behaviors. (A) Correlation analysis between differential metabolites in the striatum and depression-like behaviors (n = 8 per group), *P < 0.05, **P < 0.01. (B) Correlation analysis between depression-like behaviors and significantly differential genes in the striatum, hippocampus, and cerebellum (n = 5 per group), *P < 0.05, **P < 0.01. (C) Correlation analysis of differential genes between the striatum, hippocampus, and cerebellum (n = 5 per group). Dotted frames represent genes with significantly altered expressions in the striatum, hippocampus, and cerebellum, respectively. The color intensity represents the degree of correlation. Red represents a positive correlation and blue represents a negative correlation. The size of the pie represents the absolute value of the correlation coefficient. The blanks indicate that a correlation was not significant. |
Next, we also explored the correlation between depression-like behaviors (SPT and FST results) and significantly altered gene expressions in the striatum, hippocampus, and cerebellum. Correlation analyses showed differential genes in the striatum (GLS2 and GLT1), hippocampus (GS, GAD1, VGAT, and SNAT1), and cerebellum (ABAT) were also significantly positively correlated with sucrose preference. The level of SSADH in the striatum was significantly negatively correlated with immobility time (Figure 6B).
Moreover, we further investigated whether the above differential genes involved in the Gln–Glu–GABA cycle are correlated with each other among the striatum, hippocampus, and cerebellum (Figure 6C). GS in striatum was correlated with GAD1, ABAT, and SSADH in hippocampus. GS in striatum was correlated with GS, GDH, and ABAT in cerebellum. GDH in cerebellum was correlated with GS, VGAT, ABAT, SNAT1, and SSADH in hippocampus. In addition, ABAT in cerebellum was also correlated with VGAT, ABAT, and SSADH in hippocampus.
Discussion
In this study, we performed a non-targeted GC/MS-based metabolomic analysis of the striatum, and the differential metabolites were mainly involved in amino acid, carbohydrate, and nucleotide metabolism. Furthermore, comparing the data from the striatum with our previous metabolomics results from the hippocampus and cerebellum of a CUMS model, we focused on the shared glutamine–glutamate metabolic system pathways. The mRNA expression of Gln–Glu–GABA cycle-related transporters or enzymes were significantly altered in the striatum, hippocampus, and cerebellum.
Increasing data support the hypothesis that disturbances in carbohydrate metabolism are involved in the pathogenesis of depression.31,32 In the present study, mannose 6-phosphate and beta-D-fructose-6-phosphate involving in the mannose metabolism pathway had significantly altered in the striatum. Furthermore, fructose-6-phosphate and ribose-5-phosphate, the pentose phosphate pathway intermediates were also significantly reduced in the striatum. The pentose phosphate pathway is critical for the formation of purine, pyrimidine, and NADPH. In the central nervous system, NADPH is mostly involved in the regeneration of reduced glutathione and neurosteroids, as well as in the metabolism of neurotransmitters. We also found that thymine, guanine, and carbamic acid levels were significantly decreased in the striatum. Purine and pyrimidine metabolism have been associated with neuropsychiatric disorders33 and antidepressant treatment response.34 Hence, carbohydrate metabolism and nucleotide metabolism might play a critical role in the development of depression, although their mechanism remains to be further confirmed.
Amino acid metabolism disturbance also has the potential to contribute to the pathogenesis of depression.26,35 In the present study, glycine, beta-alanine, leucine, 2-pyrrolidinone, and ethanolamine levels were upregulated in the striatum. Ethanolamine is a precursor of phosphatidylethanolamine (PE), and PE specifically inhibits mitochondrial oxidative metabolism.36 Thus, an impairment in neurodevelopment and synaptic plasticity caused by mitochondrial dysfunction may also be a possible pathogenic mechanism of depression.37,38 Glycine and beta-alanine are small molecule inhibitory neurotransmitters,39 and excessive accumulation may mediate neurotoxicity and apoptosis.40 Leucine, a branched amino acid, has been reported in depressed patients and in animal models of depression.41,42 Elevated levels of leucine may suggest that the release of brain serotonin is disturbed43 and glutamate homeostasis is impaired.44 Therefore, alterations in these amino acids in the striatum may have contributed to the generation of depression-like behaviors in CUMS rats in the present study.
Four genes in the striatum (GS, GLS2, GLT1, and SSADH), six genes in the hippocampus (SNAT1, GAD1, GS, SSADH, VGAT, and ABAT) and four genes in the cerebellum (GS, ABAT, SNAT1, and GDH) were significantly downregulated, and one gene in the cerebellum (VGAT) was upregulated in CUMS rats. GLT1 is the predominant glutamate transporter in astrocytes,45 and down-regulation of GLT1 might lead to a decrease in glutamate uptake. GLT1 reduction could affect glutamatergic signaling and is potentially neurotoxic.46 Blockade of GLT1 can induce depression-like behaviors, while overexpression of GLT1 can produce antidepressant effects.47,48 Decreases in GLT-1 and GS mRNA expression in our study represented decreases of glutamate clearance and glutamine synthesis in astrocytes after CUMS, which further supports our finding that L-glutamine was significantly downregulated. In the brain, L-glutamine is the most abundant amino acid in both glutamatergic and GABAergic neurons.49 L-glutamine reduction has been consistently reported in patients with depression,50,51 and L-glutamine supplementation showed antidepressant properties on patients with depression.52 SNAT1 serves as a system A transporter localized in neurons, which prefers L-glutamine released by astrocytes.53 A recent publication reported that SNAT1 knock-out mice showed reduced formation of GABA, reduced vesicular content of GABA and reduced synaptic plasticity.54 Thus, the decreased SNAT1 in our study may thus result in less L-glutamine influx into neurons and excessive weaken GABA synthesis. Currently, the role of L-glutamine transporters in relationship to depression-like behaviors and chronic stress is known little. Future studies will focus on Gln-Glu transfer on mediating depression-like behaviors in our team. Consistent with our findings, down-regulations of VGAT and GAD1 mRNA expression in the hippocampus after CUMS have been reported in previous studies.55 Moreover, the reduction of GAD1 was also found in patients with depression.56,57 We hypothesize that the reduction in GAD1 and VGAT may lead to a decrease in GABA synthesis and release, thus affecting GABAergic neurotransmission.
In addition, ABAT deficiency can cause the accumulation of GABA, 2-pyrrolidinone, and beta-alanine,58 while SSADH reduction is also associated with elevated brain GABA levels.59 2-pyrrolidinone is an indicator of shunted GABA metabolism, and accumulation of GABA can result in elevated levels of 2-pyrrolidinone.60,61 In the present study, a SSADH reduction in the striatum supported the elevation of 2-pyrrolidinone and beta-alanine, suggesting GABA accumulation. Moreover, correlation analyses also showed that 2-pyrrolidinone were significantly correlated with depression-like behaviors, which deserves more research attention. A recent study showed that depressed youth had higher striatal GABA levels,62 suggesting that higher striatal GABA may be another psychopathological feature of depression. However, no significant change in GABA was observed in this study, which may be due to the duration and sensitivity response to stress, as well as a relatively short half-life. Thus, future studies characterizing the Gln–Glu–GABA cycle-related metabolic disturbances in a target manner, are also needed.
These data showed that CUMS stress might induce depression-like behaviors by disturbing transporters or enzymes located in GABAergic neurons or astrocytes, which support the hypothesis that major changes in the GABAergic system induced by stress could cause abnormal behavioral and synaptic responses.63 Interestingly, except for GLT-1, most of the changes involve GABAergic neurotransmission and metabolism. Here, in astrocytes, GS catalyzes synthesis of glutamine, which is transported into GABAergic neurons by transporters SNAT1. In GABAergic neurons, GLS2 and GAD1 catalyze synthesis of GABA which is translocated into synaptic vesicles by VGAT. Besides, 4-ABAT, SSADH, and GDH are all involved in GABA metabolism in astrocytes. We speculated that CUMS stress might have a potential compensation in astrocyte processes (ABAT, SSADH) while affecting the GABAergic signaling pathway (GS, SNAT1, GAD1, VGAT, ABAT, SSADH). Correlation analyses showed that differential genes in the striatum (GLS2, GLT1, and SSADH), hippocampus (GS, GAD1, VGAT, and SNAT1), and cerebellum (ABAT) were also significantly correlated with depression-like behaviors. We also found a significant correlation of differential genes between the striatum, hippocampus, and cerebellum, suggesting that the Gln–Glu–GABA cycle might generate a strong cooperation among these three brain regions in response to chronic stress. The cooperation of the Gln–Glu–GABA-cycle among these three brain regions should be further explored to clarify the coordinated regulation mechanism and the roles in the development of depression.
Depression is a complex mental illness and involves many complex pathology mechanisms. Previous adverse stress is well-established vulnerability factor for depression. The body’s neuroendocrine response to stress is mediated by the hypothalamic-pituitary-adrenal (HPA) axis, and the activity of the HPA axis is strictly controlled by GABAergic signaling.64 Thus, GABAergic signaling is essential for the control of stress and impaired by chronic stress. In fact, deficits in neurosteroids and GABA have been observed in depression patients,64 further supporting a role for GABAergic signals in depression. What is worth mentioning, in spite of remarkable progress, we are still left with some significant gaps in understanding. The dysfunction of GABAergic signaling is not unique to depression, but is similarly associated with many other neuropsychiatric diseases, especially schizophrenia.65,66 Besides, the “serotonergic system hypothesis” of depression has been proposed, implicating tryptophan dysfunction in the underlying neuropathology of depression. An interesting previous study showed that selective serotonin reuptake inhibitor (SSRI) treatment of depressed individuals is implicated in increased GABA levels,67 implying a common mechanism of antidepressant action. Serotonin is synthesized from tryptophan in the brainstem and pons. However, no significant change in tryptophan or serotonin was observed in this study, which may be due to the duration and sensitivity response to stress. Thus, future studies with other targeted methods are required to validate and extend our current findings.
In our study, several limitations should be noted. First, a relatively small sample size might restrict the interpretation of our results. Second, our results reflect metabolic alterations in the entire striatum, and possibly overlook unique metabolic patterns and pathogenic mechanisms in subregions of the striatum. Third, to obtain more information about metabolism, we did not correct multiple analyses using Benjamini–Hochberg (BH) procedure in this study. This means that the interpretation of some results may be limited. Fourthly, we only used RT-qPCR to evaluate the expression levels of the relevant enzymes or transporters involved in the Gln–Glu–GABA cycle. Therefore, in future research, we will use other targeted methods (e.g. Western blotting) and large samples to confirm our findings.
Conclusions
Metabolic disorders of the striatum caused by chronic stress were mainly involved in amino acid, carbohydrate, and nucleotide metabolism. CUMS stress disturbed the Gln–Glu–GABA cycle in the striatum, hippocampus, and cerebellum, and the Gln–Glu–GABA cycles in these three brain regions might generate cooperative action in response to chronic stress. Future studies focusing on the role of Gln–Glu–GABA cycle-related transporters or enzymes in the pathogenesis of depression will be of great interest.
Acknowledgments
This work was supported by the National Key R&D Program of China (Grant No. 2017YFA0505700), the Non-profit Central Research Institute Fund of Chinese Academy of Medical Sciences (No. 2019PT320002), the National Natural Science Foundation of China (Grant No. 81901398) and the Natural Science Foundation of Chongqing, China (Grant No. cstc2019jcyj-msxmX0025).
Disclosure
The authors declare that they have no conflicts of interest.
References
1. Kupfer DJ, Frank E, Phillips ML. Major depressive disorder: new clinical, neurobiological, and treatment perspectives. Lancet. 2012;379(9820):1045–1055. doi:10.1016/S0140-6736(11)60602-8
2. Wang W, Guo H, Zhang SX, et al. Targeted metabolomic pathway analysis and validation revealed glutamatergic disorder in the prefrontal cortex among the chronic social defeat stress mice model of depression. J Proteome Res. 2016;15(10):3784–3792.
3. Phillips LJ, McGorry PD, Garner B, et al. Stress, the hippocampus and the hypothalamic-pituitary-adrenal axis: implications for the development of psychotic disorders. Aust N Z J Psychiatry. 2006;40(9):725–741. doi:10.1080/j.1440-1614.2006.01877.x
4. Peng J, Liu J, Nie B, et al. Cerebral and cerebellar gray matter reduction in first-episode patients with major depressive disorder: a voxel-based morphometry study. Eur J Radiol. 2011;80(2):395–399. doi:10.1016/j.ejrad.2010.04.006
5. Ruhe HG, Mason NS, Schene AH. Mood is indirectly related to serotonin, norepinephrine and dopamine levels in humans: a meta-analysis of monoamine depletion studies. Mol Psychiatry. 2007;12(4):331–359. doi:10.1038/sj.mp.4001949
6. Zhang H, Li L, Wu M, et al. Brain gray matter alterations in first episodes of depression: a meta-analysis of whole-brain studies. Neurosci Biobehav Rev. 2016;60:43–50. doi:10.1016/j.neubiorev.2015.10.011
7. Dietsche B, Kircher T, Falkenberg I. Structural brain changes in schizophrenia at different stages of the illness: a selective review of longitudinal magnetic resonance imaging studies. Aust N Z J Psychiatry. 2017;51(5):500–508. doi:10.1177/0004867417699473
8. Pacifico R, Davis RL. Transcriptome sequencing implicates dorsal striatum-specific gene network, immune response and energy metabolism pathways in bipolar disorder. Mol Psychiatry. 2017;22(3):441–449. doi:10.1038/mp.2016.94
9. Cannon DM, Klaver JM, Peck SA, Rallis-Voak D, Erickson K, Drevets WC. Dopamine type-1 receptor binding in major depressive disorder assessed using positron emission tomography and [11C]NNC-112. Neuropsychopharmacology. 2009;34(5):1277–1287. doi:10.1038/npp.2008.194
10. Murrough JW, Henry S, Hu J, et al. Reduced ventral striatal/ventral pallidal serotonin1B receptor binding potential in major depressive disorder. Psychopharmacology (Berl). 2011;213(2–3):547–553. doi:10.1007/s00213-010-1881-0
11. Ma K, Zhang H, Wei G, et al. Identification of key genes, pathways, and miRNA/mRNA regulatory networks of CUMS-induced depression in nucleus accumbens by integrated bioinformatics analysis. Neuropsychiatr Dis Treat. 2019;15:685–700.
12. Bewernick BH, Hurlemann R, Matusch A, et al. Nucleus accumbens deep brain stimulation decreases ratings of depression and anxiety in treatment-resistant depression. Biol Psychiatry. 2010;67(2):110–116. doi:10.1016/j.biopsych.2009.09.013
13. Kaiser RH, Andrews-Hanna JR, Wager TD, Pizzagalli DA. Large-scale network dysfunction in major depressive disorder: a meta-analysis of resting-state functional connectivity. JAMA Psychiatry. 2015;72(6):603–611. doi:10.1001/jamapsychiatry.2015.0071
14. Harvey PO, Pruessner J, Czechowska Y, Lepage M. Individual differences in trait anhedonia: a structural and functional magnetic resonance imaging study in non-clinical subjects. Mol Psychiatry. 2007;12(8):703, 767–775.
15. Bambico FR, Comai S, Diwan M, et al. High frequency stimulation of the anterior vermis modulates behavioural response to chronic stress: involvement of the prefrontal cortex and dorsal raphe? Neurobiol Dis. 2018;116:166–178. doi:10.1016/j.nbd.2018.03.011
16. Pittenger C, Duman RS. Stress, depression, and neuroplasticity: a convergence of mechanisms. Neuropsychopharmacology. 2008;33(1):88–109. doi:10.1038/sj.npp.1301574
17. Ito M. Cerebellar circuitry as a neuronal machine. Prog Neurobiol. 2006;78(3–5):272–303. doi:10.1016/j.pneurobio.2006.02.006
18. Liu W, Ge T, Leng Y, et al. The role of neural plasticity in depression: from hippocampus to prefrontal cortex. Neural Plast. 2017;2017:6871089. doi:10.1155/2017/6871089
19. Krishnan V, Nestler EJ. The molecular neurobiology of depression. Nature. 2008;455(7215):894–902. doi:10.1038/nature07455
20. Zheng P, Wang Y, Chen L, et al. Identification and validation of urinary metabolite biomarkers for major depressive disorder. Mol Cell Proteomics. 2013;12(1):207–214. doi:10.1074/mcp.M112.021816
21. Nicholson JK, Lindon JC. Systems biology: metabonomics. Nature. 2008;455(7216):1054–1056. doi:10.1038/4551054a
22. Sreekumar A, Poisson LM, Rajendiran TM, et al. Metabolomic profiles delineate potential role for sarcosine in prostate cancer progression. Nature. 2009;457(7231):910–914. doi:10.1038/nature07762
23. Shao WH, Chen JJ, Fan SH, et al. Combined metabolomics and proteomics analysis of major depression in an animal model: perturbed energy metabolism in the chronic mild stressed rat cerebellum. OMICS. 2015;19(7):383–392. doi:10.1089/omi.2014.0164
24. Zhang Y, Yuan S, Pu J, et al. Integrated metabolomics and proteomics analysis of hippocampus in a rat model of depression. Neuroscience. 2018;371:207–220. doi:10.1016/j.neuroscience.2017.12.001
25. Shao W-H, Fan S-H, Lei Y, et al. Metabolomic identification of molecular changes associated with stress resilience in the chronic mild stress rat model of depression. Metabolomics. 2012;9(2):433–443. doi:10.1007/s11306-012-0460-2
26. Zhou X, Liu L, Zhang Y, et al. Metabolomics identifies perturbations in amino acid metabolism in the prefrontal cortex of the learned helplessness rat model of depression. Neuroscience. 2017;343:1–9. doi:10.1016/j.neuroscience.2016.11.038
27. Kanani H, Chrysanthopoulos PK, Klapa MI. Standardizing GC-MS metabolomics. J Chromatogr B Analyt Technol Biomed Life Sci. 2008;871(2):191–201. doi:10.1016/j.jchromb.2008.04.049
28. Chong J, Soufan O, Li C, et al. MetaboAnalyst 4.0: towards more transparent and integrative metabolomics analysis. Nucleic Acids Res. 2018;46(W1):W486–W494. doi:10.1093/nar/gky310
29. Shin S, Kwon O, Kang JI, et al. mGluR5 in the nucleus accumbens is critical for promoting resilience to chronic stress. Nat Neurosci. 2015;18(7):1017–1024. doi:10.1038/nn.4028
30. Zarate CA
31. Detka J, Kurek A, Kucharczyk M, et al. Brain glucose metabolism in an animal model of depression. Neuroscience. 2015;295:198–208. doi:10.1016/j.neuroscience.2015.03.046
32. Qin Y, Jiang X, Li W, et al. Chronic mild stress leads to aberrant glucose energy metabolism in depressed Macaca fascicularis models. Psychoneuroendocrinology. 2019;107:59–69. doi:10.1016/j.psyneuen.2019.05.007
33. Ali-Sisto T, Tolmunen T, Toffol E, et al. Purine metabolism is dysregulated in patients with major depressive disorder. Psychoneuroendocrinology. 2016;70:25–32. doi:10.1016/j.psyneuen.2016.04.017
34. Park DI, Dournes C, Sillaber I, et al. Purine and pyrimidine metabolism: convergent evidence on chronic antidepressant treatment response in mice and humans. Sci Rep. 2016;6:35317. doi:10.1038/srep35317
35. Zheng P, Gao HC, Li Q, et al. Plasma metabonomics as a novel diagnostic approach for major depressive disorder. J Proteome Res. 2012;11(3):1741–1748. doi:10.1021/pr2010082
36. Modica-Napolitano JS, Renshaw PF. Ethanolamine and phosphoethanolamine inhibit mitochondrial function in vitro: implications for mitochondrial dysfunction hypothesis in depression and bipolar disorder. Biol Psychiatry. 2004;55(3):273–277. doi:10.1016/S0006-3223(03)00784-4
37. Bansal Y, Kuhad A. Mitochondrial dysfunction in depression. Curr Neuropharmacol. 2016;14(6):610–618. doi:10.2174/1570159X14666160229114755
38. Marsden WN. Synaptic plasticity in depression: molecular, cellular and functional correlates. Prog Neuropsychopharmacol Biol Psychiatry. 2013;43:168–184. doi:10.1016/j.pnpbp.2012.12.012
39. Wu FS, Gibbs TT, Farb DH. Dual activation of GABAA and glycine receptors by beta-alanine: inverse modulation by progesterone and 5 alpha-pregnan-3 alpha-ol-20-one. Eur J Pharmacol. 1993;246(3):239–246. doi:10.1016/0922-4106(93)90037-A
40. Shetewy A, Shimada-Takaura K, Warner D, et al. Mitochondrial defects associated with beta-alanine toxicity: relevance to hyper-beta-alaninemia. Mol Cell Biochem. 2016;416(1–2):11–22. doi:10.1007/s11010-016-2688-z
41. Liu Y, Yieh L, Yang T, et al. Metabolomic biosignature differentiates melancholic depressive patients from healthy controls. BMC Genomics. 2016;17:669. doi:10.1186/s12864-016-2953-2
42. Du H, Wang K, Su L, et al. Metabonomic identification of the effects of the Zhimu-Baihe saponins on a chronic unpredictable mild stress-induced rat model of depression. J Pharm Biomed Anal. 2016;128:469–479. doi:10.1016/j.jpba.2016.06.019
43. Blomstrand E. A role for branched-chain amino acids in reducing central fatigue. J Nutr. 2006;136(2):544S–547S. doi:10.1093/jn/136.2.544S
44. Shimomura Y, Harris RA. Metabolism and physiological function of branched-chain amino acids: discussion of session 1. J Nutr. 2006;136(1 Suppl):232S–233S. doi:10.1093/jn/136.1.232S
45. Tanaka K, Watase K, Manabe T, et al. Epilepsy and exacerbation of brain injury in mice lacking the glutamate transporter GLT-1. Science. 1997;276(5319):1699–1702. doi:10.1126/science.276.5319.1699
46. Choudary PV, Molnar M, Evans SJ, et al. Altered cortical glutamatergic and GABAergic signal transmission with glial involvement in depression. Proc Natl Acad Sci U S A. 2005;102(43):15653–15658. doi:10.1073/pnas.0507901102
47. Bechtholt-Gompf AJ, Walther HV, Adams MA, Carlezon WA
48. Ding XF, Li YH, Chen JX, et al. Involvement of the glutamate/glutamine cycle and glutamate transporter GLT-1 in antidepressant-like effects of Xiao Yao san on chronically stressed mice. BMC Complement Altern Med. 2017;17(1):326. doi:10.1186/s12906-017-1830-0
49. Gao SF, Bao AM. Corticotropin-releasing hormone, glutamate, and gamma-aminobutyric acid in depression. Neuroscientist. 2011;17(1):124–144. doi:10.1177/1073858410361780
50. Arnone D, Mumuni AN, Jauhar S, Condon B, Cavanagh J. Indirect evidence of selective glial involvement in glutamate-based mechanisms of mood regulation in depression: meta-analysis of absolute prefrontal neuro-metabolic concentrations. Eur Neuropsychopharmacol. 2015;25(8):1109–1117. doi:10.1016/j.euroneuro.2015.04.016
51. Taylor MJ. Could glutamate spectroscopy differentiate bipolar depression from unipolar? J Affect Disord. 2014;167:80–84. doi:10.1016/j.jad.2014.05.019
52. Cocchi R. Antidepressive properties of I-glutamine. Preliminary report. Acta Psychiatr Belg. 1976;76(4):658–666.
53. Broer S. The SLC38 family of sodium-amino acid co-transporters. Pflugers Arch. 2014;466(1):155–172. doi:10.1007/s00424-013-1393-y
54. Qureshi T, Sorensen C, Berghuis P, et al. The glutamine transporter Slc38a1 regulates GABAergic neurotransmission and synaptic plasticity. Cereb Cortex. 2019;29(12):5166–5179. doi:10.1093/cercor/bhz055
55. Garcia-Garcia AL, Elizalde N, Matrov D, et al. Increased vulnerability to depressive-like behavior of mice with decreased expression of VGLUT1. Biol Psychiatry. 2009;66(3):275–282. doi:10.1016/j.biopsych.2009.02.027
56. Oh DH, Oh D, Son H, Webster MJ, Weickert CS, Kim SH. An association between the reduced levels of SLC1A2 and GAD1 in the dorsolateral prefrontal cortex in major depressive disorder: possible involvement of an attenuated RAF/MEK/ERK signaling pathway. J Neural Transm (Vienna). 2014;121(7):783–792. doi:10.1007/s00702-014-1189-z
57. Lin CH, Huang MW, Lin CH, Huang CH, Lane HY. Altered mRNA expressions for N-methyl-D-aspartate receptor-related genes in WBC of patients with major depressive disorder. J Affect Disord. 2019;245:1119–1125. doi:10.1016/j.jad.2018.12.016
58. Parviz M, Vogel K, Gibson KM, Pearl PL. Disorders of GABA metabolism: SSADH and GABA-transaminase deficiencies. J Pediatr Epilepsy. 2014;3(4):217–227. doi:10.3233/PEP-14097
59. Novotny EJ
60. Kennedy AD, Pappan KL, Donti T, et al. 2-pyrrolidinone and succinimide as clinical screening biomarkers for GABA-transaminase deficiency: anti-seizure medications impact accurate diagnosis. Front Neurosci. 2019;13:394. doi:10.3389/fnins.2019.00394
61. Callery PS, Geelhaar LA, Stogniew M. 2-pyrrolidinone–a cyclization product of gamma-aminobutyric acid detected in mouse brain. Biochem Pharmacol. 1978;27(16):2061–2063. doi:10.1016/0006-2952(78)90068-0
62. Bradley KA, Alonso CM, Mehra LM, Xu J, Gabbay V. Elevated striatal gamma-aminobutyric acid in youth with major depressive disorder. Prog Neuropsychopharmacol Biol Psychiatry. 2018;86:203–210. doi:10.1016/j.pnpbp.2018.06.004
63. Gilabert-Juan J, Castillo-Gomez E, Guirado R, Molto MD, Nacher J. Chronic stress alters inhibitory networks in the medial prefrontal cortex of adult mice. Brain Struct Funct. 2013;218(6):1591–1605. doi:10.1007/s00429-012-0479-1
64. Maguire J. Neuroactive steroids and GABAergic involvement in the neuroendocrine dysfunction associated with major depressive disorder and postpartum depression. Front Cell Neurosci. 2019;13:83. doi:10.3389/fncel.2019.00083
65. Lewis DA, Hashimoto T, Volk DW. Cortical inhibitory neurons and schizophrenia. Nat Rev Neurosci. 2005;6(4):312–324. doi:10.1038/nrn1648
66. Charych EI, Liu F, Moss SJ, Brandon NJ. GABA(A) receptors and their associated proteins: implications in the etiology and treatment of schizophrenia and related disorders. Neuropharmacology. 2009;57(5–6):481–495. doi:10.1016/j.neuropharm.2009.07.027
67. Sanacora G, Mason GF, Rothman DL, Krystal JH. Increased occipital cortex GABA concentrations in depressed patients after therapy with selective serotonin reuptake inhibitors. Am J Psychiatry. 2002;159(4):663–665. doi:10.1176/appi.ajp.159.4.663
 © 2020 The Author(s). This work is published and licensed by Dove Medical Press Limited. The full terms of this license are available at https://www.dovepress.com/terms.php and incorporate the Creative Commons Attribution - Non Commercial (unported, v3.0) License.
By accessing the work you hereby accept the Terms. Non-commercial uses of the work are permitted without any further permission from Dove Medical Press Limited, provided the work is properly attributed. For permission for commercial use of this work, please see paragraphs 4.2 and 5 of our Terms.
© 2020 The Author(s). This work is published and licensed by Dove Medical Press Limited. The full terms of this license are available at https://www.dovepress.com/terms.php and incorporate the Creative Commons Attribution - Non Commercial (unported, v3.0) License.
By accessing the work you hereby accept the Terms. Non-commercial uses of the work are permitted without any further permission from Dove Medical Press Limited, provided the work is properly attributed. For permission for commercial use of this work, please see paragraphs 4.2 and 5 of our Terms.