")
Back to Journals » International Journal of Nephrology and Renovascular Disease » Volume 13
Chronic Kidney Disease Modifies The Relationship Between Body Fat Distribution and Blood Pressure: A Cross-Sectional Analysis
Authors George C , Matsha TE , Davidson FE , Goedecke JH , Erasmus RT, Kengne AP
Received 31 January 2020
Accepted for publication 15 March 2020
Published 13 May 2020 Volume 2020:13 Pages 107—118
DOI https://doi.org/10.2147/IJNRD.S247907
Checked for plagiarism Yes
Review by Single anonymous peer review
Peer reviewer comments 2
Editor who approved publication: Professor Pravin Singhal
Cindy George,1 Tandi E Matsha,2 Florence E Davidson,2,3 Julia H Goedecke,1,4 Rajiv T Erasmus,5 Andre P Kengne1
1Non-Communicable Diseases Research Unit, South African Medical Research Council, Cape Town, South Africa; 2SAMRC/CPUT/Cardiometabolic Health Research Unit, Department of Biomedical Sciences, Faculty of Health and Wellness Science, Cape Peninsula University of Technology, Cape Town, South Africa; 3Department of Medical Imaging and Therapeutic Sciences, Faculty of Health and Wellness Science, Cape Peninsula University of Technology, Cape Town, South Africa; 4Department of Human Biology, University of Cape Town, Cape Town, South Africa; 5Division of Chemical Pathology, Faculty of Medicine and Health Sciences, National Health Laboratory Service (NHLS) and University of Stellenbosch, Cape Town, South Africa
Correspondence: Cindy George PO Box 19070, Tygerberg 7505, South Africa
Tel +27 21 9380482
Fax +27 21 9335519
Email [email protected]
Introduction: Measures of adiposity are related to cardiovascular disease risk, but this relationship is inconsistent in disease states, such as chronic kidney disease (CKD). This study investigated the relationship between adiposity and blood pressure (BP) by CKD status.
Materials and Methods: South Africans of mixed-ancestry (n=1,621) were included. Estimated glomerular filtration rate (eGFR) was based on the modification of diet in renal disease (MDRD) equation, and CKD defined as eGFR < 60mL/min/1.73m2. Body fat distribution was assessed using anthropometry [body mass index (BMI) and waist circumference (WC)] and dual-energy x-ray absorptiometry (DXA) (n=152). Pulse pressure (PP) and mean arterial pressure (MAP) were calculated from systolic blood pressure (SBP) and diastolic blood pressure (DBP).
Results: In participants without CKD, anthropometric and DXA-derived measures positively correlated with SBP, DBP, MAP and PP (p< 0.02 for all), except for leg fat mass (LFM), which was not associated with BP indices (p> 0.100 for all). Contrary, in prevalent CKD (6%, n=96), only BMI was inversely associated with PP (p=0.0349). In multivariable analysis, only BMI and WC remained independently associated with SBP, DBP and MAP in the overall sample. Notably, the association between BMI, WC and LFM with SBP and PP, differed by CKD status (interaction: p< 0.100 for all), such that only BMI and WC were associated with SBP in those without CKD and inversely associated with PP in those with CKD. LFM was inversely associated with SBP and PP in those with CKD.
Conclusion: In people without CKD, BP generally increases with increasing measures of adiposity. However, excess body fat has a seemingly protective or neutral effect on BP in people with CKD.
Keywords: kidney dysfunction, anthropometry, dual-energy x-ray absorptiometry
Introduction
According to recent global statistics, 39% of adults are overweight and 13% are obese. 1 Obesity, which was once considered a problem of high-income countries, is now on the rise in low- and middle-income countries,2,3 in parallel to the increase in the prevalence of major cardiovascular risk factors such as high blood pressure.4 Indeed, increased adiposity, most commonly captured through body mass index (BMI), is strongly associated with elevated blood pressure.2 Further, Mendelian randomization studies5,6 and randomized intervention trials of weight-loss,7 suggest this relationship to be causal. According to the 2017 Global Burden of Diseases study, high systolic blood pressure (SBP) and high BMI are respectively the first and fourth largest contributor to disability-adjusted life-years (DALYs),8 thus adding substantially to the proportion of morbidity and mortality globally.9
It has been traditionally accepted that increased blood pressure and BMI are both modifiable risk factors for the development of cardiometabolic diseases.10 However, it could be argued that the relationship between these cardiometabolic risk factors may not be uniform in certain patient populations, such as those with chronic kidney disease (CKD). The hypothesis of “reverse epidemiology” suggests that in contrast to the general population, higher BMI, elevated blood pressure and hypercholesterolemia are paradoxically associated with greater survival in patients with CKD,11 with the underlying mechanism still unknown. Indeed, many observational studies have indicated seemingly counterintuitive associations between obesity and more favourable clinical outcomes in those with moderate to advanced CKD.12 Studies also showed however that high BMI is not associated with better survival among patients with early stage CKD or after kidney transplantation,13 suggesting that excess fat is most protective among the sickest patients. It is however still unclear which component related to obesity is protective in people with CKD. Most previous population-based studies evaluating the association between adiposity and blood pressure used BMI to define the level of adiposity, demonstrating in these studies that higher BMI is significantly associated with increased blood pressure.14 Since BMI does not distinguish between lean and fat mass, other markers of adiposity have been evaluated, including imaging of visceral fat and specific ectopic fat depots; with these shown to be better predictors of increased blood pressure compared to BMI.13,15 Dual-energy X-ray absorptiometry (DXA) technology is available and allows total body composition and body fat distribution to be measured with a higher degree of accuracy and objectivity.16
Therefore, since increased blood pressure and BMI are both related to better survival in those with CKD, it would be of interest to evaluate the relationship between adiposity and blood pressure in people with CKD compared to those without CKD. Although, various studies have shown a positive association between increased adiposity, blood pressure and hypertension incidence in the general population,15,17 to our knowledge very few studies have examined the independent relationship between anthropometric-derived measures of adiposity (BMI and waist circumference [WC]) and brachial blood pressure in people with prevalent CKD. Further, no studies have evaluated the associations between DXA-derived measures of body fat and blood pressure in people with and without CKD. Therefore, the aim of the present study was to examine the relationship between anthropometric and DXA-derived measurements of body fat distribution and blood pressure indices in adults with and without CKD in a community-based sample of mixed-ancestry South Africans.
Materials and Methods
Study Population and Setting
For the current analysis, data from the Cape Town Vascular and Metabolic Health study,18 which was collected between February 2015 and November 2015, was used. As previously described,18 participants in the study were adult South Africans of mixed-ancestry. The study was conducted in accordance with the Declaration of Helsinki and approved by the Research Ethics Committees of the Cape Peninsula University of Technology (CPUT) and Stellenbosch University (NHREC: REC-230 408–014 and N14/01/003, respectively). All study procedures were explained in the native language of the participant after which voluntarily signed written informed consent was obtained.
Measurements of Body Fat Distribution
All physical examinations took place at a research clinic on the campus of CPUT, as previously described.19 Briefly, standard anthropometric measurements were done on all participants three times and the average used for the analysis. Body weight (nearest 0.1 kg) was measured with a calibrated Omron body fat meter HBF-511 digital bathroom scale (Kyoto, Japan), with the participant in light clothing and without shoes. A stadiometer was used to determine the height (nearest cm) of each participant, with the participant standing in an upright position, on a flat surface. WC was measured using a non-elastic tape measure, at the level of the narrowest part of the torso, as seen from the anterior view. DXA-derived measures, including total body fat mass (FM), trunk fat mass (TFM), leg fat mass (LFM), arm fat mass (AFM) (all expressed in kg and as %FM), visceral adipose tissue (VAT) and subcutaneous adipose tissue (SAT) areas were measured, as previously described,16 using the DXA technique (Hologic Discovery-A (S/N 83145), Bedford, MA, USA, software version 12.5:7). From the total sample of 1,621 participants included in the study, only 152 underwent DXA analysis. The participants who had DXA measures were similar in age, BMI, WC and blood pressure to those who did not have DXA measures (data not shown). The proportion of people with CKD was also similar in the sub-sample (n=152) compared to the total sample (n=1621), namely 7% and 6% in the sub-sample and total sample, respectively.
Measures of Brachial Blood Pressure
Blood pressure measurements were taken in a seated position after 10 minutes of seated rest. The systolic and diastolic blood pressure (SBP and DBP, respectively) were recorded three times on the right arm using a semi-automated digital blood pressure monitor (Rossmax PA, USA). The average of the last two measures was used to determine blood pressure levels. Pulse pressure (PP) was determined by subtracting the DBP from the SBP and the mean arterial pressure (MAP) was calculated based on the formula: [DBP + PP/3].
Laboratory Measures and Calculations
An ISO 15189 accredited Pathology practice (PathCare, Reference Laboratory, Cape Town, South Africa) conducted all the biochemical analysis. According to WHO recommendations,20 blood samples were collected after an overnight fast, as well as two hours after a 75g oral glucose tolerance test (OGTT). As previously described,19 plasma glucose levels and HbA1c were measured by enzymatic hexokinase method (Beckman AU, Beckman Coulter, South Africa) and high-performance liquid chromatography (Biorad Variant Turbo, BioRad, South Africa), respectively. Insulin was determined with a paramagnetic particle chemiluminescence assay (Beckman DXI, Beckman Coulter, South Africa). The homeostatic model assessment of insulin resistance (HOMA-IR) was calculated as follows: fasting insulin concentration (mIU/l) × fasting plasma glucose (mmol/l)/22.5). Serum creatinine was measured by the modified Jaffe-Kinetic method (Beckman AU, Beckman Coulter, South Africa). Kidney function was calculated using the serum creatinine-based estimator of glomerular filtration rate (eGFR), namely the 4-variable modification of diet in renal disease (MDRD) equation.21 These calculations were not ethnicity corrected, as the South African Renal Society CKD guidelines promote the exclusion of the correction factor, except in the case of black Africans.
Classification of Kidney Function and Co-Morbidities
CKD, referred to as an eGFR<60 mL/min/1.73 m2, was based on the National Kidney Foundation Disease Outcomes Quality Initiative (NKF-KDOQI) guidelines.22 Participants were classified as having hypertension if they had a SBP ≥140 mmHg and/or DBP ≥90 mmHg,23 or were on hypertensive medication at the time of the interview. A BMI≥25kg/m2 and BMI≥30kg/m2 were classified as overweight and obese, respectively. OGTT glucose levels were used to group participants into glucose tolerance categories according to WHO criteria as: (1) normal glucose tolerance [FG <6.1 mmol/l and 2-h glucose <7.8 mmol/l]; (2) pre-diabetes including impaired FG (IFG; 6.1≤FG< 7.0 mmol/l), impaired glucose tolerance (IGT; 7.8<2-h glucose<11.1 mmol/l) and the combination of both; and (3) type 2 diabetes (T2D) (FG≥7.0 mmol/l and/or 2-h glucose≥11.1 mmol/l). In addition to the screen-detected T2D, those with a history of previously diagnosed T2D were also grouped as T2D.
Statistical Analysis
Participant characteristics were summarised as median (25th–75th percentiles) or count and percentages. Group comparisons were performed using chi-square tests (categorical variables) and Wilcoxon rank-sum tests (continuous variables). Analysis of variance (ANOVA), adjusting for age, was used to compare means of DXA-derived measures of body fat distribution between individuals with and without CKD. Correlations between measures of body fat distribution and blood pressure indices were evaluated using Spearman’s rank correlation coefficients (rho, r). Robust multiple linear regression analyses were used to assess the independent association between the measures of body fat distribution and blood pressure indices, while adjusting for age, gender, CKD status and the interaction between CKD and the measures of body fat distribution. To further investigate the interaction between the measures of body fat distribution and the blood pressure indices, predictive margins were estimated, and graphs plotted. The average marginal effect was also computed from the predictive margins (annotated as dy/dx). All statistical analyses were performed using STATA version 15 (StataCorp, College Station, TX) and statistical significance was based on a p-value <0.05, except for interaction tests where p<0.10 was taken to indicate significant results. This modification of the alpha level to 10% was to assess the effect modification, thus evaluating the magnitude of the association between blood pressure and the measures of body fat distribution by CKD status.
Results
The clinical characteristics of the study population are summarised in Table 1. This population has been characterized in great detail previously.19 To summarize, 1,621 participants were included in this sample, with 25.1% being male, with a group median age of 51 years, and 6% of the total sample presenting with CKD (eGFR<60 mL/min/1.73m2; stage 3–5). CKD was associated with an older age (68 vs 49 years; p<0.0001), with 79.2%, 15.6% and 5.2% presenting with stages 3, 4 and 5 CKD, respectively. Those with CKD had on average a larger WC (99.0 vs 90.8 cm; p<0.0001), higher BMI (30.4 vs 28.2 kg/m2; p=0.0035), and 80.2% were overweight/obese, compared to the participants without CKD, of which 64.7% were overweight/obese. There were no differences in the DXA-derived measures for SAT, FM, TFM, LFM and AFM, between those with CKD compared to those without CKD (p>0.217 for all). However, those with CKD had higher VAT (228.4 vs 174.9 cm2; p=0.0052), but after adjusting VAT content for differences in age between groups, this difference was no longer significant (p=0.614). Further, CKD was associated with higher SBP (141 vs 125 mmHg; p<0.0001), PP (55 vs 43 mmHg; p<0.0001) and MAP (100.3 vs 95.7 mmHg; p=0.0005), but with similar DBP (80.5 vs 81.0 mmHg; p=0.315). Accordingly, those with CKD had a higher prevalence of hypertension than those without CKD (63.5% vs 36.8%, p<0.0001). Higher fasting and 2-hour blood glucose (5.3 vs 5.0 mmol/l; p<0.0001 and 7.4 vs 6.0 mmol/l; p<0.0001, respectively), fasting and 2-hour insulin levels (7.6 vs 6.7 IU/l; p=0.033 and 58.8 vs 37.3 IU/l; p=0.0003, respectively), and HOMA-IR index (2.1 vs 1.5; p=0.0012) were found in the CKD group compared to those with normal kidney function. Consequently, 19.8% and 38.5% of the participants with CKD had IFG/IGT and T2D, compared to 17.2% and 15.7% in those without CKD, respectively.
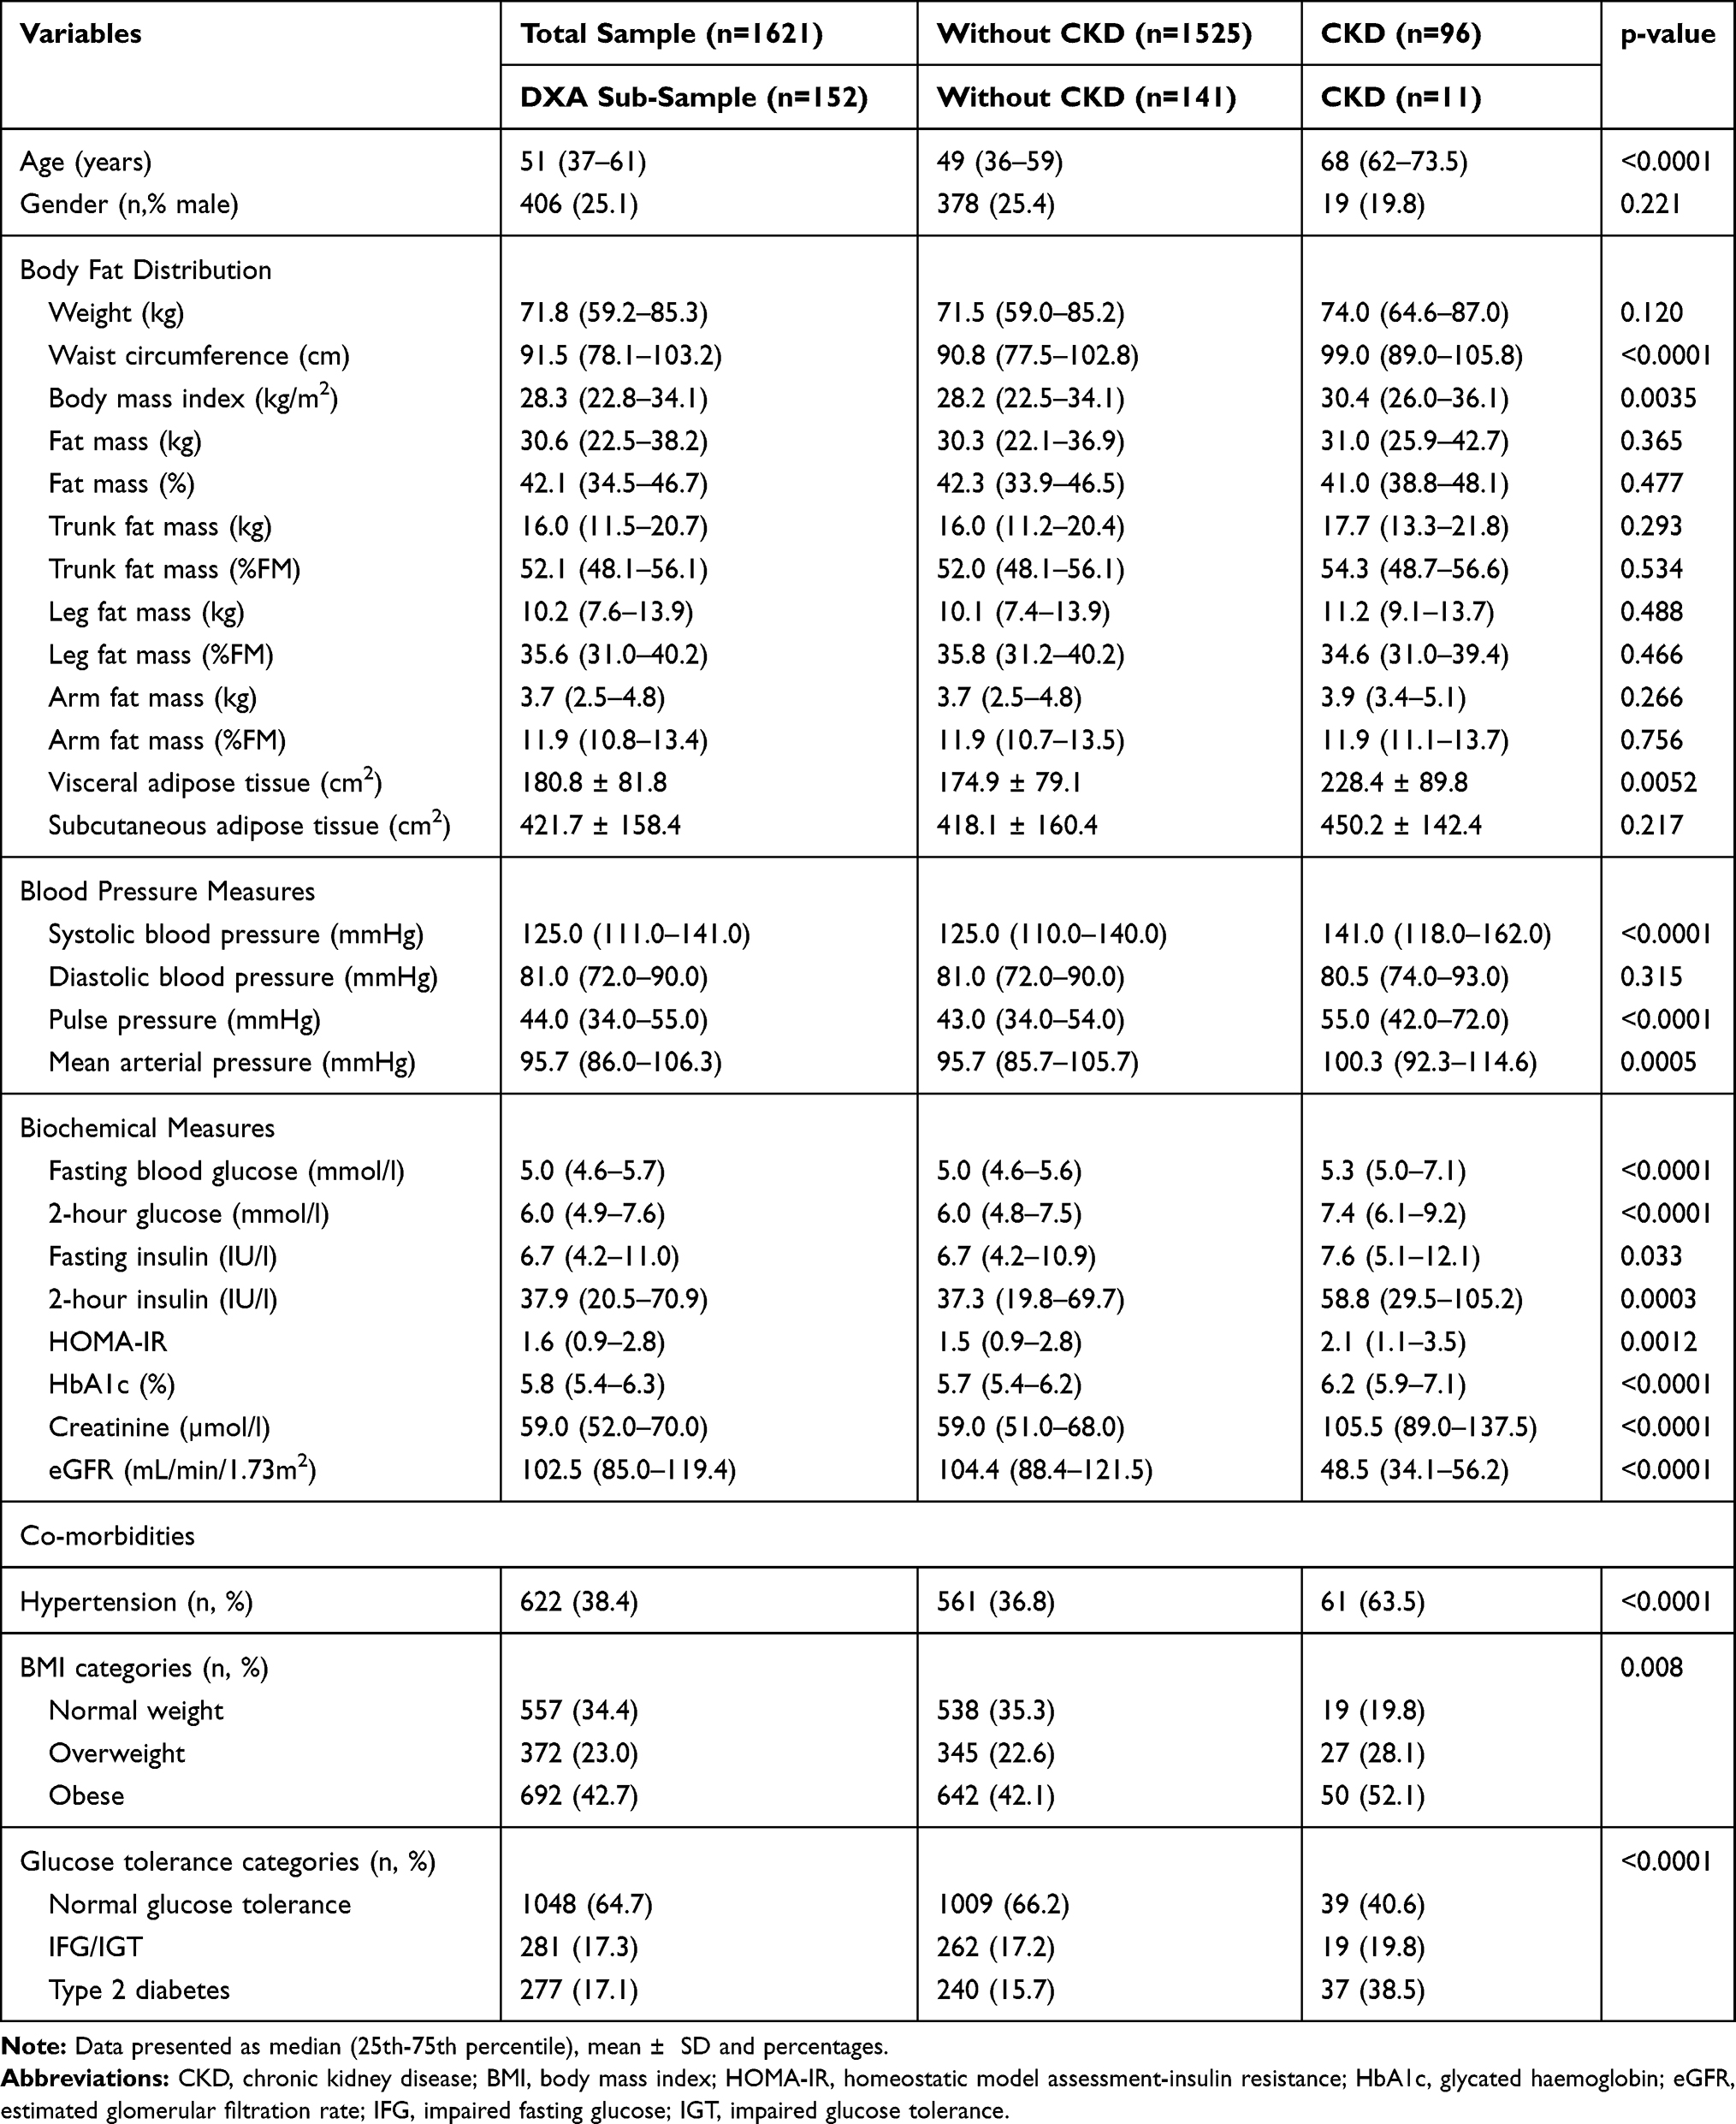 |
Table 1 Clinical Characteristics of the Study Population Overall and by CKD Status |
The correlations between anthropometric-derived and DXA-derived measures of body fat distribution and blood pressure indices in the total sample and dichotomized by CKD status, are shown in Table 2. In the total sample, an increase in BMI and WC were associated with an increase in all blood pressure indices (p<0.004 for all). In addition, all the DXA-derived measures, were positively associated with SBP, DBP and MAP (p<0.03 for all), except for LFM, which was not associated with any of the blood pressure indices (p>0.100 for all). Further, VAT was also positively associated with PP (p=0.0002). When analyzing the correlations by CKD status, similar results were obtained in the group with normal kidney function, compared to the total sample, however SAT was not associated with SBP (p=0.057) in the group without CKD. On the contrary, in those with CKD, only BMI was inversely correlated to PP (p=0.0349), with none of the other measures of body fat distribution correlating with any of the blood pressure indices (p>0.05 for all).
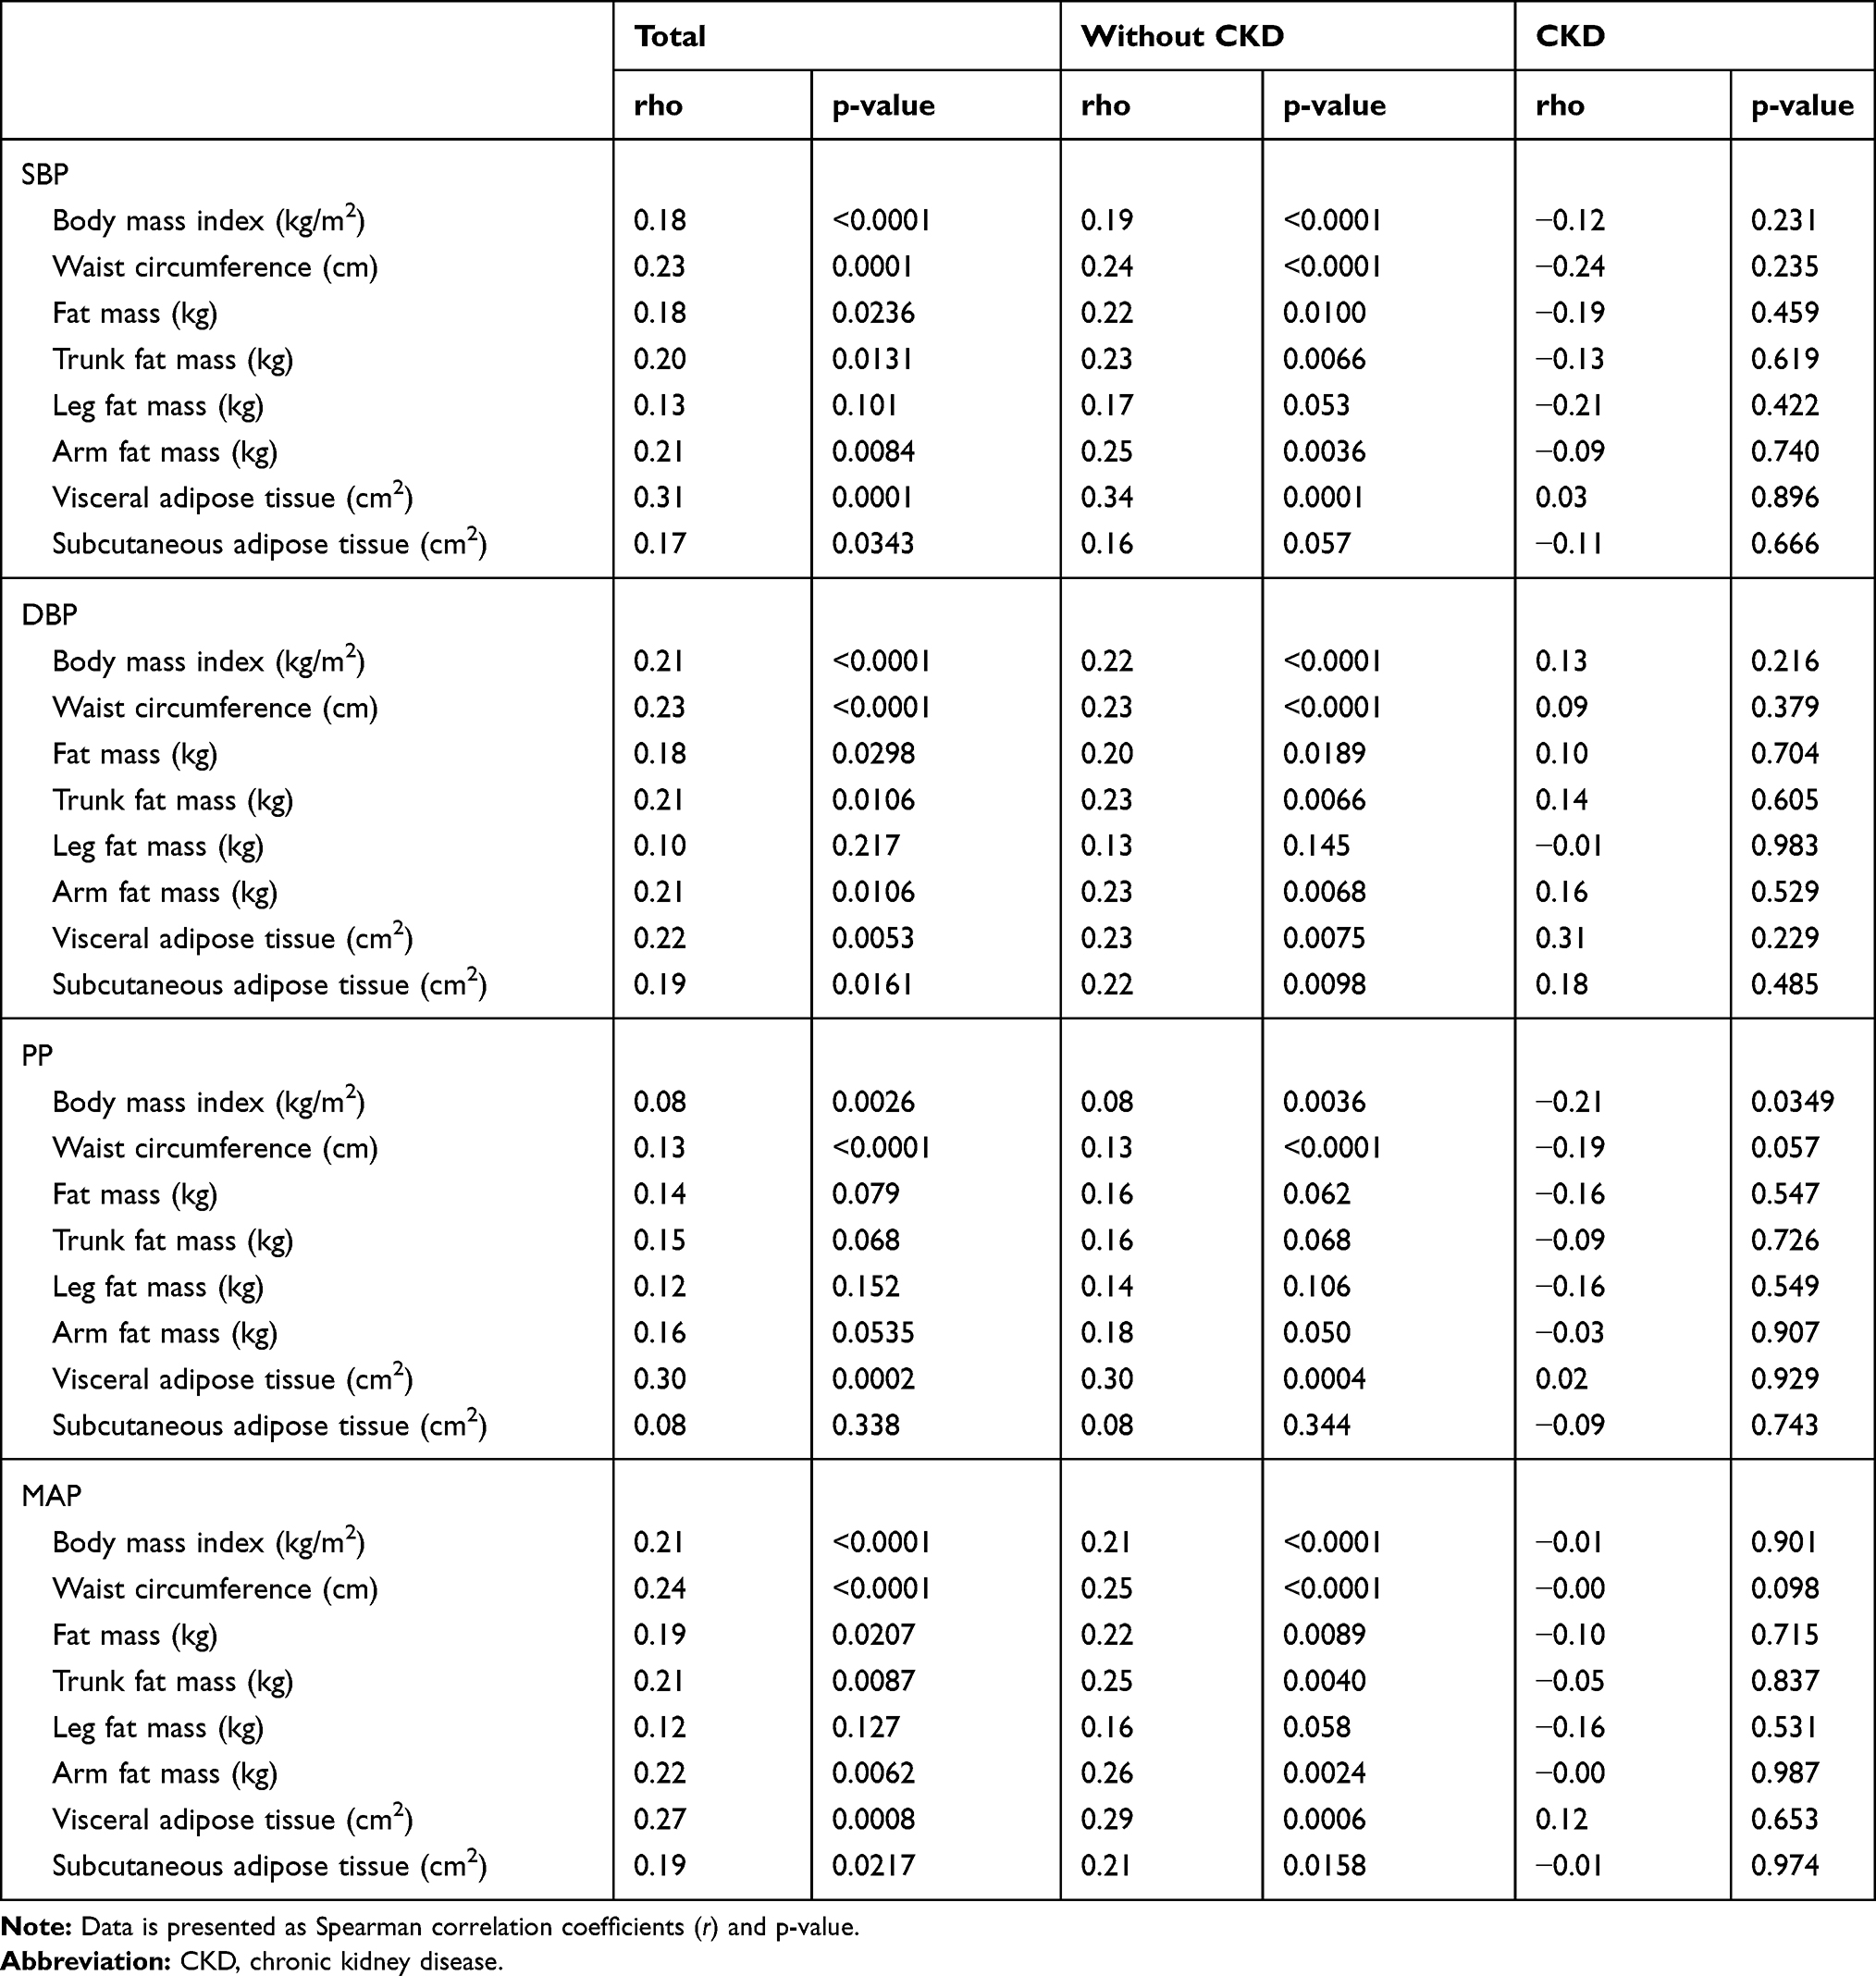 |
Table 2 Correlations Between Blood Pressure and Measures of Body Fat Distribution |
The adjusted regression coefficients from robust multiple linear models for the prediction of blood pressure levels by anthropometric-derived and DXA-derived measures of body fat distribution are presented in Tables 3 and 4 respectively. The graphic representation of the significant interactions between CKD status and the measures of body fat distribution are presented in Figures 1 and 2. Only the anthropometric-derived measures of body fat distribution were independently associated with blood pressure, after adjusting for age, gender and CKD status. Indeed, in the overall sample, higher BMI and WC were associated with higher SBP, DBP and MAP (Table 3). BMI and WC were not associated with PP after adjustment. Notably, increasing BMI and WC were associated with increasing DBP and MAP for both those with CKD and those with normal kidney function (interaction: p=0.433 and p=0.928 for DBP and MAP, respectively). However, the association between these anthropometric-derived measures with SBP and PP, differed by CKD status (interaction: p<0.100 for all), such that BMI and WC were positively associated with SBP only in those with normal kidney function and inversely associated with PP in only the participants with CKD (Figure 1). Although the adjusted associations between the DXA-derived measures of body fat distribution and blood pressure were not significant in the total group (p>0.1 for all) (Table 4), LFM was inversely associated with SBP and PP in the participants with prevalent CKD, with no association in those with normal kidney function (Figure 2).
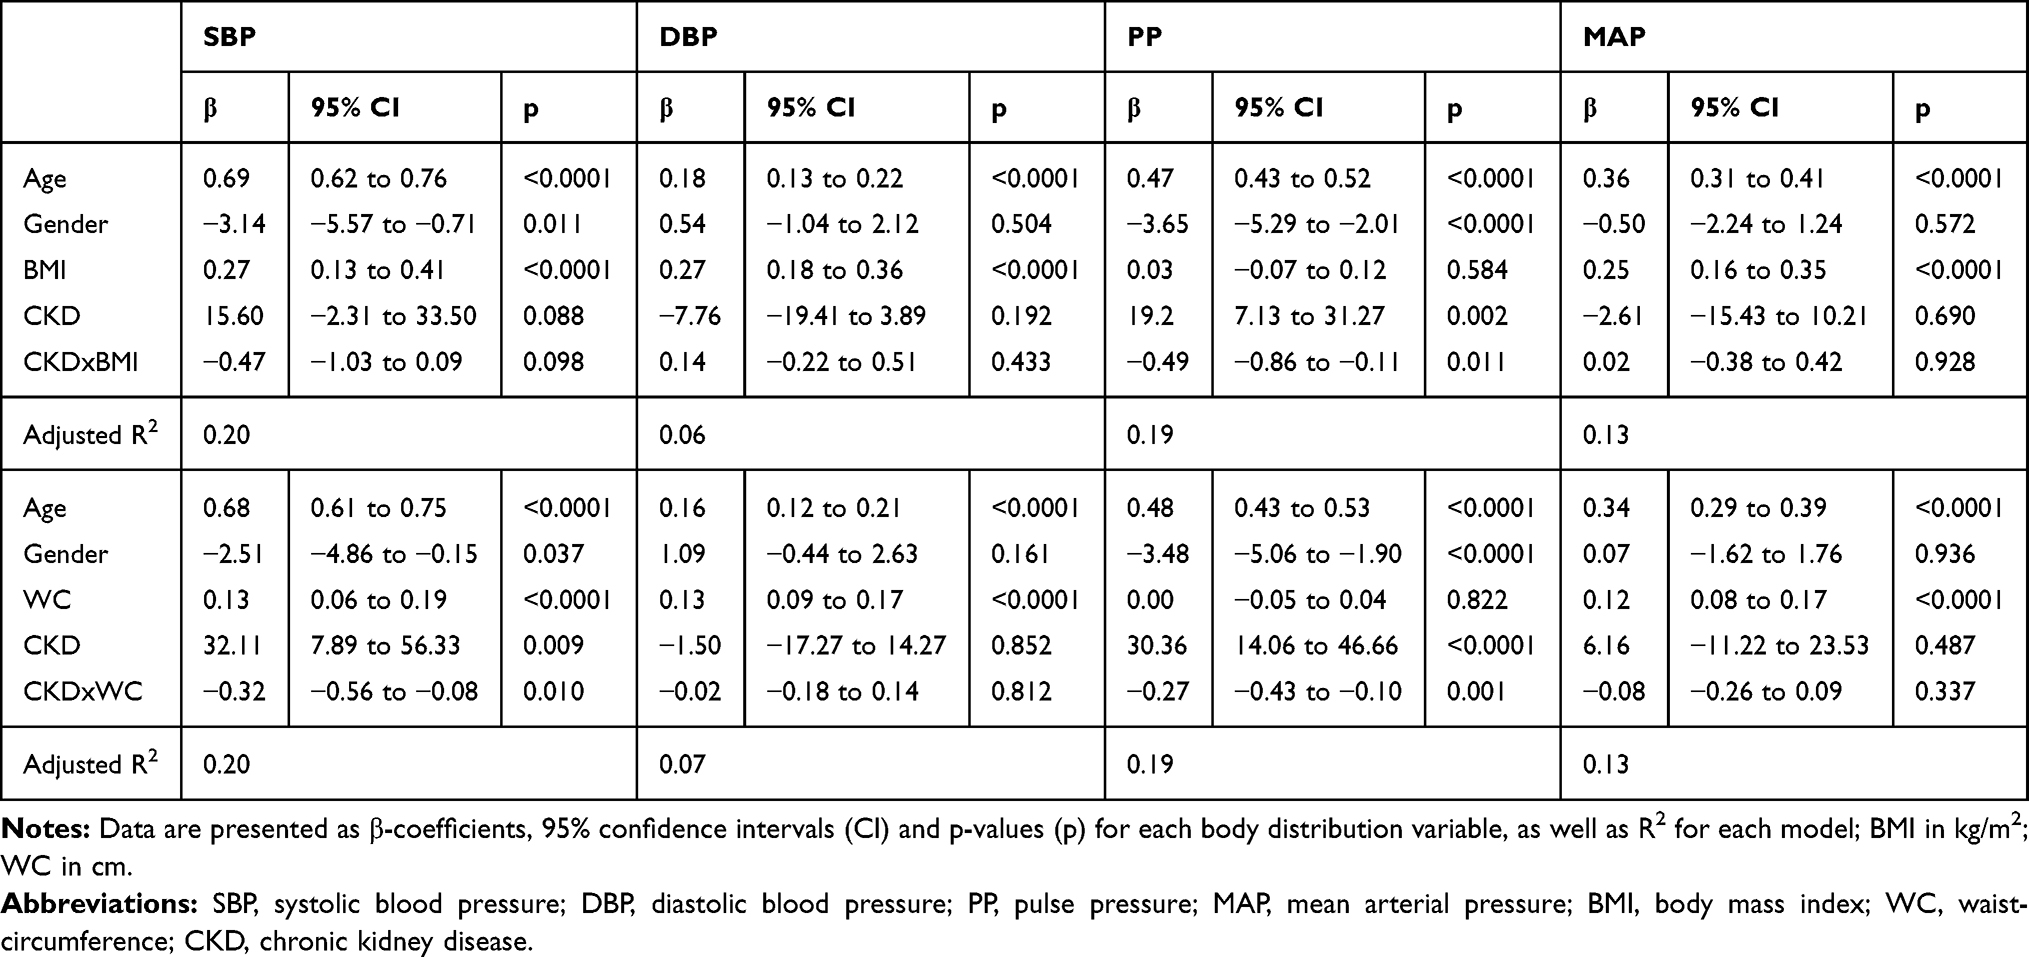 |
Table 3 Regression Coefficients from Robust Multiple Linear Models for the Prediction of Blood Pressure Level by Anthropometric-Derived Measures of Body Fat Distribution, Accounting for Potential Effects of Age and Gender |
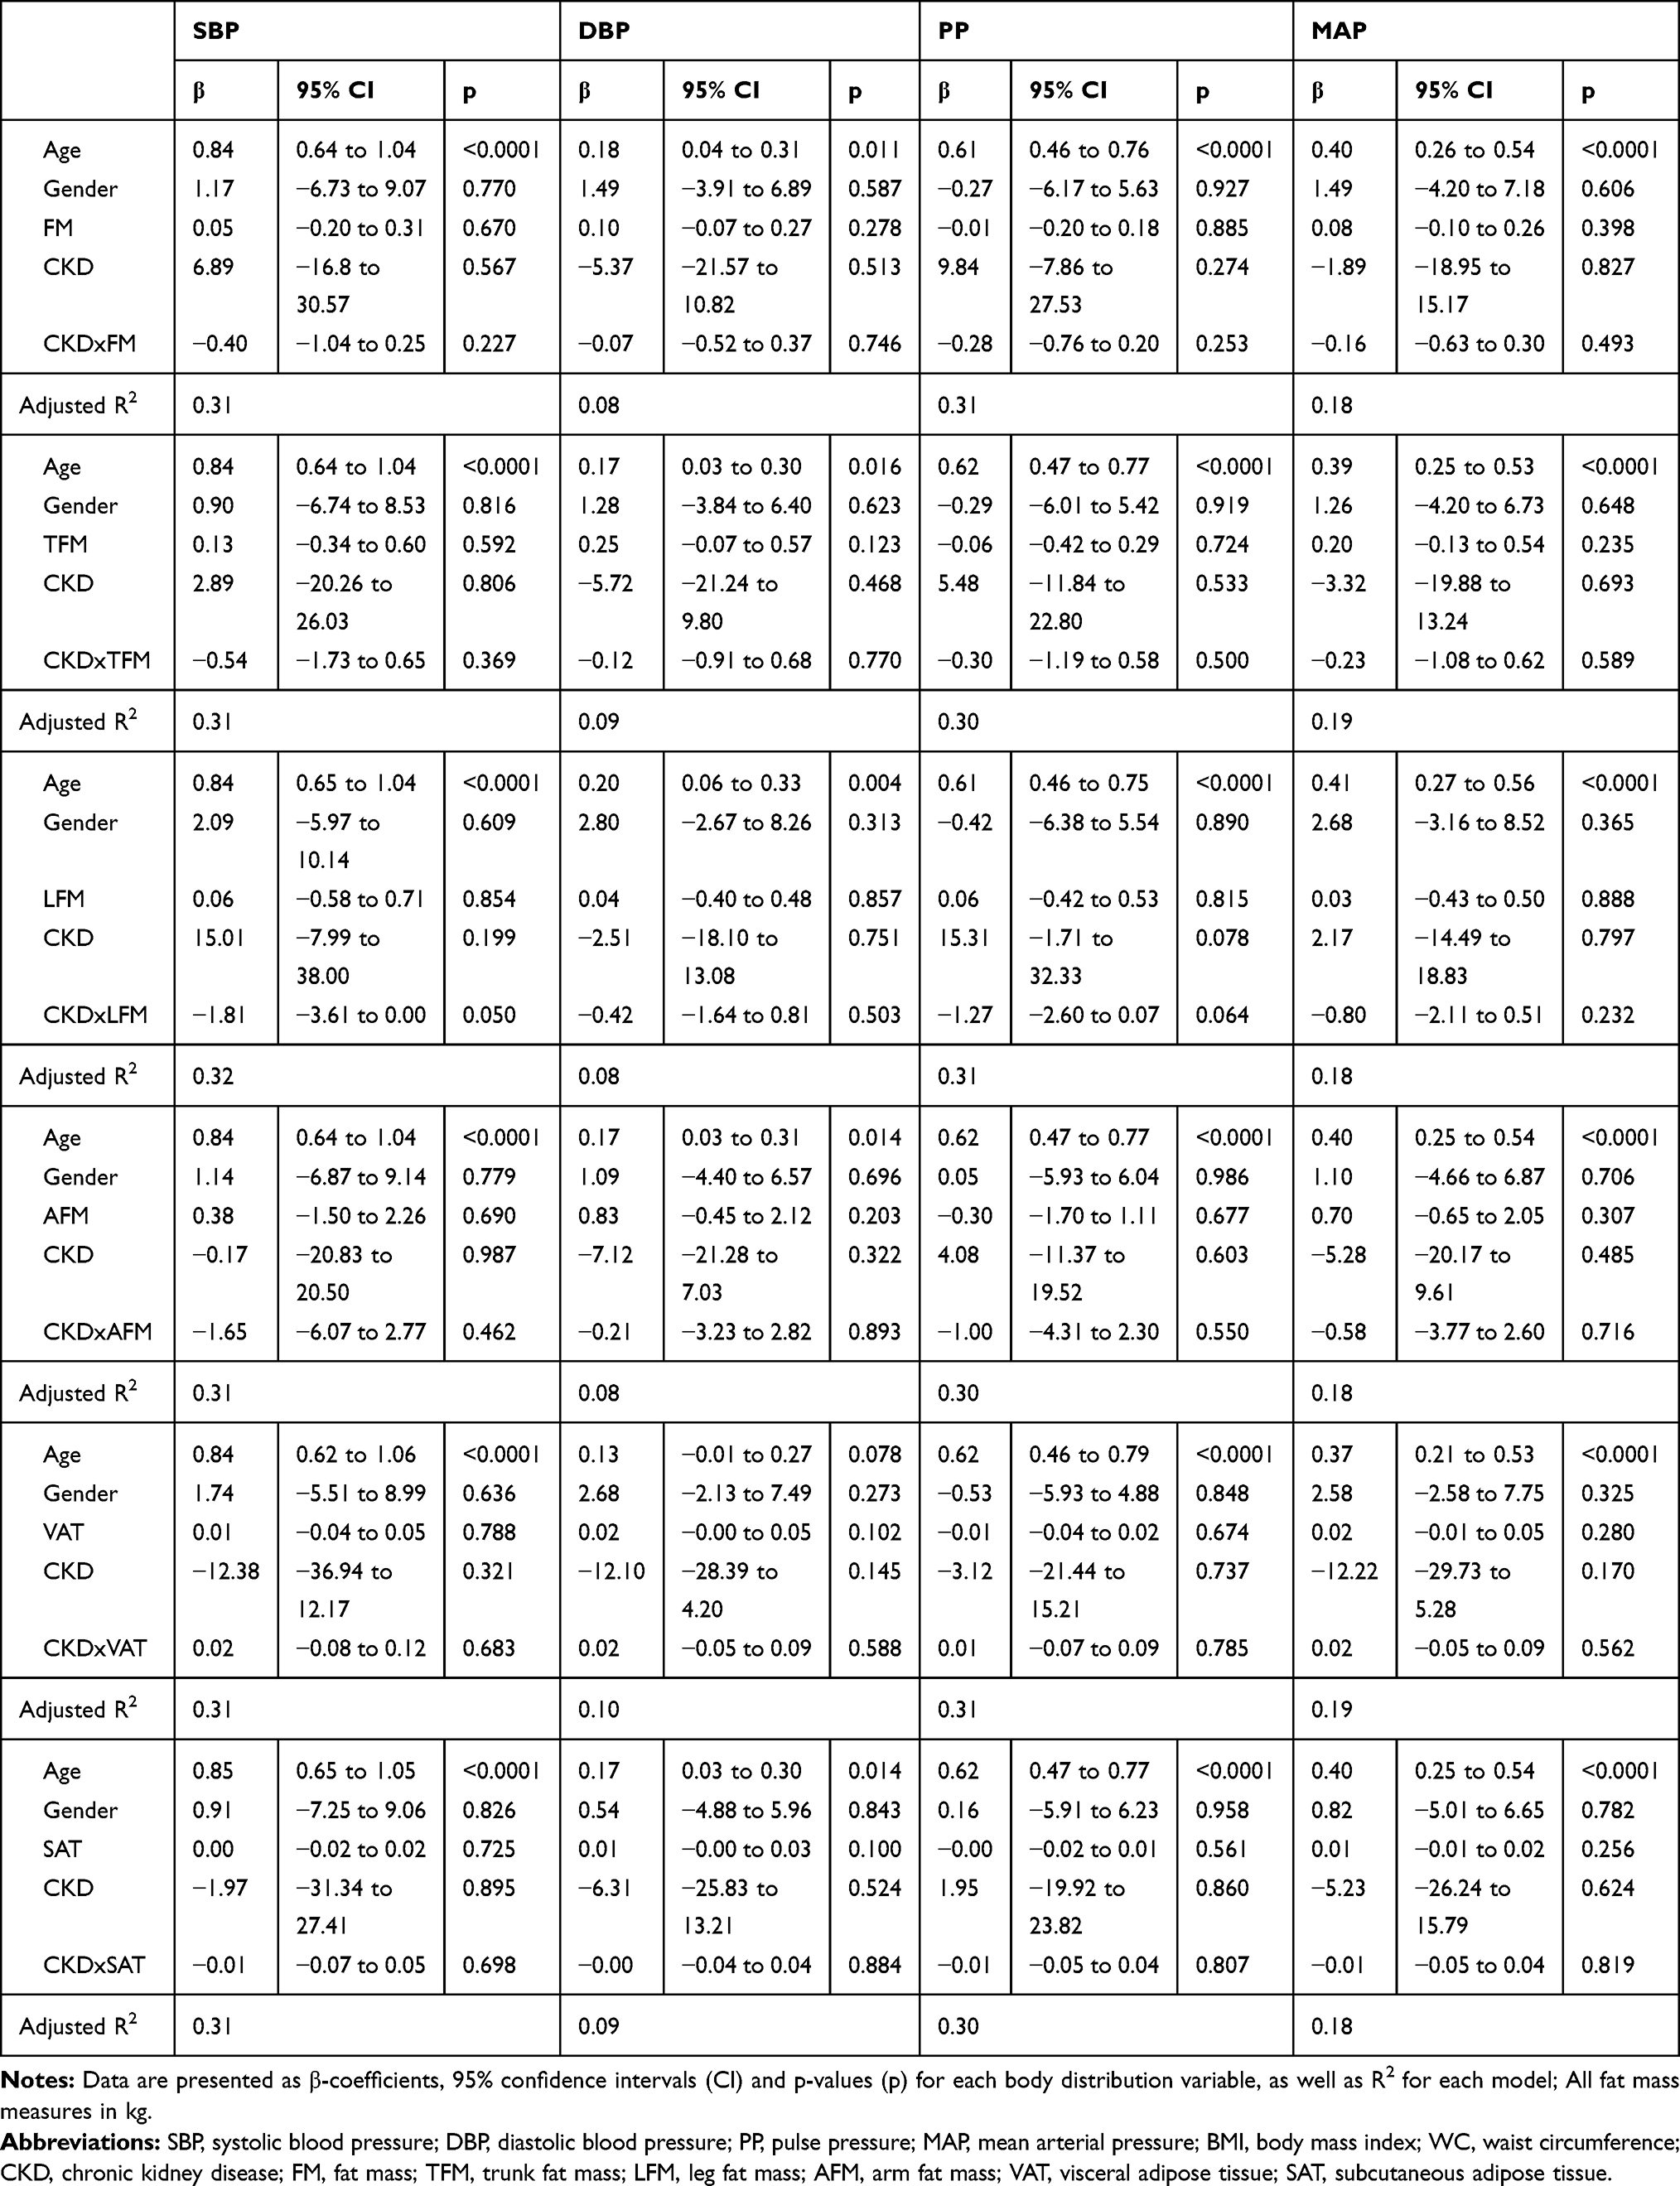 |
Table 4 Regression Coefficients from Robust Multiple Linear Models for the Prediction of Blood Pressure by DXA-Derived Measures of Body Fat Distribution, Accounting for Potential Effects of Age and Gender |
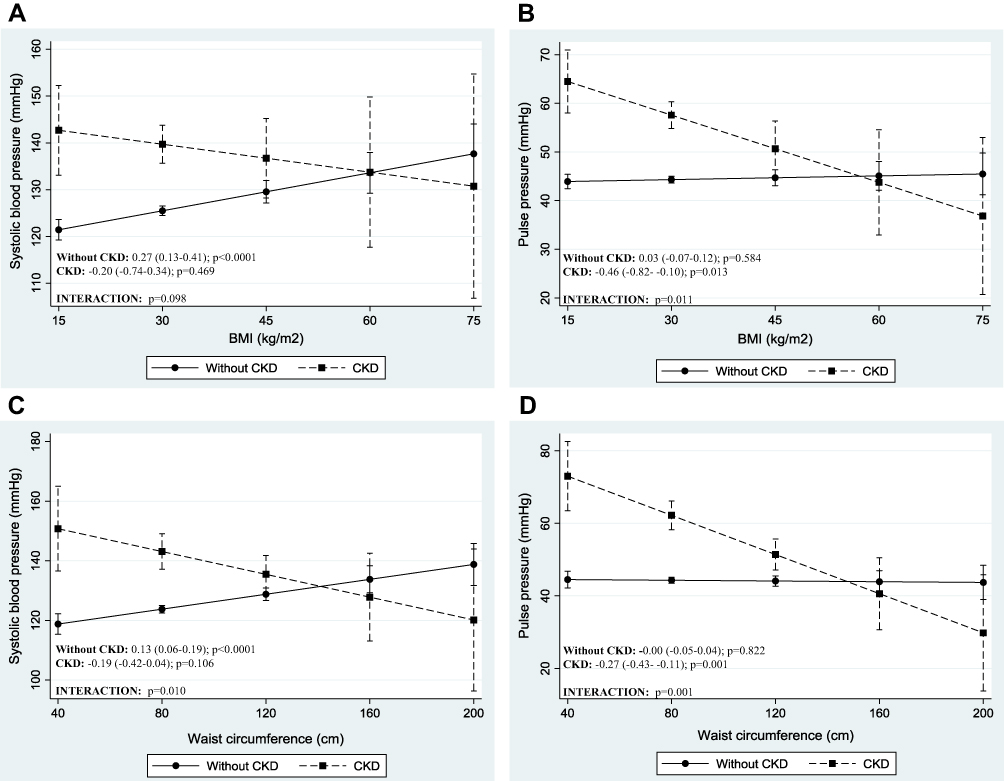 |
Figure 1 Adjusted association between blood pressure indices and anthropometric-derived measures of body fat distribution, dichotomized by CKD status. Presentation of graphs are as follows: Adjusted association between, (A) systolic blood pressure and body mass index, (B) pulse pressure and body mass index, (C) systolic blood pressure and waist circumference and (D) pulse pressure and waist circumference. Data is presented as (1) linear predictive margins for those with CKD (dashed line) and those without CKD (solid line) with 95% CI and (2) the average marginal effect (dy/dx), 95% CI and p-value indicating the association between blood pressure and measures of body fat distribution, for those with and without CKD. |
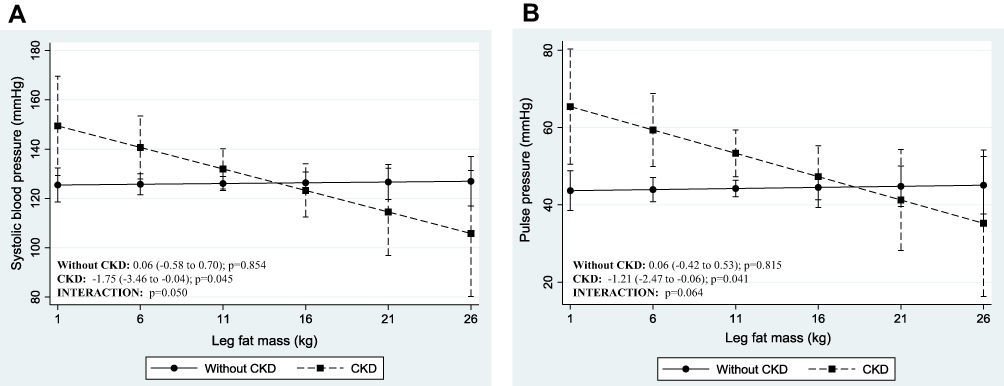 |
Figure 2 Adjusted association between blood pressure indices and DXA-derived measures of body fat distribution, dichotomized by CKD status. Presentation of graphs are as follows: Adjusted association between, (A) systolic blood pressure and leg fat mass, (B) pulse pressure and leg fat mass. Data is presented as (1) linear predictive margins for those with CKD (dashed line) and those without CKD (solid line) with 95% CI and (2) the average marginal effect (dy/dx), 95% CI and p-value indicating the association between blood pressure and measures of body fat distribution, for those with and without CKD. |
Discussion
The main findings in this community-based sample of mixed-ancestry South Africans is that an increase in measures of total body fat and centralized body fat depots are associated with an increase in blood pressure in the general group. However, the independent association between measures of body fat and blood pressure differ by CKD status, such that BMI and WC are positively associated with SBP only in those without CKD and inversely associated with PP only in those with reduced kidney function. Furthermore, higher LFM is associated with lower SBP and PP only in the participants with prevalent CKD.
In accordance with other studies attributing elevated blood pressure to increased cardiovascular risk from elevated weight,24,25 we too show that increased levels of adiposity are associated with increased blood pressure. Accordingly, our findings of BMI and WC-associated rise in SBP, DBP and MAP support this theory for the general sample, however elevated SBP is not associated with elevated BMI and WC in the group with prevalent CKD. Our results are supported by a study by Kolade et al,26 who demonstrated that BMI and WC were associated with brachial and central SBP in healthy individuals, but that there were no associations in patients with end-stage renal disease. In our study, given that the greatest proportion of participants with CKD presented with a BMI ≥30 kg/m2 and a median WC of 99 cm, one could argue that this lack of association with SBP may purely be due to a ceiling effect. With that said, referring to the study by Kolade et al26 with similar results to our study, the population with CKD in that study had a mean BMI of 27.2 kg/m2 with a larger variability range. Alternatively, it is possible that the use of drugs that affect the vasculature, such as statins and antihypertensive agents, could be an influencing factor. Indeed, blood pressure lowering agents are often used preventatively in the absence of high blood pressure in patients with diseases like diabetes and coronary artery disease, of which increased large artery stiffness and impaired endothelial function are common features. Even though nearly 40% of the participants with CKD in our study also had diabetes, this theory cannot be confirmed nor rejected as we did not adjust for blood pressure lowering medication use in those without hypertension. Therefore, the lack of association in people with prevalent CKD has not been fully elucidated and the mechanism can only be speculated upon.
Notably, in people with prevalent CKD, higher BMI and WC are associated with lower PP. Thus, higher BMI and WC are associated with lower cardiac force generated with each contraction. The same counterintuitive association with PP has been shown in people with hypertension, when compared to those without hypertension.27,28 In these studies, a larger physique was associated with a lower PP.28 This inverse relationship between BMI and WC with PP might help to explain the reported lower mortality rate in people with a higher level of adiposity,29 a phenomenon previously hypothesized but not fully elucidated.30 Indeed, previous studies have shown that in individuals with kidney dysfunction, a lower BMI or weight loss over time is associated with poorer outcomes, whereas higher BMI or gaining solid weight is protective and associated with better survival in this group.31 Thus, our results might support the idea that elevated body mass is potentially protective in disease states like CKD, a condition typically referred to as reverse epidemiology.11 Taken together, our results might lend support to the hypothesis that the underlying mechanism explaining these finding are linked to arterial stiffness. Although this hypothesis needs to be further explored, previous studies26,32 have shown that in disease states like CKD, BMI and weight are inversely and independently related to pulse wave velocity (PWV) and augmentation index (Aix). Thus, in patients with CKD, higher levels of adiposity are associated with lower levels in the parameters used to determine arterial stiffness (such as Aix and PWV).26,32 In the current study we have no direct measurements of vascular stiffness, however it seems plausible to link PP to arterial stiffness in CKD, since PP have been shown to be an independent predictor of arterial stiffness in patients with mild to moderate CKD.33 Therefore, one could hypothesize that CKD patients with increased BMI and WC may have lower arterial stiffness explaining the reduced cardiovascular risk and thus lower mortality in these individuals. Although the exact mechanisms behind the seemingly counterintuitive associations between anthropometric-derived measures of body fat distribution and blood pressure indices remains to be elucidated, our findings might help to explain reverse epidemiology in prevalent CKD. However, with that said, the aim of the current study was not to investigate reverse epidemiology nor the direct effect of adiposity on arterial stiffness, therefore studies are needed to further investigate this hypothesis.
The distribution of body fat is another important consideration as it is still unclear which component related to obesity is protective in people with CKD. In the current study, the DXA-derived measures of body fat distribution were not independently associated with blood pressure in the total group. It could be argued that the lack of association may be the effect of inadequate statistical power as only 152 participants underwent DXA scans. However, despite the significantly reduced sample size, when analyzing the sample by CKD status, we found that higher LFM is associated with lower SBP and PP only in the participants with prevalent CKD. Thus, suggesting that increased leg fat is associated with cardiovascular protection in people with CKD. This finding further lends supports to our theory of reduced arterial stiffness in people with CKD. Indeed, previous studies have shown that a greater leg fat mass was inversely associated with arterial stiffness in the general population.34,35 The study by Lee et al35 showed that for each standard deviation increase in LFM, a similar magnitude of decrease in PWV was observed, and that this differential association between LFM and arterial stiffness remained consistent even after adjustment for age, and total body composition including fat and total body lean mass. Although further studies are needed to substantiate our hypothesis, to our knowledge, our study is the first to indicate that LFM is inversely associated with blood pressure in people with prevalent CKD.
It is important to note that this study has some limitations. The effect of gender could not be tested, given a predominantly female population. However, this is common in South African population studies, and as such we did correct for gender in our analysis. According to NKF-KDOQI guidelines, CKD is defined as an eGFR <60 mL/min/1.73 m2 for ≥3months and/or increased urinary albumin excretion (≥30 mg/24h).22 For the current study, CKD was based on a single time-point creatinine assessment and not on repeated measurements and our study did not include estimates of albuminuria. Furthermore, the association across CKD categories could not be evaluated as there were very few participants in the very advanced stages of CKD (stage ≥4). No direct measurements of vascular stiffness were made, and information related to anti-hypertensive use in those without hypertension as a preventative measure was not captured, so we can only speculate that the association between higher BMI, WC, LFM and lower PP was attributable to vascular stiffness. Finally, we only had access to DXA measures of 152 (about 9% of the total sample) and we had no measure of protein and caloric intake. Despite these limitations, we are not aware of other studies that have assessed the association between DXA-derived measurements of body fat distribution and blood pressure indices in adults with and without CKD, especially in a sample of mixed-ancestry South Africans.
Conclusions
While this study is based on a cross-sectional analysis and therefore not feasible to establish a causal association between body fat distribution and blood pressure, our results point to the fact that excess body fat has a protective or neutral effect on blood pressure in people with prevalent CKD. This might explain the reduced cardiovascular risk and all-cause mortality observed in the CKD patient population. However, due to the data limitations, these results should be interpreted cautiously.
Acknowledgments
We would like to acknowledge the Cape Town Vascular Metabolic Health study investigation team and population of Bellville-South (Cape Town, South Africa) for their participation. We would also like to thank the South African Medical Research Council (SAMRC) with funds from National Treasury under its Economic Competitiveness and Support Package (MRC-RFA-UFSP-01-2013/VMH Study) and strategic funds from the SAMRC received from the South African National Department of Health.
Author Contributions
Contributions to conception and design (TEM, APK, RTE, JHG, CG), acquisition of data (FED, TEM), analysis and interpretation of data (CG). Drafting the article (CG) and revising it critically for important intellectual content (all authors listed). Final approval of the version to be published (all authors listed) and agreement to be accountable for all aspects of the work in ensuring that questions related to the accuracy or integrity of any part of the work are appropriately investigated and resolved (all authors listed).
Disclosure
The authors declare that they have no financial interest or other conflict of interest to declare.
References
1. World Health Organization. Obesity and overweight. 2018. Available from: https://www.who.int/en/news-room/fact-sheets/detail/obesity-and-overweight.
2. Whitlock G, Lewington S, Sherliker P, et al. Body-mass index and cause-specific mortality in 900 000 adults: collaborative analyses of 57 prospective studies. Lancet. 2009;373:1083–1096. doi:10.1016/S0140-6736(09)60318-4
3. Noncommunicable Disease Risk Factor Collaboration (NCD-RisC). Trends in adult body-mass index in 200 countries from 1975 to 2014: a pooled analysis of 1698 population-based measurement studies with 19.2 million participants. Lancet. 2016;387:1377–1396. doi:10.1016/S0140-6736(16)30054-X
4. Noncommunicable Disease Risk Factor Collaboration (NCD-RisC). Worldwide trends in blood pressure from 1975 to 2015: a pooled analysis of 1479 population-based measurement studies with 19.1 million participants. Lancet. 2017;389:37–55.
5. Timpson NJ, Harbord R, Smith GD, et al. Does greater adiposity increase blood pressure and hypertension risk?: mendelian randomization using the FTO/MC4R genotype. Hypertension. 2009;54:84–90. doi:10.1161/HYPERTENSIONAHA.109.130005
6. Holmes MV, Lange LA, Palmer T, et al. Causal effects of body mass index on cardiometabolic traits and events: a mendelian randomization analysis. Am J Hum Genet. 2014;94:198–208. doi:10.1016/j.ajhg.2013.12.014
7. Neter JE, Stam BE, Kok FJ, et al. Influence of weight reduction on blood pressure: a meta-analysis of randomized controlled trials. Hypertension. 2003;42:878–884. doi:10.1161/01.HYP.0000094221.86888.AE
8. Global Burden of Disease 2017 Risk Factor Collaborators. Global, regional, and national comparative risk assessment of 84 behavioural, environmental and occupational, and metabolic risks or clusters of risks for 195 countries and territories, 1990–2017: a systematic analysis for the Global Burden of Disease Study 2017. Lancet. 2018;392:1923–1994. doi:10.1016/S0140-6736(18)32225-6
9. Lim SS, Vos T, Flaxman AD, et al. A comparative risk assessment of burden of disease and injury attributable to 67 risk factors and risk factor clusters in 21 regions, 1990–2010: a systematic analysis for the Global Burden of Disease Study 2010. Lancet. 2012;380:2224–2260. doi:10.1016/S0140-6736(12)61766-8
10. Cohen SS, Park Y, Signorello LB, et al. A pooled analysis of body mass index and mortality among African Americans. PLoS One. 2014;9:e111980. doi:10.1371/journal.pone.0111980
11. Kalantar-Zadeh K. What is so bad about reverse epidemiology anyway? Semin Dial. 2007;20:593–601. doi:10.1111/j.1525-139X.2007.00360.x
12. Kalantar-Zadeh K, Rhee CM, Chou J, et al. The obesity paradox in kidney disease: how to reconcile it with obesity management. Kidney Int Rep. 2017;2:271–281. doi:10.1016/j.ekir.2017.01.009
13. Johansen KL, Lee C. Body composition in chronic kidney disease. Curr Opin Nephrol Hypertens. 2015;24:268–275. doi:10.1097/MNH.0000000000000120
14. Lin TY, Liu JS, Hung SC. Obesity and risk of end-stage renal disease in patients with chronic kidney disease: a cohort study. Am J Clin Nutr. 2018;108:1145–1153. doi:10.1093/ajcn/nqy200
15. George C, Goedecke JH, Crowther NJ, et al. The role of body fat and fat distribution in hypertension risk in urban Black South African women. PLoS One. 2016;11:e0154894. doi:10.1371/journal.pone.0154894
16. Plank LD. Dual-energy X-ray absorptiometry and body composition. Curr Opin Clin Nutr Metab Care. 2005;8:305–309. doi:10.1097/01.mco.0000165010.31826.3d
17. Pisa PT, Micklesfield LK, Kagura J, et al. Different adiposity indices and their association with blood pressure and hypertension in middle-aged urban black South African men and women: findings from the AWI-GEN South African Soweto Site. BMC Public Health. 2018;18:524. doi:10.1186/s12889-018-5443-4
18. Kengne AP, Erasmus RT, Levitt NS, et al. Alternative indices of glucose homeostasis as biochemical diagnostic tests for abnormal glucose tolerance in an African setting. Prim Care Diabetes. 2017;11:119–131. doi:10.1016/j.pcd.2017.01.004
19. George C, Matsha TE, Erasmus RT, et al. Haematological profile of chronic kidney disease in a mixed-ancestry South African population: a cross-sectional study. BMJ Open. 2018;8:e025694. doi:10.1136/bmjopen-2018-025694
20. Alberti KG, Zimmet PZ. Definition, diagnosis and classification of diabetes mellitus and its complications. Part 1: diagnosis and classification of diabetes mellitus provisional report of a WHO consultation. Diabet Med. 1998;15:539–553. doi:10.1002/(SICI)1096-9136(199807)15:7<539::AID-DIA668>3.0.CO;2-S
21. Levey AS, Bosch JP, Lewis JB, et al. A more accurate method to estimate glomerular filtration rate from serum creatinine: a new prediction equation. Modification of diet in renal disease study group. Ann Intern Med. 1999;130:461–470. doi:10.7326/0003-4819-130-6-199903160-00002
22. Levey AS, Coresh J, Balk E, et al. National Kidney Foundation practice guidelines for chronic kidney disease: evaluation, classification, and stratification. Ann Intern Med. 2003;139:137–147. doi:10.7326/0003-4819-139-2-200307150-00013
23. World Health Organization. A Global Brief on Hypertension: Silent Killer, Global Public Health Crisis. 2013.
24. Hall ME, Do Carmo JM, da Silva AA, et al. Obesity, hypertension, and chronic kidney disease. Int J Nephrol Renovasc Dis. 2014;7:75–88. doi:10.2147/IJNRD.S39739
25. Hall JE. The kidney, hypertension, and obesity. Hypertension. 2003;41:625–633. doi:10.1161/01.HYP.0000052314.95497.78
26. Kolade OO, O’Moore-Sullivan TM, Stowasser M, et al. Arterial stiffness, central blood pressure and body size in health and disease. Int J Obes. 2012;36:93–99. doi:10.1038/ijo.2011.79
27. Kang MG, Kim KH, Koh JS, et al. Association between pulse pressure and body mass index in hypertensive and normotensive populations in the Korea National Health and Nutrition Examination Survey V, 2010–2012. J Clin Hypertens. 2017;19:395–401. doi:10.1111/jch.12935
28. Martins D, Tareen N, Pan D, et al. The relationship between body mass index and pulse pressure in older adults with isolated systolic hypertension. Am J Hypertens. 2002;15:538–543. doi:10.1016/S0895-7061(02)02269-0
29. Kovesdy CP, Anderson JE. Reverse epidemiology in patients with chronic kidney disease who are not yet on dialysis. Semin Dial. 2007;20:566–569. doi:10.1111/j.1525-139X.2007.00335.x
30. Ahmadi SF, Zahmatkesh G, Ahmadi E, et al. Association of body mass index with clinical outcomes in non-dialysis-dependent chronic kidney disease: a systematic review and meta-analysis. Cardiorenal Med. 2016;6:37–49. doi:10.1159/000437277
31. Evangelista LS, Cho WK, Kim Y. Obesity and chronic kidney disease: a population-based study among South Koreans. PLoS One. 2018;13:e0193559. doi:10.1371/journal.pone.0193559
32. Afsar B, Elsurer R, Soypacaci Z, et al. The relationship between weight, height and body mass index with hemodynamic parameters is not same in patients with and without chronic kidney disease. Clin Exp Nephrol. 2016;20:77–86. doi:10.1007/s10157-015-1136-9
33. Stancanelli B, Malatino LS, Malaponte G, et al. Pulse pressure is an independent predictor of aortic stiffness in patients with mild to moderate chronic kidney disease. Kidney Blood Press Res. 2007;30:283–288. doi:10.1159/000105264
34. Snijder MB, Flyvbjerg A, Stehouwer CD, et al. Relationship of adiposity with arterial stiffness as mediated by adiponectin in older men and women: the Hoorn Study. Eur J Endocrinol. 2009;160:387–395. doi:10.1530/EJE-08-0817
35. Lee M, Choh AC, Demerath EW, et al. Associations between trunk, leg and total body adiposity with arterial stiffness. Am J Hypertens. 2012;25:1131–1137. doi:10.1038/ajh.2012.92
 © 2020 The Author(s). This work is published and licensed by Dove Medical Press Limited. The full terms of this license are available at https://www.dovepress.com/terms.php and incorporate the Creative Commons Attribution - Non Commercial (unported, v3.0) License.
By accessing the work you hereby accept the Terms. Non-commercial uses of the work are permitted without any further permission from Dove Medical Press Limited, provided the work is properly attributed. For permission for commercial use of this work, please see paragraphs 4.2 and 5 of our Terms.
© 2020 The Author(s). This work is published and licensed by Dove Medical Press Limited. The full terms of this license are available at https://www.dovepress.com/terms.php and incorporate the Creative Commons Attribution - Non Commercial (unported, v3.0) License.
By accessing the work you hereby accept the Terms. Non-commercial uses of the work are permitted without any further permission from Dove Medical Press Limited, provided the work is properly attributed. For permission for commercial use of this work, please see paragraphs 4.2 and 5 of our Terms.