")
Back to Journals » OncoTargets and Therapy » Volume 9
Chromatin assembly factor 1, subunit A (P150) facilitates cell proliferation in human hepatocellular carcinoma
Authors Meng Xu, Jia Y, Liu Z, Ding L, Tian R, Gu H, Wang Y, Zhang H, Tu K, Liu Q
Received 24 February 2016
Accepted for publication 18 May 2016
Published 1 July 2016 Volume 2016:9 Pages 4023—4035
DOI https://doi.org/10.2147/OTT.S107050
Checked for plagiarism Yes
Review by Single anonymous peer review
Peer reviewer comments 3
Editor who approved publication: Dr Faris Farassati
Meng Xu, Yuli Jia, Zhikui Liu, Linglong Ding, Run Tian, Hua Gu, Yufeng Wang, Hongyong Zhang, Kangsheng Tu, Qingguang Liu
Department of Hepatobiliary Surgery, The First Affiliated Hospital of Xi’an Jiaotong University, Xi’an, People’s Republic of China
Abstract: Several studies have revealed that the abnormal expression of chromatin assembly factor 1, subunit A (P150) (CHAF1A) was involved in the development of some types of malignant tumors. However, CHAF1A expression and its role in hepatocellular carcinoma (HCC) remain poorly characterized. In this study, we first investigated CHAF1A expression in six cell lines and 116 pairs of HCC and matched normal tumor-adjacent tissues to evaluate the clinicopathological characteristics of CHAF1A in HCC. Then, we detected the proliferation and apoptosis in HCC cells. In addition, a subcutaneous tumor model in nude mice was performed to evaluate tumor growth in vivo. We found that the expression of CHAF1A was significantly higher in HCC tissues than that in adjacent nontumor tissues (P<0.01). Clinical analysis indicated that CHAF1A expression was significantly correlated with the tumor–node–metastasis stage, tumor number, and tumor differentiation in HCC tissues (P<0.05, respectively). We also found that CHAF1A may potentially function as a poor prognostic indicator for 5-year overall and disease-free survival in patients with HCC (P<0.05, respectively). The elevated expression of CHAF1A was also observed in HCC cell lines compared with that in normal LO2 hepatic cell line (P<0.01). HCC cancer cells exhibited inhibition of cell growth, reduction in colony-formation ability, increased cell apoptosis rate, and impaired tumorigenicity in nude mice after CHAF1A knockdown. Collectively, we propose that CHAF1A by potentially mediating cancer cell proliferation plays an important role in promoting the development of HCC and may serve as a potential therapeutic target in HCC.
Keywords: CHAF1A, hepatocellular carcinoma, HCC, prognostic factor, proliferation
Introduction
Hepatocellular carcinoma (HCC) is currently one of the most common aggressive malignant tumors due to its high recurrence rate and increasing incidence, and has become the third leading cause of cancer deaths worldwide.1–3 It is reported that HCC is the second prevalent cause of cancer-related mortality among males and the third among females in the People’s Republic of China, while the incidence rate is also increasing rapidly in many other countries including the US and Western countries.4,5 Unfortunately, the treatment options for liver cancer are still quite limited and not satisfactory, and the specific pathogenesis and progression mechanism of HCC also remain inadequately understood.2,6 In this regard, a better understanding of the underlying mechanisms of HCC and identification of effective prognostic biomarkers of HCC are eagerly awaited to improve the survival rate of patients with HCC.
Recently, accumulating evidences suggest that chromatin remodelers and histone modifiers are emerging as essential and vital roles in the development and progression of cancer.7 It is worthy to mention that chromatin assembly factor-1 (CAF-1), as a highly conserved histone chaperone heterotrimer and consisting of p48, p60, and p150 subunits, is involved in various fundamental biological processes, can facilitate DNA replication during the formation of nucleosome, and is involved in the restoration of chromatin structure after DNA repair.8–10 Previous findings indicated that CAF-1, subunit A (P150) (CHAF1A), the core component of CAF-1, was involved in DNA replication, regulation of related gene expression, and DNA mismatch repair, and epigenetic regulation of embryonic stem cell plays an irreplaceable role in multiple biological functions.11–15 Recently, increasing studies have indicated that the dysregulated expression of CHAF1A is correlated with many cancer types, including breast cancer, prostate squamous cell carcinoma, glioma, and neuroblastoma.16–21 In addition, CHAF1A deregulation is significantly associated with genomic instability in the recessively inherited bloom syndrome and contributes to high predisposition to leukemia, lymphoma, and other solid carcinomas.22 Hence, we infer that CHAF1A could also be a malfunctional mediator of cancer including HCC. Nevertheless, the role of CHAF1 in HCC remains quite largely unknown.
In this study, we confirmed that CHAF1A was highly expressed in HCC tissues and HCC cancer cells, and the elevated expression level of CHAF1A was significantly correlated with poor clinicopathological features in patients with HCC and an independent prognostic factor for predicting both the overall and disease-free 5-year survival of patients with HCC. In addition, we also clarified that CHAF1A could promote cell proliferation in HCC cells. Our results suggested that CHAF1A could facilitate the proliferation of HCC cells, thereby promoting HCC growth and tumor progression, and it may also serve as a potential prognostic factor in HCC.
Materials and methods
Clinical samples and cell lines
All HCC tissues and matched pericarcinous liver tissues (>2 cm distance of the surgical margin) were collected from pathologically confirmed patients with HCC who had undergone liver resection at the First Affiliated Hospital of Xi’an Jiaotong University. None of the patients had received preoperative chemotherapy, radiotherapy, or radiofrequency ablation, and the patients with the evidence of concomitant extrahepatic disease were excluded from this study. All the patients enrolled in this study provided written informed consent before surgery, and all protocols were approved by the ethics committee of the First Affiliated Hospital of Xi’an Jiaotong University as instructed by the 1975 Declaration of Helsinki. HCC stages were assigned according to the seventh edition of the tumor–node–metastasis (TNM) classification criteria of the International Union Against Cancer. Tumor cellular differentiation was assessed using Edmondson’s classification. The clinicopathological data are shown in Table 1.
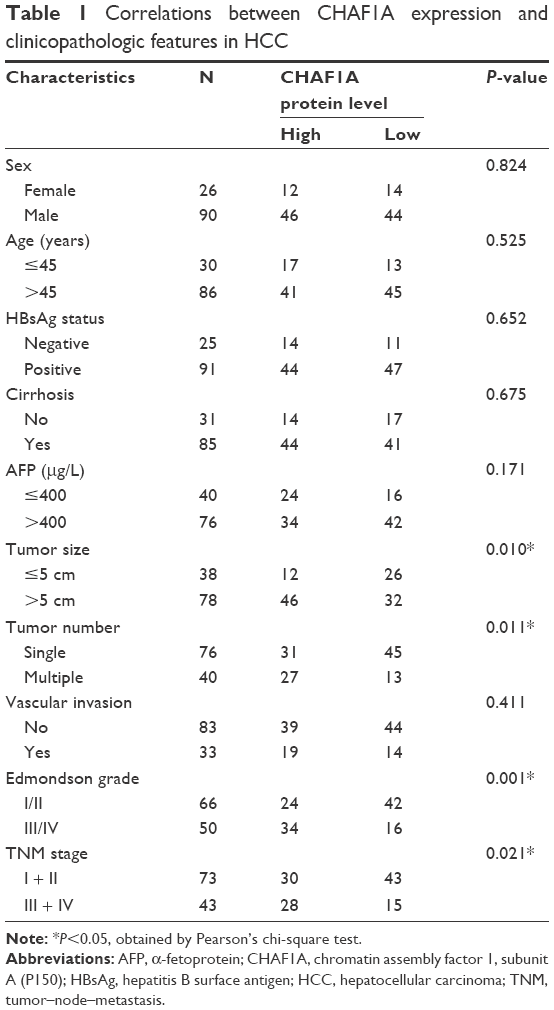 | Table 1 Correlations between CHAF1A expression and clinicopathologic features in HCC |
Cell lines including LO2, Huh7, Hep3B, HepG2, MHCC-97H, and SMMC-7721 were purchased from the Institute of Biochemistry and Cell Biology, Chinese Academy of Sciences (Shanghai, People’s Republic of China). All the abovementioned cells were grown in Dulbecco’s Modified Eagle’s Medium (Thermo Fisher Scientific, Waltham, MA, USA) that contained 10% fetal bovine serum (Thermo Fisher Scientific) supplemented with 100 U/mL penicillin and 100 μg/mL streptomycin (Sigma-Aldrich Co., St Louis, MO, USA). All cells were cultured in 10 mL of medium at 37°C in a humidified atmosphere of 5% CO2.
Quantitative real-time polymerase chain reaction
The following primers were used: CHAF1A (forward 5′-GGAGCAGGACAGTTGGAGTG-3′; reverse, 5′-GACGAATGGCTGAGTACAGA-3′) and β-actin (forward 5′-GGGAAATCGTGCGTGACAT-3′; reverse 5′-CTGGAAGGTGGACAGCGAG-3′). Total RNA was isolated using the RNeasy Kit from Qiagen NV (Venlo, the Netherlands). The product of cDNA synthesis was carried out using the High-Capacity cDNA Reverse Transcription Kit from Thermo Fisher Scientific. Polymerase chain reaction (PCR) amplification for the quantification of the product was performed using an ABI PRISM 7300 Sequence Detection System (Thermo Fisher Scientific) and an SYBR® Premix Ex Taq™ II (Perfect Real Time) Kit (Takara Bio, Shiga, Japan). Each reaction was performed in triplicate. β-Actin was regarded as internal control, and the relative mRNA expression was calculated by the 2−ΔΔCt comparative method.
Immunoblotting
The following primary antibodies were used in the Western blot assays: rabbit monoclonal CHAF1A (ab126625, 1:1,000; Abcam) and mouse monoclonal β-actin (sc-47778, 1:1,000; Santa Cruz Biotechnology Inc., Dallas, TX, USA) antibody. The steps for Western blotting were followed as described earlier.21 Protein samples were separated by denaturing gel electrophoresis and then transferred to polyvinylidene fluoride membrane; blots were probed overnight with the primary antibodies. Blots were incubated with horseradish peroxidase-conjugated goat anti-rabbit secondary antibodies (111-035-003; Jackson ImmunoResearch), and goat anti-mouse secondary antibodies (115-035-003) were used at a 1:5,000 dilution followed by washing three times with tris-buffered saline and tween 20. The signals on band were visualized using the HyGLO HRP Detection Kit from Denville (Metuchen, NJ, USA).
Immunohistochemical staining
Immunohistochemistry (IHC) was performed on paraformaldehyde-fixed paraffin sections. The following antibodies were used in IHC along with a streptavidin peroxidase conjugate: rabbit CHAF1A (ab126625, 1:100; Abcam) and Ki-67 (ab15580, 1:200; Abcam) antibodies, and a rabbit secondary antibody kit (SV0002; Boster Biotechnology) was applied. The IHC steps were performed as reported earlier.23 After all steps were completed, IHC staining was scored independently in a blinded situation by two experienced pathologists. A semiquantitative scoring system based on the product of staining intensity and together with the percentage of positive liver cells was applied in this study. Immunostaining intensity was evaluated as the following four grades: 0, negative; 1, weak; 2, moderate; 3, strong, and the percentage of positive cells was categorized into the following groups: 0, 0%; 1, 1%–10%; 2, 11%–50%; 3, 51%–80%; and 4, >80%. The immunostaining intensity and average percentage of positive cells were evaluated for ten high independent magnification fields. Then, the final weighed expression score was obtained (0–12) after multiplying the staining intensity by the percentage of positive cells.
Immunofluorescence
Briefly, HCC cells were fixed with 100% methanol for 5 minutes and permeabilized using 0.3% Triton X-100 for 15 minutes, then the slides were incubated in blocking buffer (5% bovine serum albumin) for 1 hour at 37°C, and they were incubated with mouse monoclonal Ki-67 (ab6526, 1:200; Abcam) antibodies at 4°C overnight. The next day, the slides were washed three times with phosphate-buffered saline and then incubated with Alexa Fluor® 488 AffiniPure Goat Anti-Mouse secondary antibodies (Yeasen, Shanghai, People’s Republic of China) at room temperature for 60 minutes. Finally, the slides were washed with phosphate-buffered saline after 4′,6-diamidino-2-phenylindole (DAPI) staining for 10 minutes. Fluorescence images were captured by fluorescence microscope (Carl Zeiss Meditec AG, Jena, Germany).
RNAi transfections
The following RNAi target sequence (CHAF1A-shRNA sequence, 5′-CCGACTCAATTCCTGTGTAAA-3′) was used to knockdown CHAF1A expression, and the nontarget shRNA sequence; 5′-TTCTCCGAACGTGTCACGT-3′ was applied as a negative control (Qiagen NV). The CHAF1A-shRNA and negative control shRNA plasmids were transfected into HCC cells using Lipofectamine 2000 (Thermo Fisher Scientific). Stably transfected cell clones were selected and enriched by the limited dilution method and then used in subsequent experiments. CHAF1A clone expressions were confirmed using quantitative PCR (qPCR) and Western blot analysis.
Cell proliferation detection
HCC cells were seeded into 96-well plates at a density of 5,000 cells/well for 24 hours, and the status of cell proliferation was assessed using a 5-bromodeoxyuridine (BrdU) (chemiluminescent; Hoffman-La Roche Ltd., Basel, Switzerland) cell proliferation enzyme-linked immunosorbent assay method. The 3-(4,5-dimethylthiazol-2-yl)-2,5-diphenyltetrazolium bromide (MTT) assay was also applied to assess cell viability at 0 hour, 24 hours, 48 hours, and 72 hours. The absorbance was measured at 490 nm using a Multifunction Microplate Reader (POLARstar OPTIMA; BMG, Offenburg, Germany). To evaluate the colony-formation ability, cells were resuspended and seeded onto six-well plates at a density of 3,000 cells/well and incubated for 2 weeks. After fixation, colonies were stained with 0.5% crystal violet. Colonies were then counted and photographed. The tests were independently performed in triplicates. For cell cycle analysis, collected cells were stained with 50 μg/mL propidium iodide (Sigma-Aldrich Co.) staining solution containing 100 μg/mL RNAse, following which the cells were fixed in ice-cold 70% ethanol at 4°C for at least 2 hours. Triplicate samples containing at least 1×10⁵ cells each were subjected to flow cytometry.
Cell apoptosis detection
We performed several distinct assessments to get the convincing results of cell apoptosis. First, cell apoptosis was measured by fluorescence microscopy to identify apoptotic nuclear changes (chromatin condensation and nuclear fragmentation) after staining cells with DAPI. Then, the caspase 3/7 activity assay was performed by using an Apo-ONE® Homogeneous Caspase-3/7 assay (Promega Corporation, Fitchburg, WI, USA), as described in our earlier study.24 Finally, an Annexin-V-FLUOS Staining Kit (Hoffman-La Roche Ltd.) was used to evaluate the level of apoptosis.
Tumorigenicity in nude mice
A nude mouse xenograft model was established by using 5-week-old female BALB/c nude mice (Centre of Laboratory Animals, The Medical College of Xi’an Jiaotong University, Xi’an, People’s Republic of China). Mice were housed in two sterilized cages at a constant temperature and humidity and bred under a specific pathogen-free condition. All mice were randomly assigned to two groups and were inoculated subcutaneously into the flank of each nude mouse with 5×10⁶ Hep3B cells. Tumor size was measured every 5 days from day 1 to 21 after implantation. Mice were sacrificed on the 21st day after inoculation, and their tumor volumes were measured. The tumor volumes were calculated by the following formula:
Volume = Width2 × Length ×0.5 | (1) |
The xenograft tumor tissue was explanted for routine pathological examination. All animal protocols were approved by the Institutional Animal Care and Use Committee of Xi’an Jiaotong University and the animal care guidelines of the Institutional Animal Care and Use Committee of Xi’an Jiaotong University were followed.
Furthermore, Ki-67 staining was used to evaluate tumor growth, and a terminal deoxynucleotidyl transferase-mediated nick end labeling (TUNEL) assay kit (4810-30-K; R&D Systems, Inc., Minneapolis, MN, USA) was used to detect the effect of apoptosis on the isolated tumor tissues according to the manufacturer’s guidelines.
Follow-up
The follow-up time ranged from 7 months to 70 months, and the median was 47.5 months. All patients were followed up once every 1–3 months in the first year and every 3–6 months thereafter. The following follow-up methods were used: physical examination, serum α-fetoprotein level, chest X-ray, and abdominal ultrasonography. Computed tomography and/or magnetic resonance imaging and/or positron emission tomography were performed to clarify whether tumor recurrence had emerged. Intrahepatic recurrence or distant tumor metastasis detected only by imaging techniques after surgical operation was designated as tumor recurrence. During the duration of follow-up, 75 patients were found with intrahepatic tumor recurrence and 19 patients developed distant tumor metastases. The demographic features and clinicopathological data are presented in Table 1.
Statistical analysis
All data are presented as mean and standard errors of the mean. To assess the association between ordinal data, SPSS 20.0 statistical software (IBM Corporation, Armonk, NY, USA) and GraphPad Prism 5 software (GraphPad Software, Inc., La Jolla, CA, USA) were used for Pearson’s chi-square tests, multivariant Cox regression analysis, two-tailed Student’s t-test, Kaplan–Meier plot, log-rank test, Pearson’s correlation coefficient analysis, or an analysis of variance (ANOVA). P<0.05 was considered to be of statistical significance.
Results
Elevated expression of CHAF1A in HCC tissues and cells
We first examined tumor tissues and adjacent liver tissues from 116 patients with HCC for CHAF1A expression by IHC. We found strong CHAF1A nuclear staining in the tumor cell. In addition, CHAF1A scored higher in tumor cells when compared with benign tissues (P<0.01; Figure 1A). To confirm the presence of abnormal CHAF1A expression, total protein and RNA were also extracted from the abovementioned samples and analyzed by Western blotting and qPCR, respectively. In agreement with the IHC results, CHAF1A mRNA and protein expression levels in matched adjacent noncancerous liver tissues were obviously lower than that in HCC tissues (P<0.01, respectively; Figure 1B and C). We further tested the expression of CHAF1A in HCC cell lines (Huh7, Hep3B, HepG2, MHCC-97H, and SMMC-7721) and a normal hepatocyte cell line LO2 using quantitative real-time PCR and immunoblot analysis. Both the mRNA and protein expression levels of CHAF1A in HCC cell lines were significantly higher than that in LO2 cells (P<0.01, respectively; Figure 1D and E). These data indicated that CHAF1A expression is elevated in both HCC tissues and cells.
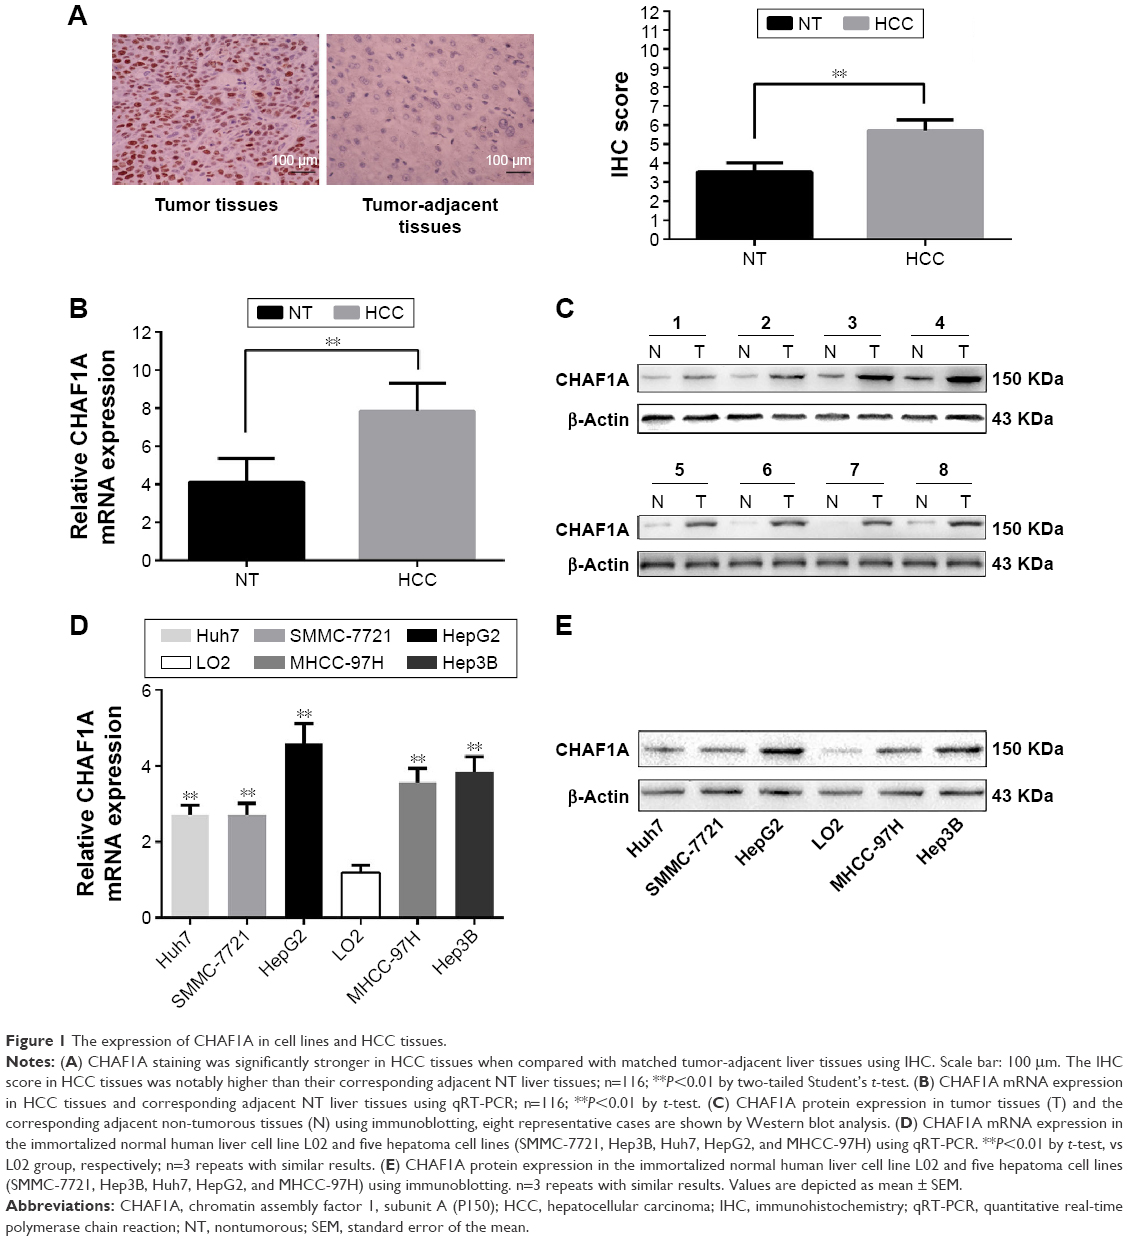 | Figure 1 The expression of CHAF1A in cell lines and HCC tissues. |
Correlation between CHAF1A and HCC clinicopathologic characteristics
The correlation between the upregulated expression of CHAF1A and clinicopathological features was next investigated in 116 HCC cases. The median expression score of CHAF1A protein normalized to β-actin and analyzed by immunoblotting was used as the cutoff point to divide the patients into low- and high-expression groups. Accordingly, a significant relationship was observed between CHAF1 expression, Edmondson–Steiner grade, tumor number, tumor size, and TNM stage (P<0.05). However, the expression of CHAF1A was not associated with other factors (P>0.05, respectively). The results are listed in Table 1.
High expression of CHAF1A correlates with a worse prognosis of HCC
Furthermore, univariate prognostic analysis and multivariate Cox regression models were established to evaluate the effect of CHAF1A on overall and disease-free survival. The patients with high-expression level of CHAF1A protein had a significant reduction in overall and disease-free survival. The 5-year overall survival rate of the low-expression CHAF1A group was 59.1%, which was significantly higher than that of another group (32.0%, P=0.001; Figure 2A). The 5-year disease-free survival rate of the low-expression group was 44.1%, which was also higher than the high-expression group (19.3%, P<0.001; Figure 2B). Meanwhile, the associations of overall and disease-free survival with clinicopathological characteristics in the HCC tissues were assessed by univariate analysis. The univariate analysis showed that tumor number, vascular infiltration, Edmonson–Steiner classification, TNM stage, and the protein expression level of CHAF1A were all the prognosis factors for HCC (the results are listed in Table 2). Furthermore, the multivariate analysis showed that the expression of CHAF1A was significantly associated with the overall (hazard ratio [HR] 1.879; 95% CI, 1.035–3.414; P=0.038) and disease-free survival (HR 2.058; 95% CI, 1.221–3.468; P=0.007; Table 3). These data indicated that CHAF1A was an independent prognosis factor of HCC.
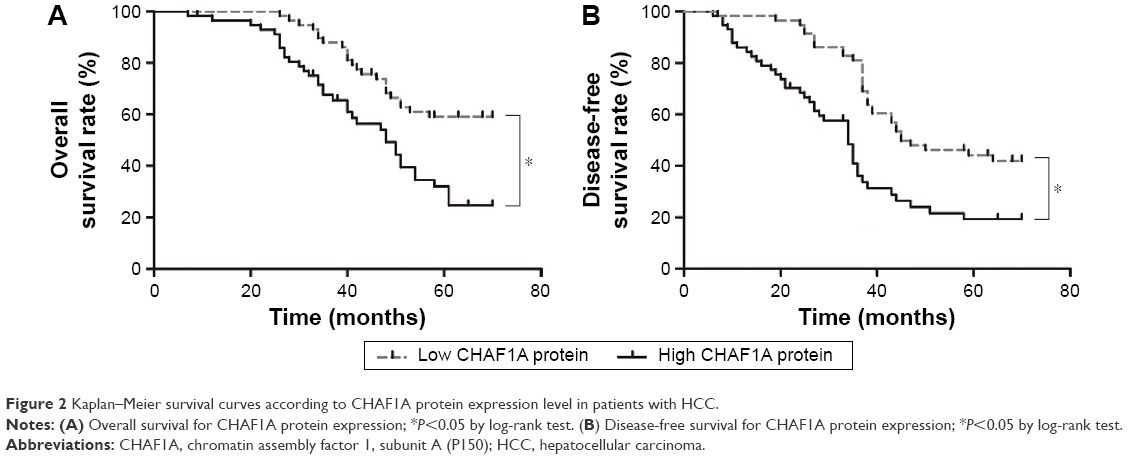 | Figure 2 Kaplan–Meier survival curves according to CHAF1A protein expression level in patients with HCC. |
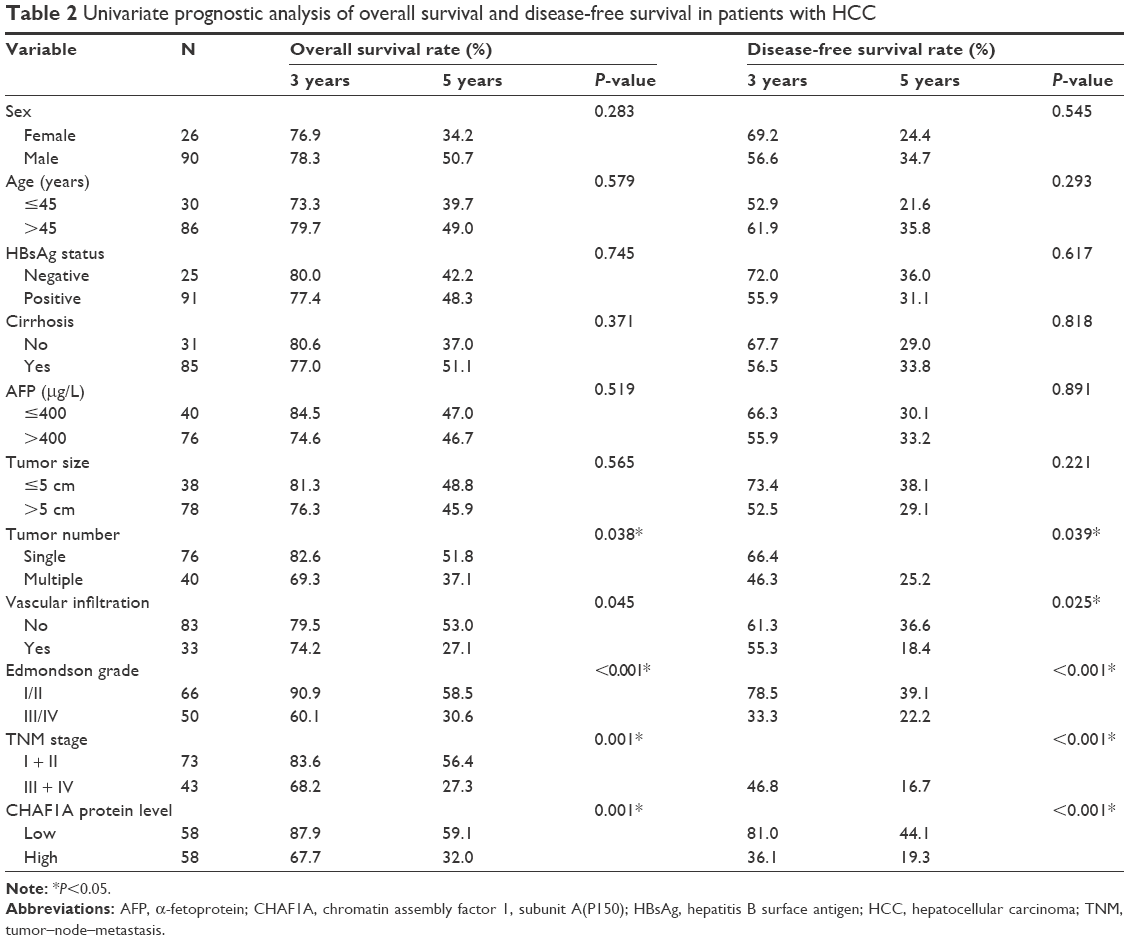 | Table 2 Univariate prognostic analysis of overall survival and disease-free survival in patients with HCC |
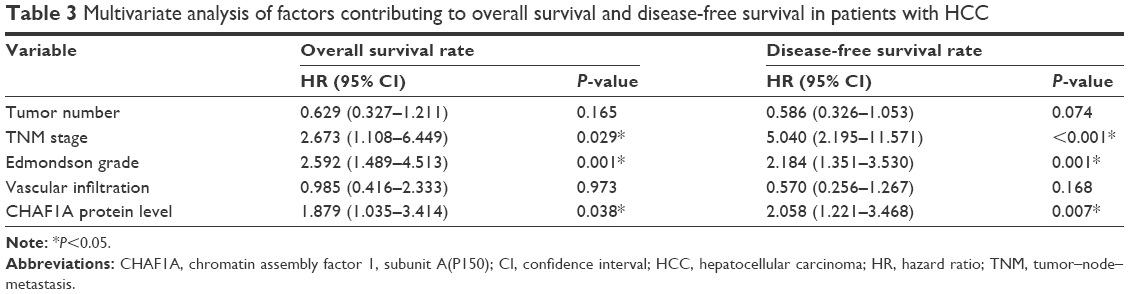 | Table 3 Multivariate analysis of factors contributing to overall survival and disease-free survival in patients with HCC |
Knockdown of CHAF1A inhibits proliferation
As shown in Figure 1D and E, HepG2 and Hep3B cells exhibited the higher mRNA and protein levels of CHAF1A than other cells. Therefore, Hep3B and HepG2 cells were selected in subsequent CHAF1A knockdown experiment. To determine the effect of CHAF1A on the cell proliferation of HCC cells, we silenced CHAF1A expression in HepG2 and Hep3B cells using CHAF1A shRNA. Both the mRNA and protein expression levels of CHAF1A were downregulated after treating the HepG2 and Hep3B cells with CHAF1A shRNA (P<0.01, respectively; Figure 3A and B). Meanwhile, BrdU and MTT assays were performed to determine the effect of altering CHAF1A expression level on tumor cell proliferation and viability, respectively. As expected, after CHAF1A knockdown, HepG2 and Hep3B cells exhibited a reduction in proliferating cells by using BrdU incorporation enzyme-linked immunosorbent assay (P<0.01, respectively; Figure 3C). The results of MTT assay also showed that knockdown of CHAF1A inhibited cell growth of HepG2 and Hep3B cells (P<0.01, respectively; Figure 3D). Moreover, 3,000 treated log-phase cells were suspended and then plated onto six-well plates to evaluate colony-formation ability. Cells were cultured in an incubator for 2 weeks. Following fixation and staining with crystal violet, the colonies were counted and photographed. The colony number of control groups was much more than the CHAF1A knockdown groups (P<0.05, respectively; Figure 3E). Consistent with the abovementioned results, the expression of Ki-67 which was well known as a proliferation marker in the CHAF1A knockdown groups was significantly decreased, where it was verified by immunofluorescence staining (Figure 3F). Flow cytometry analysis of cell cycle showed that cells lacking CHAF1A accumulated increased S-phase DNA content compared with negative control cells (P<0.01, respectively; Figures 3G and S1). Collectively, these data suggested that CHAF1A knockdown significantly suppressed HCC cell proliferation.
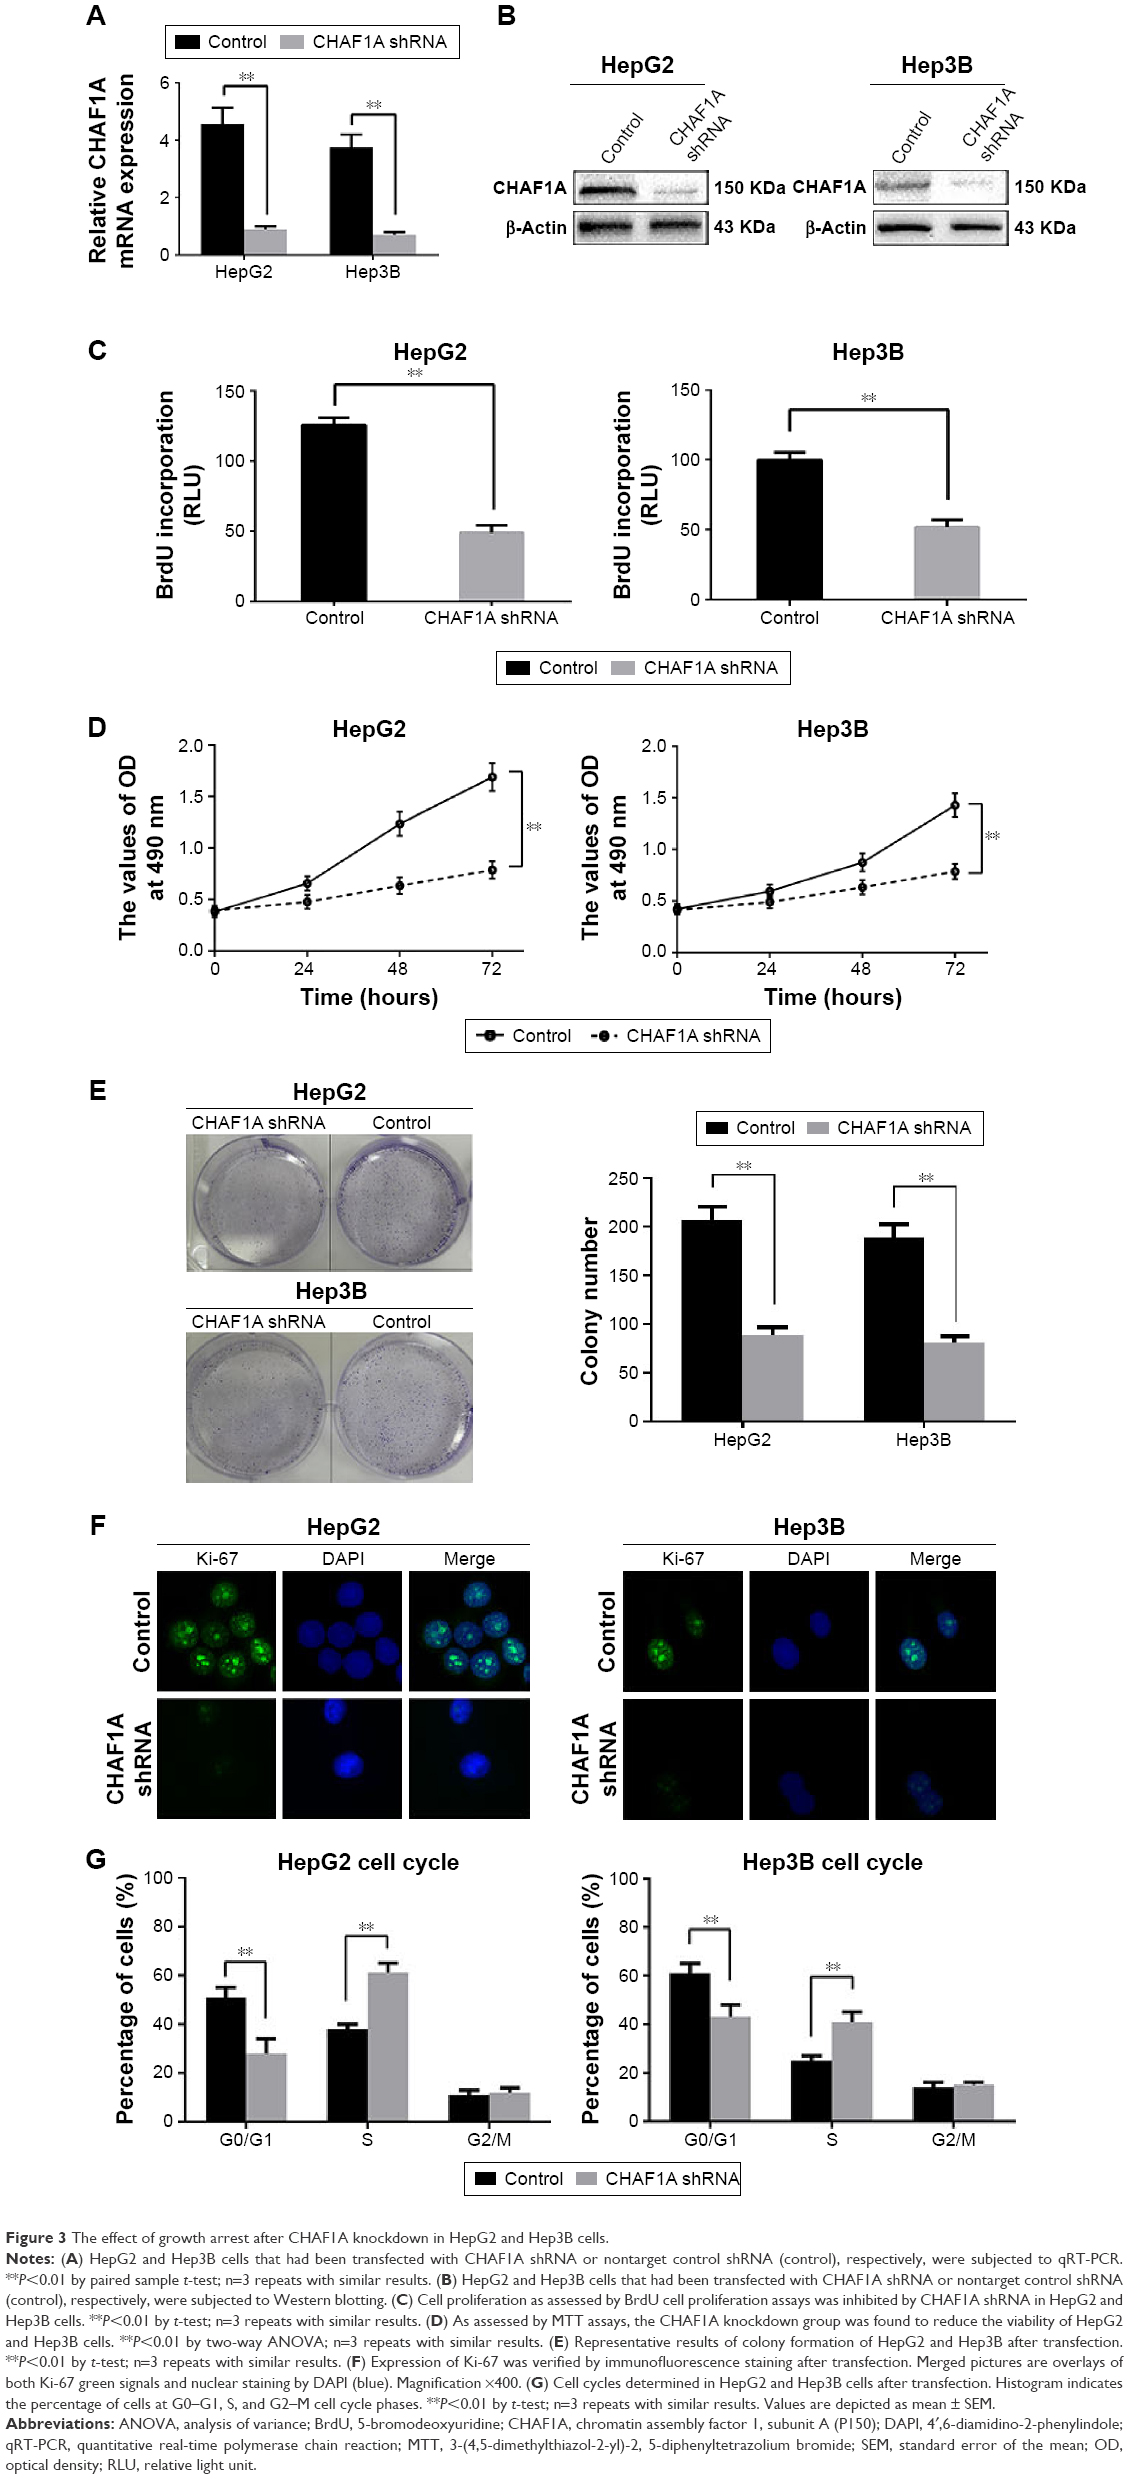 | Figure 3 The effect of growth arrest after CHAF1A knockdown in HepG2 and Hep3B cells. |
Silencing the expression of CHAF1A induces HCC cells apoptosis
We also silenced CHAF1A expression in HepG2 and Hep3B cells to further determine the effect of CHAF1A knockdown on the cell apoptosis of HCC cells. First, cell apoptosis was measured by fluorescence microscopy to identify apoptotic nuclear changes (chromatin condensation and nuclear fragmentation) after cells were stained with DAPI. The percentages of DAPI staining cells in the HepG2 and Hep3B RNAi groups were significantly lower than those in the control groups (P<0.01, respectively; Figure 4A). Meanwhile, Caspase 3/7 activity of Hep3B and HepG2 cells was remarkably increased after knockdown of CHAF1A (P<0.01, respectively; Figure 4B). Finally, flow cytometry assay also showed that the percentage of apoptosis cells in the HepG2 and Hep3B knockdown groups was obviously more than that of the control groups (P<0.01; Figure 4C and D). Altogether, our data indicated that the downregulated CHAF1A induced HCC cell apoptosis.
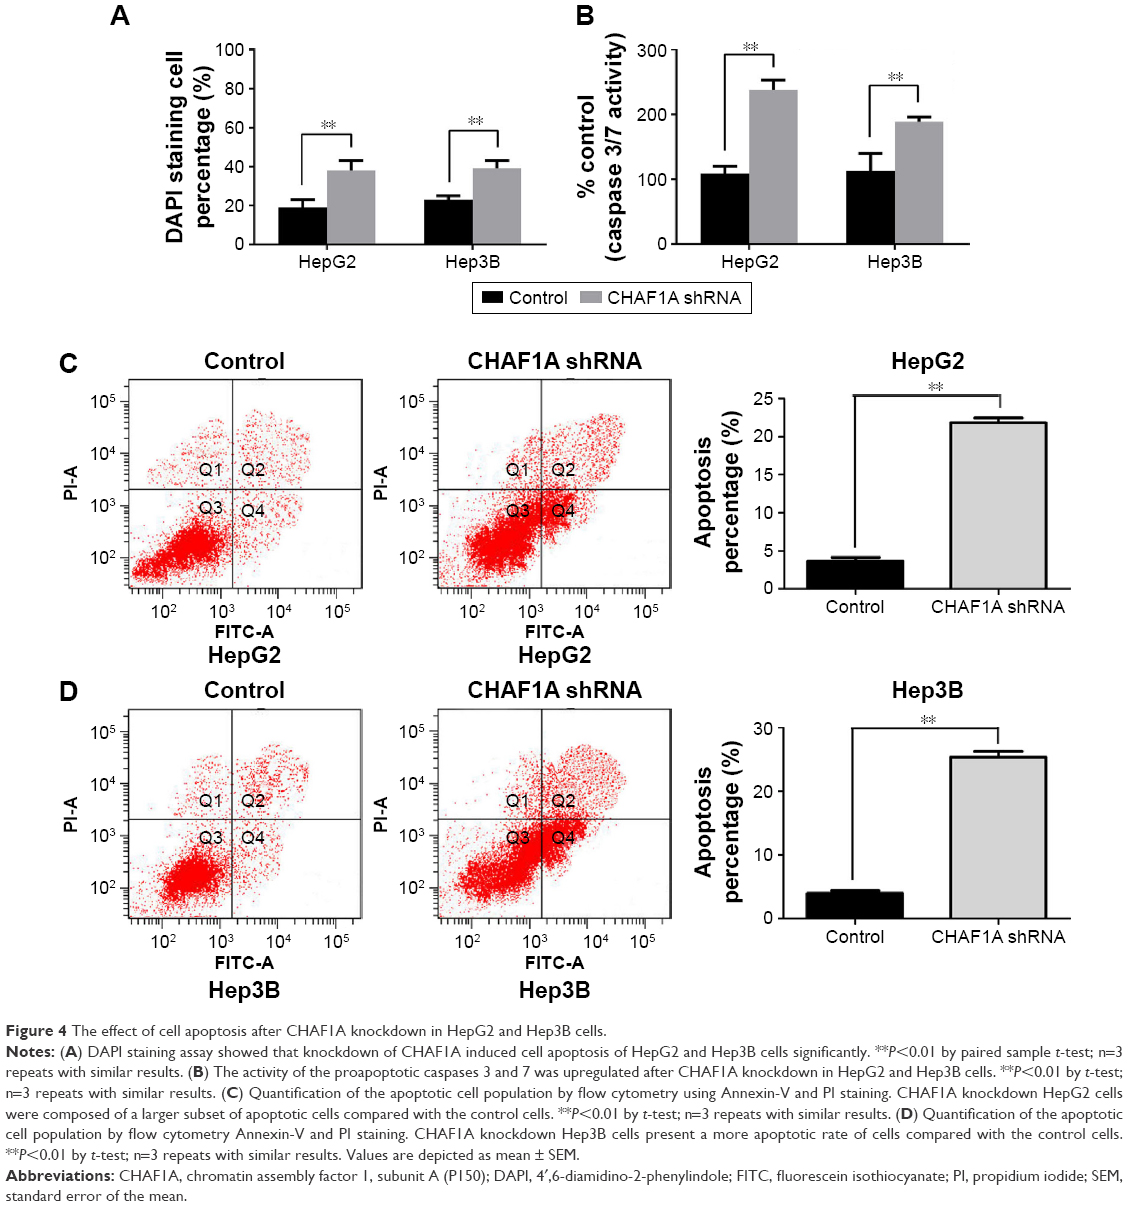 | Figure 4 The effect of cell apoptosis after CHAF1A knockdown in HepG2 and Hep3B cells. |
Silencing the expression of CHAF1A inhibits tumor growth in HCC xenograft model
Based on the evidences showing that CHAF1A knockdown promotes cell apoptosis and inhibits cell growth in vitro, we inferred that CHAF1A could promote HCC progression in vivo. To elucidate the role of CHAF1A in HCC tumorigenicity in vivo, CHAF1A-shRNA-treated Hep3B cells were subcutaneously implanted into nude mice. The growth index of CHAF1A-shRNA-treated tumors distinctly reduced compared with that of the control group (Figure 5A). Specifically, the average tumor size of CHAF1A knockdown tumors was significantly smaller than that in the control group (P<0.01; Figure 5B). We performed IHC for CHAF1A and Ki-67 as well as TUNEL assays in the xenografted tissues to confirm the effect of CHAF1A in vivo. Silencing the expression of CHAF1A exerted an inhibiting effect on HCC growth, leading to a significant increase in apoptotic cells and reduction in the number of Ki-67-positive staining cells, which is consistent with our findings in vitro (P<0.01, respectively; Figure 5C).
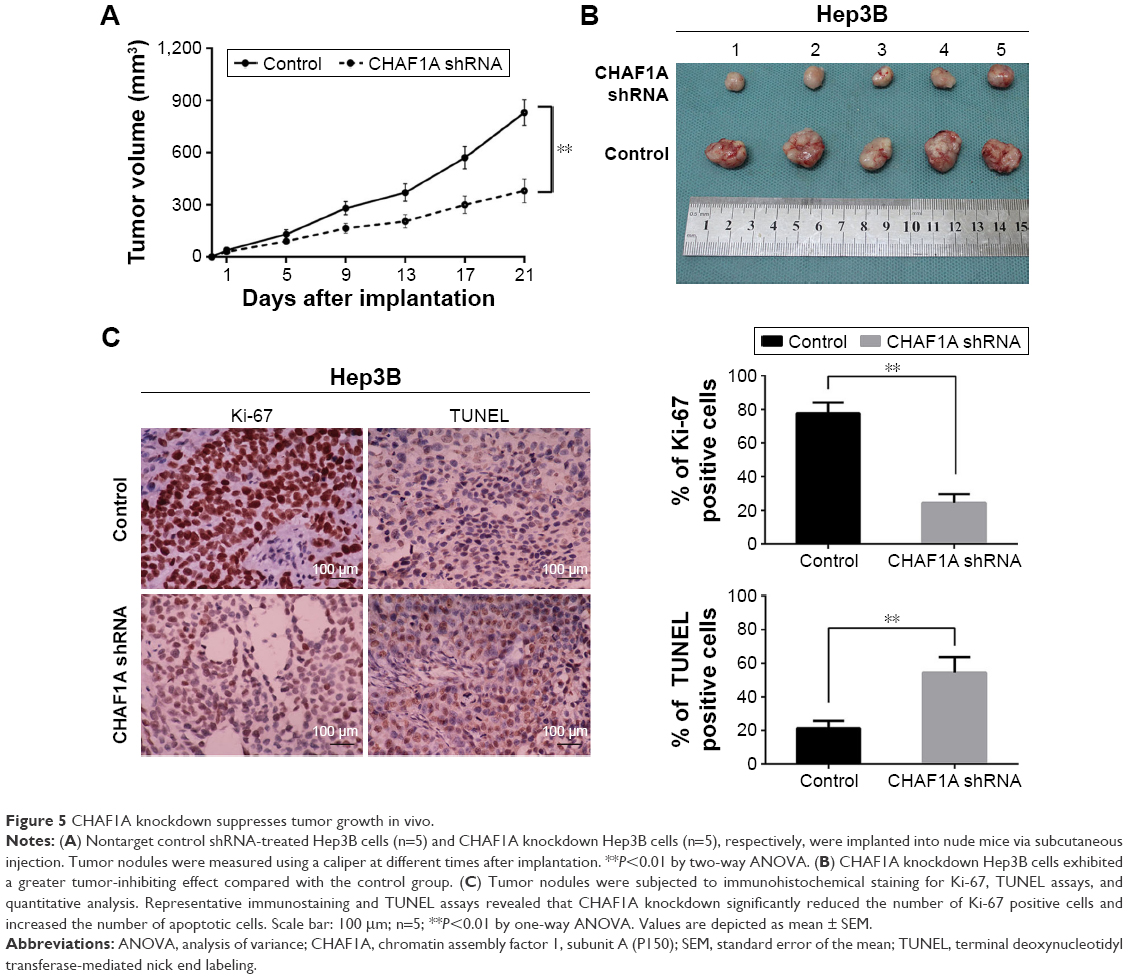 | Figure 5 CHAF1A knockdown suppresses tumor growth in vivo. |
Discussion
HCC is one of the most prevalent causes of cancer deaths due to its high recurrence rate and increasing incidence in the world.6 Moreover, most patients with HCC are diagnosed at the advanced stage and have limited chance to receive curative treatments because of lack of specific biomarkers to predict HCC in the early stage. Although in recent years, targeted therapy has shown encouraging outcomes for many tumors, including HCC, determining the pathogenesis and the molecular mechanisms underlying the development of HCC and developing novel biology markers are still urgently needed for patients with HCC.
In our study, we found that the overexpression of CHAF1A was significantly correlated with the overall and disease-free survival in patients with HCC. The study also provided us evidences that CHAF1A played important roles in promoting tumorigenesis and progression by facilitating HCC cell proliferation. Based on our findings, we believe that the overexpression of CHAF1A is mainly caused by the tumor cell endogenous genetic mutations, and the abnormal expression of CHAF1A will lead to the dysregulated DNA damage checkpoints or the inappropriate assembling of nucleosomes influencing the replication of DNA and subsequently contributes to the progression of HCC although the accurate mechanism is not well clarified. There are some limitations in this study that need to be further considered. First, we analyzed only the effects of CHAF1A knockdown in HCC cells. More cancer cell lines should also be assessed other than the mentioned HCC cell lines. Second, the effects of CHAF1A overexpression should also be evaluated to further validate its function in HCC. Third, the accurate mechanism was not further examined in this study.
Conclusion
Overall, we inferred that overexpression of CHAF1A contributes to the progression of HCC, potentially mediating cell proliferation, and we could hypothesize that CHAF1A may function as a clinical biomarker and a therapeutic target in HCC, as well.
Acknowledgments
This study was supported by grants from the National Natural Science Foundation of China (No 81272645, 81402039, 81502092, and 81572847) and the Natural Science Basic Research Plan in Shaanxi Province of People’s Republic of China (No 2016JQ8047). The authors thank all the patients who participated in this study.
Disclosure
The authors report no conflicts of interest in this work.
References
Siegel RL, Miller KD, Jemal A. Cancer statistics, 2015. CA Cancer J Clin. 2015;65(1):5–29. | ||
Are C, Rajaram S, Are M, et al. A review of global cancer burden: trends, challenges, strategies, and a role for surgeons. J Surg Oncol. 2013;107(2):221–226. | ||
Jemal A, Bray F, Center MM, Ferlay J, Ward E, Forman D. Global cancer statistics. CA Cancer J Clin. 2011;61(2):69–90. | ||
Parkin DM, Bray FI, Devesa SS. Cancer burden in the year 2000. The global picture. Eur J Cancer. 2001;37(Suppl 8):S4–S66. | ||
El-Serag HB, Davila JA, Petersen NJ, McGlynn KA. The continuing increase in the incidence of hepatocellular carcinoma in the United States: an update (vol 139, pg 817, 2003). Ann Intern Med. 2004;140(10):151. | ||
Roberts LR, Gores GJ. Hepatocellular carcinoma: molecular pathways and new therapeutic targets. Semin Liver Dis. 2005;25(2):212–225. | ||
Thomas RM, Liarski V, Tsiagbe VK, Haleem K, Thorbecke GJ. Role of chromatin structure change and demethylation of the MMTV env transcription activator (META) in the expression of mammary tumor provirus (Mtv29) encoded superantigen (vSAg29) by SJL/J mouse lymphomas. FASEB J. 2002;16(5):A1201. | ||
Kadyrova LY, Blanko ER, Kadyrov FA. CAF-I-dependent control of degradation of the discontinuous strands during mismatch repair. Proc Natl Acad Sci U S A. 2011;108(7):2753–2758. | ||
Doyen CM, Moshkin YM, Chalkley GE, et al. Subunits of the histone chaperone CAF1 also mediate assembly of protamine-based chromatin. Cell Rep. 2013;4(1):59–65. | ||
Takami Y, Ono T, Fukagawa T, Shibahara K, Nakayama T. Essential role of chromatin assembly factor-1-mediated rapid nucleosome assembly for DNA replication and cell division in vertebrate cells. Mol Biol Cell. 2007;18(1):129–141. | ||
Hoek M, Stillman B. Chromatin assembly factor 1 is essential and couples chromatin assembly to DNA replication in vivo. Proc Natl Acad Sci U S A. 2003;100(21):12183–12188. | ||
Verreault A, Kaufman PD, Kobayashi R, Stillman B. Nucleosome assembly by a complex of CAF-1 and acetylated histones H3/H4. Cell. 1996;87(1):95–104. | ||
Reese BE, Bachman KE, Baylin SB, Rountree MR. The methyl-CpG binding protein MBD1 interacts with the p150 subunit of chromatin assembly factor 1. Mol Cell Biol. 2003;23(9):3226–3236. | ||
Tchenio T, Casella JF, Heidmann T. A truncated form of the human CAF-1 p150 subunit impairs the maintenance of transcriptional gene silencing in mammalian cells. Mol Cell Biol. 2001;21(6):1953–1961. | ||
Smith CL, Matheson TD, Trombly DJ, et al. A separable domain of the p150 subunit of human chromatin assembly factor-1 promotes protein and chromosome associations with nucleoli. Mol Biol Cell. 2014;25(18):2866–2881. | ||
Wu ZH, Cui FF, Yu FD, et al. Up-regulation of CHAF1A, a poor prognostic factor, facilitates cell proliferation of colon cancer. Biochem Biophys Res Commun. 2014;449(2):208–215. | ||
Barbieri E, De Preter K, Capasso M, et al. Histone chaperone CHAF1A inhibits differentiation and promotes aggressive neuroblastoma. Cancer Res. 2014;74(3):765–774. | ||
Glinsky GV, Glinskii AB, Stephenson AJ, Hoffman RM, Gerald WL. Gene expression profiling predicts clinical outcome of prostate cancer. J Clin Invest. 2004;113(6):913–923. | ||
Barbieri E, De Preter K, Capasso M, et al. A p53 drug response signature identifies prognostic genes in high-risk neuroblastoma. PLoS One. 2013;8(11):e79843. | ||
Bethke L, Webb E, Murray A, et al. Comprehensive analysis of the role of DNA repair gene polymorphisms on risk of glioma. Hum Mol Genet. 2008;17(6):800–805. | ||
Peng H, Du B, Jiang H, Gao J. Over-expression of CHAF1A promotes cell proliferation and apoptosis resistance in glioblastoma cells via AKT/FOXO3a/Bim pathway. Biochem Biophys Res Commun. 2016;469(4):1111–1116. | ||
Jiao RJ, Bachrati CZ, Pedrazzi G, et al. Physical and functional interaction between the Bloom’s syndrome gene product and the largest subunit of chromatin assembly factor 1. Mol Cell Biol. 2004;24(11):4710–4719. | ||
Liu QQ, Tu KS, Zhang HY, Zheng X, Yao YM, Liu QG. TPX2 as a novel prognostic biomarker for hepatocellular carcinoma. Hepatol Res. 2015;45(8):906–918. | ||
Zheng X, Vittar NB, Gai X, et al. The transcription factor GLI1 mediates TGFbeta1 driven EMT in hepatocellular carcinoma via a SNAI1-dependent mechanism. PLoS One. 2012;7(11):e49581. |
Supplementary material
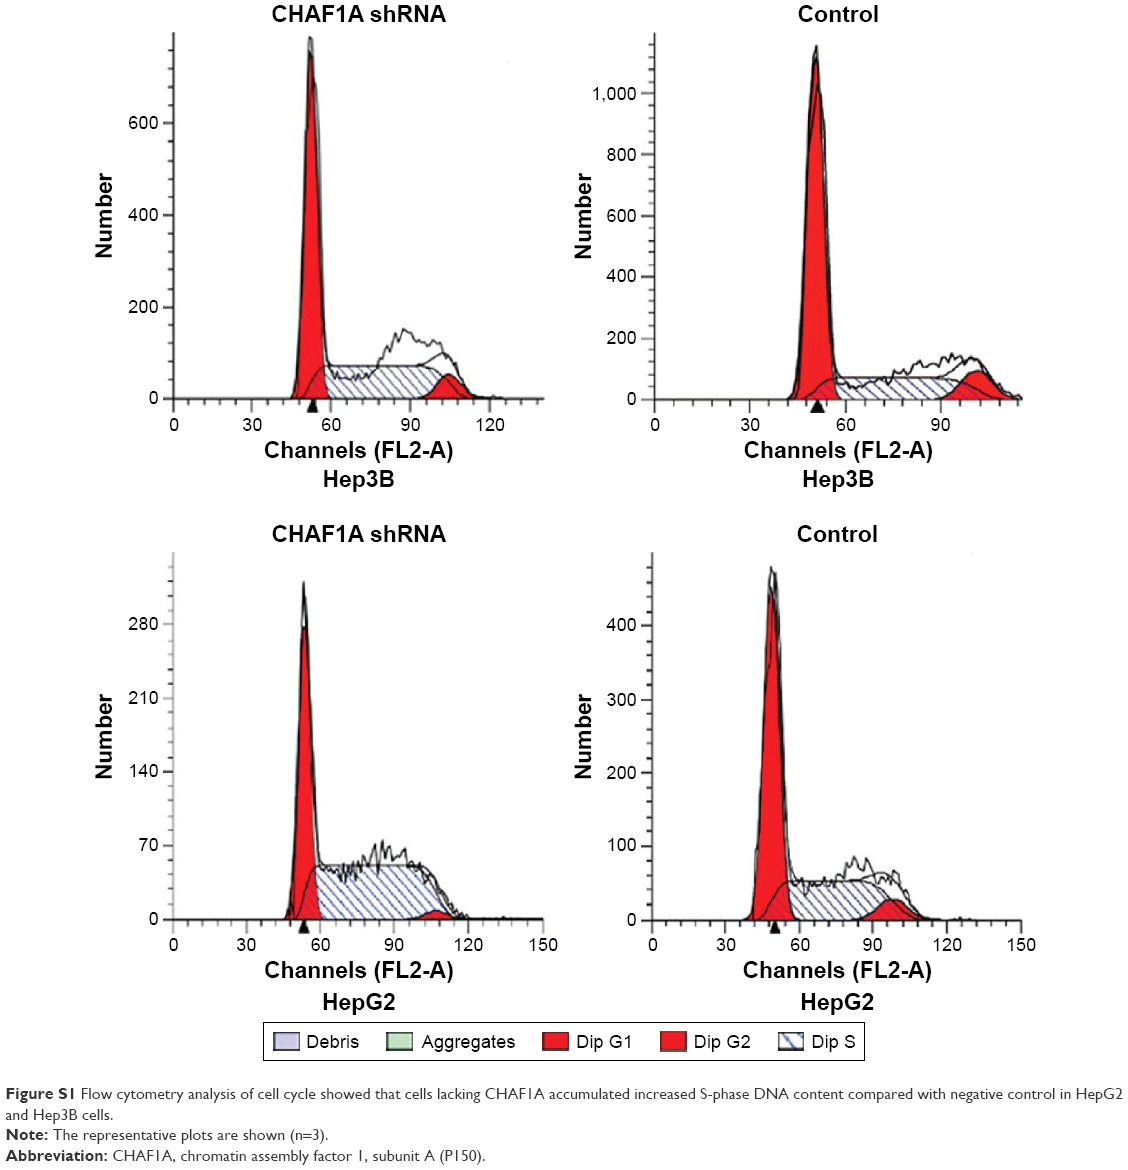 | Figure S1 Flow cytometry analysis of cell cycle showed that cells lacking CHAF1A accumulated increased S-phase DNA content compared with negative control in HepG2 and Hep3B cells. |
 © 2016 The Author(s). This work is published and licensed by Dove Medical Press Limited. The full terms of this license are available at https://www.dovepress.com/terms.php and incorporate the Creative Commons Attribution - Non Commercial (unported, v3.0) License.
By accessing the work you hereby accept the Terms. Non-commercial uses of the work are permitted without any further permission from Dove Medical Press Limited, provided the work is properly attributed. For permission for commercial use of this work, please see paragraphs 4.2 and 5 of our Terms.
© 2016 The Author(s). This work is published and licensed by Dove Medical Press Limited. The full terms of this license are available at https://www.dovepress.com/terms.php and incorporate the Creative Commons Attribution - Non Commercial (unported, v3.0) License.
By accessing the work you hereby accept the Terms. Non-commercial uses of the work are permitted without any further permission from Dove Medical Press Limited, provided the work is properly attributed. For permission for commercial use of this work, please see paragraphs 4.2 and 5 of our Terms.