")
Back to Journals » OncoTargets and Therapy » Volume 13
Chloroquine Combined with Imatinib Overcomes Imatinib Resistance in Gastrointestinal Stromal Tumors by Inhibiting Autophagy via the MAPK/ERK Pathway
Authors Zheng S, Shu Y, Lu Y, Sun Y
Received 4 April 2020
Accepted for publication 5 June 2020
Published 2 July 2020 Volume 2020:13 Pages 6433—6441
DOI https://doi.org/10.2147/OTT.S256935
Checked for plagiarism Yes
Review by Single anonymous peer review
Peer reviewer comments 2
Editor who approved publication: Prof. Dr. Takuya Aoki
Song Zheng,1– 4 Yefei Shu,2 Yidan Lu,2,3 Yangcheng Sun2,4
1Department of Medical Oncology, Key Laboratory of Clinical Cancer Pharmacology and Toxicology Research of Zhejiang Province, Zhejiang University School of Medicine Affiliated Hangzhou First People’s Hospital, Hangzhou, Zhejiang, People’s Republic of China; 2Department of Medical Oncology, Hangzhou Cancer Hospital, Hangzhou, Zhejiang, People’s Republic of China; 3Department of Medical Oncology, Zhejiang Chinese Medical University Affiliated Hangzhou First Hospital, Hangzhou, Zhejiang, People’s Republic of China; 4Department of Medical Oncology, Nanjing Medical University Affiliated Hangzhou First People’s Hospital, Hangzhou, Zhejiang, People’s Republic of China
Correspondence: Song Zheng Email [email protected]
Background: Gastrointestinal stromal tumors (GISTs) are the most common mesenchymal neoplasms of the gastrointestinal tract. However, up to 40– 50% of GISTs develop secondary resistance after an average of 24 months of imatinib treatment. It has been reported that autophagy can promote the survival of GIST cells and induce drug resistance. Presently, the specific mechanism of autophagy in GISTs with imatinib resistance is not clear.
Materials and Methods: The cell-counting kit (CCK)-8 method and flow cytometry were used for in vitro drug sensitivity testing and autophagy level detection. Detection of the apoptosis level was by flow cytometry with the annexin V Kit. Western blotting was used to analyze the role of autophagy and apoptosis in GIST cells with CQ alone, imatinib alone, or in combination, and to analyze MAPK pathway expression. In vitro results were confirmed by in vivo experiments using the mice model. Hematoxylin and eosin and immunohistochemical staining were used to detect the pathological characteristics and immunophenotype of the transplanted tumor. Detection of KIT and PDGFRA gene mutations in the transplanted imatinib-resistant GIST was done by denaturing high performance liquid chromatography (DHPLC) and direct sequencing. ERK and KIT expression and regulation levels were detected by Western blotting.
Results: In vitro and vivo experiments, the autophagy level of imatinib-resistant cells was higher than that of normal cells; CQ combined with imatinib can promote apoptosis by blocking autophagy of imatinib-resistant cells. In the meanwhile, we found that the phosphorylation level of ERK may be related to autophagy.
Conclusion: Our data suggest that autophagy through the MAPK/ERK pathway may play a pivotal role in imatinib-resistant GIST proliferation. Moreover, combining an autophagy inhibitor with imatinib may be a potential valuable strategy in overcoming acquired resistance in GIST patients.
Keywords: autophagy, imatinib-resistant, GISTs, MAPK/ERK pathway
Introduction
Gastrointestinal stromal tumors (GISTs) are the most common mesenchymal neoplasms of the gastrointestinal tract, accounting for 1–3% of all digestive tract tumors and almost 5% of all soft tissue sarcomas.1 With the increase in knowledge and improvement of the level of diagnosis, the incidence of GISTs is increasing year by year. Up to 85% of GISTs acquire mutations in the KIT gene and 3–18% in the platelet-derived growth factor receptor A (PDGFRA) gene.2 GIST responds to treatment with targeted KIT/PDGFRA inhibitors such as imatinib mesylate.3–5 However, up to 40–50% of GISTs develop secondary resistance after an average of 24 months of imatinib treatment. Based on the natural evolution of the disease, the patient could be placed on a higher dose of imatinib or a tyrosine kinase inhibitor such as ripretinib, though resistance can be a challenge.6–8 Resistance to imatinib has been of great interest in recent research.
Autophagy and apoptosis are crucial and fundamental to cancer development.9 It has been reported that autophagy can promote the survival of GIST cells and induce drug resistance.10,11 Moreover, a combination of autophagy inhibitors and imatinib has achieved almost complete remission in the treatment of imatinib-resistant chronic myeloid leukemia.12,13 Inhibition of autophagy synergizes with imatinib to increase GIST cell death and retard the outgrowth of residual GIST viable cells when compared with imatinib alone therapy.14 Combining imatinib and autophagy inhibition is a potentially valuable strategy to promote GIST cytotoxicity and to diminish both cellular quiescence and acquired resistance in GIST patients.15 Presently, the specific mechanism of autophagy in GISTs with imatinib resistance is not clear.
The PI3K/Akt/mTOR and Mitogen Activated Protein Kinase (MAPK) pathways are pivotal for cell growth and differentiation and are frequently hyperactivated during tumorigenesis (Figure 1E).16 MAPK signaling plays a critical role in the balance of apoptosis and autophagy in the response to chemotherapeutic agents.17 Activated MAPK can transmit extracellular signals to regulate cell growth, proliferation, differentiation, migration, apoptosis, etc. Apoptosis and macroautophagy (hereafter referred to as autophagy) can be induced by extracellular stimuli such as treatment with chemotherapeutic agents, resulting in different cell responses to these drugs.
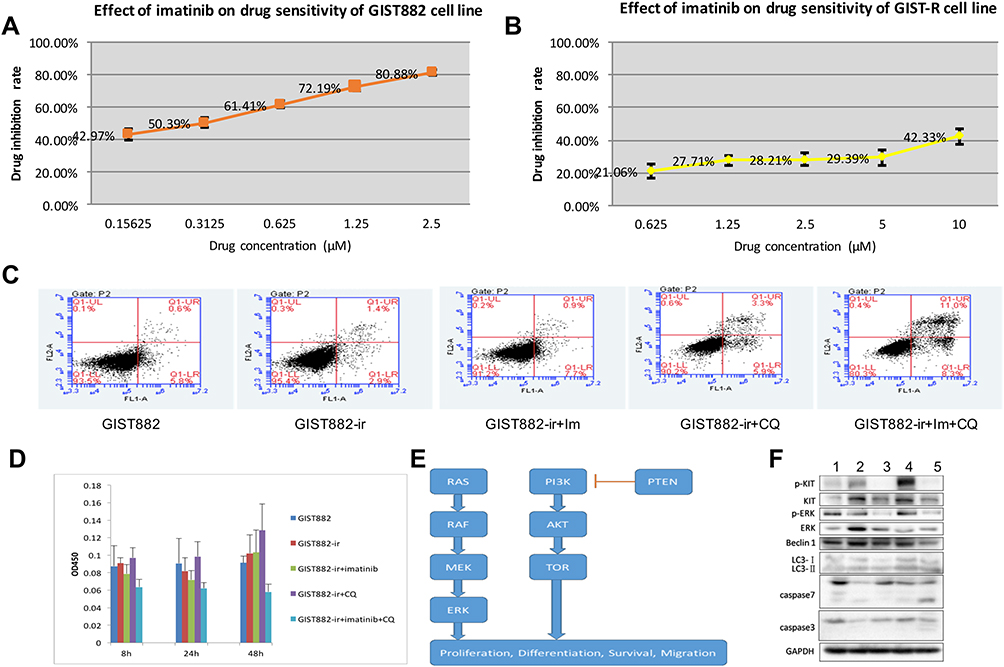 |
Figure 1 (A) Effect of imatinib on drug sensitivity of GIST882 cell line. (B) Effect of imatinib on drug sensitivity of GIST882-ir cell line. (C) Effect of imatinib and chloroquine on apoptosis of GIST882-ir cell line (after 48h). (D) The effects of Imatinib and Chloroquine on cell viability of GIST882-ir strains after 8h, 24h and 48h. (E) The two essential proliferative intracellular signaling pathways, PI3K/Akt/mTOR and MAPK. (F) Five group Western blot results. 1. GIST882, 2. GIST882-ir, 3. GIST882-ir +im, 4. GIST882-ir +CQ, 5. GIST882-ir +im+CQ. |
Our previous research suggests the possibility of activation of the RAS-RAF-MEK-ERK pathways driven by a KIT-independent oncogenic mechanism in GISTs.18 In imatinib-resistant GISTs with both KIT V559D and BRAF V600E mutations, the inhibition of KIT V559D by imatinib caused a strong decrease of AKT phosphorylation, while ERK1/2 phosphorylation was not affected. The detection of alterations in the MAPK pathway in GISTs would be innovative and could be relevant in receptor tyrosine kinase inhibitor resistance or autophagy. Herein, we explored the role of an autophagy inhibitor, chloroquine (CQ) in imatinib-resistant GISTs and elaborated the role of the MAPK/ERK pathway in autophagy inhibition.
Materials and Methods
Materials
GIST882 cell lines, GIST882 imatinib-resistant cell lines, GIST882 cell mice, GIST imatinib-resistant cell mice.
Cell Groups
GIST882: normal control group;
GIST882-ir: imatinib-resistant cell lines;
GIST882-ir +im: imatinib-resistant cell lines + imatinib;
GIST882-ir +CQ: imatinib-resistant cell lines + chloroquine;
GIST882-ir +im+ CQ: imatinib-resistant cell lines + imatinib + chloroquine.
Mice Models
The above imatinib-resistant cell lines and GIST882 were inoculated into nude mice to observe their tumorigenicity. The tumor size, growth rate, and survival time of nude mice were observed.
Forty 4–5 weeks old, 16–18 g, and specific pathogen-free NOD/SCID male mice were purchased from the Shanghai Slyke Laboratory Animal Limited Liability Company (license number: SCXK (Shanghai) 2013–0018, certification number: 0301907). The quality of drinking water was in accordance with the national standard of the People’s Republic of China (GB5749-2006). The license number of the laboratory animal room was SYXK (zhejiang) 2015–0008. The temperature and relative humidity of the feeding environment ranged from 20–25 °C and 40–70%, respectively. The mice acclimated in the animal room for 6 days before the experiment.
All the mice were transformed into subcutaneous xenograft models. Cells of normal or drug-resistant strains of GIST882 in the logarithmic growth stage were collected, prepared into a single-cell suspension, adjusted to 1×10⁸/mL, mixed with Matrigel gel (10 mg/mL, BD Biosciences) of equal proportion. Human fibroblasts in the ratio 1:10,000 were added, mixed, and set aside.
The injected volume was 0.1 mL/animal, and the number of cells in normal or drug-resistant strains containing GIST882 was 5×10⁶/animal. After the injection, there was a protruding cutaneous mound in the right axilla.
The tumor-bearing mice were randomly divided into 5 groups according to the tumor volume when the tumor grew to 100 mm3, i.e., the normal group, imatinib-resistant group, imatinib group, CQ group, and imatinib + CQ group. Five mice were found in each group.
For the imatinib group, imatinib mesylate capsule powder was dissolved in a 15 mg/mL working solution with normal saline. The whole process was done in the dark. The dosage was 150 mg/kg, twice a day for 28 days, and administered by gavage.
For the CQ group, CQ was dissolved in deionized water to give a 6 mg/mL working solution. This was done and stored in the dark. It was injected intraperitoneally at a dose of 60 mg/kg once a day for 28 days.
For the imatinib + CQ group, the dosage of imatinib was 150 mg/kg while that of CQ was 60 mg/kg administered for 28 days.
The normal and imatinib-resistant groups were given the same volume of normal saline for 28 days.
All experiments involving cell lines and animals were approved by the Hangzhou cancer hospital ethical review board. All experiments were performed following the Hangzhou cancer hospital and national guidelines and regulations.
Methods
The cell-counting kit (CCK)-8 method and flow cytometry were used for in vitro drug sensitivity testing and autophagy level detection. Detection of the apoptosis level was by flow cytometry with the annexin V Kit. Western blotting was used to analyze the role of autophagy and apoptosis in GIST cells with CQ alone, imatinib alone, or in combination, and to analyze MAPK pathway expression.
In vitro results were confirmed by in vivo experiments using the mice model. The transplantation model of human GIST resistant to imatinib in nude mice was identified and established. The above-mentioned imatinib-resistant cell lines and GIST882 were inoculated into nude mice to observe their tumorigenicity. The tumor size, growth rate, and survival time of nude mice were observed. Hematoxylin and eosin and immunohistochemical staining were used to detect the pathological characteristics and immunophenotype of the transplanted tumor. Detection of KIT and PDGFRA gene mutations in the transplanted imatinib-resistant GIST was done by denaturing high performance liquid chromatography (DHPLC) and direct sequencing. ERK and KIT expression and regulation levels were detected by Western blotting.
Statistical Methods
The experimental data were expressed as means ± standard deviations ( ). Analysis of variance (ANOVA) and statistical tests were analyzed means of multiple groups in the GraphPad Prism statistical software. First, the data were tested for homogeneity of variance. If the variance was homogeneous, the overall comparison was made using the one-way ANOVA, and the two-way mean comparison method between multiple dose groups and one control group. Abnormal or non-uniform variance data were used for statistics in the rank sum test.
Results
Part One: Cell Groups
The Characteristics of Imatinib-Sensitive GIST882 and GIST882-ir (GIST 882 Imatinib-Resistant) Cells
In this study, the drug concentration gradient method was used to establish the imatinib-resistant GIST (GIST882-ir cell line) from the imatinib-sensitive GIST882 cell line. The half maximal inhibitory concentration (IC50) was measured using the CCK-8 method to judge the sensitivity/resistance of the cell lines to imatinib. The results showed growth of the GIST882 cells was affected to a certain extent under the action of imatinib at a low concentration (0.05 μm), and was significantly affected when it was > 0.1 μm. However, GIST-ir cells had a strong resistance to imatinib. At imatinib concentrations of 0.05–5 μm, there was no significant effect on the growth of GIST-ir cells (Figure 1A and B). GIST-ir cells had an inconsistent morphology; some cells were epithelioid, while others were short fusiform or irregularly shaped.
Secondary mutations of KIT/PDGFRA in GIST cells were the most important contributors to imatinib resistance in GISTs. In GIST-ir cell lines, KIT sequencing results showed no secondary drug resistance mutation. Meanwhile, no mutation was found in PDGFRA sequencing.
Flow cytometry was used to detect apoptosis in four quadrants: Q1-UL (necrotic cells and fragments), Q1-UR (late apoptotic and necrotic cells), Q1-LL (normal cells), and Q1-LR (early apoptotic cells, which could be detected by CCK8). The sum of the Q1-UR and Q1-LR quadrants was used to calculate the apoptosis rate. The detailed results are shown in Figure 1C. After 48 hours, the apoptosis rates of the GIST882 group, the GIST882-ir group, the GIST882-ir+ im group, the GIST882-ir + CQ group, the GIST882-ir +im+ CQ group were 6.4%, 4.3%, 8.6%, 9.2% and 19.3%, respectively.
Imatinib had a weak inhibitory effect on the growth of GIST882-ir cells, while CQ had no effect on the growth of GIST882-ir cells. The combination of CQ and imatinib greatly enhanced the inhibitory effect of imatinib on the growth of GIST882-ir cells (Figure 1D).
MAPK Pathway
Protein Bands and Gray Analysis
KIT expression in the GIST882 imatinib-resistant group was significantly higher than that in the GIST882 group (* p<0.05). Compared with the GIST882 imatinib-resistant group, the KIT expression level in the imatinib group and the combination group was significantly lower (#p<0.05), but was not significantly different in the CQ group (p>0.05). KIT expression in the combination group decreased, though it was not significantly lower than in the imatinib group (p>0.05) (Figure 1F).
The KIT phosphorylation level (p-kit/Kit) in the GIST882 imatinib-resistant group was lower than in the GIST882 group, but there was no significant difference (p>0.05). Compared with the GIST882 imatinib-resistant group, the phosphorylation level in the imatinib group and the combination group was significantly lower (p<0.05), and the phosphorylation level in the CQ group was significantly higher (p<0.05). The phosphorylation level in the combination group was higher than that in the imatinib group, but there was no significant change (p>0.05).
ERK expression in the GIST882 imatinib-resistant group was higher than in the GIST882 group, but there was no significant difference (p>0.05). Compared with the, ERK expression in the imatinib group, CQ group, and combination group decreased, but was not significantly different with the GIST882 imatinib-resistant group (p>0.05).
Compared with the GIST882 imatinib-resistant group, the ERK phosphorylation (p-ERK/ERK) level in the imatinib group was lower, but not significantly different (p>0.05). The ERK phosphorylation level of ERK protein in the combination group was lower than that in the imatinib group, but the difference was not significant (p>0.05).
Part Two: Mice Groups
Effect on Tumor Growth
There was no significant difference in the tumor volume between the drug-resistant group and the normal group. Three days after administration, tumor volume of the imatinib group and the imatinib + CQ group was non-significantly lower than in the drug-resistant group (Figure 2A).
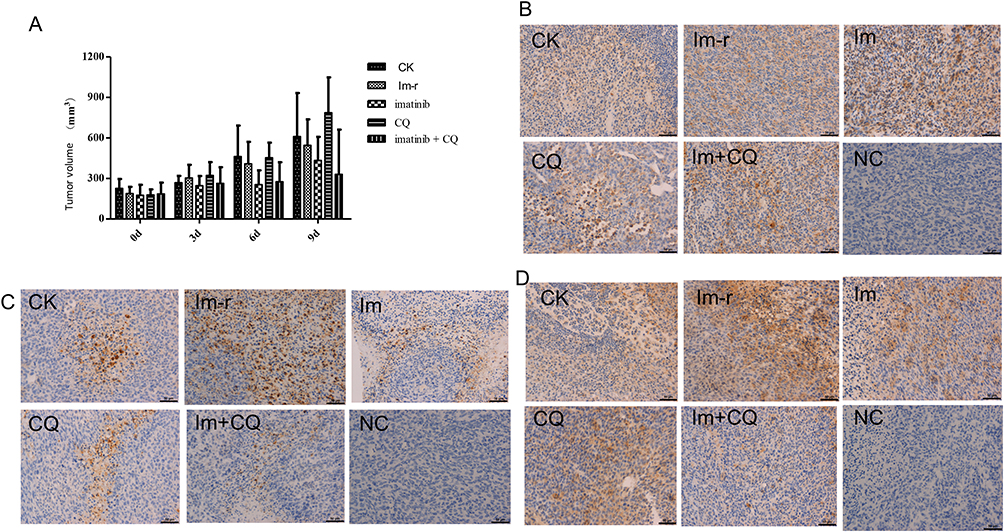 |
Figure 2 (A) Effect on tumor volume. (B) The immunohistochemical detection of Beclin 1 protein expression in rat tumor tissue. (C) The immunohistochemical detection of caspase 3 protein expression in rat tumor tissue. (D) immunohistochemical detection of caspase 7 protein expression in rat tumor tissue. Abbreviations: CK, normal control group; im-r, imatinib-resistant group; im, imatinib-resistant cells + imatinib; CQ, imatinib-resistant cells + chloroquine; im+ CQ, imatinib-resistant cells + imatinib + chloroquine. |
The Effect on Weight
Compared with the normal group, there was a significant decrease in the body weight of mice in the resistant group on day 0, day 3, and day 6 (p<0.05, p<0.01). Compared with the resistant group, there was a significant increase in the body weight of the mice in the imatinib group and the CQ group day 0 and day 3 of the drug administration (p<0.01). The body weight of the mice in the combined group increased significantly on day 0 of drug administration (p<0.01) (Figure 3A).
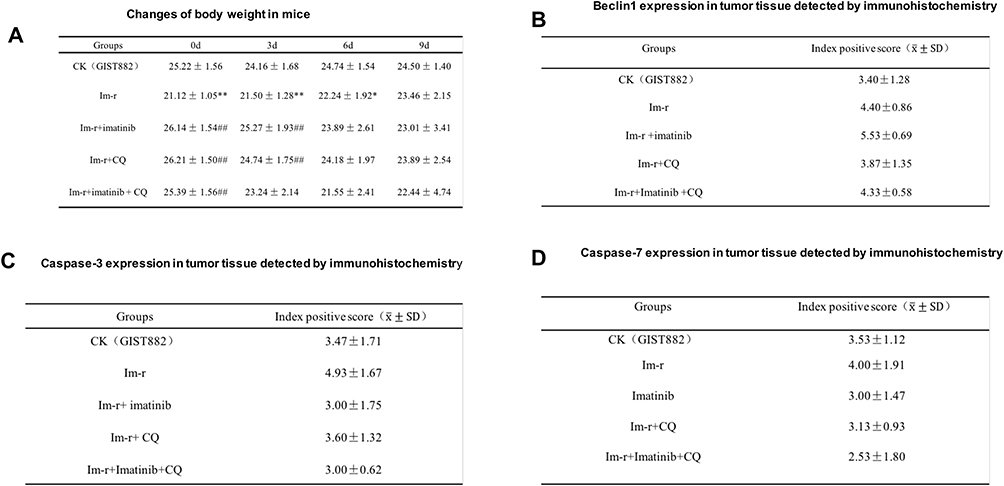 |
Figure 3 (A) Changes of body weight in mice. (B) Beclin1 expression in tumor tissue detected by immunohistochemistry. (C) Caspase-3 expression in tumor tissue detected by immunohistochemistry. (D) Caspase-7 expression in tumor tissue detected by immunohistochemistry. |
Autophagy Level Detection
Western Blot Detection of LC3II/LC3I Expression
Autophagy level (LC3II/LC3I) analysis showed that the autophagy level in the imatinib-resistant group was lower than that in the normal group, but there was no significant difference (p>0.05). Compared with the imatinib-resistant group, there was an upward trend but no significant change (p>0.05) in the imatinib group and imatinib + CQ group, but there was a downward trend without any significant difference in the CQ group (p>0.05). Compared with the imatinib group, there was an upward trend in the imatinib + CQ group, but no significant difference (p>0.05) (Figure 4A).
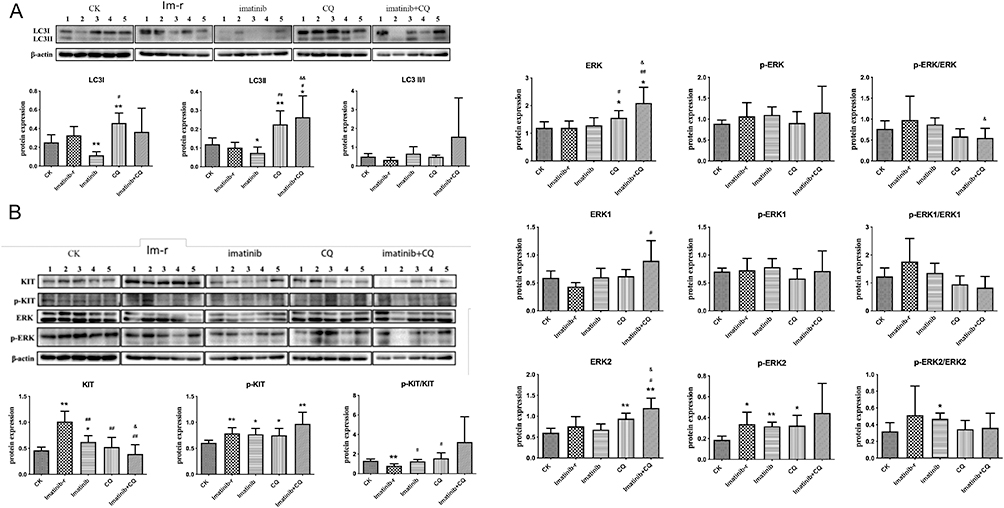 |
Figure 4 (A) LC3II/I protein expression. Compared with the normal group (CK group). Imatinib-r group: imatinib-resistant group. Imatinib-r group vs. CK group, *p<0.05, **p<0.01; each drug administration group vs. Imatinib-r group, #p<0.05, ##p<0.01; Imatinib+CQ group vs. Imatinib group, and p<0.05, and p<0.01. (B) Analysis of KIT and ERK protein expression and phosphorylation level. |
Immunohistochemical Detection of Beclin 1 Protein Expression in Rat Tumor Tissue
According to the positive immunohistochemistry (IHC) results, Beclin 1 expression was highest in the imatinib group, followed by the imatinib-resistant group, and the combination group. The expression in the normal group was the same as that in the CQ group, and lower than that in the other three groups. Due to the small sample size (n=5) of each group, the standard deviation between groups was large, and there was no statistical significance (Figures 3B and 2B).
Detection of Apoptosis Level (Detection of Caspase 3/7 Protein)
Compared with the normal group, the expression of Caspase-3 was highest in the resistant cell group, and there was no significant difference in the other groups (Figures 3C and 2C). The expression of caspase-7 in the drug-resistant group was lower than in the normal cell group, but there was no significant difference between the two groups (Figures 3D and 2D). However, the ratio of caspase 3 and 7 protein in the combined group was highest, indicating that apoptosis level was highest in this group.
To Detect the ERK Expression After CQ Intervention
The KIT expression level in the imatinib-resistant group was significantly higher than in the normal group (*p<0.05). Compared with the imatinib-resistant group, KIT expression in the imatinib group, CQ group, and combination group were significantly lower (##p<0.01). KIT expression in the combination group was significantly lower than in the imatinib group (andp<0.05) (Figure 4B).
The KIT phosphorylation level (p-kit/KIT) was significantly lower in the imatinib-resistant group than in the normal group (**p<0.01). Compared with the imatinib-resistant group, p-kit/KIT in both the imatinib group and the CQ group increased significantly (#p<0.05), while the combination group showed an upward trend, but no significant change (p>0.05). Compared with the imatinib group, p-kit /KIT in the combination group was higher, but not significant (p>0.05).
ERK expression in the CQ group and the combination group increased significantly (p<0.05, p<0.01). ERK expression was significantly higher in the combination group than in the imatinib group (p<0.05) (Figure 4B).
Compared with the imatinib-resistant group, the ERK phosphorylation level (p-ERK/ERK) in the CQ group and combination group was lower than in the imatinib group, though not significant (p>0.05). The p-ERK/ERK level in the combination group was significantly lower than in the imatinib group (p<0.05) (Figure 4B).
Discussion
Secondary resistance to imatinib is a well-described problem in GIST occurring with tumor progression after an initial period of stabilization or response to imatinib. The primary strategy for overcoming imatinib resistance is to switch to another tyrosine kinase inhibitor, such as sunitinib and regorafenib.6
It is hypothesized that an increased autophagic flux often favors tumor cell survival and growth. Despite this potential for confusion, clinical interventions on autophagy regulation as a cancer therapy are already under way.19 Prior studies suggest that autophagy promotes the survival of quiet cancer cells and cancer recurrence.20 In 2018, a research showed that autophagy inhibitors were more useful as resistant cancer-eradicating drugs than the traditional chemotherapeutic agents.21 A combination of ERK and autophagy inhibition has been studied as a treatment approach for pancreatic cancer.22 Bryant et al found that the autophagy inhibitor, chloroquine and genetic or pharmacologic inhibition of specific autophagy regulators synergistically enhanced the ability of ERK inhibitors to mediate antitumor activity in KRAS-driven pancreatic ductal adenocarcinoma.22
In vitro and clinical models suggested that PI3K signaling, p53 status, RAS family status, and JAK–STAT activation may all play roles in the determination of autophagy dependence within pancreatic cancer cells.19,23 Downstream of MAPKs, such as classical/atypical ERKs and p38 MAPKs signaling is often mediated by protein kinases which are phosphorylated and activated by MAPKs.
RAS activates the MAPK cascade (RAF, MEK, and ERK), leading to changes in gene expression through MYC and ELK1.24 KIT signaling through the MAPK pathway maintains ETV1 activity. Despite the finding of ubiquitous MAPK activation in primary GISTs and GIST cell lines, targeted inhibition of MAPK with a MEK1 and MEK2 inhibitor (U0126) had inconsistent effects on GIST cell line proliferation (5–40% inhibition) and did not induce apoptosis. Recently, novel insights into the specificity of the assembly of MAPK/MAPKAPK hetero-dimeric protein kinase signaling complexes have been provided. In addition, the RSK-independent effects of some RSK-inhibitors play a role in tumor suppression.25
The MAPK signaling pathway is shared by four distinct cascades including the extracellular signal-related kinases (ERK1/2), Jun amino-terminal kinases (JNK1/2/3), p38-MAPK, and ERK5. The MAPK/ERK pathway are reported to be associated with cell proliferation, differentiation, migration, senescence, and apoptosis.26
Targeting ERK is thought to be more valid than targeting BRAF or MEK in various types of acquired resistance, and may be more promising as cancer therapy.27 Resistance to the combined therapy in BRAF-mutant melanomas is mediated by mechanisms independent of ERK reactivation in many resistant cell lines and clinical samples.28 ERK1/2 mutation prompts a new question on how to deal with this resistance.
In our study, we found that the phosphorylation level of ERK was related to autophagy, and the autophagy level of the combination group decreased significantly after adding CQ. In the future, large sample studies are needed to confirm.
There are several limitations in our study. Firstly, in this study, only one site of this pathway was detected. Meanwhile, autophagy involves other complex pathways including PI3K/AKT/mTOR pathway. Secondly, the small number of animal models may have affected our results.
Conclusions
Our data suggest that autophagy through the MAPK/ERK pathway may play a pivotal role in imatinib-resistant GIST proliferation. Moreover, combining an autophagy inhibitor with imatinib may be a potential valuable strategy in overcoming acquired resistance in GIST patients.
Abbreviations
GISTs, gastrointestinal stromal tumors; CQ, chloroquine; PDGFRA, platelet-derived growth factor receptor A.
Data Sharing Statement
All data generated or analyzed during the current study are included in this published article.
Ethical Approval and Consent to Participate
All experiments involving cell lines and animals were approved by the Hangzhou cancer hospital ethical review board. All experiments were performed following the Hangzhou cancer hospital and national guidelines and regulations.
Acknowledgment
We are very grateful to Professor Jonathan Fletcher (The Dana Farber Cancer Institute, Boston) who presented the GIST882 cell lines used in this study.
Disclosure
The authors declare that they have no competing interests.
References
1. Soreide K, Sandvik OM, Soreide JA, et al. Global epidemiology of gastrointestinal stromal tumours (GIST): a systematic review of population-based cohort studies. Cancer Epidemiol. 2016;40:39–46.
2. Landi B, Blay JY, Bonvalot S, et al. Gastrointestinal stromal tumours (GISTs): French intergroup clinical practice guidelines for diagnosis, treatments and follow-up (SNFGE, FFCD, GERCOR, UNICANCER, SFCD, SFED, SFRO). Dig Liver Dis. 2019;51:1223–1231. doi:10.1016/j.dld.2019.07.006
3. Reichardt P. The story of imatinib in GIST - a Journey through the development of a targeted therapy. Oncol Res Treat. 2018;41(7–8):472–477. doi:10.1159/000487511
4. Mazzocca A, Napolitano A, Silletta M, et al. New frontiers in the medical management of gastrointestinal stromal tumours. Ther Adv Med Oncol. 2019;11:1758835919841946. doi:10.1177/1758835919841946
5. von Mehren M, Joensuu H. Gastrointestinal stromal tumors. J Clin Oncol. 2018;36(2):136–143. doi:10.1200/JCO.2017.74.9705
6. Li GZ, Raut CP. Targeted therapy and personalized medicine in gastrointestinal stromal tumors: drug resistance, mechanisms, and treatment strategies. Onco Targets Ther. 2019;12:5123–5133. doi:10.2147/OTT.S180763
7. Villanueva MT. Ripretinib turns off the switch in GIST. Nat Rev Drug Discov. 2019;18(7):499. doi:10.1038/d41573-019-00099-4
8. Smith BD, Kaufman MD, Lu W-P, et al. Ripretinib (DCC-2618) is a switch control kinase inhibitor of a broad spectrum of oncogenic and drug-resistant KIT and PDGFRA variants. Cancer Cell. 2019;35(5):738–751 e739. doi:10.1016/j.ccell.2019.04.006
9. Ravegnini G, Sammarini G, Nannini M, et al. Gastrointestinal stromal tumors (GIST): facing cell death between autophagy and apoptosis. Autophagy. 2017;13(3):452–463. doi:10.1080/15548627.2016.1256522
10. Miselli F, Negri T, Gronchi A, et al. Is autophagy rather than apoptosis the regression driver in imatinib-treated gastrointestinal stromal tumors? Transl Oncol. 2008;1(4):177–186. doi:10.1593/tlo.08157
11. Liu W, Zeng X, Yin Y, et al. Targeting the WEE1 kinase strengthens the antitumor activity of imatinib via promoting KIT autophagic degradation in gastrointestinal stromal tumors. Gastric Cancer. 2020;23(1):39–51.
12. Helgason GV, Karvela M, Holyoake TL. Kill one bird with two stones: potential efficacy of BCR-ABL and autophagy inhibition in CML. Blood. 2011;118(8):2035. doi:10.1182/blood-2011-01-330621
13. Ciarcia R, Damiano S, Montagnaro S, et al. Combined effects of PI3K and SRC kinase inhibitors with imatinib on intracellular calcium levels, autophagy, and apoptosis in CML-PBL cells. Cell Cycle. 2013;12(17):2839–2848. doi:10.4161/cc.25920
14. Rubin BP, Debnath J. Therapeutic implications of autophagy-mediated cell survival in gastrointestinal stromal tumor after treatment with imatinib mesylate. Autophagy. 2010;6(8):1190–1191. doi:10.4161/auto.6.8.13430
15. Gupta A, Roy S, Lazar AJ, et al. Autophagy inhibition and antimalarials promote cell death in gastrointestinal stromal tumor (GIST). Proc Natl Acad Sci U S A. 2010;107(32):14333–14338. doi:10.1073/pnas.1000248107
16. Wicki A, Mandala M, Massi D, et al. Acquired resistance to clinical cancer therapy: a twist in physiological signaling. Physiol Rev. 2016;96(3):805–829. doi:10.1152/physrev.00024.2015
17. Sui X, Kong N, Ye L, et al. p38 and JNK MAPK pathways control the balance of apoptosis and autophagy in response to chemotherapeutic agents. Cancer Lett. 2014;344(2):174–179. doi:10.1016/j.canlet.2013.11.019
18. Zheng S, Huang K-E, Pan Y-L, et al. KIT and BRAF heterogeneous mutations in gastrointestinal stromal tumors after secondary imatinib resistance. Gastric Cancer. 2015;18(4):796–802. doi:10.1007/s10120-014-0414-7
19. Levy JMM, Towers CG, Thorburn A. Targeting autophagy in cancer. Nat Rev Cancer. 2017;17(9):528–542. doi:10.1038/nrc.2017.53
20. Vera-Ramirez L, Vodnala SK, Nini R, et al. Autophagy promotes the survival of dormant breast cancer cells and metastatic tumour recurrence. Nat Commun. 2018;9(1):1944. doi:10.1038/s41467-018-04070-6
21. Zhang Y, Sha R, Zhang L, et al. Harnessing copper-palladium alloy tetrapod nanoparticle-induced pro-survival autophagy for optimized photothermal therapy of drug-resistant cancer. Nat Commun. 2018;9(1):4236. doi:10.1038/s41467-018-06529-y
22. Bryant KL, Stalnecker CA, Zeitouni D, et al. Combination of ERK and autophagy inhibition as a treatment approach for pancreatic cancer. Nat Med. 2019;25(4):628–640. doi:10.1038/s41591-019-0368-8
23. Rosenfeldt MT, O’Prey J, Morton JP, et al. p53 status determines the role of autophagy in pancreatic tumour development. Nature. 2013;504(7479):296–300. doi:10.1038/nature12865
24. Corless CL, Barnett CM, Heinrich MC. Gastrointestinal stromal tumours: origin and molecular oncology. Nat Rev Cancer. 2011;11:865–878. doi:10.1038/nrc3143
25. Gaestel M. MAPK-Activated Protein Kinases (MKs): novel insights and challenges. Front Cell Dev Biol. 2015;3:88.
26. Sun Y, Liu WZ, Liu T, et al. Signaling pathway of MAPK/ERK in cell proliferation, differentiation, migration, senescence and apoptosis. J Recept Signal Transduct Res. 2015;35:600–604. doi:10.3109/10799893.2015.1030412
27. Liu F, Yang X, Geng M, et al. Targeting ERK, an Achilles’ Heel of the MAPK pathway, in cancer therapy. Acta Pharm Sin B. 2018;8:552–562. doi:10.1016/j.apsb.2018.01.008
28. Lu H, Liu S, Zhang G, et al. PAK signalling drives acquired drug resistance to MAPK inhibitors in BRAF-mutant melanomas. Nature. 2017;550(7674):133–136. doi:10.1038/nature24040
 © 2020 The Author(s). This work is published and licensed by Dove Medical Press Limited. The full terms of this license are available at https://www.dovepress.com/terms.php and incorporate the Creative Commons Attribution - Non Commercial (unported, v3.0) License.
By accessing the work you hereby accept the Terms. Non-commercial uses of the work are permitted without any further permission from Dove Medical Press Limited, provided the work is properly attributed. For permission for commercial use of this work, please see paragraphs 4.2 and 5 of our Terms.
© 2020 The Author(s). This work is published and licensed by Dove Medical Press Limited. The full terms of this license are available at https://www.dovepress.com/terms.php and incorporate the Creative Commons Attribution - Non Commercial (unported, v3.0) License.
By accessing the work you hereby accept the Terms. Non-commercial uses of the work are permitted without any further permission from Dove Medical Press Limited, provided the work is properly attributed. For permission for commercial use of this work, please see paragraphs 4.2 and 5 of our Terms.