")
Back to Journals » Drug Design, Development and Therapy » Volume 15
Chlorogenic Acid Inhibits Human Glioma U373 Cell Progression via Regulating the SRC/MAPKs Signal Pathway: Based on Network Pharmacology Analysis
Authors Zhou J, Zhang F, Chen J, Zhang S, Wang H
Received 10 December 2020
Accepted for publication 3 March 2021
Published 30 March 2021 Volume 2021:15 Pages 1369—1383
DOI https://doi.org/10.2147/DDDT.S296862
Checked for plagiarism Yes
Review by Single anonymous peer review
Peer reviewer comments 3
Editor who approved publication: Professor Anastasios Lymperopoulos
Jiabin Zhou,1,* Fengqi Zhang,2,* Jun Chen,3 Shilin Zhang,4 Haijun Wang1
1Department of Neurosurgery, Union Hospital, Tongji Medical College, Huazhong University of Science and Technology, Wuhan, 430022, People’s Republic of China; 2Department of Neurosurgery, Xiangya Hospital, Central South University, Changsha, 410008, People’s Republic of China; 3Department of Neurosurgery, Traditional Chinese Hospital of LuAn, LuAn, Anhui Province, 237006, People’s Republic of China; 4Aviation Medical Support Center, Naval Aviation University of Chinese People’s Liberation Army, Yantai, Shandong Province, 264001, People’s Republic of China
*These authors contributed equally to this work
Correspondence: Haijun Wang
Department of Neurosurgery, Union Hospital, Tongji Medical College, Huazhong University of Science and Technology, No. 1277 Jiefang Road, Wuhan, 430022, People’s Republic of China
Email [email protected]
Introduction: Chlorogenic acid (CGA) is a type of polyphenolic substance that is widely extracted from many traditional Chinese medicines (eg, Lonicera japonica Thunb, Eucommia ulmoides Oliver) and exhibits a wide range of anti-tumor effects. However, the potential molecular mechanisms of CGA in glioma U373 cells remain unclear.
Methods: Network pharmacology analysis was used to explore the potential therapeutic targets of CGA in glioma. Human glioma U373 cells were treated with different concentrations of CGA for 24 h. CCK-8 assays were used to detect the inhibitory rate of cell growth. Annexin V-FITC/PI staining and Hoechst 33342 staining were used to detect apoptosis. PI staining was used to investigate cell-cycle progression. Wound healing assays and transwell assays were used to detect the cell migration and invasion, respectively. Western blotting and immunohistochemistry were used to measure protein levels in vitro and in vivo.
Results: The proliferation of U373 cells was significantly inhibited by CGA in a dose- and time-dependent manner. CGA significantly arrested the cell cycle of U373 cells in the G2/M phase and induced apoptosis. Moreover, CGA significantly suppressed the migration and invasion of U373 cells. Additionally, we found that CGA inhibited the growth of U373 cells in vivo. Furthermore, network pharmacology analysis suggested that the anti-tumor effects of CGA on U373 cells were associated with the down-regulation of the SRC/MAPKs signaling pathway.
Discussion: The present study indicated that CGA had anti-glioma effects on U373 cells by down-regulating SRC/MAPKs signal pathway.
Keywords: chlorogenic acid, apoptosis, migration and invasion, network pharmacology, SRC/MAPKs signal pathway
Introduction
Glioma accounts for 35–60% of intracranial tumors and is the most common primary brain tumor globally, with high lethality and disability rates. According to statistics, the median survival time of malignant gliomas is only 15–23 months, and the five-year survival rate is less than 6%.1 Because of invasive growth and complicated intracranial anatomy, radical resection of tumor tissues is often difficult. In addition, radiotherapy and chemotherapy induce glioma cells to become tolerant to radiation and chemotherapeutic drugs; therefore, the prognosis of malignant gliomas remains poor. Moreover, residual glioma cells after radiotherapy or chemotherapy are the source of tumor recurrence.2 Chlorogenic acid (CGA) is a type of polyphenolic substance that is widely extracted from traditional Chinese medicine—such as Eucommiae Cortex and Lonicerae Japonicae Flos—and has shown a wide range of pharmacological activities, such as anti-inflammatory, anti-oxidative, anti-tumor, hepatic-protective, and immune-modulatory properties.3,4 However, few studies have investigated the anti-glioma effects and related mechanisms of CGA.
In the present study, we found that CGA induced apoptosis and cell-cycle arrest, as well as inhibited migration and invasion, of U373 cells. Furthermore, we employed network pharmacology, which is a new pharmacological method that analyzes the molecular mechanisms of components of Chinese herbal medicines in treating various diseases (Figure 1). In particular, network pharmacology provides biological network construction and network visualization analyses for assessing complex interactions between drug components and disease targets.5 According to network pharmacology analysis in our present study, we found that the SRC/MAPKs signaling pathway may be associated with the therapeutic effects of CGA in glioma cells. Furthermore, we verified that CGA inhibited the SRC/MAPKs signaling pathway, which was correlated with the induction of apoptosis, cell-cycle arrest, and inhibition of migration and invasion of U373 cells.
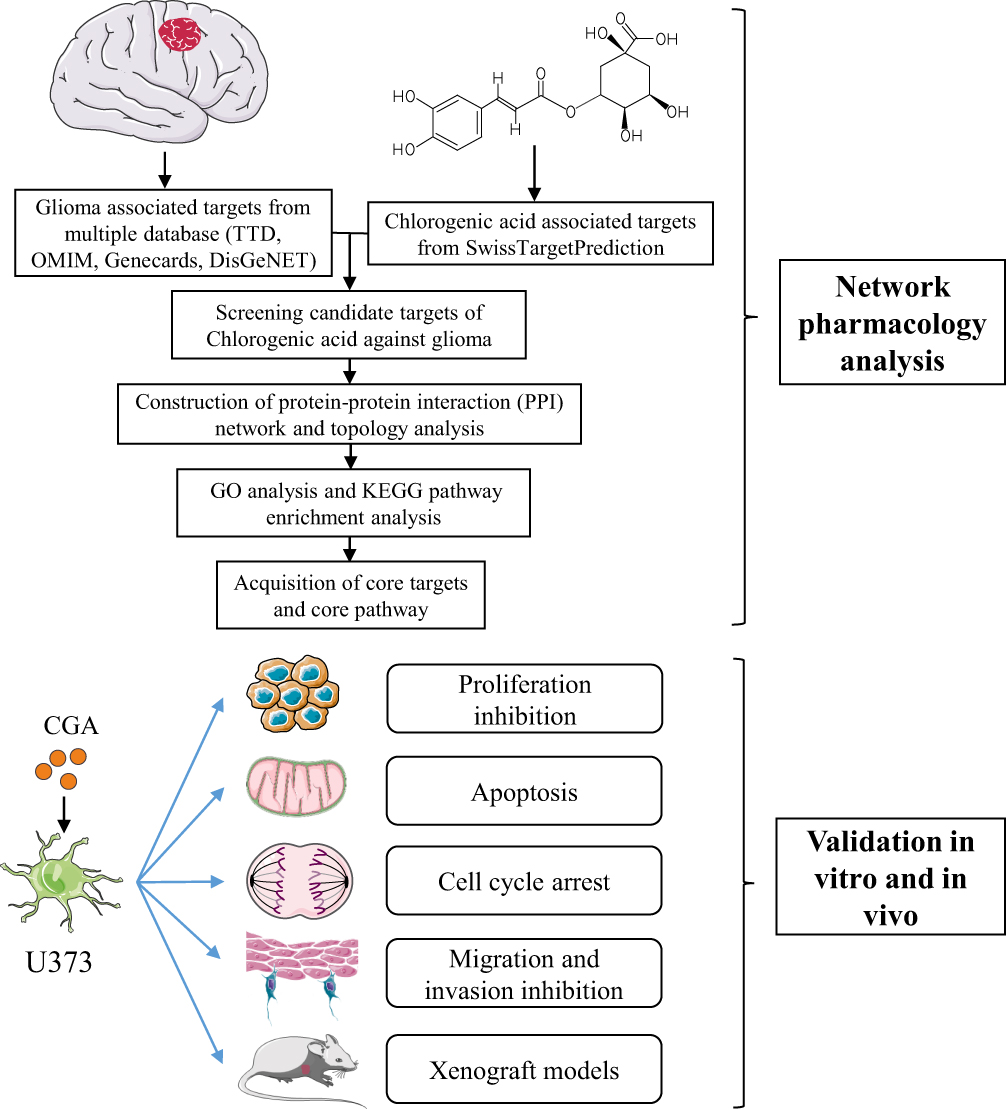 |
Figure 1 The schematic flowchart in the current study combined with a network pharmacology analysis and experimental validation in vitro and in vivo. |
Materials and Methods
Chemicals and Reagents
Roswell Park Memorial Institute-1640 (RPMI-1640) was purchased from Thermo Fisher Scientific (Waltham, MA, USA). Fetal bovine serum (FBS) and dimethyl sulfoxide (DMSO) were purchased from GIBCO (Grand Island, NY, USA). CGA (Number C109403, CAS number 327-97-9, HPLC≥98%) was obtained from Aladdin (Shanghai, China). The following antibodies were purchased from ABclonal Biotechnology Co., LTD (Wuhan, China): β-actin, MMP2, MMP9, E-cadherin, Vimentin, Bax, Bcl-2, caspase-3, caspase-8, Ki-67, SRC, MAPK1, MAPK8, and HRP-labeled goat anti-rabbit IgG. CGA was dissolved in DMSO in a stock solution and was stored in a dark bottle at 4°C. FITC Annexin-V Apoptosis Detection Kit I (556,547) was purchased from BD (USA). Cell Counting Kit-8 was purchased from Dojindo (Japan). Hoechst 33342 staining solution, TUNEL staining Kit, BCA protein assay kit, and cell-cycle detection kit were purchased from Beyotime (Shanghai, China).
Acquisition of CGA-Associated Targets and Glioma-Associated Targets
SwissTargetPrediction (http://www.swisstargetprediction.ch/) is an online website for the prediction of compound-associated protein targets based on the pharmacophore model.6 In the present study, we downloaded the three-dimensional structural file of CGA from the compound database (PubChem Compound Search database) (https://www.ncbi.nlm.nih.gov/pccompound) and imported it into SwissTargetPrediction to obtain the protein targets of CGA. In addition, we input the keyword “glioma” to yield results in the Therapeutic Target Database (http://bidd.nus.edu.sg/group/cjttd/)7, OMIM database (http://www.omim.org/),8 GeneCards database (http://www.genecards.org/),9 and DisGeNET database (https://www.disgenet.org/).10 Then we integrated the results and obtained potential glioma-associated targets.
Integration of Candidate Targets of CGA for Treating Glioma
The intersection between CGA-associated targets and glioma-associated targets was considered as the locus of candidate targets of CGA for treating glioma. Hence, we obtained these candidate targets and generated a corresponding Venn diagram by using the website tool, Draw Venn Diagram (http://bioinformatics.psb.ugent.be/webtools/Venn/).
Construction of Protein–Protein Interaction (PPI) Network and Topology Analysis
To investigate interactions among targets of CGA for treating glioma, candidate targets were imported into the STRING database Version 11.0 (https://string-db.org/)11 to construct a protein–protein interaction (PPI) network that we subsequently visualized via Cytoscape software (version 3.7.1). To obtain the topological parameters, the Network Analyzer setting was used to calculate the cluster density, node-degree distribution, shortest path, and length distribution. The network was analyzed by using the “Generate style from statistics tool” in Cytoscape software. The size and color of each node was set to reflect degree of—and the thickness of edges was set to reflect the size of—the combined score to obtain the final PPI network.12 In addition, the MCODE algorithm, a graph theory-based clustering method, was used to perform clustering analysis of the PPI network to extract the core gene modules.13 Furthermore, we visualized the top-10 genes from the PPI network via R software (version x64 3.6.1).
Gene Ontology (GO) Analysis and Kyoto Encyclopedia of Genes and Genomes (KEGG) Pathway Enrichment Analysis
Gene ontology (GO) analysis and Kyoto Encyclopedia of Genes and Genomes (KEGG) pathway enrichment analysis are widely used in functional analysis of high-throughput gene expression data. GO was used to annotate the gene products in terms of their functions, participating biological pathways, and subcellular localizations. KEGG is a database for systematic analysis of the metabolic pathways of gene products within cells, and it is one of the most commonly used types of metabolic pathway analysis. In the present study, cluster Profiler in R software (version x 64 3.6.1) was used to analyze the GO and KEGG enrichment annotations of candidate targets.
Cell Culture
The U373 human glioma cell line and the LO2 human liver cell line were purchased from the Chinese Academy of Medical Sciences Cell Culture Center (Beijing, China). U373 and LO2 cells were cultured in RPMI-1640 medium containing 10% FBS and 1% penicillin/streptomycin at 37°C in a constant-temperature incubator with 5% CO2.
Cell Viability Assay
Cells were seeded at a density of 5×10³ cells per well into 96-well plates and were incubated overnight at 37°C. The next day, the cells were treated with different concentrations of CGA for 24, 48, or 72 h. Then 10 μL of CCK-8 reagent was added to each well for 2 h. The absorbance was measured at 450 nm via a spectrophotometer.
Apoptotic Assay
U373 cells were seeded in six-well plates at a density of 5×10⁵ cells per well and were incubated with different concentrations of CGA (0, 50, 100, 200 μM) for 24 h; the control group was incubated with culture medium containing 0.1% DMSO. Then, the supernatants of cells were collected and added to annexin V-FITC/PI solution, according to the manufacturer’s instructions of the BD Annexin V-FITC/PI apoptosis detection kit. We detected apoptosis via flow cytometry, and the results were analyzed by Flowjo 10.0 software.
Hoechst 33342 Staining
The procedure for CGA treatments of U373 cells was the same as that described above. Then, cells were washed three times with phosphate-buffered saline (PBS) and were then incubated with Hoechst 33342 staining solution for 15 min. Thereafter, we observed the morphologies of apoptotic nuclei via fluorescent microscopy.
Cell-Cycle Assay
The procedure for CGA treatments of U373 cells was the same as that described above. The supernatants of cells were collected and incubated with PI solution, according to the manufacturer’s instructions of the cell-cycle and apoptosis detection Kit. Cell cycle was detected via flow cytometry, and the results were analyzed by Modfit software.
Wound Healing Assay
U373 cells were plated into six-well plates at a density of 5×10⁵ cells per well. We used a 200-μL sterile pipette tip to make three scratches on the monolayer of cells and washed the cells three times with PBS to remove cellular debris. To confirm the uniform standard of each scratch, cells were first imaged under a microscope at 0 h to serve as the control condition. Then, the cells were treated with different concentrations of CGA (0, 50, 100, 200 μM) for 24 h. Finally, the treated cells were observed and imaged via microscopy, and the migration distance was calculated with ImageJ software.
Transwell Invasion Assay
At one day prior to its use, matrigel was melted at 4°C and diluted to a concentration of 1 mg/mL in culture medium without FBS. Culture medium supplemented with 10% FBS and different concentrations of CGA (0, 50, 100, 200 μM) were added into the lower chamber of the 24-well transwell plate. Next, 100 μL of matrigel (1 mg/mL) was added into the upper chamber and incubated for 4 h until it polymerized. Then, U373 cells were seeded into the upper chamber at a density of 5×10⁵ cells per well in 200 µL of medium, and the culture system was placed into an incubator for 24 h. Cells on the lower chamber were fixed with 4% paraformaldehyde for 2 min and were permeabilized with 100% methanol for 20 min, after which they were stained with Wright’s Giemsa solution for 15 min at room temperature. Finally, the stained cells were imaged via microscopy and results were quantified with ImageJ software.
Immunofluorescent Staining
Immunofluorescent staining was used to observe the protein expression of SRC in U373 cells after CGA treatments. Cells were washed three times with PBS at 4°C, fixed with 4% paraformaldehyde for 15 min, and immersed three times (5 min each time) in PBS containing 0.1% TritonX-100. Then, the cells were incubated with SRC primary antibody overnight in a wet box at 4°C, after which they were incubated with a fluorescent secondary antibody for 1 h. After staining with DAPI in the dark for 3 min, samples were incubated with an antifade mounting medium and were then coverslipped. SRC proteins were labeled with red fluorescence, while DAPI was labeled with blue fluorescence. The protein levels of SRC (the red fluorescence intensity) were analyzed by Image J software and showed as mean optical density. Data were expressed as mean ± SD (n=6).
Western Blotting
Western blotting was performed as previously described.14 In brief, proteins were extracted from cells and tumor tissues via RIPA lysis buffer with PMSF, and protein levels were quantified via a BCA protein assay kit. Then, proteins were separated by 10% SDS-PAGE gels and were then transferred onto PVDF membranes. Next, membranes were blocked with 5% fat-free milk at room temperature for 1 h, followed by incubation with primary antibodies and secondary antibodies. Finally, membranes were soaked in enhanced ECL reagents and protein bands were detected using a UVP BioSpectrum Imaging System. The intensities of protein bands were quantified with ImageJ software. Data were expressed as mean ± SD (n=3).
Xenograft Models
Thirty-two BALB/C nude mice (male, 5–6 weeks, 18–22 g) were purchased from Beijing Vital River Laboratory Animal Technology Co., Ltd. (Beijing China). U373 cells (1×10⁷ cells/200 µL) were subcutaneously injected into the right armpit. All tumor-bearing mice were equally divided into four groups, and different concentrations of CGA (normal saline, 5 mg/kg, 10 mg/kg, 20 mg/kg) were given to each group via daily intragastric administration. After 24 d, mice were sacrificed and their tumors were collected. All animal experiments were approved by the Laboratory Animal Research Committee of Huazhong University of Science and Technology (approval number: SYXK2016-0057).
Hematoxylin & Eosin (H&E) Staining
According to our previous studies, collected tumor tissues were fixed, embedded, and cut into thick sections. The sections were stained with hematoxylin and eosin (H&E; 0.1–0.5%). Finally, we observed and imaged the stained sections under an inverted microscope.
TUNEL Staining
The preparation of slices was the same as that described above. According to the manufacturer’s instructions, slices were incubated in 20 μg/mL of proteinase K for 15 min at 37°C. After washing three times with PBS, 50 μL of prepared TUNEL staining solution was added onto slices for 1 h. Next, slices were washed three times and were then coverslipped. Images were observed and imaged via fluorescent microscopy. The percentage of apoptotic cells (the green fluorescence intensity) were analyzed by Image J software. Data were expressed as mean ± SD (n=6).
Immunohistochemistry
The preparation of slices was the same as that described above. Slices were fixed and subsequently incubated with primary antibody (anti-Ki67, 1:200; anti-SRC, 1:200) at 4°C overnight, and were then stained with a secondary antibody. The slides were observed and imaged via fluorescent microscopy. The protein levels of SRC (the fluorescence intensity) were analyzed by Image J software according to the formula (Average Optical Density (AOD) = IOD/Area), Data were expressed as mean ± SD (n=6).
Statistical Analysis
All statistical data were analyzed via Graphpad Prism software (version 8.0). Data are expressed as the mean ± standard deviation (SD) of three independent experiments. The statistical significance of results was determined via one-way analysis of variance (ANOVA) followed by post-hoc Dunnett’s tests. A P < 0.05 was considered to be statistically significant.
Results
Preliminary Screening of Candidate Targets of CGA for Treating Glioma
A total of 100 pharmacological targets of CGA were predicted by the SwissTargetPrediction online database. Furthermore, 36 glioma-associated targets were obtained from the Therapeutic Target Database, nine targets were obtained from the OMIM database, 1775 targets were obtained from the GeneCards database (Relevance score ≥ 2), and 99 targets were obtained from the DisGeNET database. Based on the integrated results of the above databases, 1822 glioma-associated targets were predicted after deleting duplicate and false-positive items. Furthermore, a total of 40 candidate biological targets of CGA and glioma were obtained through inputting the above data into the Draw Venn Diagram web tool (Figure 2A).
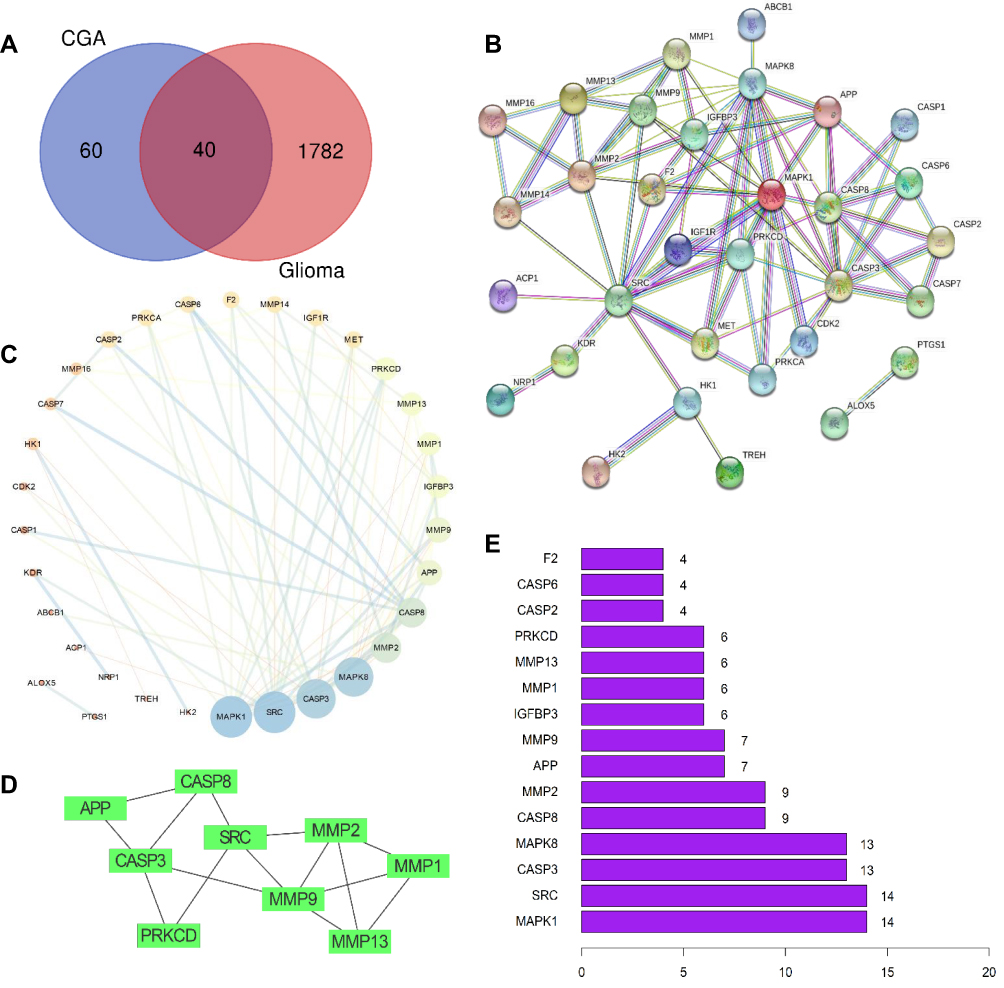 |
Figure 2 Preliminary screening of the candidate targets, PPI network-based cluster analysis and core targets prediction. (A) Venn diagrams of common targets in glioma and chlorogenic acid. As a result, 40 pharmacological potential targets were obtained. (B) Construction of PPI network in CGA in treating glioma by using STRING database. (C) Topological analysis of potential targets in CGA in treating glioma by using Network Analyzer. (D) Cluster analysis of PPI network to extract the core gene modules by using MCODE algorithm. (E) The top 15 core genes visualization obtained by using R software according to the relevance number of nodes. |
PPI Network-Based Cluster Analysis and Prediction of Core Targets
As shown in Figure 2A, 40 candidate biological targets were introduced into the STRING database (minimum required interaction score = 0.9). Thereafter, we used Cytoscape software to obtain a PPI network diagram that included 32 targets and 80 edges (Figure 2B and C). The cluster subnetwork was plotted by using MCODE Apps in Cytoscape software. The results showed that there was only one cluster subnetwork, consisting of nine nodes and 15 edges, based on MCODE analysis. This cluster included SRC, APP, CASP3, CASP8, MMP1, MMP2, MMP9, MMP13, and PRKCD, and the score was 3.75 (Figure 2D). Moreover, the top-10 core nodes were obtained according to the order of degrees of freedom from high to low, namely MAPK1, SRC, CASP3, MAPK8, CASP8, MMP2, APP, MMP9, IGFBP3, and MMP1. Meanwhile, the top-15 core genes (Figure 2E) were visualized via R software according to the relevant number of nodes.
GO Biological Processes and KEGG Pathway Enrichment Analysis
The GO biological processes and KEGG pathway enrichments of candidate biotargets were analyzed by the “clusterprofiler” package in R software. GO analysis for visualization and annotations were described by the BP, CC, and MF terms. As shown in Figure 3A, we obtained a total of 658 GO entries, including 607 BPs, 10 CCs, and 41 MFs that had P-values < 0.05. Additionally, to explore the potential signaling pathways among the candidate targets of CGA for glioma treatment, we screened 95 pathways according to a threshold of P < 0.05, including the MAPK, EGFR tyrosine-kinase inhibitor-resistant, endocrine-resistant, Rap1, Ras, and HIF-1 pathways (Figure 3B).
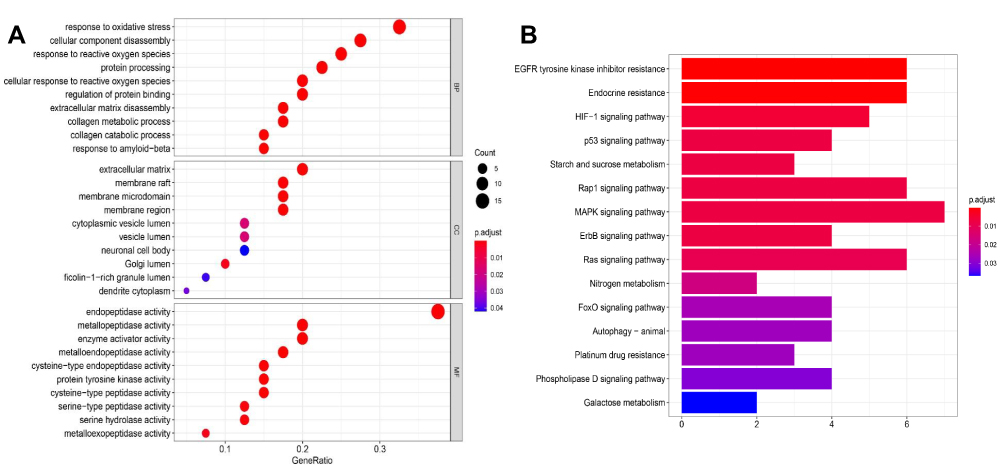 |
Figure 3 GO and KEGG pathway analysis. (A) GO analysis of core targets and bubble plot for top 15 biological processes, top 15 cellular components, and top 15 molecular functions. (B) KEGG pathway analysis of core targets and column plot for top 15 pathways. The size of the nodes shows counts of targets, and the gradient of color represents the different adjusted p values. |
CGA Inhibits the Proliferation of U373 Cells but Has No Toxicity in LO2 Cells
To investigate the inhibitory effects of CGA on U373 cells, the viability of U373 cells was detected by CCK-8 assays. Our results suggested that CGA significantly reduced the viability of U373 cells in a dose- and time-dependent manner (Figure 4D) and the IC50 of CGA when incubated for 24, 48, and 72 h were 139.3, 118.6, and 107.3 μM, respectively (Figure 4A–C). Moreover, we confirmed that a CGA concentration of 200 μM was innocuous to LO2 cells but significantly inhibited the proliferation of U373 cells (Figure 4E), while 400 μM of CGA inhibited the growth of LO2 cells (Figure 4F). Subsequently, as shown in Figure 4G and H, the number of necrotic cells increased with the increased concentration of CGA. Compared with those in the control group, the nuclei of cells treated with CGA were pyknotic, fragmented, and had different shapes, and the chromatin was bright blue and contained typical apoptotic bodies (Figures 4G and H).
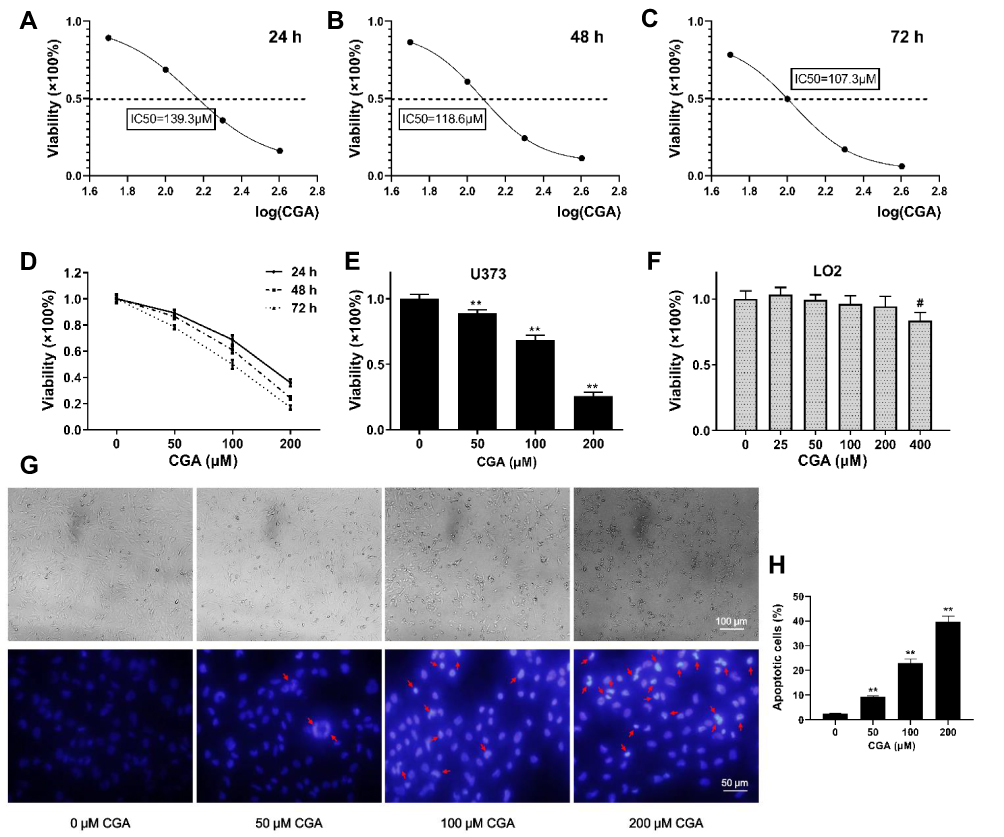 |
Figure 4 CGA inhibited the proliferation of U373 cells in a dose- and time-dependent manner. (A–C) The IC50 of CGA on U373 cells for 24 hr, 48 hr, and 72 hr were 139.3 μM, 118.6 μM, and 107.3 μM, respectively. (D) The viability of U373 cells treated with different concentrations of chlorogenic acid for 24 hr, 48 hr, and 72 hr was detected by CCK-8 assays. (E) The inhibitory effect of chlorogenic acid on U373 cells proliferation detected by CCK-8 assays for 24 h, **P<0.01. (F) Cytotoxicity assay of chlorogenic acid on LO2 cells detected by CCK-8 assays for 24 h, #P<0.05, compared with 0 group. (G and H) Morphology and Hoechst 33342 staining of U373 cells treated with different concentrations of chlorogenic acid for 24 h, the nuclei of cells treated with CGA showed bright blue color and contained typical apoptotic bodies (red arrows), **P<0.01, compared with 0 group. Data were expressed as mean ± SD (n=6). |
CGA Induces Apoptosis and Cell-Cycle Arrest at the G2/M Phase in U373 Cells
Flow cytometry was used to detect apoptosis and cell-cycle arrest in U373 cells after CGA treatment for 24 h. Compared with that of the control group, CGA treatment increased the frequency of late apoptosis in U373 cells, and the total number of apoptotic cells was also increased (Figure 5A and C). In addition, as shown in Figure 5B and D, the proportion U373 cells in the G2/M phase was increased from 9.50±2.10% in the control group to 24.12±2.97% in the 200-μM CGA group. Furthermore, the proportion of U373 cells in the G0/G1 phase was decreased from 65.98±3.74% in the control group to 48.88±2.39% in the 200-μM CGA group. Collectively, these results showed that CGA induced apoptosis and cell-cycle arrest at the G2/M phase in U373 cells.
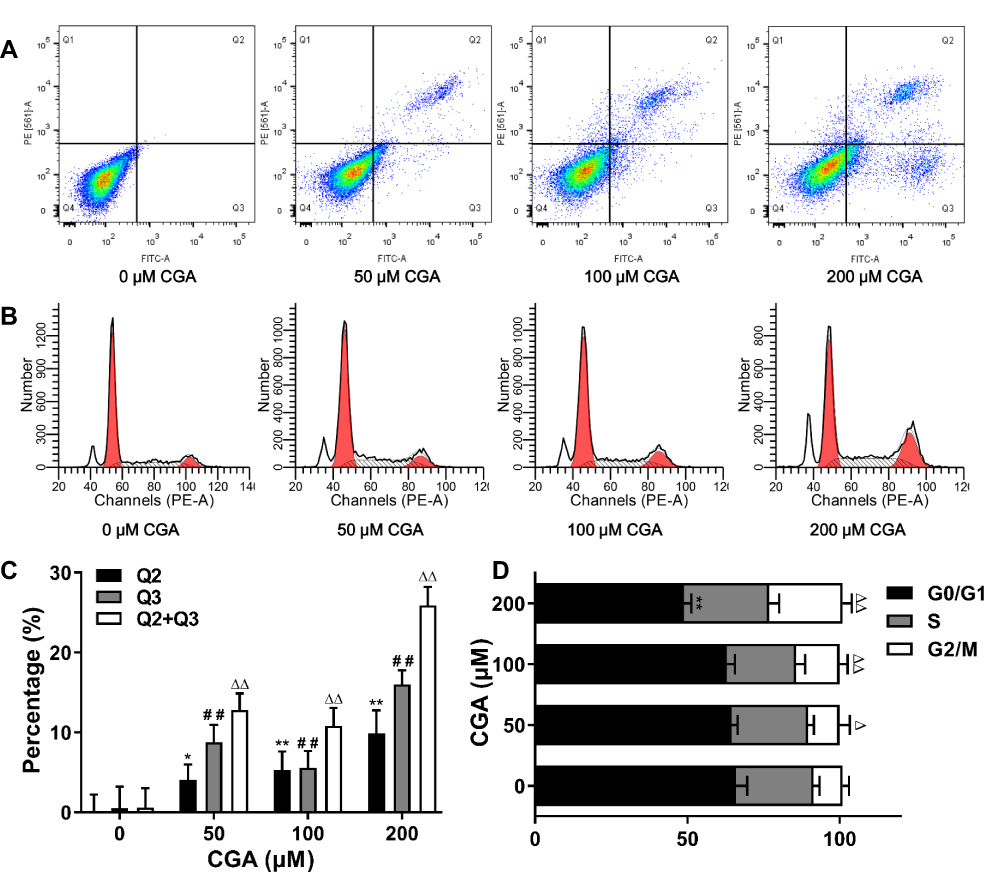 |
Figure 5 CGA inhibited the proliferation of U373 cells by inducing apoptosis and G2/M arrest. (A and C) CGA induced apoptosis in U373 cells. U373 cells were treated with different concentrations of CGA for 24 hr. Cells were stained with Annexin V-FITC/PI staining solution and detected by flow cytometry. *P<0.05, **P<0.01, ##P<0.01, ΔΔP<0.01, both compared with 0 group. (B and D) Chlorogenic acid induces cell cycle arrest in G2/M phase in U373 cells. Cells were treated with different concentrations of chlorogenic acid for 24 h. Samples were stained with PI solution and analyzed by flow cytometry, **P<0.01, ΔP<0.05, ΔΔP<0.01, both compared with 0 group. Data were expressed as mean ± SD (n=3). |
CGA Suppresses Migration and Invasion of U373 Cells
As shown in Figure 6A and C, our results showed that the mobility of U373 cells was significantly decreased after CGA treatment compared with that of vehicle treatment. The relative migration rates of U373 cells treated for 24 h with CGA at 0, 25, 50, and 100 μM were 71.04±5.33%, 49.38±8.81%, 31.70±7.13%, and 12.98±8.75%, respectively. The results of a transwell invasion assay (Figure 6B and D) showed that the number of invading cells in each visual field at 0, 25, 50, and 100 μM of CGA were 142±12, 74±15, 48±8, and 35±11 cells, respectively. Compared with that of the vehicle group, the invasive ability of glioma U373 cells treated with different concentrations of CGA was decreased significantly. Taken together, these results demonstrated that CGA suppressed the migration and invasion of U373 cells.
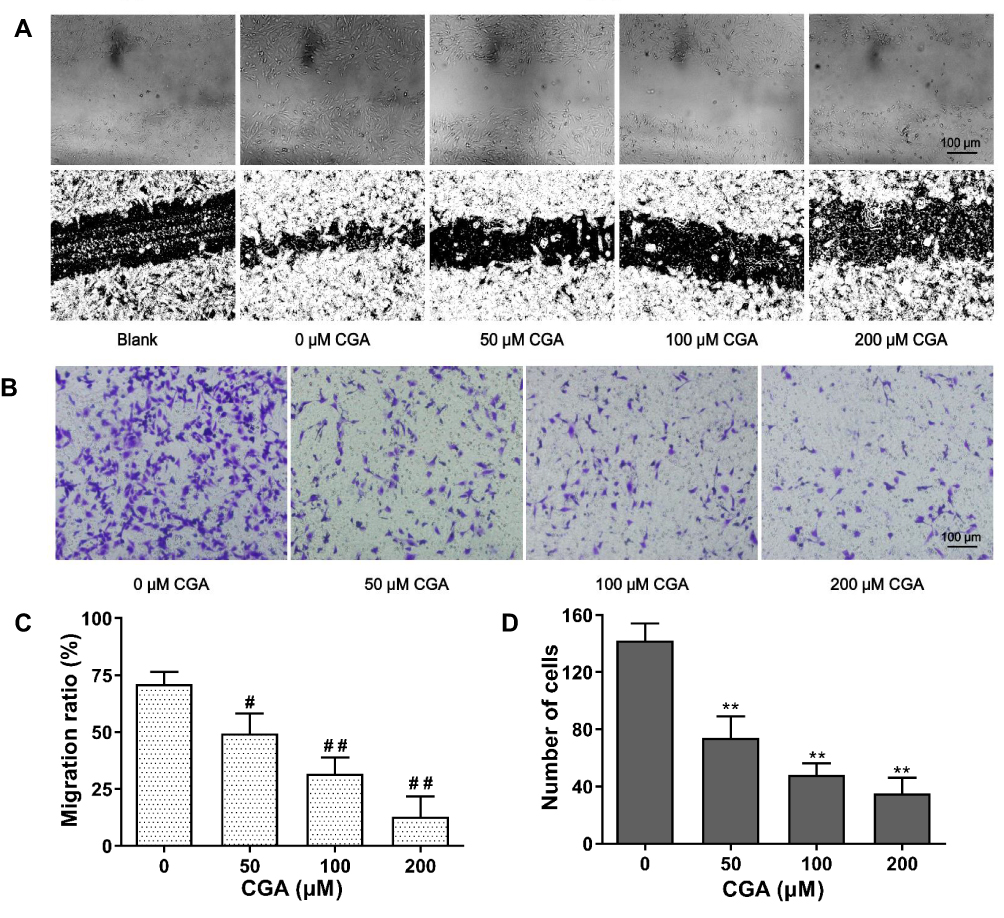 |
Figure 6 CGA inhibited the migration and invasion of U373 cells. (A and C) Wound healing assay. U373 cells after scratching were treated with different concentrations of chlorogenic acid for 24 hr. Migration ratio of U373 cells were measured by image J software, #P<0.05, ##P<0.01, compared with 0 group. (B and D) Transwell invasion assay. U373 cells were treated as above. The number of invasive cells were measured by image J software, **P<0.01, compared with 0 group. Data were expressed as mean ± SD (n=3). |
CGA Inhibits the Activation of the SRC/MAPKs Signal Pathway in U373 Cells
U373 cells were treated with different concentrations (0, 25, 50, and 100 μM) of CGA for 24 h. As shown in Figure 7A and B, the expression of SRC (red fluorescence) in U373 cells after treatment with 200 μM of CGA for 24 h was decreased significantly compared to that of the control group. Additionally, protein levels in U373 cells were detected by Western blotting. First, we assayed proteins associated with cell migration, invasion, and the epithelial-mesenchymal transition (EMT). As shown in Figure 7C and E, compared with those in the control group, the relative protein levels of MMP2, MMP9, and Vimentin in the CGA treatment groups were decreased significantly, whereas the protein level of E-cadherin was increased. Then, we measured the levels of some proteins associated with apoptosis. The results suggested that CGA increased the protein levels of Bax, cleaved-caspase 3, and cleaved-caspase 8, whereas it decreased the level of Bcl-2 (Figure 7D and G), indicating that CGA induced apoptosis in U373 cells. Furthermore, to identify core targets and explore the potential mechanisms of CGA in treating glioma, we investigated the expression of core target proteins by Western blotting in glioma U373 cells treated with CGA. We found that CGA downregulated the protein levels of SRC and MAPK1. In addition, we found that CGA downregulated the p-SRC/SRC, p-MAPK1/MAPK1, and p-MAPK8/MAPK8 ratios (Figure 7F and H).
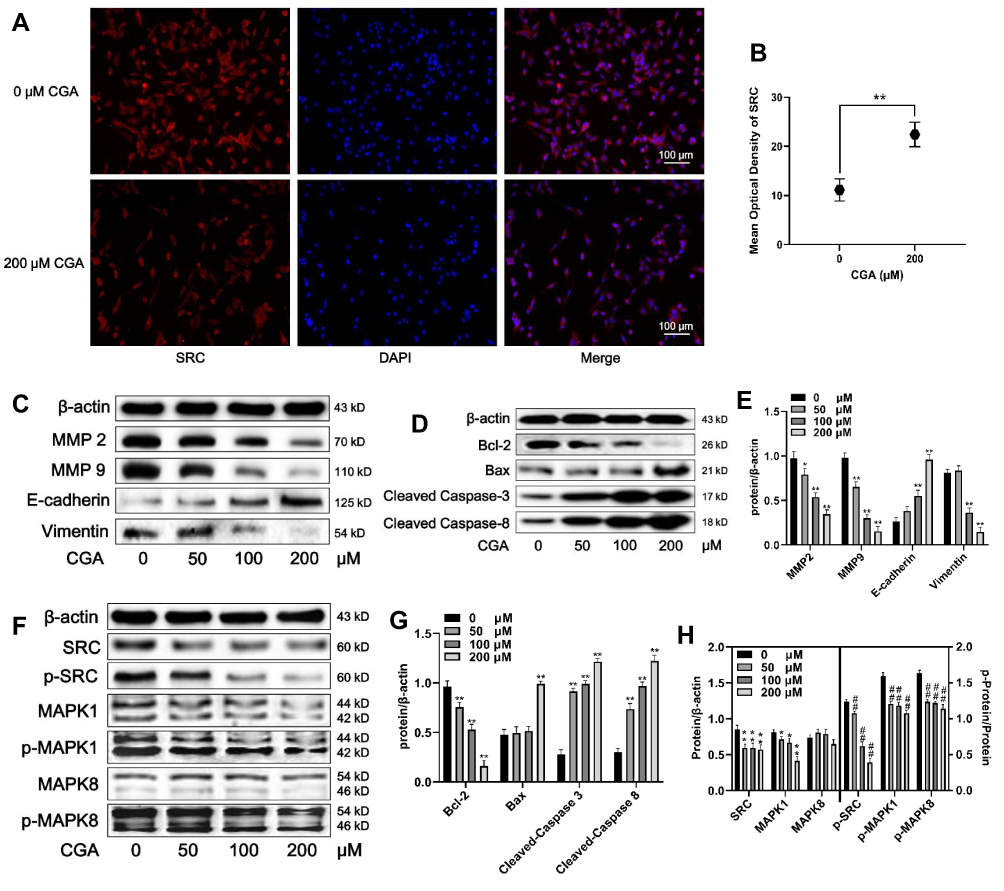 |
Figure 7 CGA downregulates the SRC/MAPKs signal pathway in U373 cells. (A and B) Immunofluorescence staining (200×) of SRC in U373 cells treated with or without 200 μM CGA for 24 hr, **P<0.01, compared with 0 group. (C and E) Cells were treated with CGA for 24 hr. The protein levels of MMP2, MMP9, E-cadherin, Vimentin were measured by Western blotting. β-actin was used as the protein loading control, *P<0.05, **P<0.01, both compared with 0 group. (D and G) U373 cells were treated as above. The protein levels of Bcl-2, Bax, cleaved caspase 3 and cleaved caspase 9 were measured by Western blotting. **P<0.01, both compared with 0 group. (F and H) U373 cells were treated as above. The protein levels of SRC/MAPKs signaling were measured by Western blotting. *P<0.05, **P<0.01, both compared with 0 group. The levels of p-SRC/SRC, p-MAPK1/MAPK1, p-MAPK8/MAPK8 were used to compare the levels of phospho-proteins, ##P<0.01, both compared with 0 group. Data were expressed as mean ± SD (n=6). |
CGA Suppresses the Malignant Growth of U373 Cells in vivo
To investigate the anti-tumor effects of CGA in vivo, we established xenograft models by subcutaneously injecting U373 cells into BALB/C-nu/nu nude mice. Tumor-bearing nude mice were treated with CGA (5, 10, or 20 mg/kg) or the same volume of normal saline for 24 d. CGA suppressed the malignant growth of U373 cells. As shown in Figure 8A and B, the mean volume of tumors and the mean weight of mice in the CGA groups were significantly lower than those in the normal saline group. As shown in Figure 8C and E, the number of apoptotic cells (green fluorescence) in tumor tissues was increased significantly as a function of CGA concentration. Hence, we identified that CGA induced apoptosis of U373 cells derived from xenograft tumors. H&E staining (Figure 8D) showed that CGA induced tumor cells to exhibit atypical nuclei, poor differentiation, and apoptosis. Moreover, immunohistochemistry (Figure 8D and H) showed that the expression levels of Ki-67 and SRC were decreased as a function of CGA concentration. Western blotting showed CGA could downregulate the protein levels of SRC, MAPK1 and MAPK8. Meanwhile, we measured the phosphorylated protein levels and we found that the ratios of p-SRC/SRC, p-MAPK1/MAPK1, and p-MAPK8/MAPK8 were decreased (Figure 8F and G). These findings suggested that CGA inhibited the proliferation of U373 cells, which may have been associated with downregulation of SRC/MAPKs signal pathway in vivo.
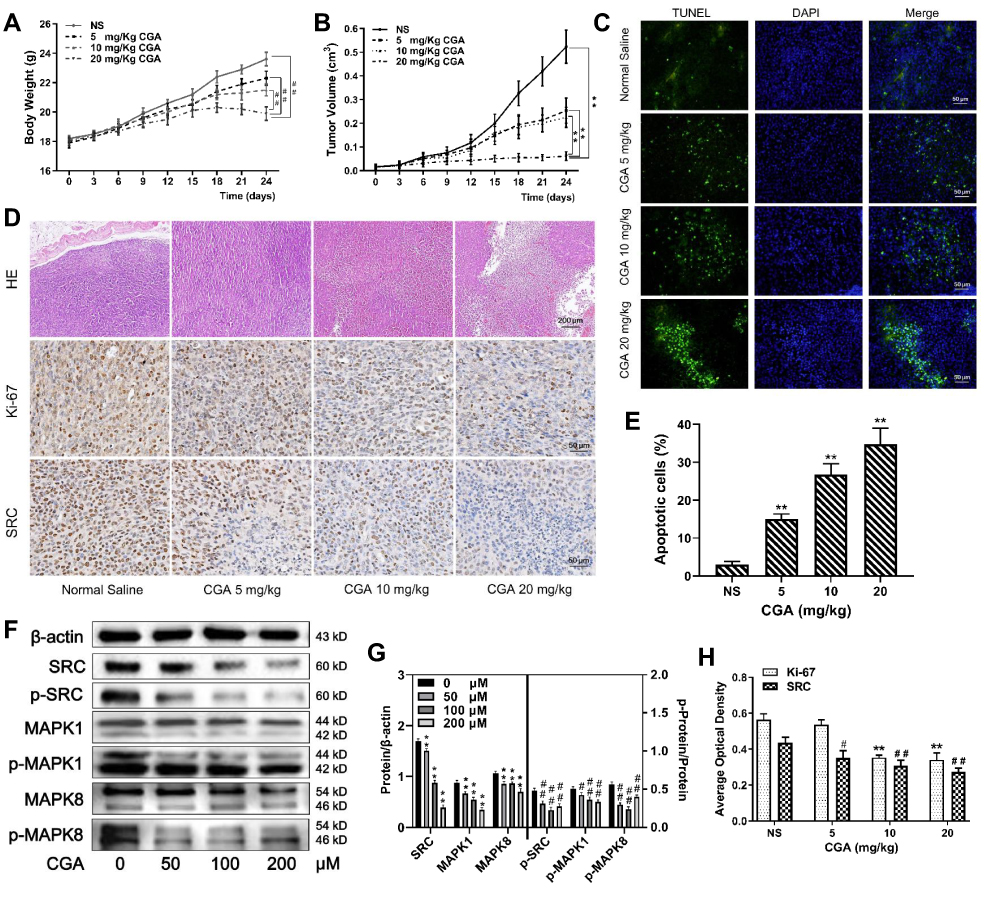 |
Figure 8 CGA suppressed the malignant growth of U373 cells in vivo. (A and B) The mean weight of mice and the mean volume of tumors in the CGA groups were lower significantly than those in the normal saline group, ##P<0.01, **P<0.01, compared with NS group. (C and E) TUNEL staining assay. With the increase of CGA’s concentrations, the apoptotic cells (green fluorescence) in tumor tissues increased significantly, **P<0.01, compared with NS group. (D and H) Hematoxylin-eosin (H&E) staining and Immunohistochemistry staining. Tumor cells became obvious atypia nuclei, poor differentiation, and apoptosis after treated with CGA. The expressions of Ki-67 and SRC decreased with the increase of CGA’s concentrations, **P<0.01, #P<0.05, ##P<0.01, compared with NS group. (F and G) CGA inhibited the protein levels of SRC/MAPKs signaling in vivo. **P<0.01, #P<0.05, ##P<0.01, both compared with NS group. Data were expressed as mean ± SD (n=3). |
Discussion
Glioma is the most common type of intracranial malignant tumor, which accounts for approximately 32% of primary central-nervous-system tumors and has recently exhibited an increasing yearly trend. The median survival time of anaplastic astrocytoma and glioblastoma are 2–3 years and one year, respectively.15,16 Glioma is characterized by unlimited proliferation and extensive invasion, which leads to difficult surgical resection. Furthermore, the malignant biological behaviors of glioma yield a poor prognosis, short survival, high recurrence rate, and high mortality, partially due to radio- and chemo-therapy resistance. Although the mechanisms of glioma pathogenesis remain unclear, they have been shown to be associated with the proliferation and migration of tumor cells.
In recent years, with the restriction of current treatment protocols for glioma and in-depth studies on the pharmacology of traditional Chinese medicines, it has been demonstrated that some traditional Chinese medicines exhibit anti-cancer effects with low toxicity and side effects in the context of tumor therapy. CGA, the characteristic active component of Eucommiae Cortex and Lonicerae Japonicae Flos, has a wide range of pharmacological activities. With the development of extraction and purification technology, the anti-tumor effects of CGA have attracted increased attention. Recent studies have shown that CGA exhibits therapeutic efficacies on various tumors such as lung cancer, liver cancer, and colorectal cancer.17–19 CGA, which is considered to be a candidate anti-tumor drug, has been shown to inhibit cellular proliferation, promote apoptosis, induce cell-cycle arrest, inhibit neovascularization, and regulate the tumor-associated immune microenvironment.20–22 Xue et al23 have demonstrated that CGA inhibits the growth of U87 glioblastoma cells in vivo and in vitro through inhibiting M2 polarization and promoting the M1-like phenotype of RAW264.7 and Ana-1 macrophages, in part by promoting STAT1 activation and inhibiting STAT6 activation. Other studies have further developed mannosylated liposomes for targeted delivery of CGA, which might inhibit G422 glioma cell growth by efficiently promoting the polarization of the pro-tumorigenic M2 phenotype to the anti-tumorigenic M1 phenotype.24 In addition, Sitarek et al25 found that CGA extracted from Leonurus sibiricuso induces apoptosis of glioma cells via up-regulating the expression of p53, promoting the repair of injured DNA, and increasing the proportion of Bax/Bcl-2. These results are consistent with the findings of our present study. In addition, Belkaid et al26 found that CGA inhibits the activity of G6PT in U87 glioma cells to hinder the glycolysis pathway, thereby inhibiting tumor growth and invasion.
Anti-tumor effects of CGA have been found when used to treat many other types of tumors, such as cervical cancer, colon cancer, and tongue cancer, indicating that CGA may be a potential anticancer drug. Previous studies have shown that CGA suppresses the proliferation of glioma cells by inhibiting angiogenesis in a hypoxic environment via down-regulating the HIF-1α/AKT pathway. Other studies have suggested that CGA induces cell-cycle arrest of MCF-7 cells at the G1 phase. In contrast, our present findings showed that CGA significantly induced cell-cycle arrest of glioma U373 cells at the G2/M phase.
The mitochondrial apoptotic pathway is an important apoptotic pathway in many different cell types. Bcl-2 family proteins are key regulators in the regulation of mitochondrial-mediated apoptosis. Bcl-2 family proteins include pro-apoptotic proteins (eg, Bax, Bak) and anti-apoptotic proteins (eg, Bcl-2, Bcl-XL, and MCL-1). An increase in the Bax/Bcl-2 ratio induces mitochondria to release cytochrome c into the cytoplasm, where it then combines with apoptotic protein activating factor-1 (Apaf-1) and the precursor of Caspase-9 to form apoptotic bodies, which lead to the cleavage and activation of Caspase-9 and Caspase-3. Finally, activated Caspase-3 induces apoptosis. Caspase-8 is also a key promoter in the death-receptor-mediated apoptotic pathway, which can cleave and activate itself and activate downstream caspase proteins to induce apoptosis.27 Our present results showed that CGA increased the Bax/Bcl-2 ratio in U373 cells and initiated mitochondrial apoptosis, ultimately inducing apoptosis of U373 cells.
The migration and invasion of glioma cells are the results of multi-step and multi-factor processes, which include changes in epithelial cell polarity (ie, the EMT), cell adhesion, secretion of hydrolase hydrolyzed matrix, and infiltration of the basement membrane.28 In the present study, network pharmacology analysis predicted that CGA has 40 protein targets, which were mainly concentrated in tumorigenic signaling pathways, such as the MAPK, Ras, and HIF-1 pathways.
The migration and invasion of tumor cells are two of the most important processes in tumor progression. MMPs, a family of zinc-binding endopeptidases, are core proteolytic enzymes that play a role in the degradation of the extracellular matrix (ECM).29 Overexpression of MMPs induces hydrolysis of the ECM, which weakens or removes the barrier between the ECM and basement membrane. Thereafter, tumor cells undergo migration and invasion to promote the EMT. MMPs can effectively degrade type-IV collagen, the main component of the ECM. Therefore, the protein expression patterns of MMP-2 and MMP-9 are often used to reflect the migratory and invasive abilities of cancer cells.30 In the present study, we found that CGA inhibited the migratory ability of glioma U373 cells in a concentration-dependent manner. Furthermore, Western blotting was used to detect the migration-related proteins, MMP-2 and MMP-9. The results showed that CGA significantly down-regulated the protein levels of MMP-2 and MMP-9 in glioma U373 cells, which indicated that CGA may inhibit the migration ability of glioma U373 cells by down-regulating the protein expression of MMP-2 and MMP-9 in glioma cells.
EMT plays an important role in the invasion and metastasis of tumor cells, and the epithelial marker E-cadherin and stromal marker Vimentin, are the most typical EMT markers.31 In the present study, the results of Western blotting showed that the expression of E-cadherin protein increased gradually with increasing CGA concentrations. In contrast, the expression of Vimentin protein decreased gradually with increasing CGA concentrations, suggesting that CGA inhibited progression of the EMT. Hence, we speculate that CGA may inhibit the proliferation and migration of glioma cells by inhibiting the EMT via inhibiting the SRC/MAPKs signaling pathway.
The SRC/MAPKs signaling pathway is an important pathway that controls a variety of physiological and pathological processes of cancer cells.32 In the present study, we predicted that the molecular mechanisms of CGA in inhibiting migration and invasion of U373 cells may be associated with the expression of SRC, MAPK1, and MAPK8, as indicated by network pharmacology analysis. Furthermore, we found that CGA could reduce the total protein levels of both SRC and MAPK1 in vivo and in vitro. And we found that the protein level of MAPK8 decreased in vivo, the protein level of MAPK8 has no significant change, but the level of phosphorylated protein levels of MAPK8 was decreased in in vitro. So we speculated that the anti-glioma mechanisms of CGA might be associated to the decrease of phosphorylated proteins in SRC/MAPKs signal pathway.
Conclusion
In this study, we investigated the anti-tumor effects of CGA and its possible mechanisms on human glioma U373 cells via network pharmacology analysis. We found that CGA inhibited proliferation, migration, and invasion, as well as induced apoptosis and cell-cycle arrest at the G2/M phase, of U373 cells by inhibiting the SRC/MAPKs signaling pathway. Taken together, our findings provide an important theoretical basis for the clinical study of CGA in the treatment of glioma.
Abbreviations
CGA, chlorogenic acid; SRC, proto-oncogene tyrosine-protein kinase Src; MAPK, mitogen-activated protein kinase; RPMI-1604, Roswell Park Memorial Institute-1640; FBS, fetal bovine serum; DMSO, Dimethyl sulfoxide; PI, Propidium Iodide; PBS, phosphate-buffered saline; TUNEL, terminal deoxynucleotidyl transferase dUTP nick-end labeling; MMP, Matrix metalloproteinase; PPI, protein-protein interaction; MCODE, molecular complex detection; BP, biological process; CC, cellular component; MF, molecular function; GO, Gene ontology; KEGG, Kyoto Encyclopedia of Genes and Genomes; EMT, epithelial-mesenchymal transformation.
Disclosure
The authors declare no potential conflicts of interest.
References
1. Zheng S, Tao W. Identification of novel transcriptome signature as a potential prognostic biomarker for anti-angiogenic therapy in glioblastoma multiforme. Cancers. 2020;12:2368–2378. doi:10.3390/cancers12092368
2. Cai H, Liu W, Liu X, et al. Advances and prospects of vasculogenic mimicry in glioma: a potential new therapeutic target? Onco Targets Ther. 2020;13:4473–4483. doi:10.2147/OTT.S247855
3. Naveed M, Hejazi V, Abbas M, et al. Chlorogenic acid (CGA): a pharmacological review and call for further research. Biomed Pharmacother. 2017;97:67–74. doi:10.1016/j.biopha.2017.10.064
4. Tajik N, Tajik M, Mack I, et al. The potential effects of chlorogenic acid, the main phenolic components in coffee, on health: a comprehensive review of the literature. Eur J Nutr. 2017;56(7):2215–2244. doi:10.1007/s00394-017-1379-1
5. Zhang GB, Li QY, Chen QL, et al. Network pharmacology: a new approach for Chinese herbal medicine Research. Evid Based Complement Alternat Med. 2013;2013:621423–621433. doi:10.1155/2013/621423
6. Antoine D, Olivier M, Vincent Z. SwissTargetPrediction: updated data and new features for efficient prediction of protein targets of small molecules. Nucleic Acids Res. 2019;47(W1):W357–W364. doi:10.1093/nar/gkz382
7. Santos R, Ursu O, Gaulton A, et al. A comprehensive map of molecular drug targets. Nat Rev Drug Discov. 2017;16(1):19–34. doi:10.1038/nrd.2016.230
8. Amberger JS, Bocchini CA, Schiettecatte F, et al. OMIM.org: Online Mendelian Inheritance in Man (OMIM®), an online catalog of human genes and genetic disorders. Nucleic Acids Res. 2015;43(D1):D789–D798. doi:10.1093/nar/gku1205
9. Marilyn S, Irina D, Justin A, et al. GeneCards Version 3: the human gene integrator. Database. 2010:baq020. doi:10.1093/database/baq020.
10. Janet P, Lex B, Núria QR, et al. DisGeNET: a comprehensive platform integrating information on human disease-associated genes and variants. Nucleic Acids Res. 2017;45(D1):D833–D839. doi:10.1093/nar/gkw943
11. Damian S, Gable AL, David L, et al. STRING v11: protein-protein association networks with increased coverage, supporting functional discovery in genome-wide experimental datasets. Nucleic Acids Res. 2018;47:D607–D613. doi:10.1093/nar/gky1131
12. Nadezhda TD, John HM, Jan G, et al. Cytoscape StringApp: network analysis and visualization of proteomics data. J Proteome Res. 2019;18(2):623–632. doi:10.1021/acs.jproteome.8b00702
13. Bandettini WP, Kellman P, Mancini C, et al. Multi Contrast Delayed Enhancement (MCODE) improves detection of subendocardial myocardial infarction by late gadolinium enhancement cardiovascular magnetic resonance: a clinical validation study. J Cardiovasc Magn Reson. 2012;14(1):83–93. doi:10.1186/1532-429X-14-83
14. Zhou JB, Li GH, Feng S, et al. Emodin induced necroptosis in the glioma cell line U251 via the TNF-α/RIP1/RIP3 pathway. Invest New Drugs. 2020;38(1):50–59. doi:10.1007/s10637-019-00764-w
15. Chang S, Zhang P, Cairncross JG, et al. Phase III randomized study of radiation and temozolomide versus radiation and nitrosourea therapy for anaplastic astrocytoma: results of NRG Oncology RTOG 9813. Neuro Oncol. 2017;19(2):252–258. doi:10.1093/neuonc/now236
16. Roger S, Sophie T, Andrew AK, et al. Maintenance therapy with tumor-treating fields plus temozolomide vs temozolomide alone for glioblastoma: a Randomized Clinical Trial. JAMA. 2015;314(23):2535–2543. doi:10.1001/jama.2015.16669
17. Park JJ, Hwang SJ, Park JH, et al. Chlorogenic acid inhibits hypoxia-induced angiogenesis via down-regulation of the HIF-1α/AKT pathway. Cell Oncol. 2015;38(2):111–118. doi:10.1007/s13402-014-0216-2
18. Yan Y, Liu N, Hou N, et al. Chlorogenic acid inhibits hepatocellular carcinoma in vitro and in vivo. J Nutr Biochem. 2017;46:68–73. doi:10.1016/j.jnutbio.2017.04.007
19. Nuria MS, Christina MH, Veronika S, et al. Biscuits with no added sugar containing stevia, coffee fibre and fructooligosaccharides modifies α-glucosidase activity and the release of GLP-1 from HuTu-80 cells and serotonin from Caco-2 cells after in vitro digestion. Nutrients. 2017;9(7):694–705. doi:10.3390/nu9070694
20. Han D, Gu X, Gao J, et al. Chlorogenic acid promotes the Nrf2/HO-1 anti-oxidative pathway by activating p21 Waf1/Cip1 to resist dexamethasone-induced apoptosis in osteoblastic cells. Free Radic Biol Med. 2019;137:1–12. doi:10.1016/j.freeradbiomed.2019.04.014
21. Lin S, Lai TC, Chen L, et al. Antioxidant and antiangiogenic properties of phenolic extract from pleurotus tuber-regium. J Agric Food Chem. 2014;62(39):9488–9498. doi:10.1021/jf5031604
22. Seyed F, Silvia T, William N, et al. Chlorogenic acid and mental diseases: from chemistry to medicine. Curr Neuropharmacol. 2017;15(4):471–479. doi:10.2174/1570159X14666160325120625
23. Xue N, Zhou Q, Ji M, et al. Chlorogenic acid inhibits glioblastoma growth through repolarizating macrophage from M2 to M1 phenotype. Sci Rep. 2017;7(1):39011–39023. doi:10.1038/srep39011
24. Ye J, Yang Y, Jin J, et al. Targeted delivery of chlorogenic acid by mannosylated liposomes to effectively promote the polarization of TAMs for the treatment of glioblastoma. Bioact Mater. 2020;5(3):694–708. doi:10.1016/j.bioactmat.2020.05.001
25. Sitarek P, Skała E, Toma M, et al. A preliminary study of apoptosis induction in glioma cells via alteration of the Bax/Bcl-2-p53 axis by transformed and non-transformed root extracts of Leonurus sibiricus L. Tumor Biol. 2016;37(7):8753–8764. doi:10.1007/s13277-015-4714-2
26. Belkaid A, Copland I, Massillon D, et al. Silencing of the human microsomal glucose- 6- phosphate translocase induces glioma cell death: potential new anticancer target for curcumin. FEBS Lett. 2006;580(15):3746–3752. doi:10.1016/j.febslet.2006.05.071
27. Giulia F, Claudia C, Alessandra F, et al. Caspase-8: a novel target to overcome resistance to chemotherapy in glioblastoma. Int J Mol Sci. 2018;19(12):3798–3810. doi:10.3390/ijms19123798
28. Anushka D, Robert AW. New insights into the mechanisms of epithelial-mesenchymal transition and implications for cancer. Nat Rev Mol Cell Biol. 2019;20(2):69–84. doi:10.1038/s41580-018-0080-4
29. Cui N, Hu M, Khalil RA. Biochemical and biological attributes of matrix metalloproteinases. Prog Mol Biol Transl Sci. 2017;147:1–73. doi:10.3389/fimmu.2019.01278
30. Fields GB. Mechanisms of action of novel drugs targeting angiogenesis-promoting matrix metalloproteinases. Front Immunol. 2019;10:1278–1288. doi:10.3389/fimmu.2019.01278
31. Patricia CC, Frederico AS, Adriane RT, et al. Cellular glycosylation senses metabolic changes and modulates cell plasticity during epithelial to mesenchymal transition. Dev Dyn. 2018;247(3):481–491. doi:10.1002/dvdy.24553
32. Kim LC, Song L, Haura EB. Src kinases as therapeutic targets for cancer. Nat Rev Clin Oncol. 2009;6(10):587–595. doi:10.1038/nrclinonc.2009.129
 © 2021 The Author(s). This work is published and licensed by Dove Medical Press Limited. The full terms of this license are available at https://www.dovepress.com/terms.php and incorporate the Creative Commons Attribution - Non Commercial (unported, v3.0) License.
By accessing the work you hereby accept the Terms. Non-commercial uses of the work are permitted without any further permission from Dove Medical Press Limited, provided the work is properly attributed. For permission for commercial use of this work, please see paragraphs 4.2 and 5 of our Terms.
© 2021 The Author(s). This work is published and licensed by Dove Medical Press Limited. The full terms of this license are available at https://www.dovepress.com/terms.php and incorporate the Creative Commons Attribution - Non Commercial (unported, v3.0) License.
By accessing the work you hereby accept the Terms. Non-commercial uses of the work are permitted without any further permission from Dove Medical Press Limited, provided the work is properly attributed. For permission for commercial use of this work, please see paragraphs 4.2 and 5 of our Terms.