")
Back to Journals » Cancer Management and Research » Volume 12
Chinese Cancer Research in 2009–18 and the Disease Burden
Received 11 March 2020
Accepted for publication 1 June 2020
Published 25 June 2020 Volume 2020:12 Pages 5031—5040
DOI https://doi.org/10.2147/CMAR.S253276
Checked for plagiarism Yes
Review by Single anonymous peer review
Peer reviewer comments 2
Editor who approved publication: Dr Eileen O'Reilly
Aihua Li,1 Grant Lewison2
1Institute of Medical Information, Chinese Academy of Medical Sciences, Beijing, People’s Republic of China; 2King’s College London, Institute of Cancer Policy, Guy’s Hospital, London SE1 9RT, UK
Correspondence: Aihua Li
Institute of Medical Information, Chinese Academy of Medical Sciences, Beijing, People’s Republic of China
Email [email protected]
Objective: We investigated the correlation of cancer research in China with its disease burden and national or provincial wealth. We also compared China’s research output with that of other Asian countries.
Methods: Chinese publications on cancer research for 2009– 18 were retrieved from the Web of Science with a special filter giving high precision and recall. Their volume relative to gross domestic product (GDP) was compared with those of 14 Asian countries, and provincial outputs with provincial GDPs. Their distribution by anatomical site was compared with China’s disease burden, and by research type with that of Europe.
Results: Chinese cancer research publications (including those from Taiwan) have grown rapidly in the last 10 years, and overtook those of the USA in 2018. Relative to other Asian countries, Chinese output was approximately proportionate to its wealth. Relative to its cancer burden (as a percentage of the total disease burden), China published an appropriate amount of cancer research in 2009– 13, but almost one-third more in 2014– 18. Its distribution between the provinces reflected their wealth, but with comparatively greater outputs from Beijing and Shanghai. The distribution of China’s cancer research portfolio by anatomical site corresponded to its disease burden quite well, with a heavy emphasis on liver and stomach cancer. However, China did relatively less research on screening, diagnosis, palliative care, or quality of life.
Conclusion: The national and provincial cancer research in China in the past 10 years correlated relatively well with its disease burden and economic level, but over-emphasised basic research compared with prevention, screening and end-of-life care.
Keywords: Chinese cancer research, burden of disease, comparison with GDP, anatomical site, research type
Introduction
The People’s Republic of China, or simply “China”, has developed enormously in the last 40 years. Its economy has expanded rapidly, from barely 6% of that of the USA in 1990 to over 66% in 2018 (Data of China mainland).1 The much greater prosperity has led to great changes in society, and in its health.2 Food is now much more plentiful and varied,3 but pollution is a serious problem in the major cities.4 Life expectancy has increased dramatically, from 44 years in 1960 to 60 years in 1972, 70 years in 1994, and nearly 77 years in 2018.5 The one-child policy to restrict population growth, which was in force (but only partially) from 1979 to 2015, meant that China now has a relatively aged population compared with, say, Indonesia.6 Over 16% of its population are over 60 years of age, compared with only 9% in Indonesia – but nearly 34% in Japan.7,8
This means that China is increasingly suffering from the non-communicable diseases that affect older people, and in particular, from cancer. In 1990, cancer accounted for 10.5% of the total Chinese disease burden (measured in Disability-Adjusted Life Years, DALYs), but it was 16.6% in 2015, according to data from the Institute for Health Metrics and Evaluation at the University of Washington, USA.9 [DALYs include both early deaths relative to life expectancy in Japan, currently the world’s highest, and the suffering experienced by patients with the disease or disability on a scale from zero = perfect health to unity = death.10 For example, loss of a finger = 0.1 but blindness = 0.6.] The corresponding percentages of the total disease burden from cancer in 2015 for Indonesia and Japan were 7.2% and 19.0%, which show that China was much closer to Japan in this respect. This percentage depends largely on the percentage of a country’s population that is 50 years of age or older, but much less on its wealth and amount of adult obesity, see Figure 1.
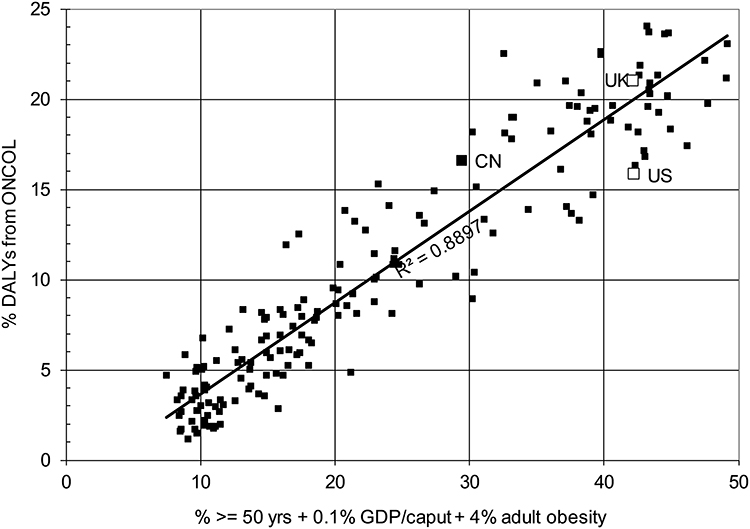 |
Figure 1 The correlation between the percentage of DALYs for all disease that are attributable to cancer in 2015 for 170 countries (WHO data) and a composite independent variable: The percentage of the country’s population aged 50+ plus the GNP/caput (thousands of US dollars, World Bank data) plus the percentage of adult obesity/25. Spots for China (CN), the UK and the USA marked. |
However, the pattern of disease from cancer in China differs notably from that in other industrial countries, for that is what China has become. Figure 2 compares the relative burden from the different manifestations of cancer with those in Europe (defined here as the 27 European Union Member States plus Iceland, Norway, Switzerland and the UK) and in the USA, as given by WHO data for 2015. China suffers relatively far more from liver, stomach and oesophageal cancers, but correspondingly less from breast, pancreatic and prostate cancers.
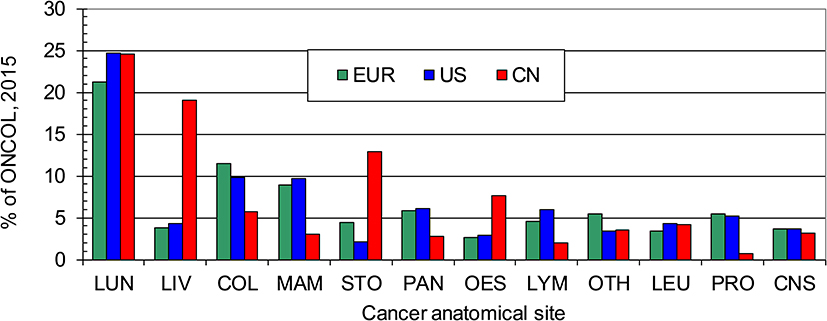 |
Figure 2 Disease burden (percent of all malignant neoplasms) for EUR31, the USA and China in 2015 (WHO data).Abbreviations: LUN, lung cancer; LIV, liver; COL, colorectal; MAM, breast; STO, stomach; PAN, pancreatic; OES, oesophageal; LYM, lymphoma; OTH, other cancers; LEU, leukaemia; PRO, prostate; CNS, central nervous system. |
All three geographical areas suffer most from lung cancer (defined by the WHO as “trachea, bronchus and lung”). Smoking is very prevalent in China, with over 350 million smokers, and is still considered socially acceptable, especially in rural areas.11 Although formally the Chinese government is trying to limit smoking, the substantial revenues generated by the China National Tobacco Corporation inhibit enforcement of bans.12 Cigarette consumption in China rose by 27% from 2004 to 2018,13 whereas in the USA it declined by 40% over the same period.14 At present it is still rare for women in China to smoke, but this is changing among young adults.11 Consequently, the overall cancer burden for women in 2017 (14.0% of all DALYs according to the Institute for Health Metrics and Evaluation (IHME) data) was 72% of that for men, which was 19.5%. For 2015, it was 60%9 and it is likely to continue increasing in the future if this situation is not effectively addressed.
China is also very varied geographically. Its 34 provinces (including Hong Kong, Macau and Taiwan) vary greatly in wealth (the ones on the eastern seaboard are the most prosperous) and also in terms of population. Table 1 lists them with their digraph codes, population and wealth (GDP per caput). Clearly there are some extremes of wealth (Macau, Hong Kong), and of poverty (Gansu, Guizhou, Yunnan and Tibet). These will affect the capacity of the different provinces to carry out research. China’s population overall was 55% urban (in 2014), but 11 provinces, mainly in the south and west, were more than 50% rural, where medical treatment is less advanced.15 The incidence of malignant tumors in urban areas is higher than that in rural areas (Age-standardized incidence rates by Chinese standard population in 2015 were 196/100,000 vs 183/100,000), while the mortality in rural areas is higher than that in urban areas (Age-standardized mortality by Chinese standard population in 2015 were 104/100,000 vs 111/100,000).16 This may be related to the difference in the composition of the cancer spectrum between urban and rural areas. In rural areas, malignant tumors of the digestive system with a poor prognosis, such as esophageal cancer, stomach cancer and liver cancer, are the major cancers, while in urban areas, malignant tumors such as colorectal cancer and breast cancer are the most common. In addition, the poor allocation of medical resources in rural areas, the poor level of diagnosis and treatment, and the lack of health awareness among residents also lead to the relatively low survival rate from malignant tumors in rural areas.16,17 However, the differences in the incidence of, and deaths from, malignant tumors between urban and rural areas are gradually decreasing, which may be due to the narrowing difference in the risk factors of malignant tumors between urban and rural areas, such as smoking, chronic infection, diet and air pollution.
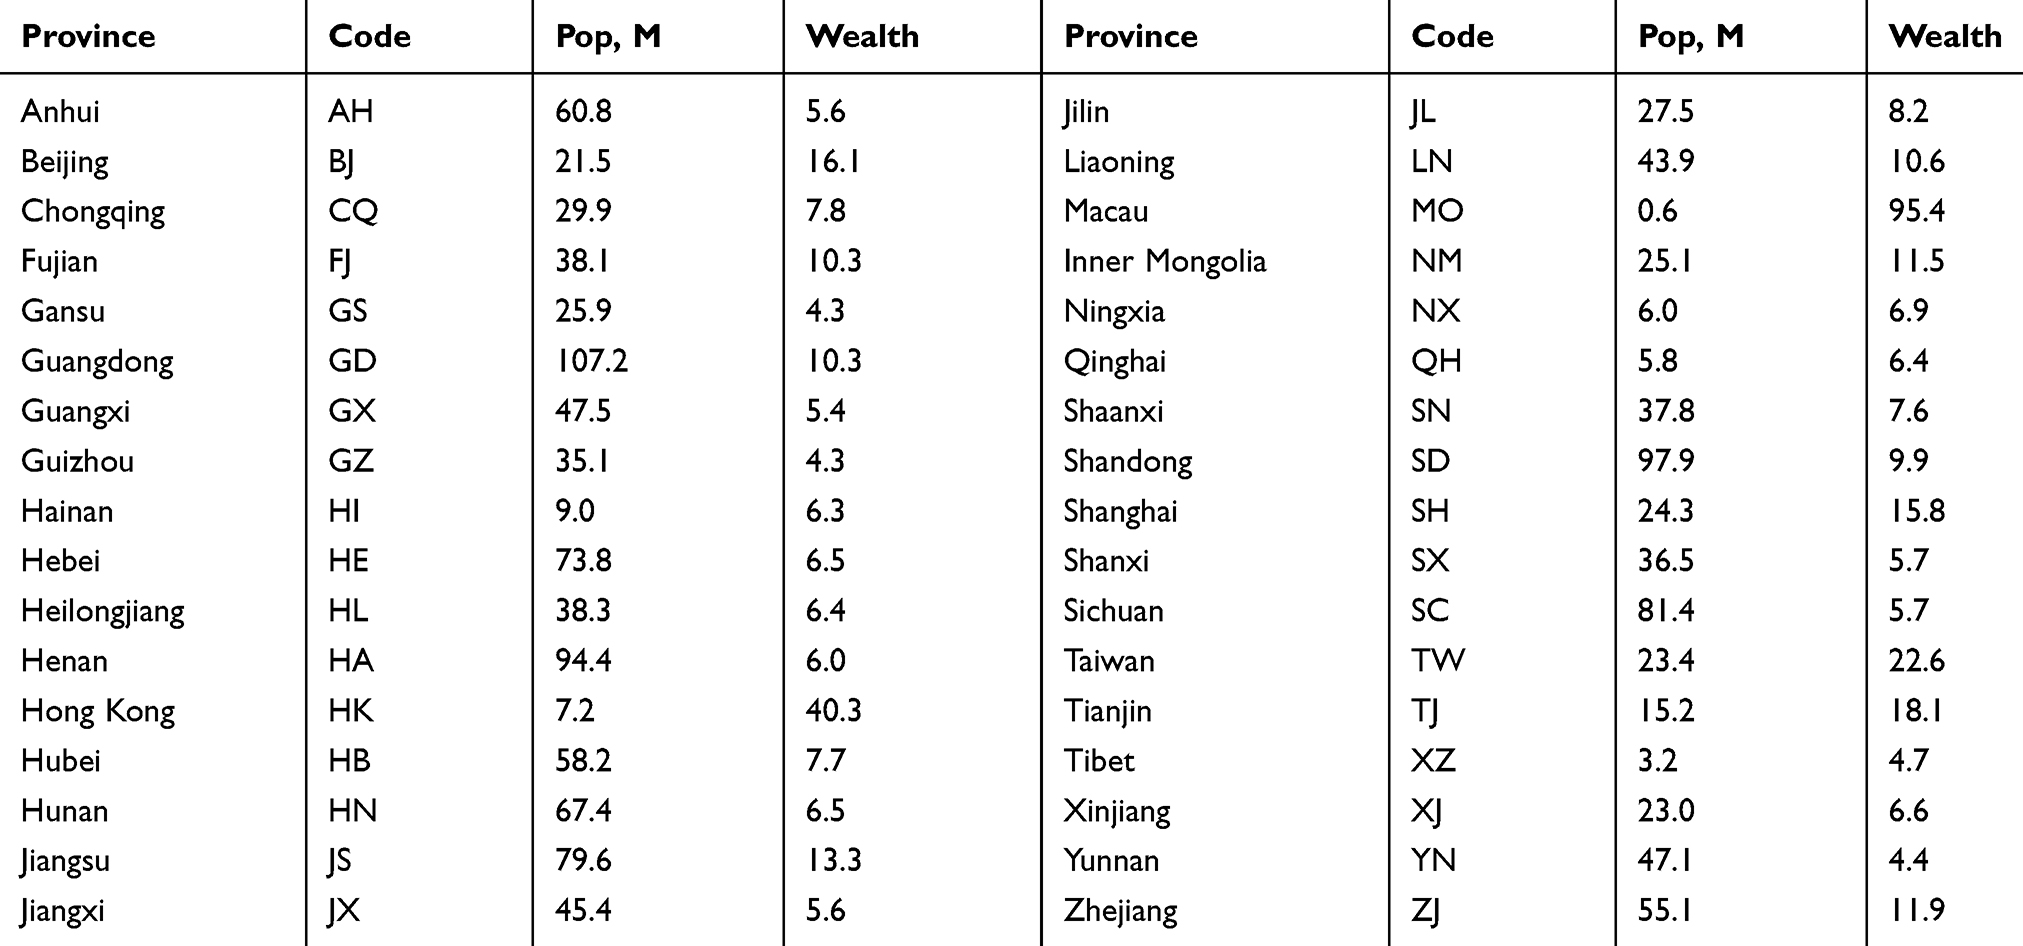 |
Table 1 The 34 Provinces of China, with Their Populations (2014) and Wealth (US$ per Caput, Thousands) |
The medical and health care system of China includes hospitals, basic medical and health institutions, and specialised public health institutions. Hospitals are divided into public hospitals and social hospitals. Among them, public hospitals are divided into government-run hospitals (including county hospitals, city hospitals, provincial hospitals, and ministerial hospitals), and other public hospitals (including military hospitals, state-owned and collective enterprises and institutions). Medical and health institutions at or below the county level are classified into public and social organizations. Specialized public health institutions, including the Center of Disease Control and Maternal and Children Health Institution, are divided into government-run specialised public health institutions and other specialised public health institutions (mainly state-owned and collective enterprises and institutions). According to the different levels, government-run specialised public health institutions can be divided into four categories: County-run, city-run, provincial-run and ministerial-run.18
The Chinese government has now achieved universal medical insurance coverage through two systems: The Basic Medical Insurance System for Urban Employees (BMISUE) and the Basic Medical Insurance System for Urban and Rural Residents (BMISURR). But these do not cover all cancer treatment costs, especially expensive targeted drugs. In order to benefit more cancer patients, since 2013 anti-cancer targeting drugs such as Imatinib have been included in local medical insurance. In 2019, 17 anti-cancer targeting drugs were included in the national basic medical insurance program.19 The Chinese government is now making cancer drugs cheaper and making the process for their approval quicker and smoother.20
At present, China’s cancer institutions mainly focus on treatment, but also take the social responsibility for promoting cancer prevention. With the “Healthy China Strategy” becoming a national strategy, cancer prevention has become more focused than before. China is promoting prevention and control measures of “early screening and early diagnosis and treatment”. A National Cancer Prevention and control network was established under the leadership of the National Cancer Center. China will set up a cancer registration reporting system in medical institutions above the county level. There are now 574 cancer registries in 31 provincial-level regions. A national, provincial, municipal and county cancer prevention and control system is being established to provide strong technical support for prevention and control work.21
At present, investment in medical research in China is mainly from the central government. The leading funding agencies are the Ministry of Science and Technology, the National Natural Science Foundation Committee, the National Development and Reform Commission, and the Departments of Health and Education. Local government commissions are also important sources of funding. Over the past decades, China’s support for the national key areas of medical research has been financed through the National Key Basic Research Program of China (973 Program), the National High Technology Research and Development Program of China (863 Program), the Science and Technology Support Plan and the National Natural Scientific Fund (before 2015) and the National Key Research and Development Project, and the National Natural Scientific Fund since 2016. The state input has been adjusted in accordance with the five-year plan.
Considering the economic growth of China, and the development of its health policy and medical research funding mechanisms, we sought to compare the output of Chinese cancer research, relative to its wealth, with that of 14 Asian countries, and also to make a comparison at the provincial level. We also sought to compare the distribution of Chinese cancer research by anatomical site with the corresponding disease burden, and the distribution by research type with that in Europe, for which data were available.
Methods
Cancer research was defined with a filter consisting of 185 specialist journal titles and 323 title words or phrases.22 It had a precision, p, of 0.95 and a recall, r, of 0.98.23 It was applied to the Web of Science (WoS, © Clarivate Analytics) for the ten years 2009–18, and the details of the Chinese papers were downloaded (in March 2019) to a series of text files, each containing 500 papers. [We did not search PubMed because we needed more information about the papers than is contained therein, notably all the addresses.] A special macro was used to convert these bibliographic data to an Excel spreadsheet. Another macro was used to identify the fractional count of each province (including Hong Kong, Macau and Taiwan), based on its name, or individual cities, appearing in the addresses on each paper.
The gross domestic products of each province in 2014 were obtained from the National Bureau of Statistics of China for comparison with the outputs in the ten-year study period.15 We also obtained data on the Chinese disease burden from the different cancers in 2010 and 2015, measured in DALYs, from the World Health Organization (WHO) burden of disease website. These were compared with the distribution of cancer research papers on the different sites (eg, breast, liver) obtained by means of another macro based on the presence of journal name strings and title words. A fourth macro was used to characterise the individual papers by their research type, or domain, such as genetics or surgery. We also determined the numbers of papers that were describing the results of clinical trials, again by means of a macro based on title words and phrases, such as double-blind, Phase II, and randomized.
For comparison purposes, we also determined the numbers of cancer research papers from 13 other Asian countries over the 10-year study period, and in the two quinquennia, 2009–13 and 2014–18. The countries are listed in Table 2, with their ISO2 codes, and their GDPs in 2015. These outputs were whole, or integer, counts, as it was not practicable to download all these papers in order to determine fractional counts.
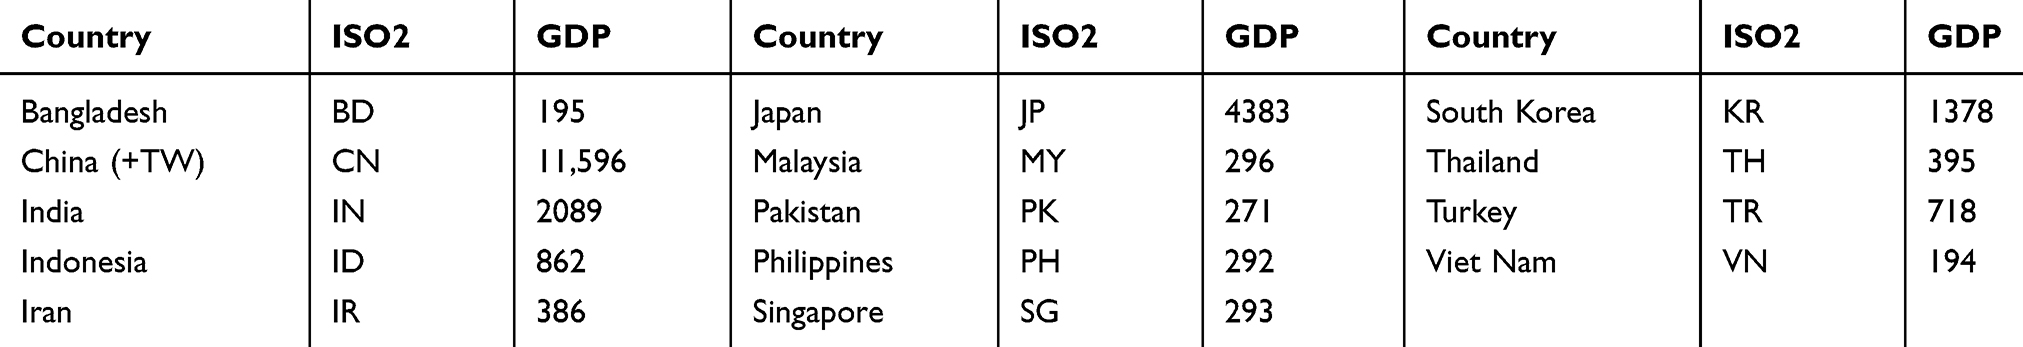 |
Table 2 Asian Countries Used as Comparators for China’s Cancer and Biomedical Research Outputs, with Their Gross Domestic Products (GDPs) in 2015 (Billion US Dollars) |
We also wished to compare China’s cancer research output with the totality of its biomedical research. For this purpose, we used a previously-developed filter for the WoS based on address terms and contractions.24,25 We determined each country’s integer counts of biomedical research papers for 2009–18, and then compared the percentage of biomedical research represented by cancer research with the percentage of its disease burden (in DALYs) attributable to cancer in 2010.
Results
China’s research capability and outputs of papers in the last two decades have both been increasing spectacularly. In cancer research its WoS output of articles and reviews increased from almost 1500 per year in 2000 to nearly 15,000 per year in 2012, and over 40,000 in 2019. Its output overtook that of the USA in 2018,26 see Figure 3. The outputs of the 31 European countries closely parallel those of the USA, but remain slightly higher.
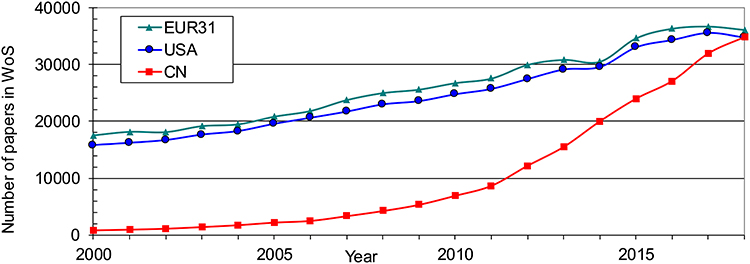 |
Figure 3 Outputs of cancer research papers (articles + reviews) in the web of science, 2000–18, for EUR31, the USA, and for China (including Taiwan). |
Figure 4 shows the outputs of the 14 Asian countries in biomedical research in relation to their wealth and the changes that have occurred over the decade. The correlation is only moderately positive because two countries, Indonesia and the Philippines, do relatively little cancer research. China’s performance was close to the best correlation line, but was relatively lower than that of Iran, Turkey, Singapore and South Korea. Figure 5 shows the Asian countries’ ratios for cancer research as a fraction of all biomedical research, and the relative burdens from cancer, again for the two quinquennia, 2009–13 and 2014–18. China and India both appeared to be devoting relatively more effort to cancer research than their disease burden would appear to warrant.
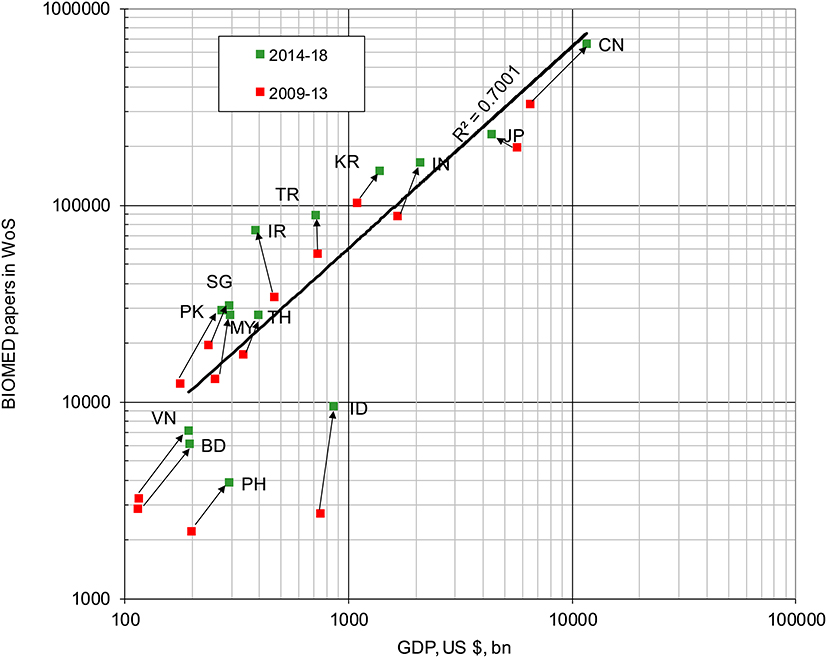 |
Figure 4 Biomedical research outputs in 2009–13 and 2014–18 from 14 Asian countries in relation to their gross domestic products (GDP) in 2010 and 2015. For ISO codes, see Table 2. |
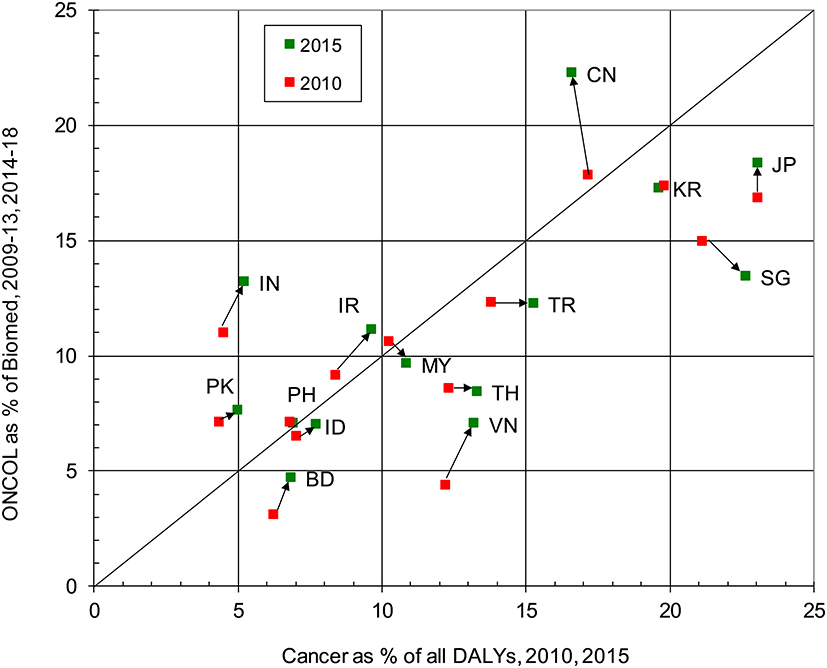 |
Figure 5 Percentages of biomedical research represented by cancer (ONCOL) in 2009–13 and 2014–18 for 14 Asian countries in relation to their cancer burden, relative to all diseases and disorders in 2010 and 2015 (WHO data on DALYs). For ISO codes, see Table 2. |
The outputs in cancer research of the Chinese provinces, on a fractional count basis, are shown in Figure 6 where they are compared with the gross domestic product (GDP) of the provinces in 2014. There is a fair correlation between the two values (r2 = 0.82), but clearly some provinces such as the cities Beijing (BJ) and Shanghai (SH) are publishing five times what might have been expected because of their contributions from top-rank universities and National Academy laboratories. However, Inner Mongolia (NM) is publishing only one-fifth of the amount expected from its wealth.
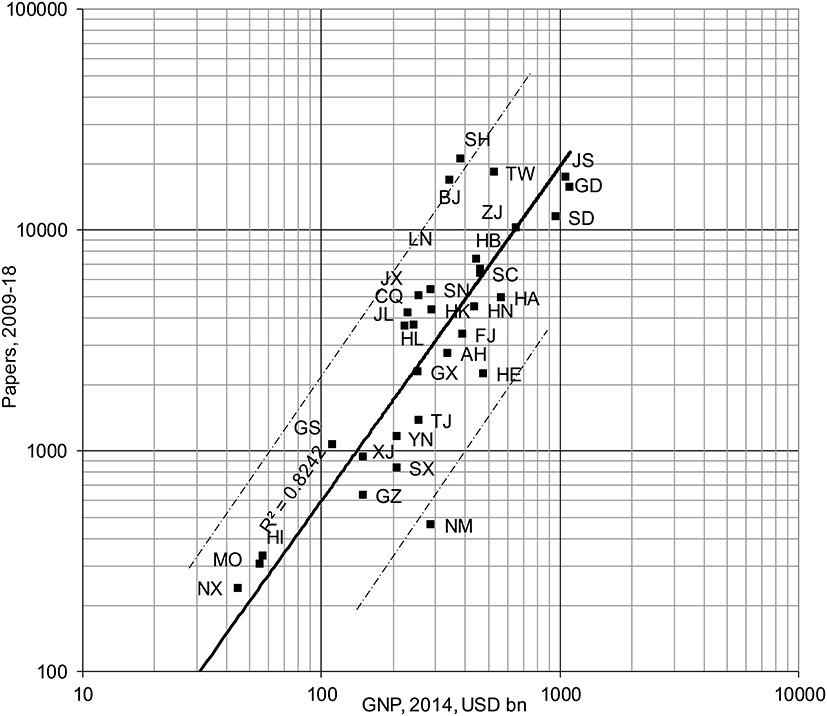 |
Figure 6 Plot of outputs of Chinese cancer research papers from each province (for codes, see Table 1) in 2009–18 compared with its gross domestic product in 2014, US $ billion. Best fit line is a power law line; chain dotted lines show values x 5 or x 0.2 the least-squares line. Qinghai and Tibet not shown as their research outputs were below 100 papers. |
Figure 7 shows the outputs relevant to different cancer sites. These have again been split into two quinquennia (2009–13 and 2014–18), and compared respectively with the burden (in DALYs) for 2010 and 2015. As in both Europe and the USA, breast cancer (although a minor cancer in China, with 3% of the burden) is over-researched by a factor of about four, but lung and oesophageal cancer are under-researched. However, unlike in Europe, pancreatic cancer receives a fair amount of attention. The biggest difference from Europe is that there is a fairly strong (r2 = 0.52) and positive correlation between research and the disease burden from different manifestations, whereas in Europe the correlation is “rather weak”.23
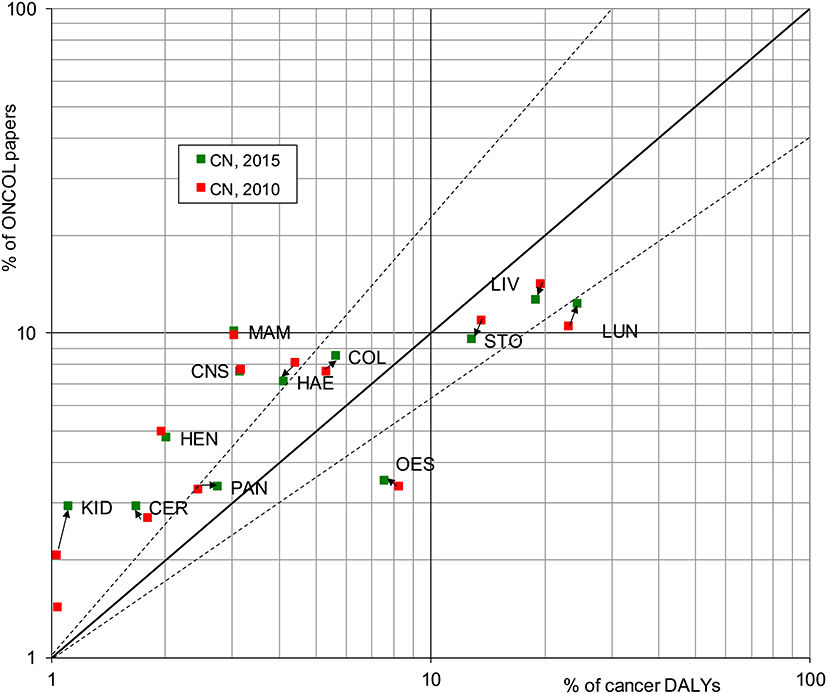 |
Figure 7 Plot of Chinese cancer research outputs in two quinquennia, 2009–13 and 2014–18, on different anatomical cancer sites, and percentage of the burden from each cancer manifestation (relative to the total for all cancers) in 2010 and 2015 (from WHO data). Dashed lines show values twice or half those expected from the diagonal line of equality. For codes, see abbreviations list to Figure 2. |
Research types, or domains, for Chinese cancer research in 2009–18 are shown in chart form in Figure 8, where they are compared with the corresponding analysis for EUR31 for 2002–13. China concentrates even more than Europe on genetics and prognosis, but relatively neglects radiotherapy, screening, and palliative care. These are important areas of research, particularly for the prevention of cancer and treatment of end-stage patients. It also publishes relatively few papers on clinical trials, only 1.2% of its total, compared with 3.3% in Europe and 3.6% in the USA.
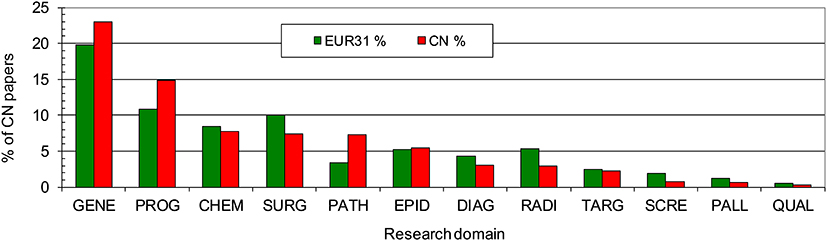 |
Figure 8 Percentage of EUR31 (2002–13) and Chinese (2009–18) cancer research papers in different domains. Abbreviations: GENE, genetics; PROG, prognosis; CHEM, chemotherapy; SURG, surgery; PATH, pathology; EPID, epidemiology; DIAG, diagnosis; RADI, radiotherapy; TARG, targeted therapy; SCRE, screening; PALL, palliative care; QUAL, quality of life. |
Despite its rapid growth, international collaboration as a proportion of China’s cancer research output actually declined with time, from 13% in 2009 to 8.5% in 2018, although the actual numbers of such papers more than tripled. More than 63% of the contributions to the internationally collaborative papers were from Canada and the USA. EUR31 countries only contributed 17% of the international total.
Discussion
With greater wealth and improvements in life expectancy, cancer has become the second-largest component of the Chinese disease burden (after cardiovascular disease and stroke). Cancer research has grown very rapidly, probably caused by the increased investment on it, but this also may mean that other disease areas were relatively neglected. For example, in 2015 almost 23% of the Chinese disease burden was from heart disease and stroke, but we estimate that in 2014–18, research in the WoS on these diseases in China represented less than 9% of all biomedical research. The correlation between provincial wealth and cancer research is fair, although the two largest cities (Shanghai and Beijing) have major concentrations of universities and research institutes, while being much less rich than Guangdong (Canton) and Jiangsu.
Lung cancer is the most burdensome manifestation, as it is everywhere, and the lack of serious national efforts to curb smoking is not helping. The low price of many cigarettes in China is also a hindrance. China also suffers greatly from digestive system cancers. This may be because of dietary and eating habits, such as the consumption of food and beverages when they are too hot, and excessive drinking.27,28 However, the correlation between the distributions of cancer research and the relative burden from different sites (see Figure 7) is higher (r2 = 0.52), and much better than in all European countries and north America, perhaps because of central direction of research by the Chinese Communist Party.
At present, based on our analysis of papers on the Web of Science, China attaches more importance to cancer treatment, and to basic research rather than clinical research output. It is relatively weak at the prevention of cancer, as shown by its ambivalent attitude to smoking. However, while the national strategy for cancer is focused mainly on diagnosis and treatment, a greater emphasis on screening and other prevention-related research needs to grow rapidly in the future.
Our study has a major limitation in being limited to papers in an international database, with almost all of them in English (99.6%). This may not be unrepresentative of the research that is considered important in China because of the close connection between WoS publications and academic promotion.29 However, there is a much larger output of cancer research papers in Chinese recorded in the China National Knowledge Infrastructure (CNKI) or in the SinoMed databases (over half a million in each of them). In future, we intend to undertake an analysis of these Chinese papers on cancer research, and compare them with those in the WoS. We also plan to look at the funding sources for Chinese cancer research, and its impact both on other researchers and on healthcare provision in China through analysis of the evidence-base for clinical practice guidelines.
Conclusions
- Compared with other countries, China’s cancer research output is adequate in volume for its disease burden from cancer, and is growing rapidly
- It is also fairly well distributed between the different anatomical sites based on the disease burden from each, and this distribution is much better than in Europe
- The outputs from the different provinces reflect their wealth, except that Beijing and Shanghai are relatively over-producing because the major research centres are located there
- However, there is relatively too much basic research, with insufficient attention to prevention, clinical trials, and end-of-life care
- In particular, there is a serious conflict of interest in the restriction of smoking because of the revenues generated by the Chinese National Tobacco Corporation.
Acknowledgment
The Open Access charge for this paper was provided by the “Information Service for National Key Research and Development Program” (Project number: 2019XM27) from the National Science and Technology Library of China. We are grateful to Philip Roe of Evaluametrics Ltd for the provision of macros that enabled the analysis described here to take place, and to Hamish Sharp, who downloaded the bibliographic data.
Disclosure
Dr Grant Lewison reports personal fees from Institute of Medical Information, Chinese Academy of Medical Sciences, Beijing, China, during the conduct of the study; grants from Economic and Social Research Council, UK, outside the submitted work. The authors report no other conflicts of interest in this work.
References
1. GDP (current US$). The world bank group; 2019. Available from: https://data.worldbank.org.cn/indicator/NY.GDP.MKTP.CD.
2. Liu GG, Chen X. China in transition: health, wealth, and globalisation. Lancet Public Health. 2019:2468–2667. (Electronic).
3. Popkin BM. Synthesis and implications: China’s nutrition transition in the context of changes across other low- and middle-income countries. Obes Rev. 2014;15(Suppl 1):60–67. doi:10.1111/obr.12120
4. Wan K, Shackley S, Doherty RM, Shi ZB, Zhang PQ, Golding N. Science-policy interplay on air pollution governance in China. Environ Sci Policy. 2020;107:150–157. doi:10.1016/j.envsci.2020.03.003
5. Life expectancy at birth, total (years) - China. The world bank group; 2019. Available from: https://data.worldbank.org/indicator/SP.DYN.LE00.IN?locations=CN.
6. Population Pyramids of the World from 1950 to 2100. PopulationPyramid.net; 2018. Available from: https://www.populationpyramid.net/china/2018/.
7. Population Pyramids of the World from 1950 to 2100. PopulationPyramid.net; 2018. Available from: https://www.populationpyramid.net/indonesia/2018.
8. Population Pyramids of the World from 1950 to 2100. PopulationPyramid.net; 2018. Available from: https://www.populationpyramid.net/japan/2018/.
9. The Global Health Data Exchange (GHDx) Database. Institute for health metrics and evaluation; 2019. Available from: https://vizhub.healthdata.org/gbd-compare/.
10. Global Burden Of Disease 2004 Update: disability weights for diseases and conditions. World Health Organization; 2004. Available from: https://www.who.int/healthinfo/global_burden_disease/GBD2004_DisabilityWeights.pdf?ua=1.
11. Wang M, Luo X, Xu S, et al. Trends in smoking prevalence and implication for chronic diseases in China: serial national cross-sectional surveys from 2003 to 2013. Lancet Respir Med. 2019;7(1):35–45. doi:10.1016/S2213-2600(18)30432-6
12. Smoking in China. Wikipedia; 2019. Available from: https://en.wikipedia.org/wiki/Smoking_in_China.
13. National Data. National bureau of statistics of China; 2019. Available from: http://data.stats.gov.cn/.
14. Pierce JP, Shi Y, Hendrickson EM, et al. Tobacco control in California compared with the rest of the USA: trends in adult per capita cigarette consumption. Tob Control. 2018;27(e2):e112–e117. doi:10.1136/tobaccocontrol-2017-053895
15. China Statistical Yearbook 2015. National bureau of statistics of China; 2015. Available from: http://www.stats.gov.cn/tjsj/ndsj/2015/indexch.htm.
16. Zheng RS, Sun KX, Zhang SW, et al. Report of cancer epidemiology in China, 2015. Zhonghua Zhong Liu Za Zhi. 2019;41(1):19–28. doi:10.3760/cma.j.issn.0253-3766.2019.01.005
17. Chen W, Zheng R, Baade PD, et al. Cancer statistics in China, 2015. CA Cancer J Clin. 2016;66(2):115–132. doi:10.3322/caac.21338
18. State council on issuing the outline for the planning of the national medical and health service system; 2015–2020. Available from: http://www.gov.cn/zhengce/content/2015-03/30/content_9560.htm.
19. Notice of the national healthcare security administration on including 17 anti-cancer drugs into the category B of the national basic medical insurance, industrial injury insurance and maternity insurance drug catalogs. National Healthcare Security Administration; 2018. Available from: http://www.nhsa.gov.cn/art/2018/10/10/art_19_397.html.
20. Wang X More anti-cancer efforts to be made in next 3 years: NHC. China Daily. 2019. Available from: http://www.chinadaily.com.cn/a/201903/08/WS5c825170a3106c65c34ed9bc.html.
21. Chinese Anti-Cancer Association. Report on the development of oncology in China (2018). 2019.
22. Lewison G. Definition of cancer research: journals, titles, abstracts or keywords? DESIDOC J Lib Inf Technol. 2011;31(5):333–339. doi:10.14429/djlit.31.5.1189
23. Begum M, Lewison G, Lawler M, Sullivan R. Mapping the European cancer research landscape: an evidence base for national and Pan-European research and funding. Eur J Cancer. 2018;100:75–84. doi:10.1016/j.ejca.2018.04.017
24. Lewison G, Paraje G. The classification of biomedical journals by research level. Scientometrics. 2004;60(2):145–157. doi:10.1023/B:SCIE.0000027677.79173.b8
25. Basu A, Foland P, Holdridge G, Shelton RD. China’s rising leadership in science and technology: quantitative and qualitative indicators. Scientometrics. 2018;117(1):249–269. doi:10.1007/s11192-018-2877-5
26. Hong W, Li C, Zhang LP, et al. Achievements in cancer research supported by National Natural Science Foundation of China. Chinese Sci Bull. 2013;58(1):39–43. doi:10.1007/s11434-012-5633-x
27. Lin J, Zeng R, Cao W, Luo R, Chen J, Lin Y. Hot beverage and food intake and esophageal cancer in southern China. Asian Pac J Cancer Prev. 2011;12(9):2189–2192.
28. Liu X, Wang X, Lin S, et al. Dietary patterns and the risk of esophageal squamous cell carcinoma: a population-based case-control study in a rural population. Clin Nutr. 2017;36(1):260–266. doi:10.1016/j.clnu.2015.11.009
29. Shu F, Quan W, Chen B, Qiu J, Sugimoto CR, Lariviere V. The role of web of science publications in China’s tenure system. Scientometrics. 2020;122(3):1683–1695. doi:10.1007/s11192-019-03339-x
 © 2020 The Author(s). This work is published and licensed by Dove Medical Press Limited. The full terms of this license are available at https://www.dovepress.com/terms.php and incorporate the Creative Commons Attribution - Non Commercial (unported, v3.0) License.
By accessing the work you hereby accept the Terms. Non-commercial uses of the work are permitted without any further permission from Dove Medical Press Limited, provided the work is properly attributed. For permission for commercial use of this work, please see paragraphs 4.2 and 5 of our Terms.
© 2020 The Author(s). This work is published and licensed by Dove Medical Press Limited. The full terms of this license are available at https://www.dovepress.com/terms.php and incorporate the Creative Commons Attribution - Non Commercial (unported, v3.0) License.
By accessing the work you hereby accept the Terms. Non-commercial uses of the work are permitted without any further permission from Dove Medical Press Limited, provided the work is properly attributed. For permission for commercial use of this work, please see paragraphs 4.2 and 5 of our Terms.