")
Back to Journals » Diabetes, Metabolic Syndrome and Obesity » Volume 14
Children’s Lipid Accumulation Product Combining Visceral Adiposity Index is a Novel Indicator for Predicting Unhealthy Metabolic Phenotype Among Chinese Children and Adolescents
Authors Dong Y , Bai L, Cai R , Zhou J , Ding W
Received 6 September 2021
Accepted for publication 29 October 2021
Published 23 November 2021 Volume 2021:14 Pages 4579—4587
DOI https://doi.org/10.2147/DMSO.S337412
Checked for plagiarism Yes
Review by Single anonymous peer review
Peer reviewer comments 2
Editor who approved publication: Professor Ming-Hui Zou
Yangyang Dong,1,2 Ling Bai,1,2 Rongrong Cai,1,2 Jinyu Zhou,1,2 Wenqing Ding1,2
1School of Public Health and Management, Ningxia Medical University, Yinchuan, Ningxia, People’s Republic of China; 2Key Laboratory of Environmental Factors and Chronic Disease Control, Ningxia Medical University, Yinchuan, Ningxia, People’s Republic of China
Correspondence: Wenqing Ding
School of Public Health and Management, Ningxia Medical University, No. 1160, Shengli Street, Xingqing District, Yinchuan, Ningxia, 750004, People’s Republic of China
Tel +86 13519598269
Email [email protected]
Purpose: The predictive capacity between children’s lipid accumulation product (CLAP) combining visceral adiposity index (VAI), CLAP, and VAI with metabolically unhealthy phenotype remained unclear. This study aimed to compare the ability of CLAP combining VAI, CLAP, VAI and traditional adiposity indicators (body mass index (BMI), waist circumference (WC), waist-to-height ratio (WHtR) and waist-to-hip ratio (WHR)) to predict metabolically unhealthy phenotype among Chinese children and adolescents.
Patients and Methods: In the cross-sectional study, 1714 children and adolescents aged 12 to 18 were selected by random cluster sampling, underwent a questionnaire survey, physical examination, biochemical tests and body composition was measured by bioelectrical impedance analysis (BIA). Participants were divided into four phenotypes according to BMI and metabolic syndrome components. The logarithmic CLAP (LnCLAP), VAI, BMI, WC, WHtR and WHR were standardized for sex and age using the z-score method (standardized variables: LnCLAP-z, VAI-z, BMI-z, WC-z, WHtR-z and WHR-z).
Results: LnCLAP-z ≥ 1, VAI-z ≥ 1, WC-z ≥ 1, and WHR-z ≥ 1 increased the risk of metabolically unhealthy normal-weight phenotype (the OR and 95% CI were 4.18 (1.75– 10.02), 24.05 (12.79– 45.21), 6.17 (1.14– 33.51), 2.69 (1.07– 6.72), respectively), LnCLAP-z ≥ 1, VAI-z ≥ 1 and WC-z ≥ 1 increased the risk of metabolically unhealthy overweight or obese phenotype (the OR and 95% CI were 2.67 (1.40– 5.09), 10.30 (3.03– 35.03), 2.19 (1.18– 4.09), respectively). The area under the ROC curve (AUC) for CLAP combining VAI in the prediction of the metabolically unhealthy phenotype were 0.837 (0.776– 0.899) and 0.876 (0.834– 0.918) for boys and girls with normal-weight, 0.853 (0.803– 0.903) and 0.794 (0.711– 0.878) for boys and girls with overweight and obese (all P < 0.001), which were higher than CLAP, VAI, BMI, WC, WHtR and WHR.
Conclusion: Among Chinese children and adolescents, CLAP combining VAI was a more effective indicator than CLAP, VAI and traditional adiposity indicators in predicting unhealthy metabolic phenotype.
Keywords: children’s lipid accumulation product, visceral adiposity index, unhealthy metabolic phenotype, traditional adiposity indicators, children and adolescents
Introduction
Pediatric obesity has become a serious global public health problem. With the increase in pediatric obesity rate, metabolic syndrome (MetS) was more common in children and adolescents, especially in China.1,2 Metabolically unhealthy obesity was used to define obese individuals with MetS. However, some obese individuals with good metabolic characteristics, which were defined as metabolically healthy obesity,3 individuals with normal-weight may develop metabolic disorders, which were defined as metabolically unhealthy normal-weight (MUNW).4 Due to the different criteria used to define the metabolic phenotype, the prevalence of MUNW and metabolically unhealthy obesity ranged from 10.6% to 18.8%5–7 and 1.3% to 14.3%, respectively,5,6,8,9 among children and adolescents. Studies reported that unhealthy metabolic phenotype were associated with increased risk of cardiovascular risk factors.10,11 Therefore, early identification of unhealthy metabolic phenotype in children and adolescents was significant for disease prevention.
At present, the underlying mechanism for the existence of different metabolic phenotypes remains unclear, and increase in visceral adipose tissue (VAT) is the main mechanism.12 Lipid accumulation product (LAP) and visceral adiposity index (VAI) are novel indicators to measure visceral obesity.13 LAP, combined waist circumference (WC) and fasting triglycerides (TG) concentration,14 was associated with MetS in adults.15 Nevertheless, LAP may not directly reflect lipid accumulation among children and adolescents. The children’s lipid accumulation product (CLAP), a novel indicator, was proposed by Zhang et al,16 which combined WC, abdominal skinfold thickness (AST), and serum triglyceride (TG) concentration, and was related to MetS among Chinese children and adolescents. VAI was a product of body mass index (BMI), WC, TG and high-density lipoprotein cholesterol (HDL-C).17 In adults, both LAP and VAI performed better in detecting MUNW phenotype than traditional adiposity indicators, including BMI, WC, waist-to-height ratio (WHtR) and waist-to-hip ratio (WHR).18,19 The combination of LAP and arterial blood pressure measurement might be a useful method for predicting the metabolically healthy obese phenotype in postmenopausal women.20 However, few studies investigated the predictive ability of CLAP, VAI and the combination of CLAP and VAI in identifying unhealthy metabolic phenotype among children and adolescents. Therefore, the study aimed to explore and compare the ability of CLAP combining VAI, CLAP, VAI and traditional adiposity indicators to predict metabolically unhealthy phenotype among children and adolescents, using data from China.
Methods
Study Population
Chen et al found that the prevalence of MUNW and MUO were 10.6% and 8.9%, respectively, in Chinese children aged 6–17 years.5 The sample size was determined according to the cross-sectional design, and the calculation formula was  , (α=0.05, δ=0.03, and p is the prevalence of MUNW). The sample size should be 404 (404 = 1.962 × 0.106 × 0.894/0.03/0.03), according to the formula of sample size. Considering the sampling error, the sample size needed to be increased by 5%, so the minimum sample size was 424 (424 = 404×(1+5%)). In the cross-sectional study, children and adolescents aged 12–18 were randomly selected from 13 classes of 3 Junior Middle Schools and 10 classes of 2 Senior High Schools in Yinchuan city, China, via the cluster random sampling method, from 2017 to 2020. First determined the school, then made a stratification according to the grade level, and finally selected the classes randomly in the cluster. Individuals who were able to engage in various physical exercise activities were included, those with physical disabilities, deformities, congenital genetic diseases, metabolic-related diseases, and missing information were excluded, and a total of 1714 subjects were enrolled in this study. All subjects participated in the questionnaire, physical examination and laboratory examination. Informed consent was signed by all participants and their parents/guardians. This study was approved by the Ethics Committee of Ningxia Medical University (2021-G053) and conducted in accordance with the Declaration of Helsinki.
Questionnaire Investigation
The contents of the questionnaire mainly included the general demographic characteristics of the subjects, such as name, sex, age and birthdate, and so on.
Anthropometrical Data
All anthropometric variables were measured by standardized trained staff after children, and adolescents had removed their shoes and heavy clothing. Height was measured within 0.1 cm using an altimeter (ZH7082), weight was measured within 0.1 kg using a lever scale (RGT-140). WC and hip circumference (HC) were measured within 0.1 cm by nylon tape, WC was measured at the midway between the inferior margin of the last rib and iliac crest at the end of normal exhalation, and HC was measured at the maximal gluteal protuberance. They were measured twice, the error of two measurements was no more than 0.5 cm or 0.5 kg. The average value of the anthropometric variables was used for analysis. The AST was detected by InBody370 bioelectrical impedance analysis (BIA) produced by Biospace Company of Korea, which used 8-point contact electrode. According to the method recommended by the American Hypertension Education Project working Group, systolic blood pressure (SBP) and diastolic blood pressure (DBP) were measured for 3 consecutive times with an Omron HEM-7012 electronic sphygmomanometer, at least 1 min between each time, and the difference between two adjacent measurements was no more than 10 mmHg.21 The mean value of the last two measurements was used for analysis.
Biochemical Measurements
After 12 hours of overnight fasting, venous blood samples were obtained by direct venipuncture. Fasting plasma glucose (FPG), total cholesterol (TC), TG, low-density lipoprotein cholesterol (LDL-C) and high-density lipoprotein cholesterol (HDL-C) levels were assayed using the American AU480 automatic biochemical analyzer. FPG, TC and TG levels were determined by enzymatic methods. LDL-C and HDL-C were detected by direct method-catalase method.
Calculation of Derivative Indicators
BMI=weight (kg)/height2(m2), WHtR=WC (cm)/height (cm), WHR=WC (cm)/HC (cm). CLAP = WC (cm) × AST (mm) × TG (mmol/L)/100.16 Using the following formula, we calculate VAI with TG and HDL-C levels expressed as mmol/l.17


Definitions
Overweight and obese were defined by BMI, according to the study of body index boundary points of overweight and obesity screening in Chinese children and adolescents.22 We used the presence of MetS components to define metabolic abnormalities, based on the revised National Cholesterol Education Program Adult Treatment Panel III (ATP III) modified for the pediatric population,23 as follows: (1) WC ≥ 90th percentile for age and sex;24 (2) TG levels ≥1.24 mmol/L; (3) HDL-C ≤1.03 mmol/L; (4) SBP and/or DBP ≥ 90th percentile for age, sex and height;25 (5) FPG levels ≥6.1 mmol/L. Therefore, the participants were divided into four metabolically phenotypes,6 as following: (1) metabolically healthy normal-weight (MHNW): normal-weight and ≤1 abnormalities; (2) metabolically unhealthy normal-weight (MUNW): normal-weight and ≥2 abnormalities; (3) metabolically healthy overweight or obesity (MHO): overweight or obese and ≤1 abnormalities; (4) metabolically unhealthy overweight or obesity (MUO): overweight or obese and ≥2 abnormalities.
Statistical Analysis
Epidata 3.1 software and SPSS26.0 were used for data entry and data analysis, respectively. Continuous and categorical variables were described as mean ± standard deviation (SD) or median (25th-75th percentiles), and percentage, respectively. Two-sample t-test or the Wilcoxon rank sum test, and chi-square test were used to compare the differences of the factors above between boys and girls. The logarithmic CLAP (LnCLAP), VAI, BMI, WC, WHtR and WHR were transferred into z scores by sex and age (standardized variables: LnCLAP-z, VAI-z, BMI-z, WC-z, WHtR-z and WHR-z). Z-score = (test value−mean value by age and gender) /SD by age and sex. Multivariate logistic regression was used to explore the relationship between CLAP, VAI, traditional adiposity indicators and unhealthy metabolic phenotype. Receiver operating characteristic (ROC) curve was used to compare the effects of CLAP combining VAI for predicting unhealthy metabolic phenotype. Two-sided P < 0.05 was considered to be statistically significant.
Results
Table 1 presents the characteristics of the participants by gender. Compared to girls, boys were older, had higher height, weight, HC, WHtR, FPG and SBP, and lower WHtR, WHR, AST, VAI, TC, TG, HDL-C and DBP (all P < 0.05). The overall prevalence of MUNW, MHO and MUO were 9.4%, 7.5% and 16.7%, respectively. Boys showed a lower prevalence of MUNW than girls (6.7% vs 13.8%, P < 0.001), no difference was found in the prevalence of MUO between the two groups.
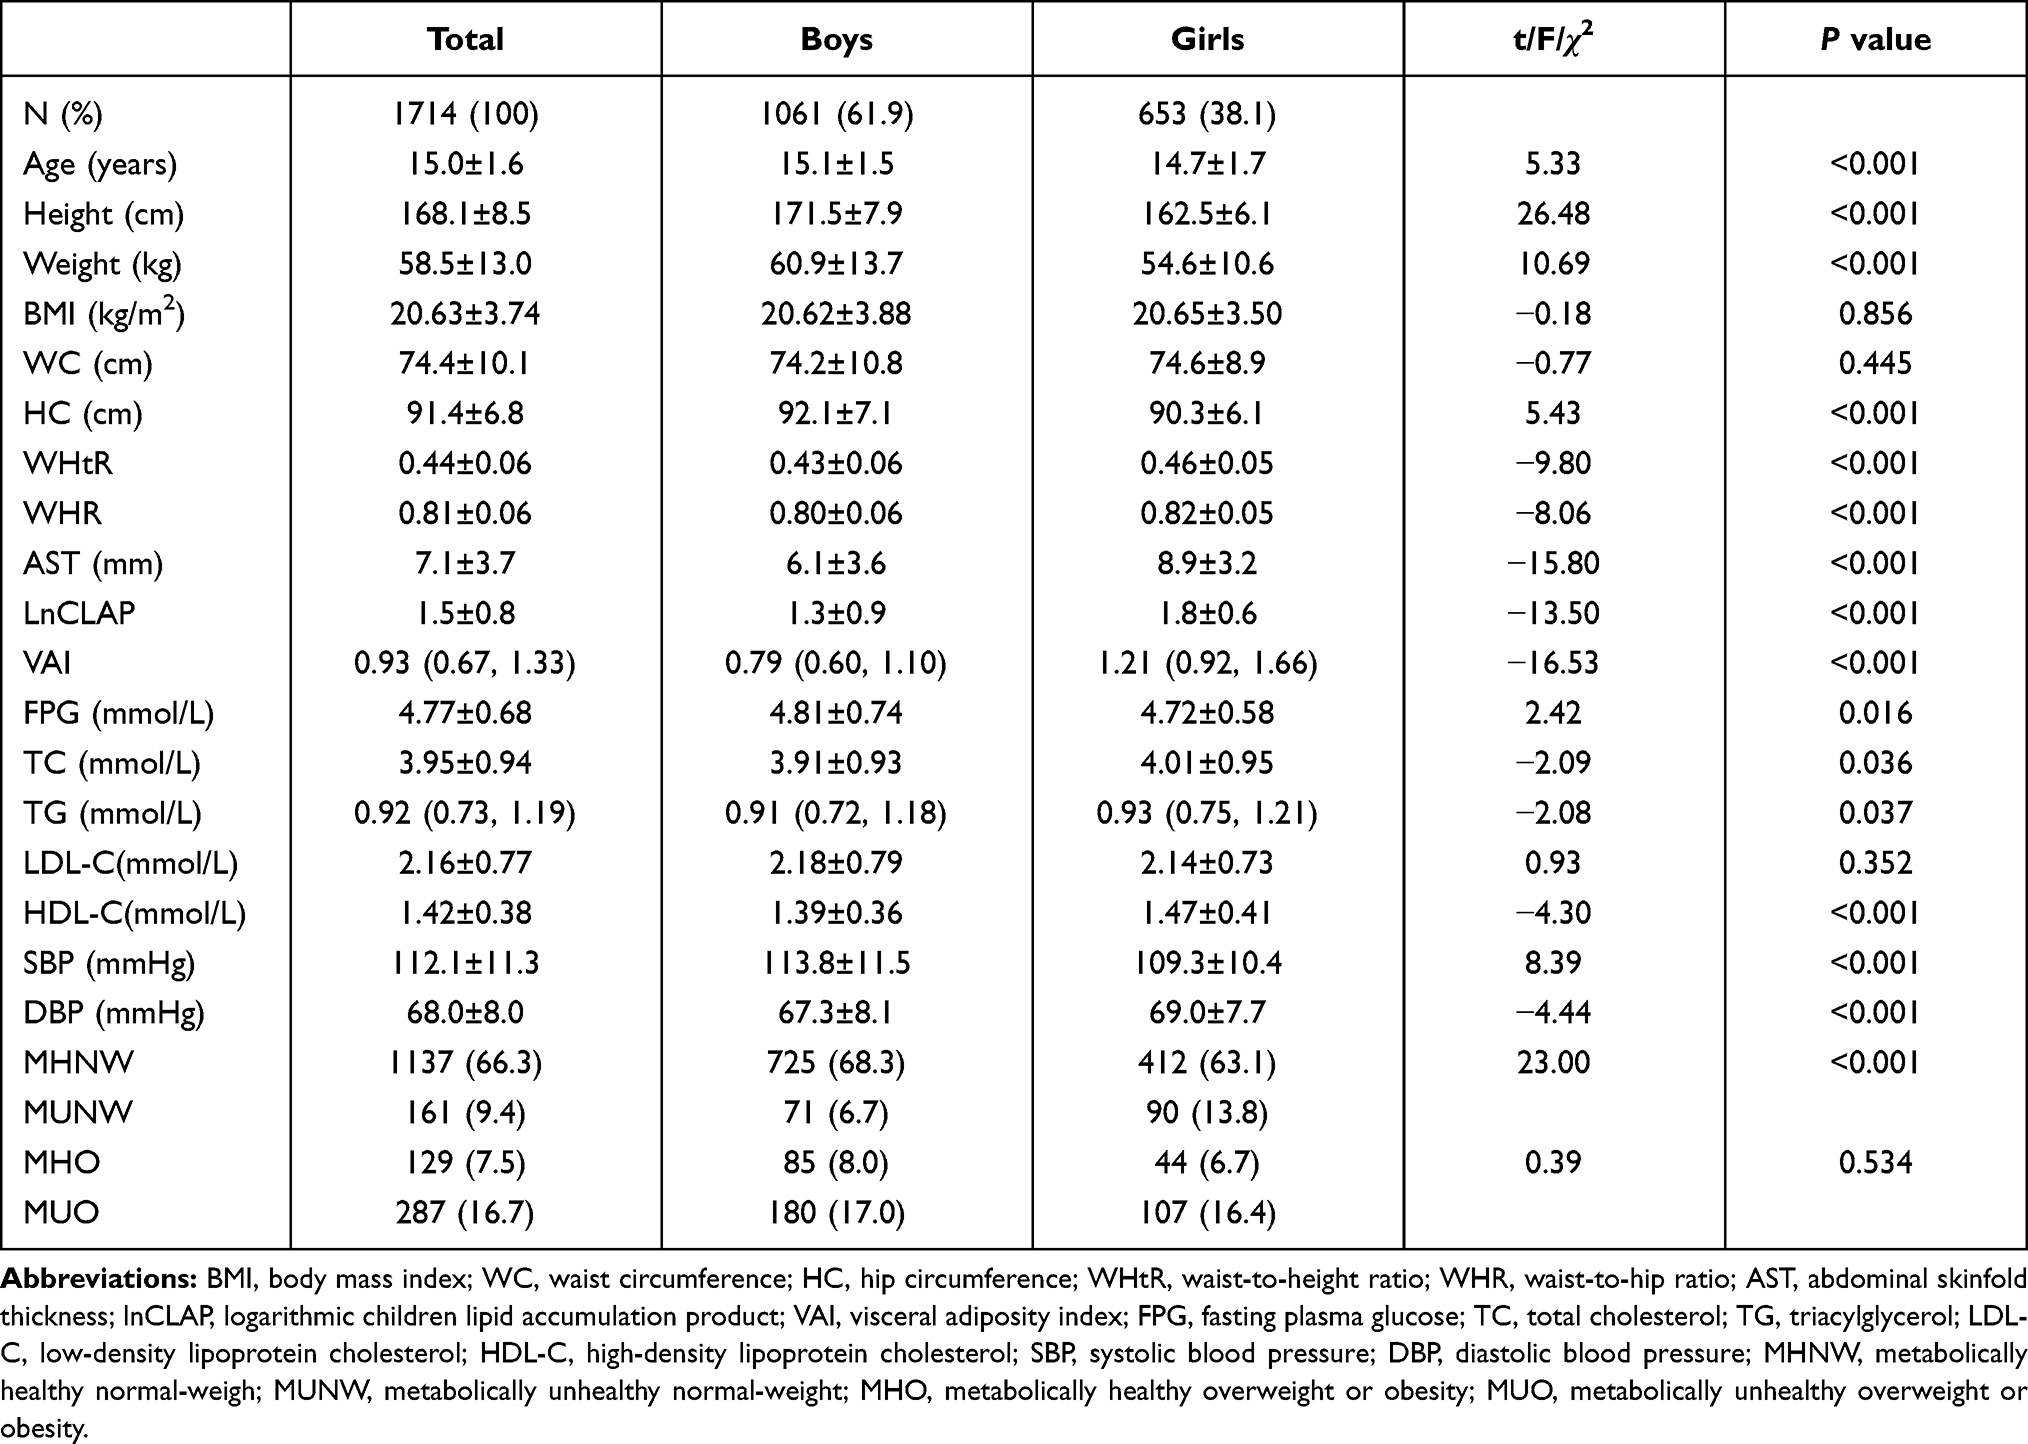 |
Table 1 Characteristics of the Study Population by Gender |
Table 2 provides the associations between CLAP, VAI and anthropometric indices and unhealthy metabolic phenotype. LnCLAP-z ≥ 1, VAI-z ≥ 1, WC-z ≥ 1, and WHR-z ≥ 1 showed higher risk of MUNW phenotype, the OR and 95% CI were 4.18 (1.75–10.02), 24.05 (12.79–45.21), 6.17 (1.14–33.51) and 2.69 (1.07–6.72), respectively (all P < 0.05). After gender stratification, the results showed that VAI-z ≥ 1 and WC-z ≥ 1 were the risk factors for boys, and LnCLAP-z ≥ 1 and VAI-z ≥ 1 were the risk factors for girls. LnCLAP-z ≥ 1, VAI-z ≥ 1 and WC-z ≥ 1 increased the risk of MUO phenotype, the OR and 95% CI were 2.67 (1.40–5.09), 10.30 (3.03–35.03) and 2.19 (1.18–4.09), respectively (all P < 0.05). After gender stratification, the results showed that LnCLAP-z ≥ 1, VAI-z ≥ 1 and BMI-z were the risk factors for boys, and VAI-z ≥ 1 was the risk factors for girls.
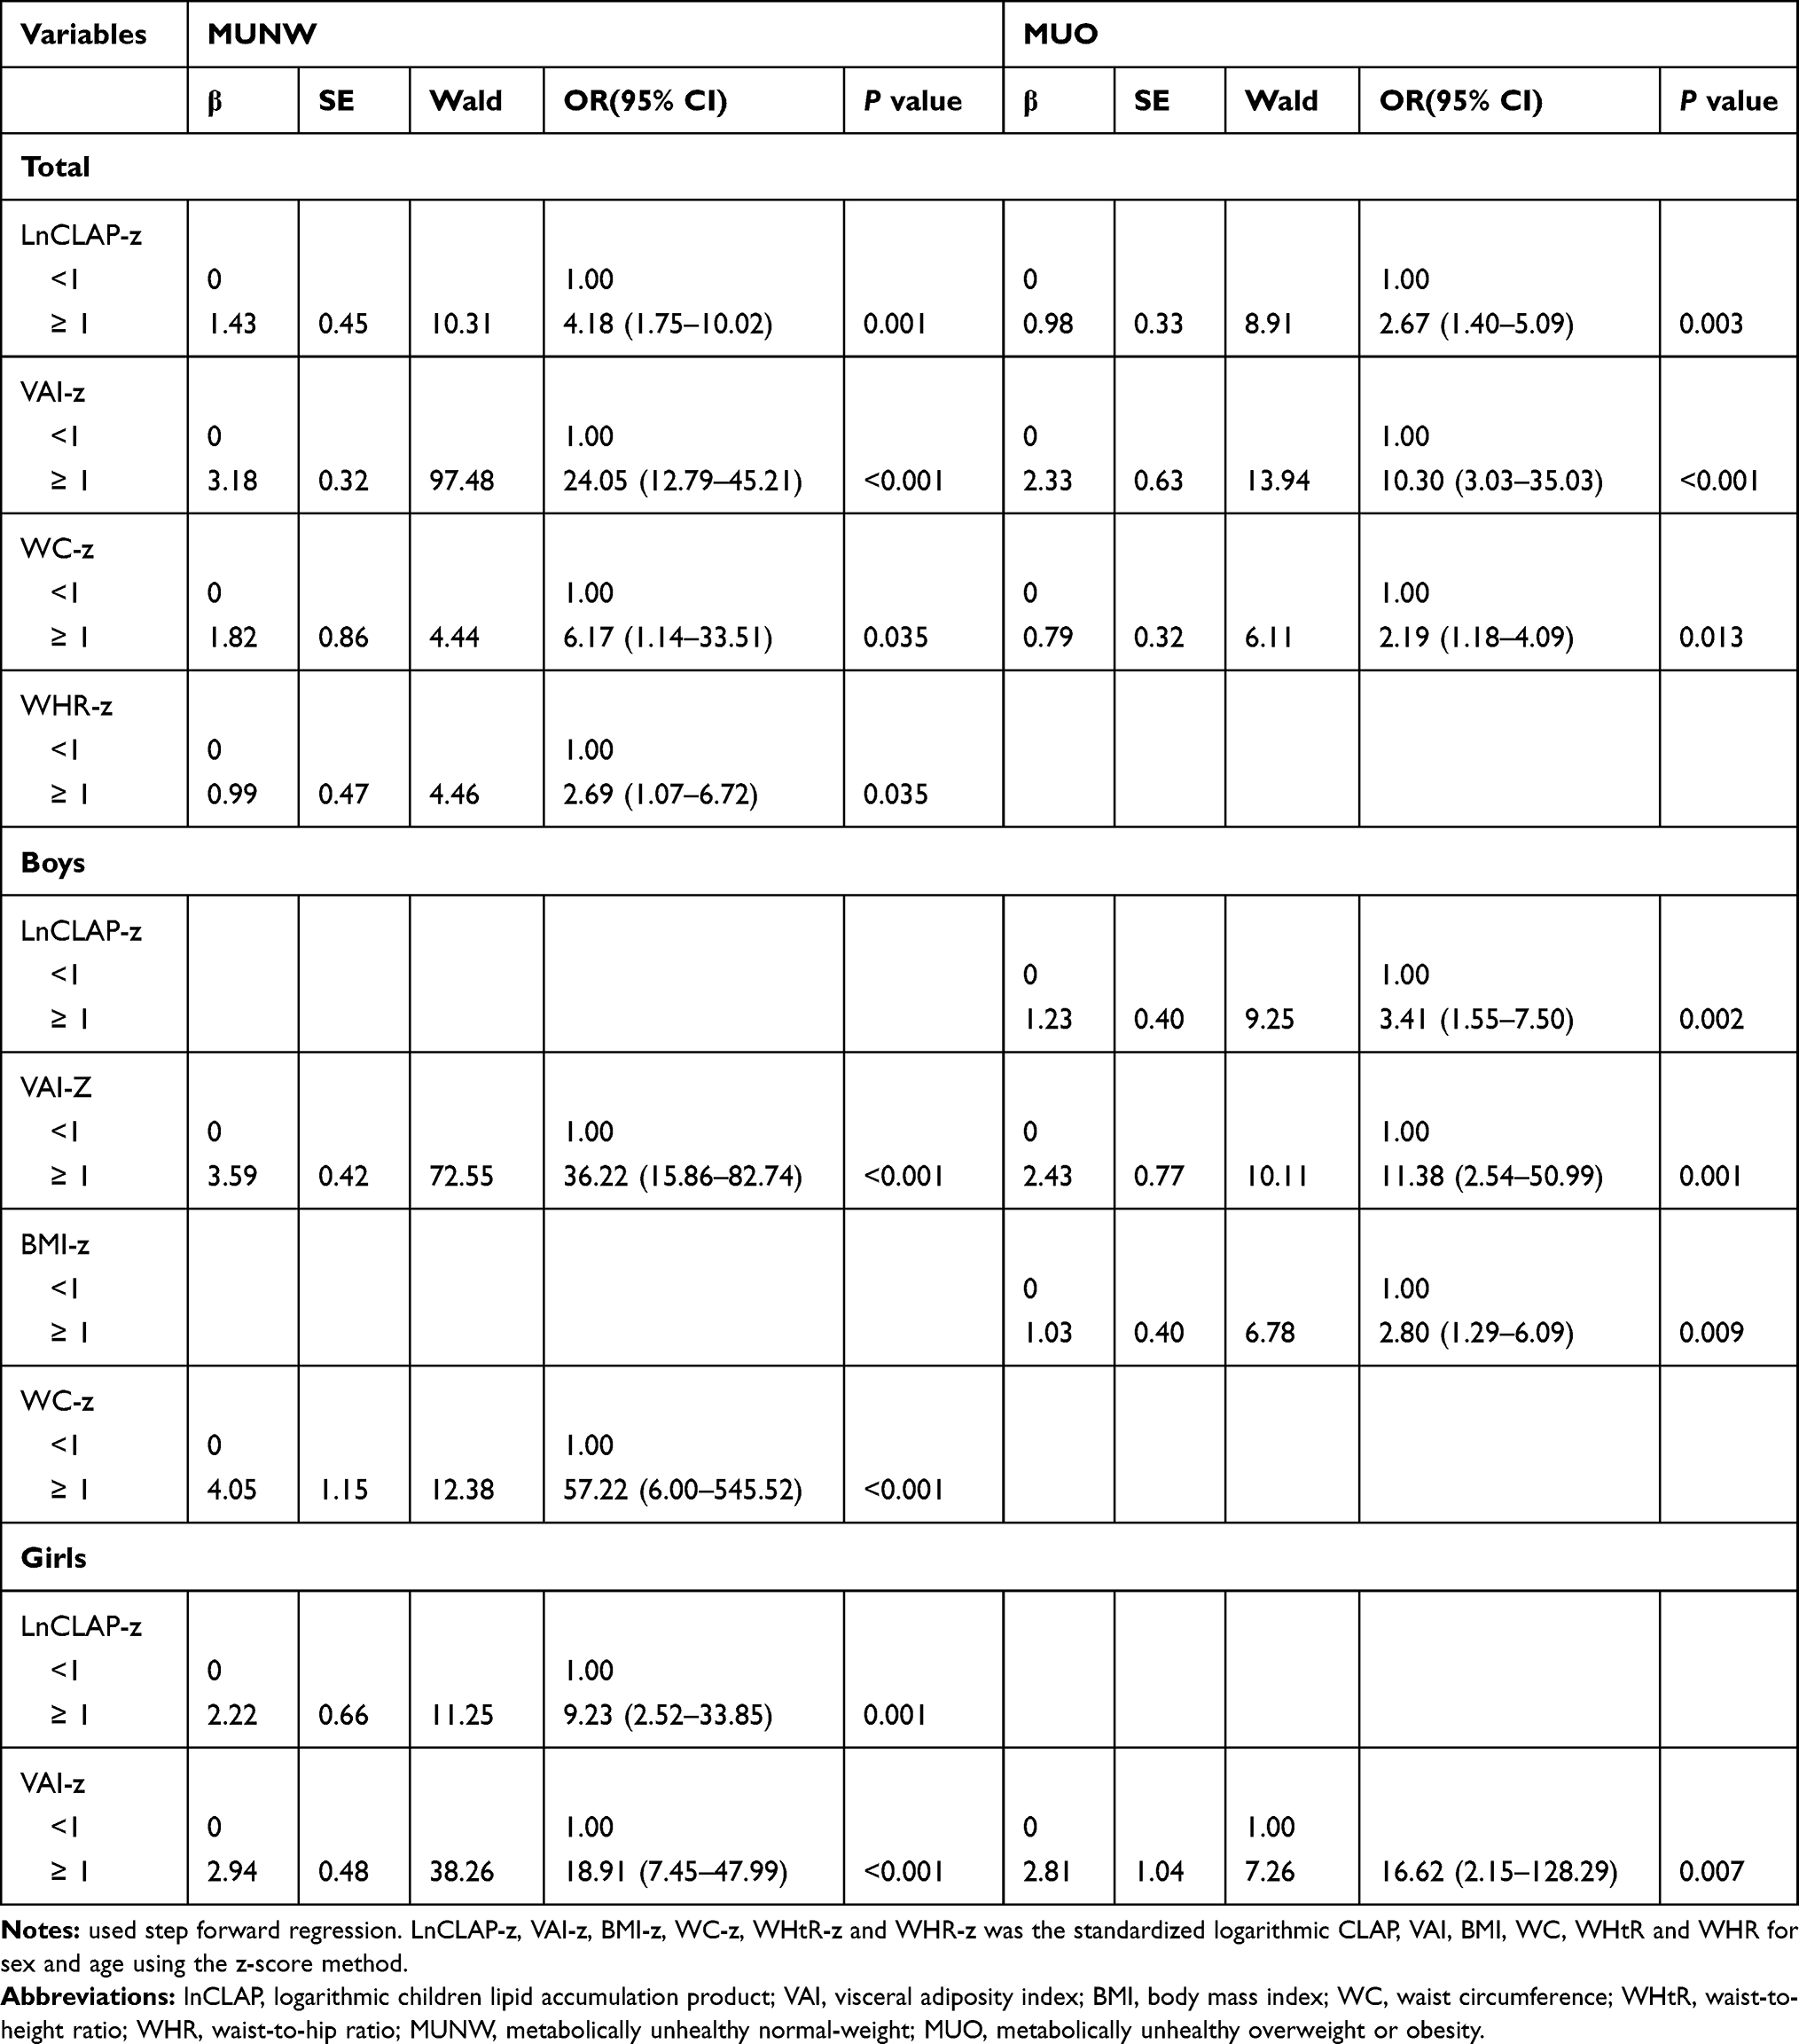 |
Table 2 The Associations Between CLAP, VAI, Traditional Adiposity Indicators and Unhealthy Metabolic Phenotype Using Logistic Regressions Among Children and Adolescents |
Table 3 reports the result of ROC curve analysis. CLAP combining VAI performed better than other indicators in detecting metabolically unhealthy phenotype in both genders. The AUC was 0.837 (0.776–0.899) for boys in predicting MUNW phenotype, followed by VAI (0.822, 0.759–0.885) and CLAP (0.780, 0.713–0.846), and the AUC was 0.876 (0.834–0.918) for girls, followed by CLAP (0.869, 0.826-0.912) and VAI (0.832, 0.782–0.882) (all P < 0.001). Among overweight and obese boys and girls, the AUC of the combination of CLAP and VAI in predicting MUO phenotype were 0.853 (0.803–0.903) and 0.794 (0.711–0.878), respectively, followed by VAI (0.837, 0.789–0.884; 0.779, 0.705–0.852) and CLAP (0.823, 0.762–0.883; 0.748, 0.659–0.838) (all P < 0.001). All the traditional obesity indexes could identify MUNW and MUO phenotype, the AUC ranged from 0.675 to 0.711 and 0.706 to 0.731, respectively (all P < 0.001).
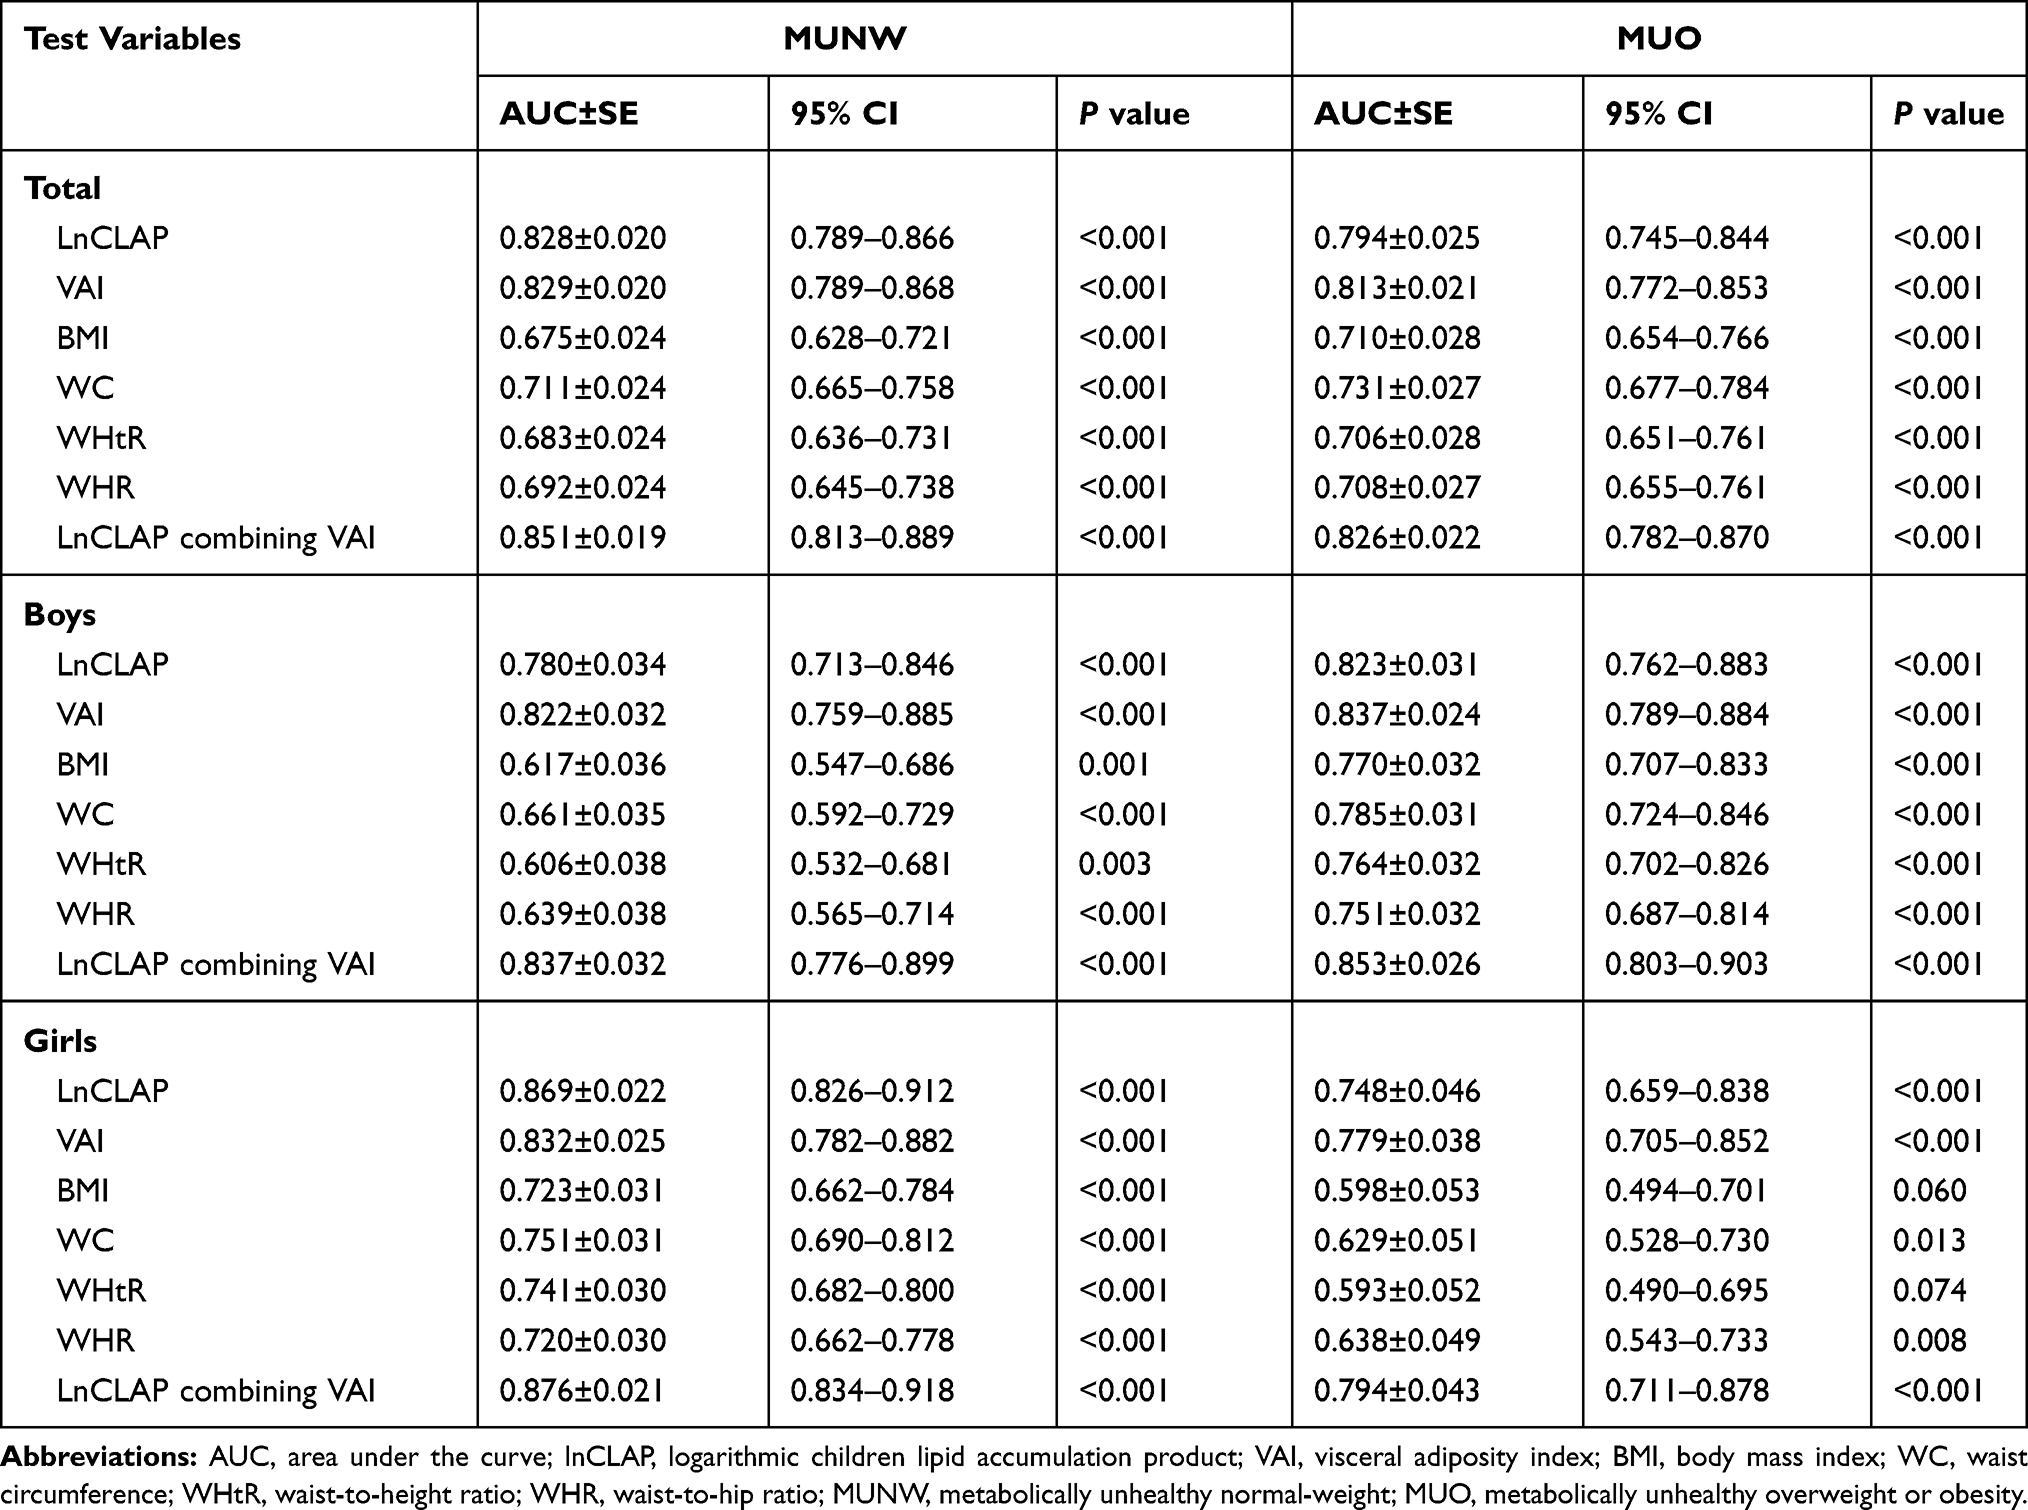 |
Table 3 ROC Curve Analysis of the CLAP, VAI and Traditional Adiposity Indicators for Predicting Unhealthy Metabolic Phenotype Among Children and Adolescents |
Discussion
Our study indicated that compared with traditional obesity indicators, CLAP and VAI showed greater power in predicting unhealthy metabolic phenotype among Chinese children and adolescents. However, the combination of CLAP and VAI performed better than the two indicators independently in identifying metabolically unhealthy phenotype.
The prevalence of metabolic phenotypes varied depending on population sources, age ranges, and the definition and classification. Research for Chinese children and adolescents aged 6–18 years indicated that the prevalence of metabolically unhealthy non-obesity and metabolically unhealthy obesity were 11.4% and 6.5%, respectively.6 Another cross-sectional study from China showed that the prevalence of MUNW and MHO in the whole population were 10.6% and 15.3%, and boys had a higher prevalence than girls (MUNW, 11.7% VS 9.5%, MHO, 17.8% VS 12.6%).5 The prevalence of unhealthy metabolic phenotypes in our results was different from the above studies, and we found that girls had a higher prevalence of MUNW than boys (13.8% VS 6.7%). It could be explained by the different criteria for metabolic phenotypes and age ranges, and overweight children and adolescents were classified as MUO phenotype in our study.
In our study, CLAP and VAI were risk factors for the unhealthy metabolic phenotypes. Cross-sectional studies for Chinese children and adolescents aged 8–15 indicated that with adjustment of age, sex, moderate-to-vigorous physical activity time, risk dietary behaviors and sedentary activity time, CLAP ≥ P75 increased the risk of MetS, the adjusted OR and 95% CI was 150.75 (20.11–1130.19),16 and LnCLAP-z ≥1 had a higher risk of hypertension, the adjusted OR and 95% CI was 3.70 (2.22–6.16).26 A study from Riyadh city, Saudi Arabia, showed that VAI was positively associated with insulin resistance among 4–17-year-old children and adolescents.27 These findings supported our results.
Some research investigated the predictive capacity of LAP, VAI and traditional obesity indicators in detecting metabolically unhealthy phenotype among adults. Results revealed that compared with BMI, WC, WHtR, WHR and neck circumference, VAI showed a stronger association and better predictive capacity, and the AUC for MUNW and MUO were 0.865 and 0.830 for men, 0.847 and 0.903 for women.19 Data from China Health and Nutrition Survey (CHNS) reported that both LAP and VAI were strongly associated with MUNW phenotypes, and the predictive power of LAP and VAI was superior to that of traditional obesity indicators, even when different criteria were used to define MUNW. Moreover, the AUC of LAP and VAI ranged from 0.606 to 0.807 and 0.611 to 0.835, respectively.18 Studies for Chinese children and adolescents showed that compared with traditional obesity indicators, CLAP was an effective index in predicting MetS, hypertension and impaired fasting glucose, with AUC and 95% CI of 0.944 (0.913–0.975), 0.668 (0.601–0.735) and 0.637 (0.562–0.712), respectively.16,26,28 What is more, similar findings were found in adults, where LAP and VAI performed better in predicting MetS than traditional obesity indicators.15,29 These findings were consistent with ours and supported our findings. CLAP and VAI were more effective at predicting unhealthy metabolic phenotype than traditional obesity indicators, probably because CLAP and VAI could reflect visceral fat accumulation to some extent, while traditional obesity indicators provided some information about fat distribution, but cannot distinguish visceral fat and subcutaneous fat.30
Nevertheless, a population-based prospective cohort of adults demonstrated that LAP was an independent predictor of MUNW phenotype, but had no significant superiority over BMI, WC, WHR and WHtR.31 According to the International Diabetes Federation (IDF) criteria, WHtR was a preferred index in predicting MetS than LAP, BMI, WHR and body Adiposity Index (BAI) among the Kazakh Adult Population in Xinjiang.32 Liu et al33 found that WC was the most effective index over LAP, BMI and WHtR for identifying MetS in rural Chinese adults. Wang et al34 found that compared with LAP, VAI, WC and BAI, BMI was the index that was strongly related to the risk of hypertension in Chinese adults. These results were not consistent with ours, which may be due to differences in the basic characteristics of the population, age range, inconsistent definitions and the different associations between these indicators and MetS components.
Furthermore, we found that the combination of CLAP and VAI showed stronger predictive ability in identifying unhealthy metabolic phenotype than CLAP, VAI and traditional obesity indicators. To a certain extent, CLAP reflected the accumulation of body lipid, VAI showed the accumulation of visceral fat. The excess lipid fuel is eventually manifested as abdominal enlargement or as elevated circulating TG.14 The effect of CLAP combining VAI for detecting unhealthy metabolic phenotype was higher than that of CLAP and VAI, which may be that the combination of CLAP and VAI reflected the superposition effect of TG and WC. Currently, the underlying mechanisms for CLAP, VAI and unhealthy metabolic phenotype were unclear, the possible mechanisms were as follows. First, the accumulation of ectopic lipids led to insulin resistance (IR) in muscle tissue, which increased liver adipogenesis, and led to liver IR and hyperlipidemia.35–37 Second, adipose tissue inflammation was involved in the link between obesity and metabolic diseases, macrophages infiltrated the white adipose tissue and increased lipolysis, which stimulated hepatic triglyceride synthesis, thereby promoting hyperlipidemia.38 Third, compared to abdominal adipose tissue, visceral adipose tissue (VAT) secreted more pro-inflammatory cytokines, such as higher levels of TNF-α, which may be involved in the pathogenesis of hypertension.39
Our study provided a reference for understanding the ability of different indicators to predict unhealthy metabolic phenotype. However, there were some limitations in the study should be noted. First, this cross-sectional study limited the causal interpretation of the observed associations. Second, our results may vary depending on the diagnostic criteria of metabolic phenotype. Third, due to the age and race limitations of participants, the results could not be generalized to other populations. Fourth, some confounding factors were not assessed in this study, such as lifestyle and physical activity, which might have influenced our results. Fifth, the application of VAI formula derived from adults to a population under the age of 19 may have an impact on the results. The specific formula for calculating VAI for children and adolescents needed to explore in a larger sample size for future research.
Conclusions
In conclusion, compared with CLAP, VAI and traditional obesity indicators, CLAP combining VAI was the better index for the screening of unhealthy metabolic phenotype in both genders. We suggest that the combination of CLAP and VAI could be considered as an effective index in predicting metabolically unhealthy phenotype among Chinese children and adolescents.
Acknowledgments
This work was supported by Ningxia Medical University scientific research project and the National Natural Science Foundation of China (Grant number 82160641).
Disclosure
The authors declare that they have no conflicts of interest.
References
1. Ng M, Fleming T, Robinson M, et al. Global, regional, and national prevalence of overweight and obesity in children and adults during 1980–2013: a systematic analysis for the Global Burden of Disease Study 2013. Lancet. 2014;384(9945):766–781. doi:10.1016/S0140-6736(14)60460-8
2. Ye PY, Yan YK, Ding WQ, et al. Prevalence of metabolic syndrome in Chinese children and adolescents: a meta-analysis. Chin J Epidemiol. 2015;36(8):876–880. doi:10.3760/cma.j.issn.0254-6450.2015.08.000
3. Blüher M. Mechanisms in endocrinology: are metabolically healthy obese individuals really healthy? Eur J Endocrinol. 2014;171(6):R209–R219. doi:10.1530/EJE-14-0540
4. Choi KM, Cho HJ, Choi HY, et al. Higher mortality in metabolically obese normal-weight people than in metabolically healthy obese subjects in elderly Koreans. Clin Endocrinol (Oxf). 2013;79(3):364–370. doi:10.1111/cen.12154
5. Chen F, Liu J, Yan Y, et al. Abnormal metabolic phenotypes among urban Chinese children: epidemiology and the impact of DXA-measured body composition. Obesity. 2019;27(5):837–844. doi:10.1002/oby.22426
6. Ding WQ, Liu JT, Shang YX, et al. DXA-measured visceral fat mass and lean body mass reflect abnormal metabolic phenotypes among some obese and nonobese Chinese children and adolescents. Nutr Metab Cardiovasc Dis. 2018;28(6):618–628. doi:10.1016/j.numecd.2018.03.002
7. Li YP, Yang XG, Zhai FY, et al. Disease risks of childhood obesity in China. Biomed Environ Sci. 2005;18(6):401–410. doi:10.1111/j.1467-842X.2005.tb00258.x
8. Esmaili H, Heshmat R, Ejtahed HS, et al. Association of serum 25-hydroxyvitamin D level with metabolic phenotypes of obesity in children and adolescents: the CASPIAN-V study. Front Endocrinol (Lausanne). 2020;11:1–8. doi:10.3389/fendo.2020.00310
9. Asghari G, Hosseinpanah F, Serahati S, Haghi S, Azizi F. Association between obesity phenotypes in adolescents and adult metabolic syndrome: Tehran Lipid and Glucose Study. Br J Nutr. 2019;122(11):1255–1261. doi:10.1017/S0007114519002344
10. Mirzababaei A, Mozaffari H, Shab-Bidar S, Milajerdi A, Djafarian K. Risk of hypertension among different metabolic phenotypes: a systematic review and meta-analysis of prospective cohort studies. J Hum Hypertens. 2019;33(5):365–377. doi:10.1038/s41371-018-0146-y
11. Hamer M, Stamatakis E. Metabolically healthy obesity and risk of all-cause and cardiovascular disease mortality. J Clin Endocrinol Metab. 2012;97(7):2482–2488. doi:10.1210/jc.2011-3475
12. Stefan N, Kantartzis K, Machann J, et al. Identification and characterization of metabolically benign obesity in humans. Obstet Gynecol Surv. 2009;64(1):30–31. doi:10.1097/01.ogx.0000340775.89112.ae
13. Kavaric N, Klisic A, Ninic A. Are visceral adiposity index and lipid accumulation product reliable indices for metabolic disturbances in patients with type 2 diabetes mellitus? J Clin Lab Anal. 2018;32(3):1–9. doi:10.1002/jcla.22283
14. Kahn HS. The “lipid accumulation product” performs better than the body mass index for recognizing cardiovascular risk: a population-based comparison. BMC Cardiovasc Disord. 2005;5:1–10. doi:10.1186/1471-2261-5-26
15. Shin KA, Kim YJ. Usefulness of surrogate markers of body fat distribution for predicting metabolic syndrome in middle-aged and older Korean populations. Diabetes Metab Syndr Obes Targets Ther. 2019;12:2251–2259. doi:10.2147/DMSO.S217628
16. Zhang Y, Hu J, Li Z, et al. A novel indicator of lipid accumulation product associated with metabolic syndrome in Chinese children and adolescents. Diabetes Metab Syndr Obes Targets Ther. 2019;12:2075–2083. doi:10.2147/DMSO.S221786
17. Amato MC, Giordano C, Galia M, et al. Visceral adiposity index: a reliable indicator of visceral fat function associated with cardiometabolic risk. Diabetes Care. 2010;33(4):920–922. doi:10.2337/dc09-1825
18. Du T, Yu X, Zhang J, Sun X. Lipid accumulation product and visceral adiposity index are effective markers for identifying the metabolically obese normal-weight phenotype. Acta Diabetol. 2015;52(5):855–863. doi:10.1007/s00592-015-0715-2
19. Ferreira FG, Juvanhol LL, Da Silva DCG, Longo GZ. Visceral adiposity index is a better predictor of unhealthy metabolic phenotype than traditional adiposity measures: results from a population-based study. Public Health Nutr. 2019;22(9):1545–1554. doi:10.1017/S136898001800335X
20. Lwow F, Jedrzejuk D, Milewicz A, Szmigiero L. Lipid accumulation product (LAP) as a criterion for the identification of the healthy obesity phenotype in postmenopausal women. Exp Gerontol. 2016;82:81–87. doi:10.1016/j.exger.2016.06.007
21. Falkner B, Daniels SR. Summary of the fourth report on the diagnosis, evaluation, and treatment of high blood pressure in children and adolescents. Hypertension. 2004;44(4):387–388. doi:10.1161/01.HYP.0000143545.54637.af
22. Li H, Zong XN, Ji CY, Mi J. Body mass index cut-offs for overweight and obesity in Chinese children and adolescents aged 2–18 years. Chin J Epidemi. 2010;31(6):616–620. doi:10.3760/cma.j.issn.0254-6450.2010.06.004
23. Cook S, Weitzman M, Auinger P, Nguyen M, Dietz WH. Prevalence of a metabolic syndrome phenotype in adolescents. Arch Pediatr Adolesc Med. 2003;157(8):821. doi:10.1001/archpedi.157.8.821
24. Ma GS, Ji CYE, Ma J, et al. Waist circumference reference values for screening cardiovascular risk factors in Chinese children and adolescents. Biomed Environ Sci. 2010;23(1):21–31. doi:10.1016/S0895-3988(10)60027-X
25. Fan H, Yan YK, Mi J. Updating blood pressure references for Chinese children aged 3–17 years. Chin J Hypertens. 2017;25(5):428–435. doi:10.16439/j.cnki.1673-7245.2017.05.009
26. Wang Y, Liu W, Sun L, et al. A novel indicator, childhood lipid accumulation product, is associated with hypertension in Chinese children and adolescents. Hypertens Res. 2020;43(4):305–312. doi:10.1038/s41440-019-0366-8
27. Al-Daghri NM, Al-Attas OS, Alokail M, et al. Does visceral adiposity index signify early metabolic risk in children and adolescents? Association with insulin resistance, adipokines, and subclinical inflammation. Pediatr Res. 2014;75(3):459–463. doi:10.1038/pr.2013.229
28. Yuan Y, Xie H, Sun L, et al. A novel indicator of children’s lipid accumulation product associated with impaired fasting glucose in Chinese children and adolescents. Diabetes Metab Syndr Obes Targets Ther. 2020;13:1653–1660. doi:10.2147/DMSO.S238224
29. Ching YK, Chin YS, Appukutty M, Gan WY, Chan YM. Comparisons of conventional and novel anthropometric obesity indices to predict metabolic syndrome among vegetarians in Malaysia. Sci Rep. 2020;10(1):1–13. doi:10.1038/s41598-020-78035-5
30. Dong H, Xu Y, Zhang X, Tian S. Visceral adiposity index is strongly associated with hyperuricemia independently of metabolic health and obesity phenotypes. Sci Rep. 2017;7(1):1–13. doi:10.1038/s41598-017-09455-z
31. Hosseinpanah F, Barzin M, Mirbolouk M, Abtahi H, Cheraghi L, Azizi F. Lipid accumulation product and incident cardiovascular events in a normal weight population: Tehran Lipid and Glucose Study. Eur J Prev Cardiol. 2016;23(2):187–193. doi:10.1177/2047487314558771
32. Zhang XH, Zhang M, He J, et al. Comparison of anthropometric and atherogenic indices as screening tools of metabolic syndrome in the Kazakh adult population in Xinjiang. Int J Environ Res Public Health. 2016;13(4). doi:10.3390/ijerph13040428
33. Liu L, Liu Y, Sun X, et al. Identification of an obesity index for predicting metabolic syndrome by gender: the rural Chinese cohort study. BMC Endocr Disord. 2018;18(1):1–8. doi:10.1186/s12902-018-0281-z
34. Wang C, Fu W, Cao S, et al. Association of adiposity indicators with hypertension among Chinese adults. Nutr Metab Cardiovasc Dis. 2021;31(5):1391–1400. doi:10.1016/j.numecd.2021.01.001
35. Kim JK, Zisman A, Fillmore JJ, et al. Glucose toxicity and the development of diabetes in mice with muscle-specific inactivation of glut4. J Clin Invest. 2001;108(1):153–160. doi:10.1172/JCI10294
36. Petersen KF, Dufour S, Savage DB, et al. The role of skeletal muscle insulin resistance in the pathogenesis of the metabolic syndrome. Proc Natl Acad Sci U S A. 2007;104(31):12587–12594. doi:10.1073/pnas.0705408104
37. Petersen KF, Oral EA, Dufour S, et al. Leptin reverses insulin resistance and hepatic steatosis in patients with severe lipodystrophy. J Clin Invest. 2002;109(10):1345–1350. doi:10.1172/JCI0215001
38. Dresner A, Laurent D, Marcucci M, et al. Effects of free fatty acids on glucose transport and IRS-1-associated phosphatidylinositol 3-kinase activity. J Clin Invest. 1999;103(2):253–259. doi:10.1172/JCI5001
39. Fox CS, Massaro JM, Hoffmann U, et al. Abdominal visceral and subcutaneous adipose tissue compartments: association with metabolic risk factors in the Framingham heart study. Circulation. 2007;116(1):39–48. doi:10.1161/CIRCULATIONAHA.106.675355
 © 2021 The Author(s). This work is published and licensed by Dove Medical Press Limited. The full terms of this license are available at https://www.dovepress.com/terms.php and incorporate the Creative Commons Attribution - Non Commercial (unported, v3.0) License.
By accessing the work you hereby accept the Terms. Non-commercial uses of the work are permitted without any further permission from Dove Medical Press Limited, provided the work is properly attributed. For permission for commercial use of this work, please see paragraphs 4.2 and 5 of our Terms.
© 2021 The Author(s). This work is published and licensed by Dove Medical Press Limited. The full terms of this license are available at https://www.dovepress.com/terms.php and incorporate the Creative Commons Attribution - Non Commercial (unported, v3.0) License.
By accessing the work you hereby accept the Terms. Non-commercial uses of the work are permitted without any further permission from Dove Medical Press Limited, provided the work is properly attributed. For permission for commercial use of this work, please see paragraphs 4.2 and 5 of our Terms.